Article

Enhanced Detection Precision of the Taiji Program by Frequency Setting Strategy Based on a Hierarchical Optimization Algorithm

1
Key Laboratory of Electronics and Information Technology for Space System, National Space Science Center, Chinese Academy of Sciences, Beijing 100190, China
2
University of Chinese Academy of Sciences, Beijing 100049, China
3
Institute of Engineering Thermophysics, Chinese Academy of Sciences, Beijing 100190, China
4
School of Fundamental Physics and Mathematical Sciences, Hangzhou Institute for Advanced Study, UCAS, Hangzhou 310024, China
5
Taiji Laboratory for Gravitational Wave Universe, Hangzhou 310024, China
6
Key Laboratory of Gravitational Wave Precision Measurement of Zhejiang Province, Hangzhou 310024, China
*
Author to whom correspondence should be addressed.
Sensors 2023, 23(23), 9431; https://doi.org/10.3390/s23239431
Submission received: 12 October 2023 / Revised: 20 November 2023 / Accepted: 22 November 2023 / Published: 27 November 2023
(This article belongs to the Special Issue Recent Advance of Optical Measurement Based on Sensors)

Abstract

:
For space-based gravitational wave detection, a laser interferometric measurement system composed of a three-spacecraft formation offers the most rewarding bandwidth of astrophysical sources. There are no oscillators available that are stable enough so that each spacecraft could use its own reference frequency. The conversion between reference frequencies and their distribution between all spacecrafts for the synchronization of the different metrology systems is the job of the inter-spacecraft frequency setting strategy, which is important for continuously acquiring scientific data and suppressing measurement noise. We propose a hierarchical optimization algorithm to solve the frequency setting strategy. The optimization objectives are minimum total readout displacement noise and maximum beat-note frequency feasible range. Multiple feasible parameter combinations were obtained for the Taiji program. These optimized parameters include lower and upper bounds of the beat note, sampling frequency, pilot tone signal frequency, ultrastable clock frequencies, and modulation depth. Among the 20 Pareto optimal solutions, the minimum total readout displacement noise was 4.12 pm / Hz , and the maximum feasible beat-note frequency range was 23 MHz. By adjusting the upper bound of beat-note frequency and laser power transmitted by the telescope, we explored the effects of these parameters on the minimum total readout displacement noise and optimal local laser power in greater depth. Our results may serve as a reference for the optimal design of laser interferometry system instrument parameters and may ultimately improve the detection performance and continuous detection time of the Taiji program.

1. Introduction

In 2016, the Laser Interferometer Gravitational-Wave Observatory (LIGO) [1] successfully detected gravitational wave phenomena that proved the existence of gravitational waves. Space-based gravitational wave detection missions have been proposed and performed in recent years because of the surface vibrations of the Earth, the noise of the gravitational gradient, and limitations of the ground test baseline length [2]. These missions include the Laser Interferometer Space Antenna (LISA) mission [3,4] and the Taiji [5,6,7] and Tianqin programs [8]. Space-based gravitational-wave detection usually uses the laser interferometry principle [9] and employs a three-spacecraft constellation placed in an equilateral triangle [3,4,5,6,8]; many functions are achieved by laser beams exchanged between the spacecrafts (S/Cs), such as scientific interferometry, absolute inter-spacecraft distance measurements, digital data communication, and clock-noise transfer [10,11,12].
In a three-spacecraft constellation, the laser on one S/C interferes with the laser received from another S/C. The beat-note signal of two laser is digitized by an analog-to-digital converter (ADC) and analyzed by a high-precision phasemeter (PM). Both the ADC and the PM are triggered by an ultrastable oscillator (USO) that provides a time reference. The frequency instability of the trigger signal introduces additional ranging noise, affecting the arm length measurements. Additionally, the inherent jitter of the ADC distorts the sampling process. A pilot tone (i.e., a stable sinusoidal reference signal derived from the USO) has been inserted to correct the clock and ADC noise [6,13,14]. Considering the differential jitter and relative drift of three onboard USOs on different S/Cs, a clock-tone transfer chain has been proposed via an electro-optic modulator (EOM) to modulate the USO signal to sidebands on the outgoing beam to remove clock noise and correct the relative clock drift by using postprocessing [10,11,12]. To realize the functions listed above, the frequencies of the USO, sideband, pilot tone, ADC sampling, and beat note must be comprehensively considered and optimized. Moreover, total laser power is a limited resource used to ensure the effectiveness of scientific signal interference, and the readout displacement noise of the signal is affected by the power ratio of the sideband and carrier. The power ratio needs to be reasonably designed to minimize readout displacement noise.
Different frequency-setting schemes have been established for the LISA mission to address different concerns. For example, Kullmann [15] conducted a detailed, in-depth device experiment for the setting of the ADC sampling and pilot-tone frequencies involved in the LISA mission. They concluded that when the pilot-tone frequency was 72 MHz and the ADC sampling frequency was 50 MHz, sampling the beat-note frequency from 2 to 20 MHz could meet the noise requirements of this component of LISA. Barke [13] designed an inter-satellite frequency distribution scheme for the LISA program for beat-note frequencies in the range of [7 MHz, 23 MHz]; the ADC sampling and pilot-tone frequencies were 80 and 75 MHz, respectively. Zhang [16] analyzed the Taiji mission orbit and a possible phase-locking scheme and developed an offset frequency-setting scheme for beat-note frequencies in the range of [5 MHz, 25 MHz]. Although all these schemes have considered the problem of frequency setting in space-based gravitational-wave detection missions from different perspectives, they have not provided complete constraints or optimal setting schemes that include the beat-note frequency range as well as the frequencies of USO, ADC sampling, pilot tone, and sideband, and none of them consider the coupling relationship between frequency parameters. The unified consideration of these factors avoids the one-sidedness of individual parameter settings and reduces unnecessary redundancy between parameters, further improving the detection capability.
In this study, a frequency distribution scheme using a hierarchical optimization algorithm is introduced for the Taiji program by considering the frequency bands or frequencies for each function or device to ensure an accurate readout of the inter-spacecraft heterodyne signal, synchronize the onboard clock with those on other S/Cs, and generate an ADC sampling frequency and pilot tone signal.
The remainder of this paper is organized as follows. Section 2 introduces frequency factors and constraints, such as sideband frequency, ADC sampling, and pilot-tone frequencies. The optimization algorithm is introduced in Section 3. Section 4 describes the solution for the frequency setting scheme for each function or device. The effects of key parameters and total readout displacement noise are also analyzed. Finally, Section 5 concludes this study.

2. Frequency Factors and Constraints

In space-borne, gravitational-wave detection missions, laser links need to accomplish ultralong-range laser interference and various auxiliary functions, such as clock-noise transfer, pseudorandom noise (PRN) ranging, and information transfer [10,17]. The Doppler shift affects the beat-note signal generated by heterodyne interference; therefore, offset frequencies need to be added to the phase-locking process to make them fall into a reasonable range. The signal is sampled and analyzed by the ADC and PM and triggered by the USO onboard. The USO signal is first multiplied to the GHz level and imprinted on the sidebands of the outgoing laser beam by EOM to perform inter-spacecraft clock transfer. Setting the sideband frequency and power ratio will affect the size of the readout displacement noise. The USO is then multiplied to the MHz level to provide the internal clock signal for the ADC and PM operations and construct the pilot tone to eliminate ADC sampling jitter and clock noise. In this process, some parameters have complex mutual constraints and need to be optimized systematically.

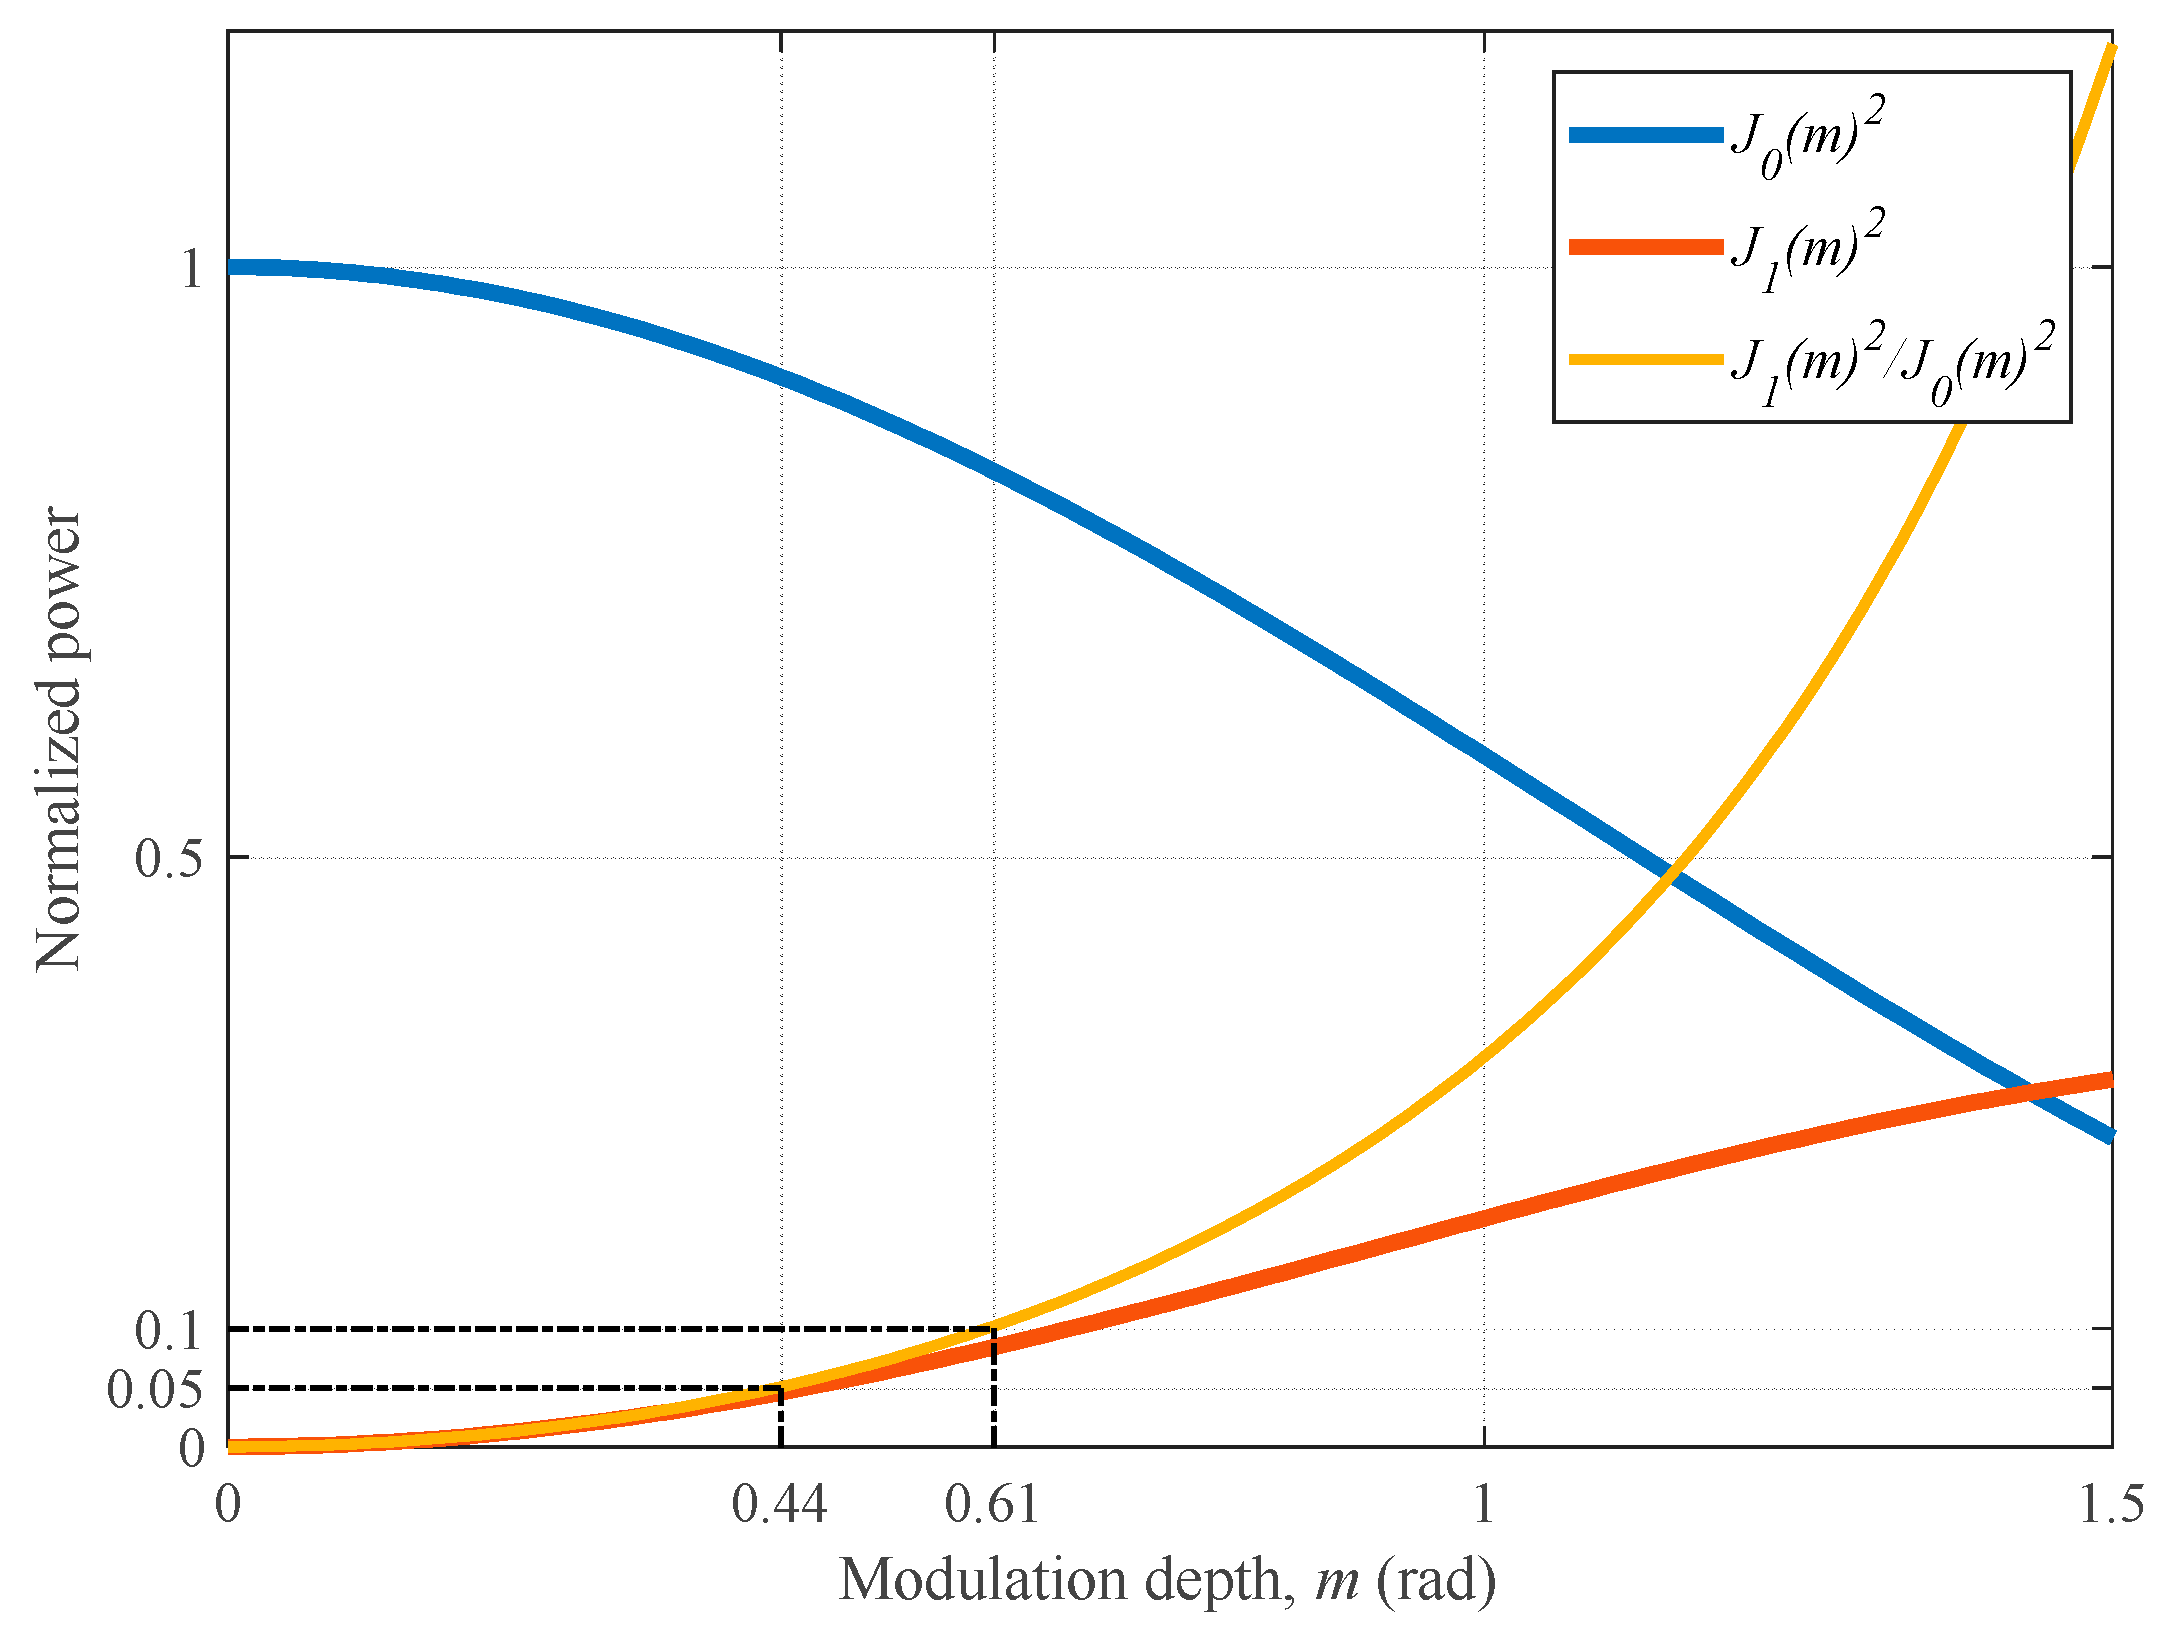
2.1. Readout Displacement Noise and Sideband Frequency Constraints

The Taiji program requires that the total readout displacement noise be as small as possible, which includes carrier and first-order sideband readout displacement noise. Moreover, based on the experience of the LISA mission [13,14,18], the first-order sideband readout displacement noise cannot be higher than 1/10 of the total readout displacement noise. The power ratio between the first-order sidebands and carrier could be expressed by the ratio of the squares of first- and zero-orders of the Bessel functions of the first kind:
P sideband P carrier = J 1 ( m ) 2 J 0 ( m ) 2 ,
where J0(m) and J1(m) denote the zero- and first-orders of the Bessel functions of the first kind, respectively, and m is the modulation depth. Research on the LISA mission [14,18] indicates that this power ratio should be in the range of 5% to 10%, and that the corresponding modulation depth m is in the range of [0.44, 0.61], as shown in Figure 1.
Therefore, the optimization objective and constraints are
M i n ( δ x total ) { δ x sideband < 1 10 δ x total 0.44 < m < 0.61 ,
where δ x sideband and δ x total indicate the sideband and total readout displacement noise, respectively. The expressions of the readout displacement noise of the carrier and first-order sideband and the total readout displacement noise are [13]
{ δ x carrier = λ 2 π 1 J 0 ( m ) 2 δ ϕ total δ x sideband = 1 2 λ 2 π f het f USO 1 J 1 ( m ) 2 δ ϕ total δ x total = δ x sideband + δ x carrier ,
respectively, where λ is the laser wavelength, which is 1064 nm in the Taiji program; fhet is the beat-note frequency; and fUSO is the USO frequency. Given that two identical sidebands are generated on the left- and right-hand sides of the carrier after modulation by EOM, a factor of 1 / 2 must be added to the calculation of the sideband frequency noise. δ ϕ total is the total readout phase noise and contains three components, which is shown as follows [13,19]:
{ δ ϕ total = δ ϕ SN 2 + δ ϕ RIN 2 + δ ϕ EN 2 δ ϕ SN = 2 e ( P local + P receive ) R pd ε het P local P receive δ ϕ RIN = RIN P local 2 + P receive 2 2 ε het P local P receive δ ϕ EN = 2 N pd R pd δ I pd 2 + 2 π C pd f upper δ U pd ε het P local P receive ,
where δ ϕ SN , δ ϕ RIN , and δ ϕ EN are the shot, RIN, and electronic noise, respectively; and Plocal and Preceive represent the local laser power and laser power received by the telescope, respectively. Preceive [12] is calculated as
P receive = 0.4073 × π 2 D 4 P tel ε opt 8 L 2 λ 2 .
For the Taiji program, the explanation and values of other parameters in Equations (4) and (5) are listed in Table 1.
In Equation (3), δ x sideband is positively correlated with f het and negatively correlated with f USO . Because the beat-note frequency signal f het varies with time, δ x sideband is usually calculated by replacing fhet with fupper. From Equations (3) and (4), the total readout displacement noise may be minimized by reasonably setting fupper, fUSO, m, Preceive, and Plocal.

2.2. Constraints of the ADC Sampling and Pilot-Tone Frequencies with the Beat-Note Frequency

According to Nyquist’s theorem, the sampling frequency of the ADC needs to be greater than at least two times the beat-note frequency. That is,
f ADC > 2 f upper .
The USO is used to control the ADC sampling frequency and construct the pilot-tone signal; the divider or synthesizer can realize this process. According to Heinzel [10], the noise introduced by the dividers is much smaller than that introduced by the synthesizers, and, therefore, the frequency division approach is typically used. In the actual application process, integer frequency division is usually chosen.
The aliasing signal generated by the ADC sampling of the pilot-tone signal interferes with the beat-note frequency measurement. For example, when the sampling frequency of the ADC is 82 MHz and the frequency of the pilot-tone signal is 80 MHz, the frequency of the aliased signal generated by the ADC in the under-sampled pilot-tone signal will be 2 MHz. Therefore, the frequency of the aliased signal must not overlap the beat-note frequency range. This constraint can be expressed by the following equation:
| f ADC f PT | < f lower .
Therefore, setting the pilot-tone signal frequency fPT and ADC sampling frequency fADC imposes the following constraints:
{ n 1 f ADC = f USO n 2 f PT = f USO f ADC > 2 f upper | f ADC f PT | < f lower f USO < 5   GHz f PT < 98   MHz           n 1 , n 2   a r e   i n t e g e r s ,
where the value of 5 GHz is the artificial upper bound set for fUSO to constrain it to finite values. Based on Kullmann’s [15] study, the upper bound of fPT is set to 98 MHz to avoid poor performance of the pilot tone correction.

3. Hierarchical Optimization Algorithm

In this section, the optimization model is introduced in Section 3.1, and then the hierarchical optimization algorithm for this optimization model is introduced in Section 3.2.

3.1. Optimization Model

According to the analysis in Section 2, the frequency of the mission operation involves four terms: the beat-note fhet, the USO fUSO, the pilot-tone signal fPT, and the ADC sampling fADC frequencies. The variable fhet is affected by the Doppler shift and changes dynamically over time, while the remaining three terms remain unchanged. The variation range of the inter-satellite beat-note frequency fhet is determined by the lower and upper bounds of the beat-note frequency, namely flower, and fupper. Therefore, the optimization goal is to make the sideband readout displacement noise meet the mission requirement, minimize the total readout displacement noise, and maximize the feasible range of beat-note frequency by reasonably allocating the values of each frequency or frequency band, and modulation depth m, respectively. The optimization model is as follows:
Γ 1 ( f upper , f USO , f PT , f ADC , m , P local ) = min ( δ x total ) Γ 2 ( f upper , f lower )                                                             = max ( f upper f lower ) s . t . { δ x sideband < 1 10 δ x total n 1 f ADC = f USO n 2 f PT = f USO f ADC > 2 f upper | f ADC f PT | < f lower f lower > = 2   MHz f upper < = 25   MHz f USO < 5   GHz f PT < 98   MHz 0.44 < m < 0.61           n 1 , n 2   a r e   i n t e g e r s ,
where Γ 1 and Γ 2 represent the two objective functions.

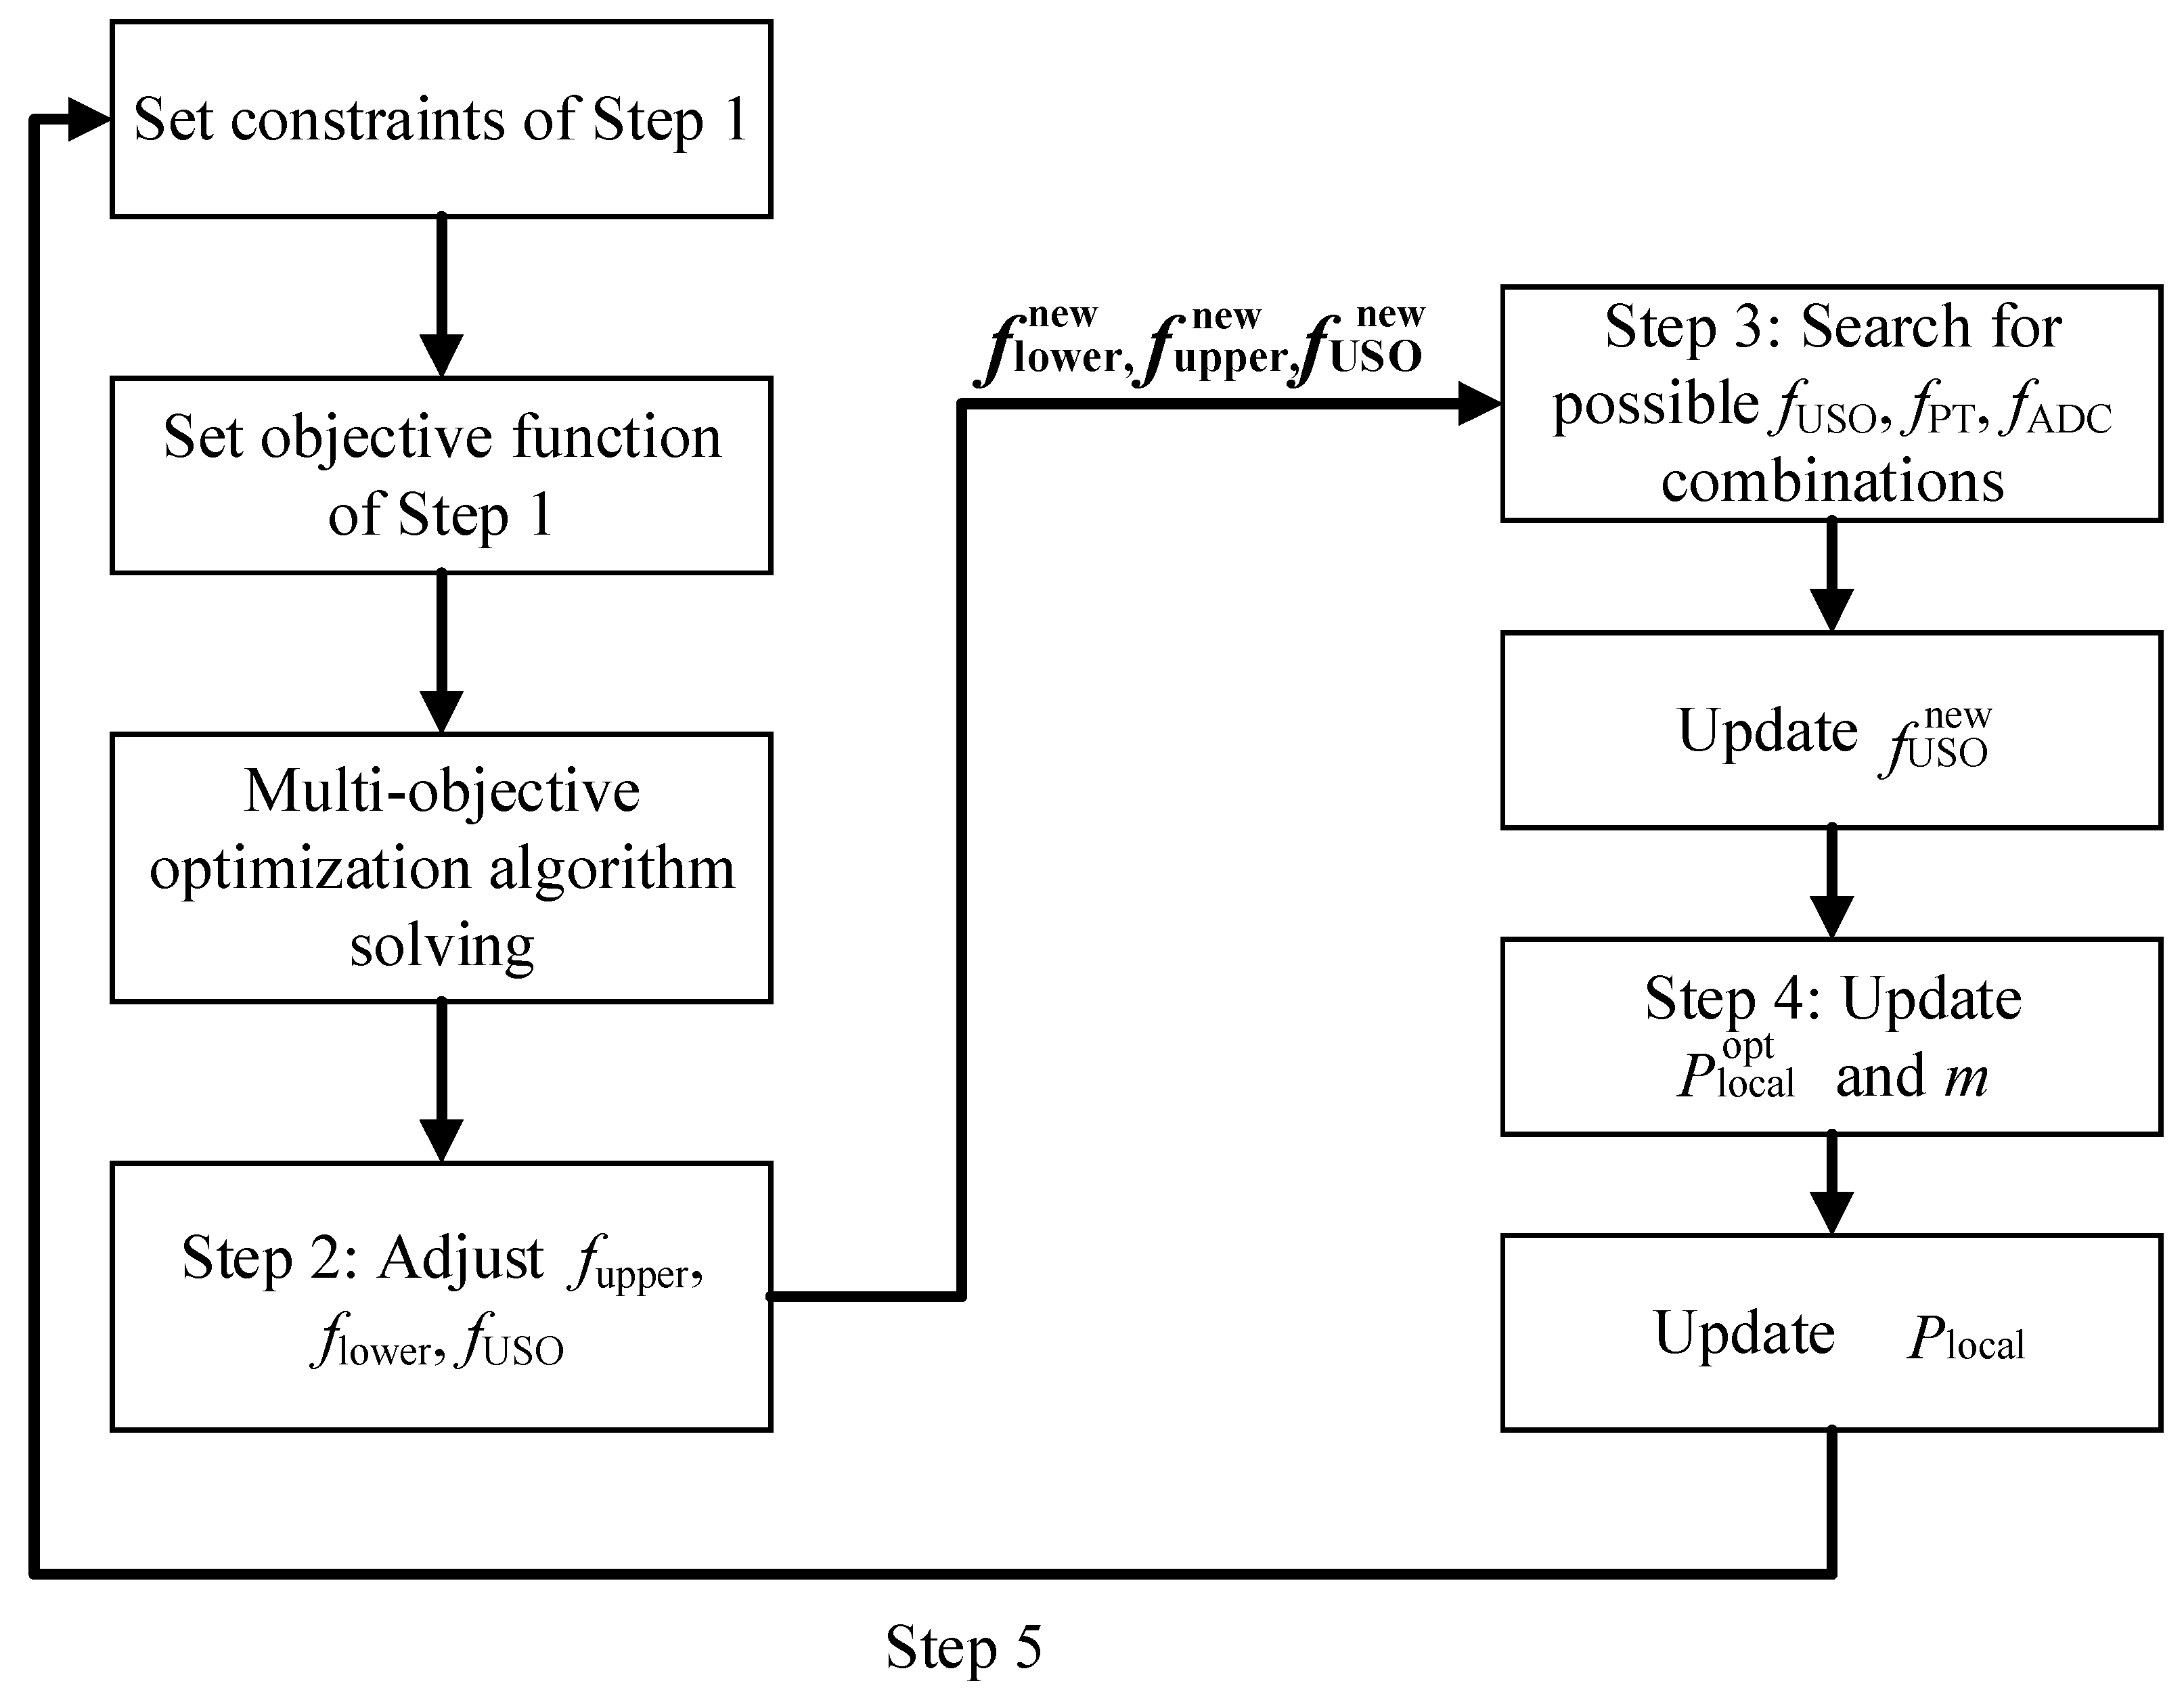
3.2. Optimization Process

Owing to the multiple objectives and parameters involved in the optimization solution, a hierarchical optimization approach is used for this optimization model based on computational efficiency considerations when selecting fUSO, fPT, fADC, fupper, flower, and m. The optimization process is as follows.
Step 1: A multi-objective optimization algorithm is used to set the lower and upper bounds of the beat-note frequency (flower, fupper), USO frequency fUSO, and sideband modulation depth m. The multi-objective optimization model for this step is expressed by Equation (10).
{ Γ 1 ( f upper , f USO , f PT ¯ , f ADC ¯ , m , P local ¯ ) = min ( δ x total ) Γ 2 ( f lower )                                                                                 = max ( f lower ) Γ 3 ( f upper )                                                                               = min ( f upper ) Γ 4 ( f upper , f lower )                                                           = max ( f upper f lower ) s . t . { 0.44 < m < 0.61 f USO < 5   GHz 2   MHz < f lower < 10   MHz 20   MHz < f upper < = 25   MHz .
In Equation (10), Γ x denotes the x-th optimization objective. In Γ 1 , where f PT ¯ , f ADC ¯ and P local ¯ denote that the variables are taken as constant. Γ 2 and Γ 3 in Equation (10) are the two objective functions derived from Γ 1 in Equation (9) according to Equations (3) and (8), respectively. Γ 2 aims to expand the selection spaces of fADC and fPT, and Γ 3 aims to reduce the sideband readout displacement noise, which is proportional to fupper. The objective function Γ 4 aims to maximize the feasible range of the beat-note frequency, which is the opposite of Γ 2 and Γ 3 . In actual mission operations, fupper, flower, and fUSO are commonly set as integers. To reduce the complexity of the optimization problem while determining the solution, fupper, flower, and fUSO are not constrained as integers in this step.
In the current Taiji program, the upper bound of the beat-note frequency is 25 MHz. Using the parameter values listed in Table 1, Preceive = 2.154 × 10⁻⁹ W. Therefore, the values of all parameters in Equation (4), except Plocal, are obtained. Because Plocal appears in both the numerator and denominator, the optimal value of Plocal, which is 2.06 × 10⁻³ W in the current parameter settings, can be derived by simply minimizing. When calculating δ x total in this step, the values of Plocal = 2.06 × 10⁻³ W and the parameters in Table 1 are used by default.
Step 2: The values of flower, fupper, and fUSO obtained in Step 1 are adjusted to be integers:
{ f lower new = floor ( f lower ) f upper new = floor ( f upper ) f USO new = floor ( f USO ) ,
where f lower new , f upper new , and f USO new represent the adjusted values of flower, fupper, and fUSO, respectively.
Step 3: Exhaustive enumeration is used to search for possible [ f USO , f PT , f ADC ] combinations. The values of fPT and fADC need to satisfy the following constraints:
{ f ADC > = 2 f upper new 1 < | f ADC f PT | < f lower new .
Suppose there are n possible combinations stored in the following matrix:
[ f USO 1 , f PT 1 , f ADC 1 f USO 2 , f PT 2 , f ADC 2 f USO n , f PT n , f ADC n ]
The combination such that f USO j , j = 1 , 2 , , n is closest to f USO new is chosen. If f USO m is closest to f USO new , then f USO new = f USO m is updated. To distinguish this value from f USO new obtained in Step 2, the updated f USO new obtained in this step is referred to as f USO opt .
Step 4: Plocal is updated according to f upper new , and then the modulation depth m is updated according to [ f upper new , f USO opt ] from Steps 2 and 4. The updating method is as follows:
min ( δ ϕ SN 2 + δ ϕ RIN 2 + δ ϕ EN 2 ) { f upper = f upper new P receive = 2.154 × 10 9   W min ( δ x total ( f USO opt , f upper new , m ) ) { δ x total ( f USO opt , f upper new , m ) = δ x total ( f upper new f USO opt 1 J 1 ( m ) 2 + 1 J 0 ( m ) 2 ) m [ 0.44 , 0.61 ] .
The minimum value of the total readout displacement noise after updating [ f upper new , f USO opt ] is obtained by adjusting the parameter m in the range [0.44, 0.61].
Step 5: Backtracking mechanism. Since the default Plocal value is obtained by assuming fupper = 25 MHz, it may change after completing Steps 1–4. Therefore, if Plocal changed, then update Plocal and return to Step 1 until no new Plocal appears.
The flowchart of the algorithm as shown in Figure 2.

4. Results and Discussion

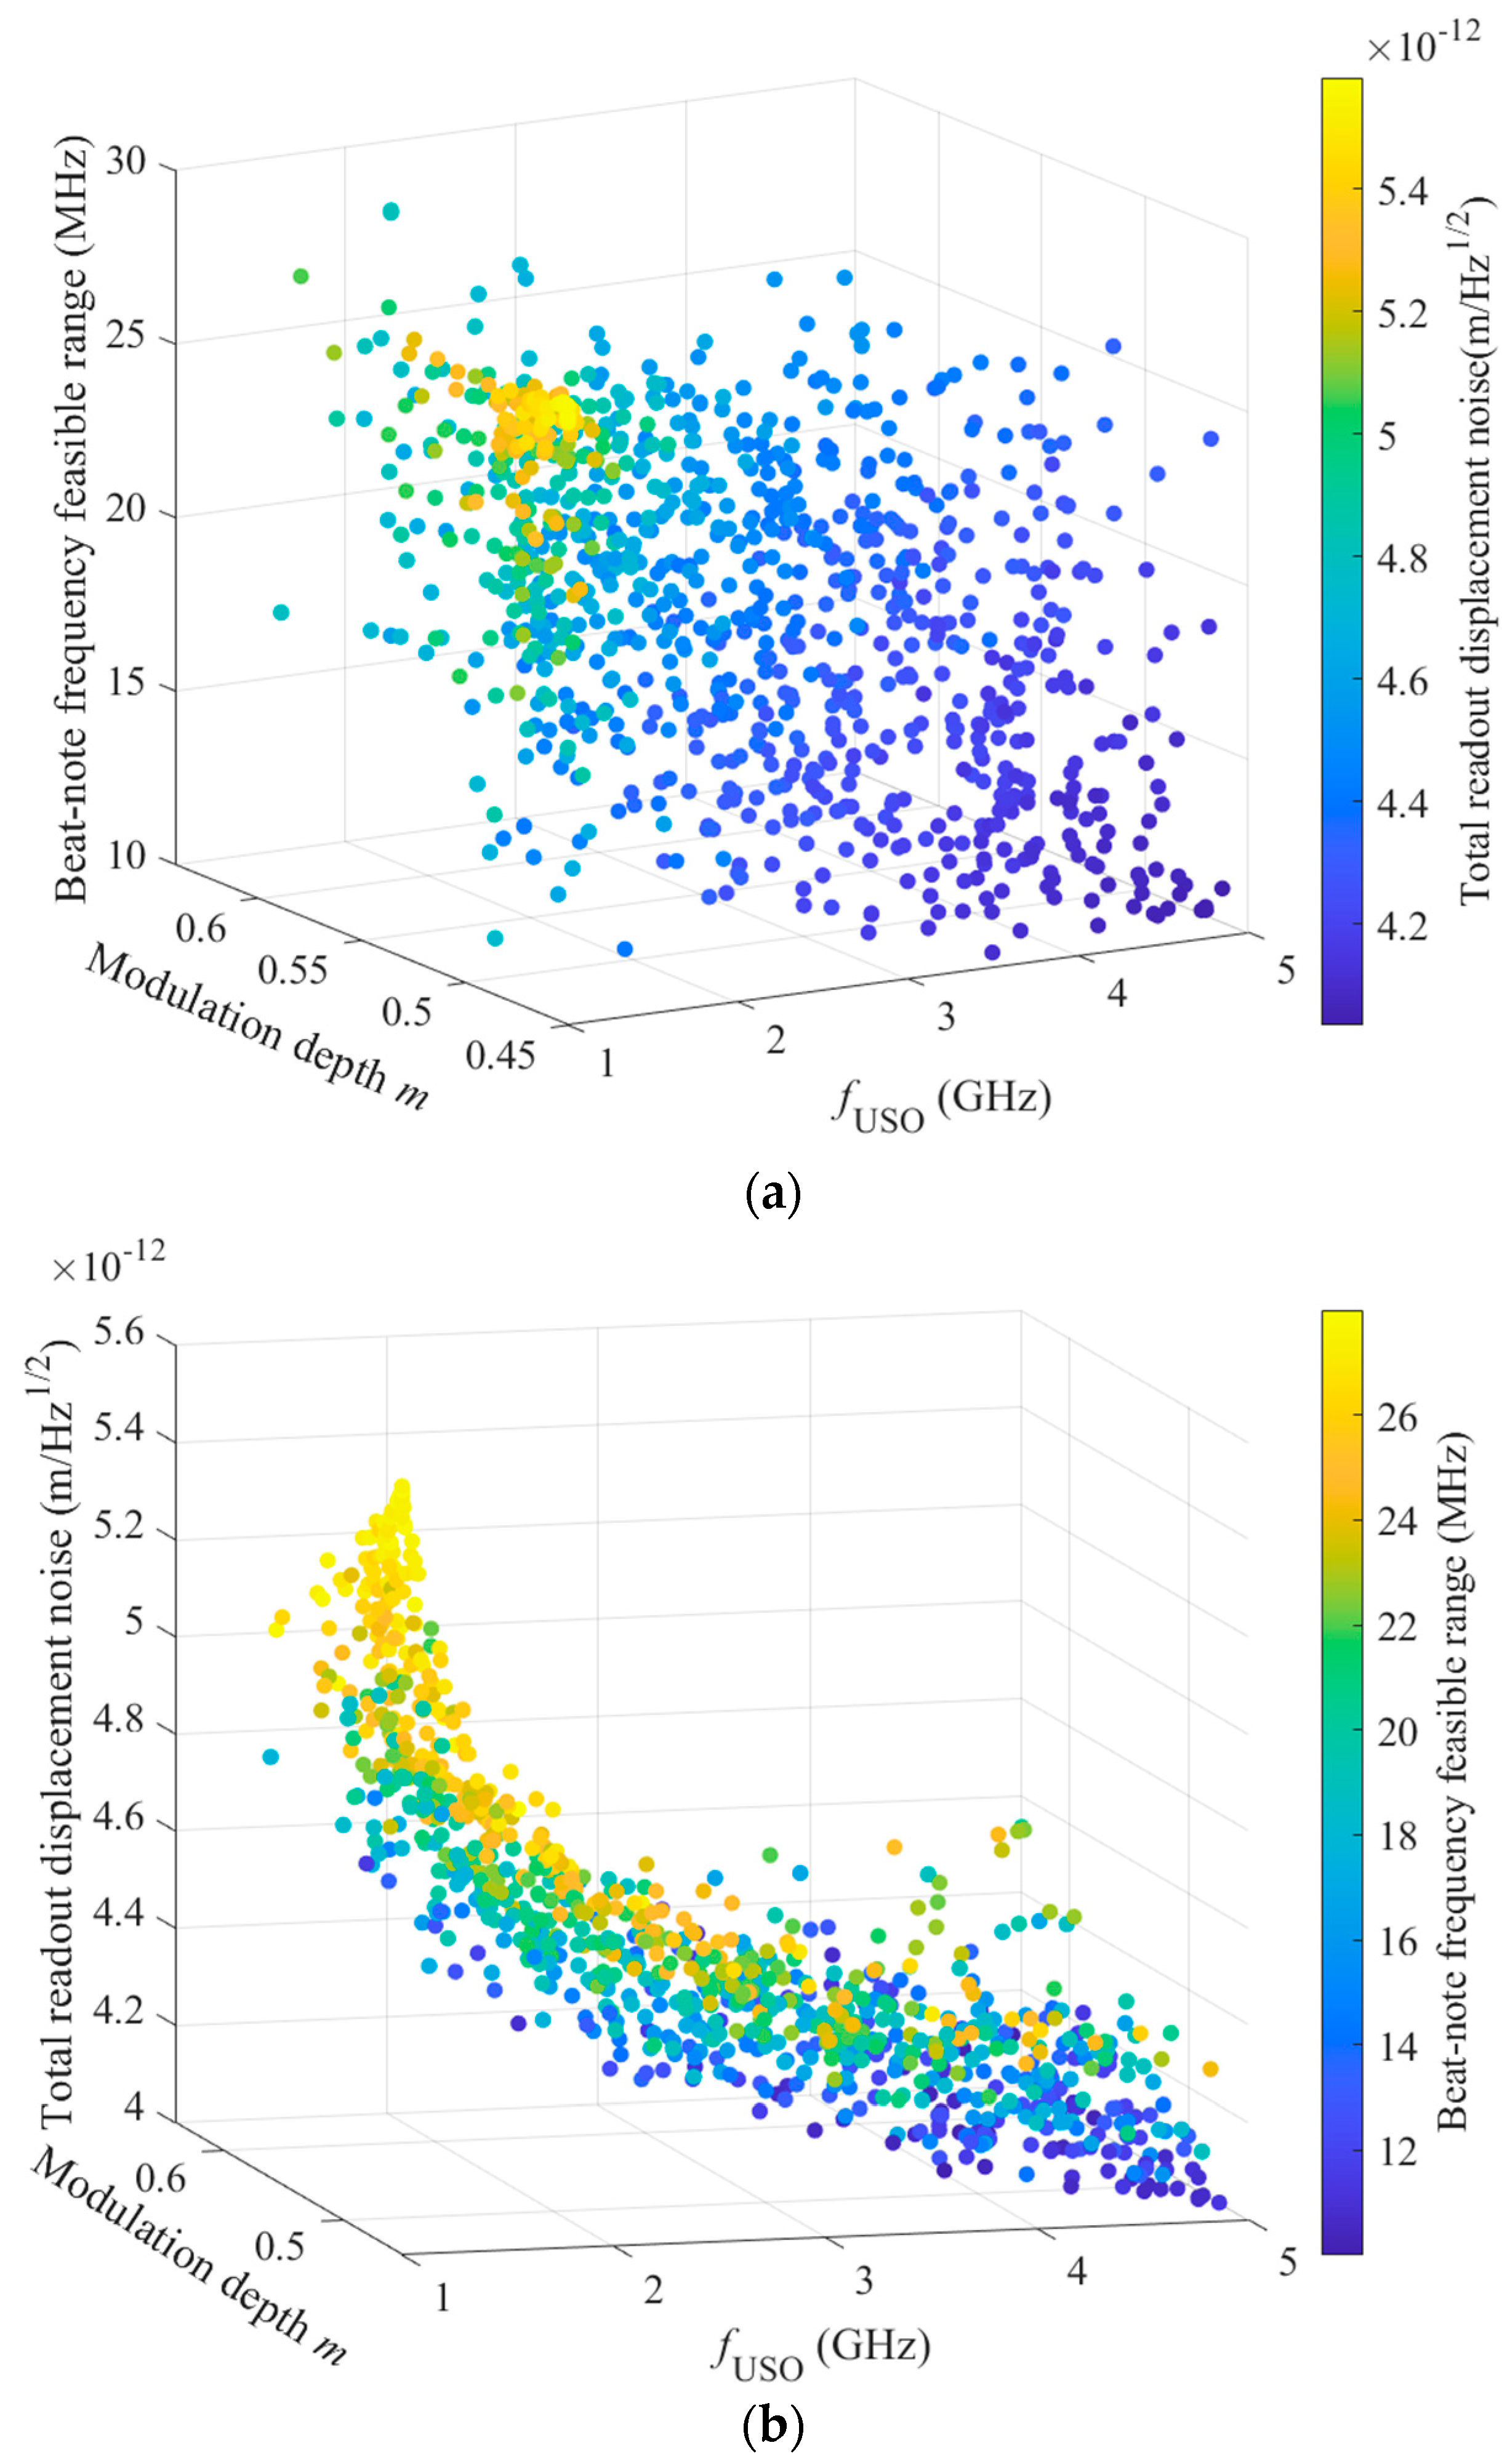
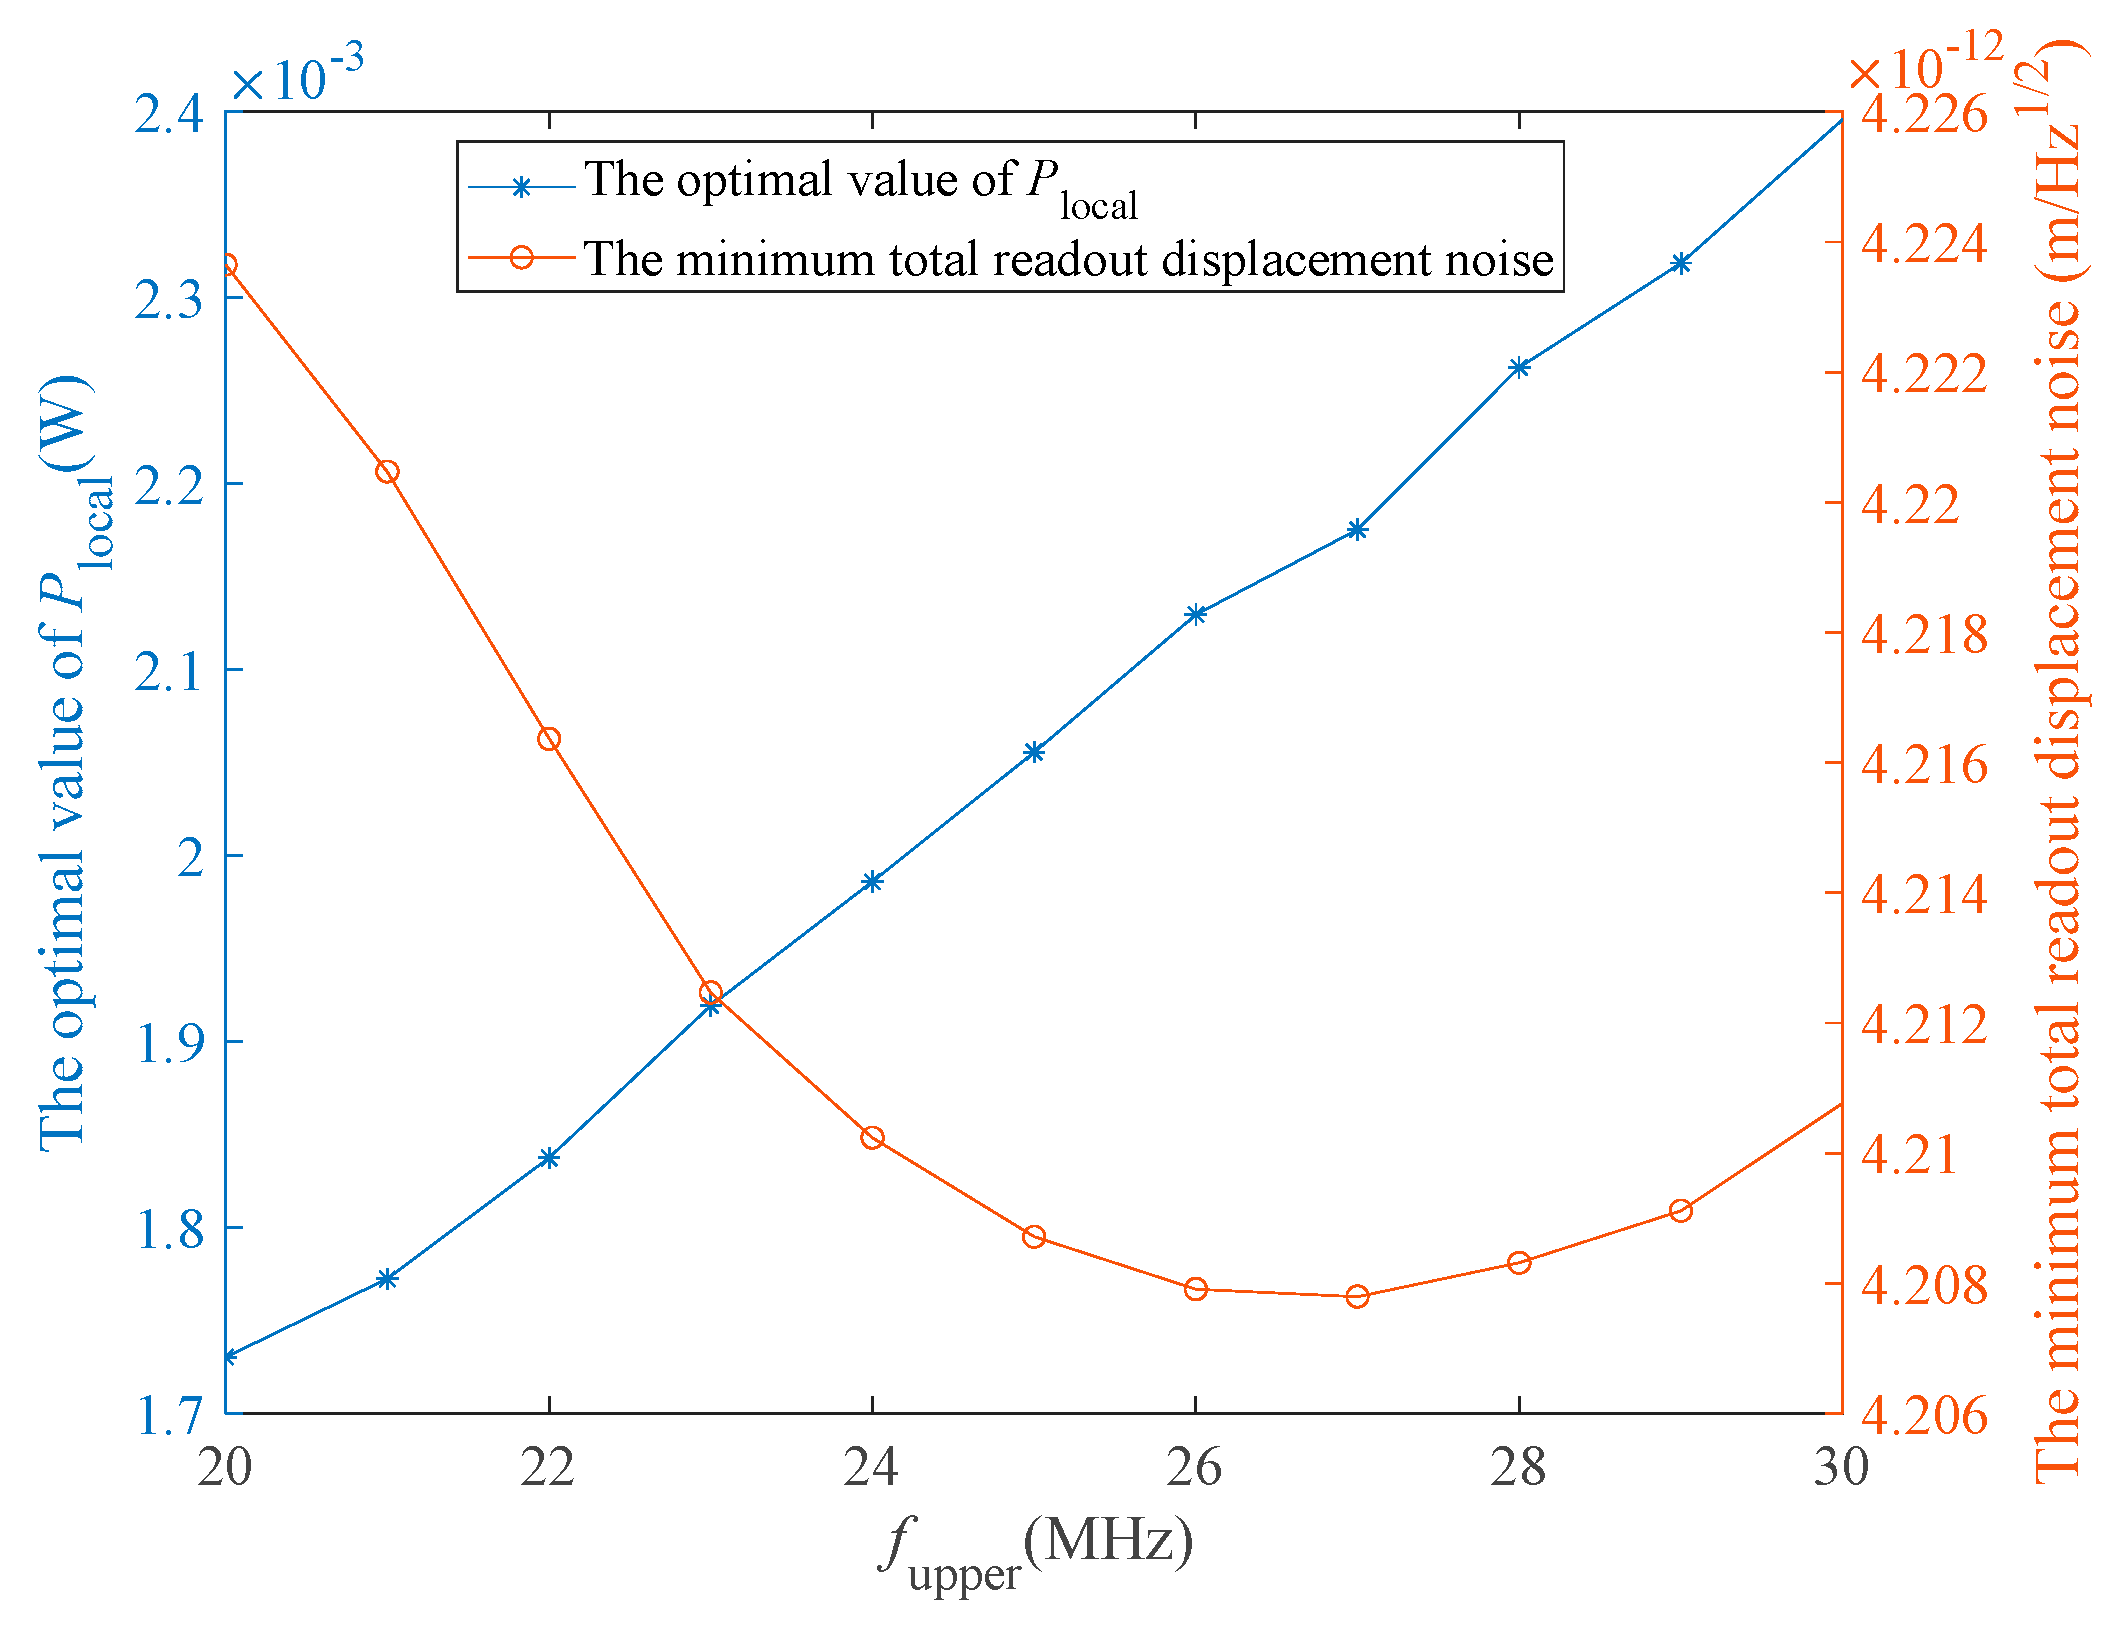
4.1. Optimization Results

The mathematical model presented in Section 3 was solved using an AMD Ryzen 9 3900X 12-core processor. The time consumption of each step is listed in Table 2. To reduce the complexity associated with the solution of multi-objective problems and improve the convergence efficiency of the solution set, we used one of the most popular multi-objective optimization algorithms: the nondominated sorting genetic algorithm II (NSGA-II) [24].
As a characteristic of multi-objective optimization algorithms, an optimal solution set is usually obtained instead of a single optimal solution to balance the degree of optimization of each objective.
The Pareto-optimal solution plane obtained in Step 1 of Section 3.2 is shown in Figure 3.
During the operation of a mission, a smaller total readout displacement noise δ x total indicates a better detection of signals, and a larger feasible range of the beat-note frequency, which exists between fupper and flower, indicates a better offset frequency setting. In Figure 3a, the warmer the color of the scatter plot, the higher the value of δ x total . Hence, the smaller the value of the beat-note frequency range, the smaller the value of the modulation depth; a larger value of fUSO corresponds to a smaller value of δ x total . In Figure 3b, a warmer scatter color indicates a larger beat-note frequency interval; a larger beat-note frequency range corresponds to a larger δ x total value. Based on Figure 3, we can conclude that the value of the beat-note frequency range is inversely related to the magnitude of δ x total . The two targets need to be reasonably balanced via optimization to increase the maximum feasible range of the beat-note frequency and decrease δ x total .
This planning problem was solved based on the optimization algorithm introduced in Section 3.2. The results of the 20 Pareto-optimal (feasible) solutions obtained from the final solution are listed in Table 3. The units of flower, fupper, fADC, fPT, and fUSO are MHz, and the total readout displacement noise δ x total has units of pm / Hz . It is worth noting that these are the optimal 20 solutions by balancing the two optimization objectives.
The results in Table 3 show that, after utilizing the proposed algorithm, the maximum beat-note frequency feasible range is 23 MHz and yields a total readout displacement noise of 4.21 pm / Hz , which corresponds to the parameter combination (flower, fupper, fADC, fPT, fUSO, m) = (3 MHz, 25 MHz, 92 MHz, 90 MHz, 4140 MHz, 0.44). Additionally, the smallest total readout displacement noise was 4.12 pm / Hz , which corresponds to (flower, fupper, fADC, fPT, fUSO, m) = (3 MHz, 23 MHz, 96 MHz, 94 MHz, 4512 MHz, 0.44). From Equation (4), different fupper values correspond to different optimal Plocal values. Therefore, when fupper = 23 MHz, Plocal = 1.92 mW, and fupper = 24 MHz, we obtain Plocal = 1.99 mW, fupper = 25 MHz, and Plocal = 2.06 mW.
According to Taiji mission budget, the position noise is 8 pm / Hz [6], which includes laser frequency noise, readout displacement noise, laser pointing noise, tilt-to-length noise, and so on. Among them, the frequency stability is 30 Hz / Hz , the limit of is laser-pointing noise and tile-to-length noise is 1 pm / Hz [25], and the readout displacement noise is about 7.5 pm / Hz [26]. After parameter optimization, the total readout displacement noise is reduced to 4.12 pm / Hz . The sensitivity curve of Taiji program detection limit and after optimization with other noise budgets the same, is shown Figure 4. It can be seen from the figure that the optimized parameters have improved the sensitivity in the range of 10 mHz–1 Hz.

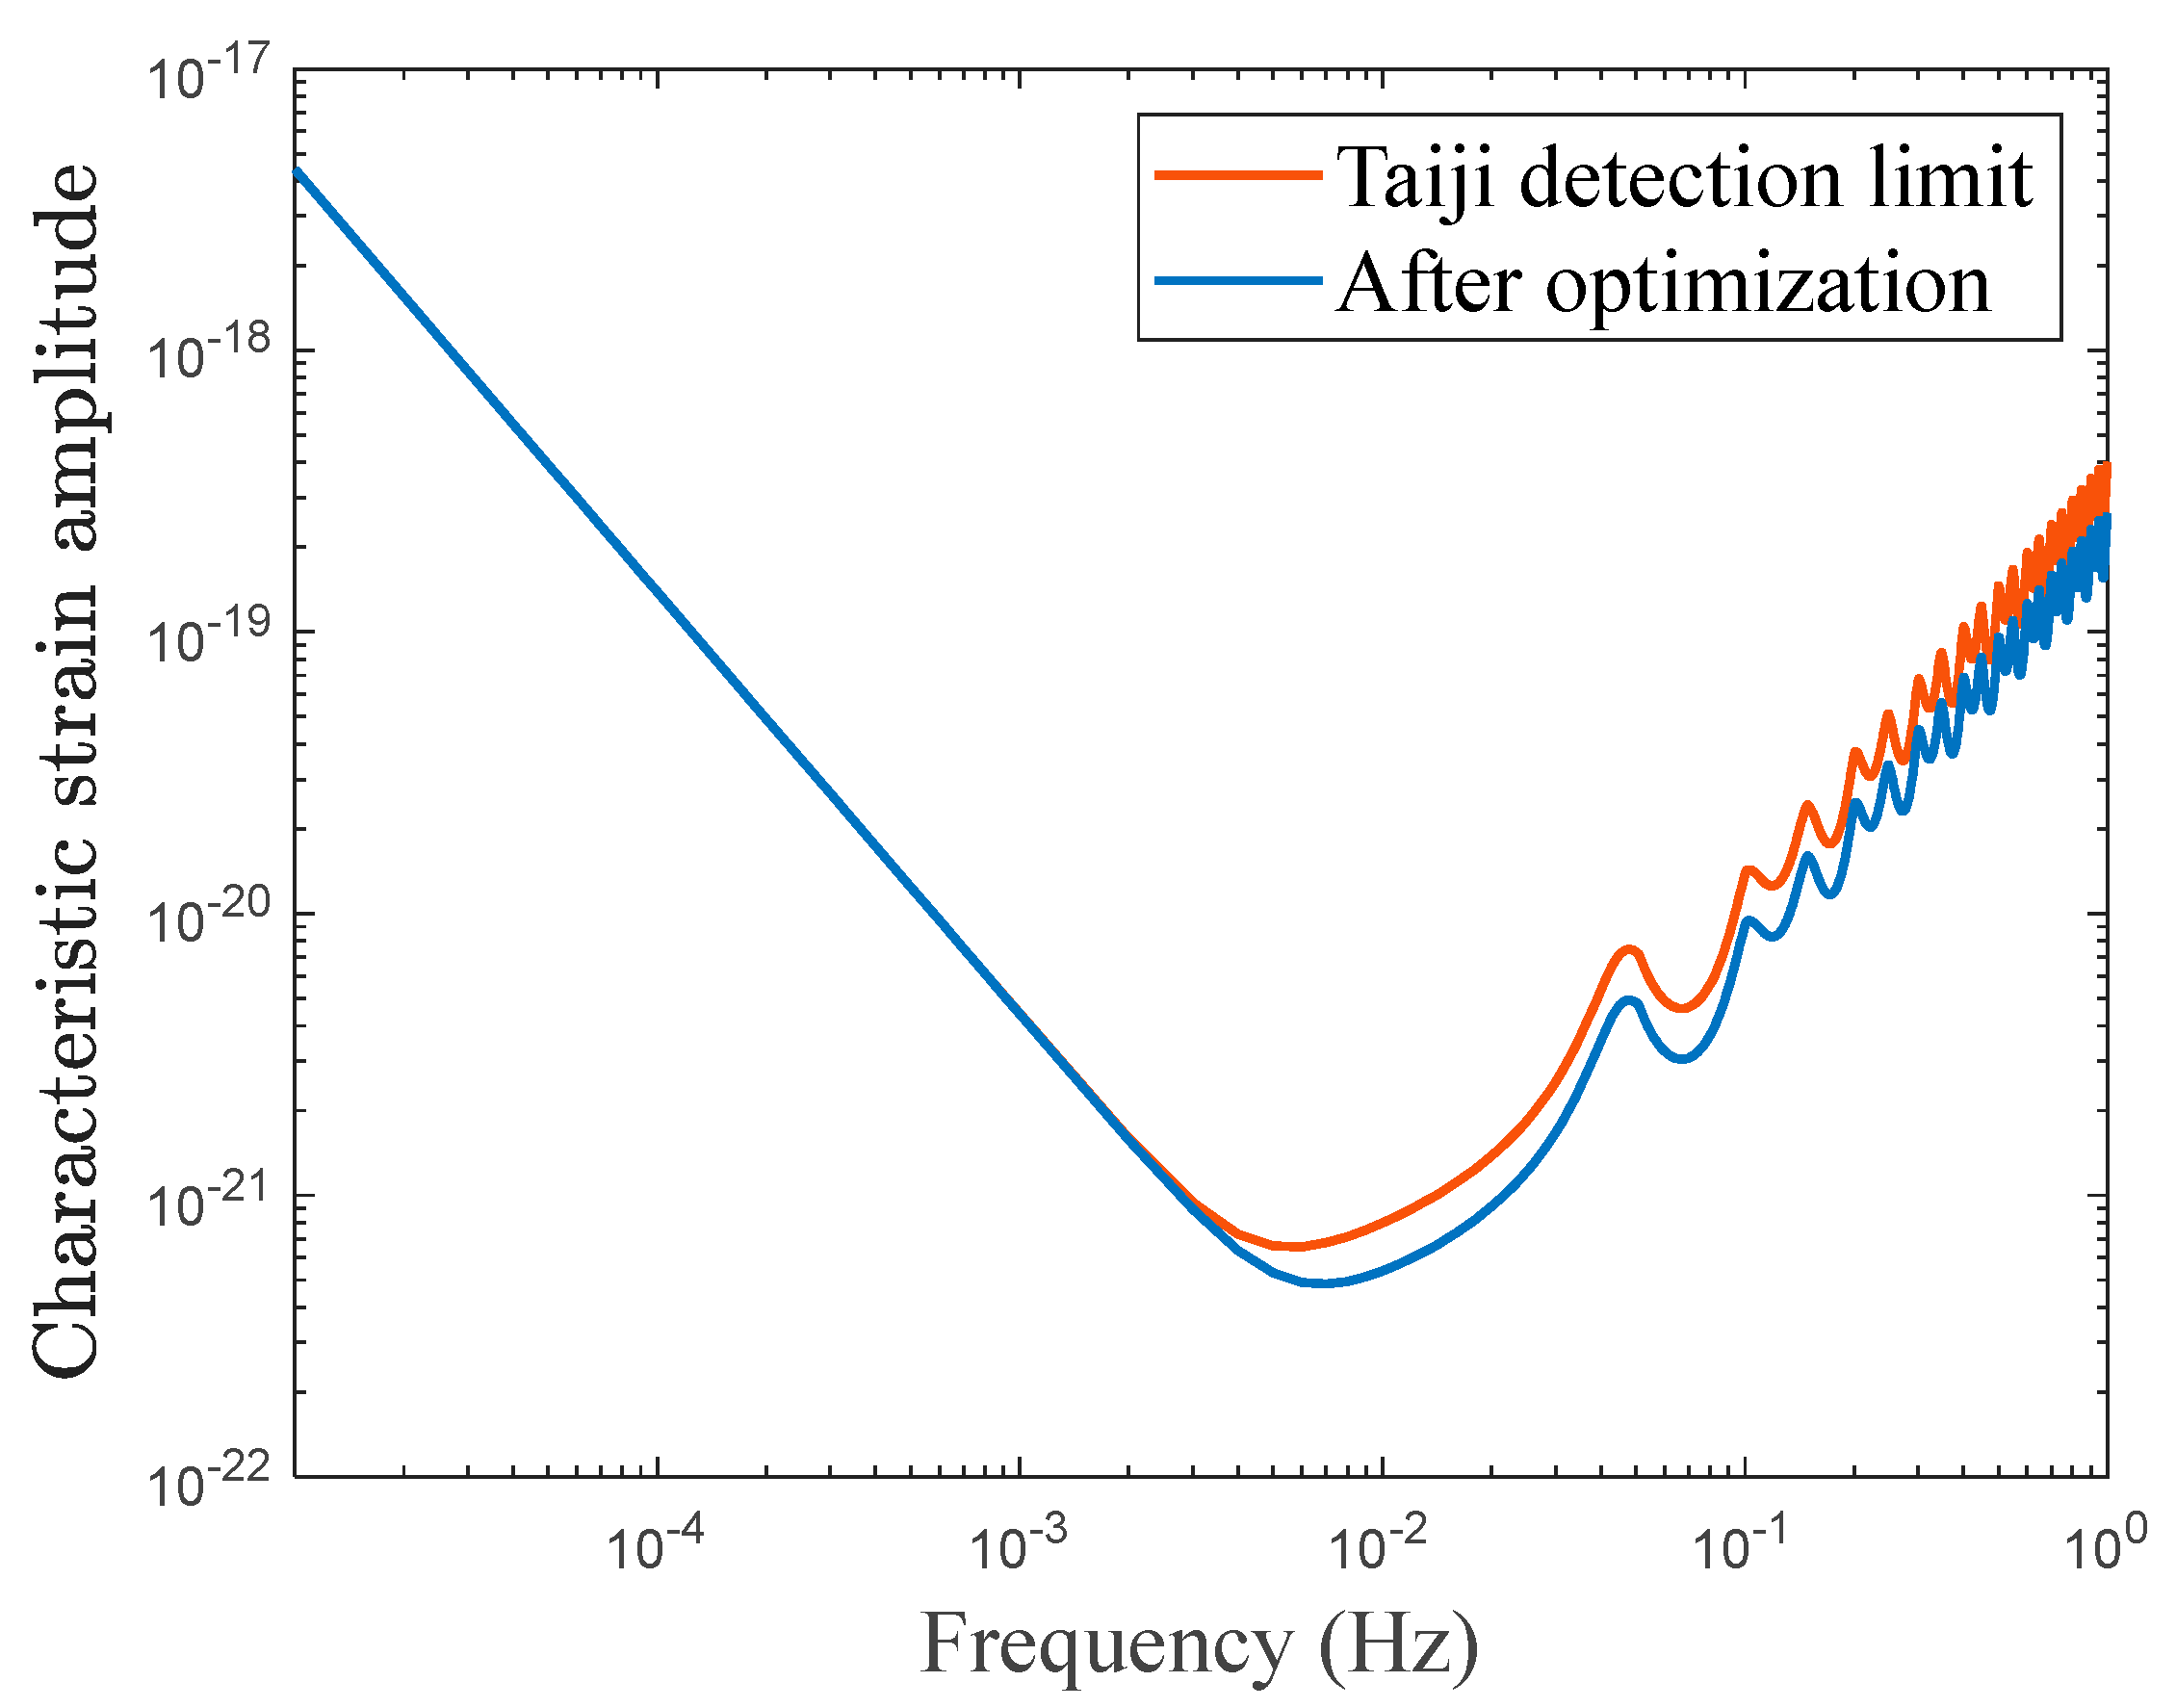
4.2. Experimental Adjustment of Ptel and fupper

According to Equation (5), the value of Preceive is positively proportional to Ptel. The optimal value of Plocal is directly influenced by fupper. To describe the effect of the values of Ptel and fupper on Preceive and Plocal in a more intuitive manner, we conducted the following experiments: (1) vary the value of Ptel in the range [2 W, 3 W] with an interval of 0.1 W and observe the variations of Preceive and total readout displacement noise; and (2) vary the value of fupper in the range [20 MHz, 30 MHz] with an interval of 1 MHz and observe the variations of the optimal Plocal value and minimum total readout displacement noise δ x total . The results are shown in Figure 5 and Figure 6. It should be noted that in the first experiment, other parameters such as Plocal, m, and fupper were set according to the first optimization results shown in Table 3, while in the second experiment, we set Ptel = 2 W.
In Figure 5, as Ptel increases, Preceive increases linearly, and δ x total decreases approximately linearly. In Equation (4) and Step 5 of the optimization algorithm proposed in this study, the variation of Preceive may cause a change in the optimal Plocal value. However, in practice, the variation of Preceive is so small that it barely affects the optimal value of Plocal. Figure 6 shows the variations of Plocal and δ x total with fupper. The optimal value of Plocal increases as fupper increases, while δ x total first decreases and then increases. When fupper = 27 MHz, the optimal Plocal values is 2.175 mW, and δ x total has its smallest value of 4.2078 pm / Hz .
In actual mission operations, a larger value of Preceive can not only reduce δ x total , but also reduce the difficulty of weak-light phase-locked loops to some extent [27], which means that the power of Ptel must be increased. However, increasing Ptel undoubtedly increases the difficulty of the design of the devices associated with this system, and therefore, a trade-off needs to be made considering the practical applications of this system. In addition, different upper bounds of the beat-note frequency correspond to different optimal values of Plocal, and different minimum total readout displacement noise values. The value of Plocal can be set by referring to Figure 6.

5. Conclusions

In this study, a hierarchical optimization algorithm is proposed to solve the Taiji program’s system-level frequency setting scheme. The optimization model considered the effects of six main factors, namely flower, fupper, fADC, fPT, fUSO, and m. Two optimization objectives were used, including minimizing the total readout displacement noise and maximizing the feasible beat-note frequency range. Considering the characteristics involved in solving multi-objective optimization problems, 20 Pareto-optimal solutions were obtained. The minimum total readout displacement noise was 4.12 pm / Hz , which corresponded to a beat-note frequency feasible range of 21 MHz, with (flower, fupper, fADC, fPT, fUSO, m) = (3 MHz, 23 MHz, 96 MHz, 94 MHz, 4512 MHz, 0.44). The maximum feasible range of the beat-note frequency was 23 MHz with a total readout displacement noise of 4.21 pm / Hz , with (flower, fupper, fADC, fPT, fUSO, m) = (3 MHz, 25 MHz, 92 MHz, 90 MHz, 4140 MHz, 0.44). Hence, different values of the parameters fupper, fADC, fPT, and fUSO result in different final optimization results. Therefore, these two objectives were not simultaneously optimized, and a trade-off between these two objectives needs to be made in practical applications of this system. Moreover, we analyzed the effects of Ptel and fupper on Preceive and Plocal, and then explored the effects of these two factors on the total readout displacement noise. The results provide a reference for setting the frequency setting strategy during laser transmission and readout, determining the power ratio between the sidebands and carrier and selecting the relevant equipment parameters of laser interferometry systems in the Taiji program.

Author Contributions

Conceptualization, X.M., Z.Y. and X.P.; methodology, J.Z., C.G. and M.Z.; validation, X.M., Z.Y. and X.P.; writing—original draft preparation, J.Z. and X.M.; writing—review and editing, X.M., Z.Y. and W.T. All authors have read and agreed to the published version of the manuscript.

Funding

This research was funded by the National Key Research and Development Program of China (Grant No. 2020YFC2200100) and the Chinese Academy of Sciences Strategic Pioneer Program on Space Science (Grant No. XDA1502110201).

Institutional Review Board Statement

Not applicable.

Informed Consent Statement

Not applicable.

Data Availability Statement

Data underlying the results presented in this paper are not publicly available at this time but may be obtained from the authors upon reasonable request.

Acknowledgments

We would like to thank Ziren Luo and Heshan Liu in Institute of Mechanics for the helpful discussion.

Conflicts of Interest

The authors declare no conflict of interest.

References

  1. Abramovici, A.; Althouse, W.E.; Drever, R.W.; Gürsel, Y.; Kawamura, S.; Raab, F.J.; Shoemaker, D.; Sievers, L.; Spero, R.E.; Thorne, K.S. LIGO: The Laser Interferometer Gravitational-Wave Observatory. Science 1992, 256, 325–333. [Google Scholar] [CrossRef] [PubMed]
  2. Thorne, K.S. Gravitational Waves. arXiv 1995, arXiv:gr-qc/9506086. [Google Scholar]
  3. Hough, J.; Robertson, D.; Ward, H.; McNamara, P. LISA—The Interferometer. Adv. Space Res. 2003, 32, 1247–1250. [Google Scholar] [CrossRef]
  4. Danzmann, K.; Prince, T.A.; Binetruy, P.; Bender, P.; Buchman, S.; Centrella, J.; Cerdonio, M.; Cornish, N.; Cruise, M.; Cutler, C.J. LISA: Unveiling a Hidden Universe. In Assessment Study Report ESA/SRE; AEI: Hannover, Germany, 2011; Volume 3. [Google Scholar]
  5. Hu, W.; Wu, Y. The Taiji Program in Space for Gravitational Wave Physics and the Nature of Gravity. Natl. Sci. Rev. 2017, 4, 685–686. [Google Scholar] [CrossRef]
  6. Li, Y.; Jin, G. A Brief Overview of 8 m Prototype Facility of Laser Interferometer for Taiji Pathfinder Mission. Appl. Phys. B 2021, 127, 88. [Google Scholar] [CrossRef]
  7. Luo, Z.; Guo, Z.; Jin, G.; Wu, Y.; Hu, W. A Brief Analysis to Taiji: Science and Technology. Results Phys. 2020, 16, 102918. [Google Scholar] [CrossRef]
  8. Luo, J.; Chen, L.-S.; Duan, H.-Z.; Gong, Y.-G.; Hu, S.; Ji, J.; Liu, Q.; Mei, J.; Milyukov, V.; Sazhin, M.; et al. TianQin: A Space-Borne Gravitational Wave Detector. Class. Quantum Grav. 2016, 33, 035010. [Google Scholar] [CrossRef]
  9. Otto, M. Time-Delay Interferometry Simulations for the Laser Interferometer Space Antenna. Ph.D. Thesis, Gottfried Wilhelm Leibniz Universität Hannover, Hannover, Germany, 2015. [Google Scholar]
  10. Brause, N.C. Auxiliary Function Development for the LISA Metrology System. Ph.D. Thesis, Gotfried Wilhelm Leibniz Universitmt Hannover, Hannover, Germany, 2018. [Google Scholar]
  11. Chiow, S.; Williams, J.; Yu, N. Laser-Ranging Long-Baseline Differential Atom Interferometers for Space. Phys. Rev. A 2015, 92, 063613. [Google Scholar] [CrossRef]
  12. Wang, Y. On Inter-Satellite Laser Ranging, Clock Synchronization and Gravitational Wave Data Analysis. Ph.D. Thesis, Gottfried Wilhelm Leibniz Universität Hannover, Hannover, Germany, 2014. [Google Scholar]
  13. Barke, S. Inter-Spacecraft Frequency Distribution. Ph.D. Thesis, Gottfried Wilhelm Leibniz Universität Hannover, Hannover, Germany, 2015. [Google Scholar]
  14. Pollack, S.E.; Stebbins, R.T. A Demonstration of LISA Laser Communication. Class. Quantum Grav. 2006, 23, 4201–4213. [Google Scholar] [CrossRef]
  15. Kullmann, J. Development of a Digital Phase Measuring System with Microradian Precision for LISA. Ph.D. Thesis, Gottfried Wilhelm Leibniz Universität Hannover, Hannover, Germany, 2012. [Google Scholar]
  16. Zhang, J.; Yang, Z.; Ma, X.; Peng, X.; Liu, H.; Tang, W.; Zhao, M.; Gao, C.; Qiang, L.-E.; Han, X.; et al. Inter-Spacecraft Offset Frequency Setting Strategy in the Taiji Program. Appl. Opt. 2022, 61, 837–843. [Google Scholar] [CrossRef] [PubMed]
  17. Heinzel, G.; Esteban, J.J.; Barke, S.; Otto, M.; Wang, Y.; Garcia, A.F.; Danzmann, K. Auxiliary Functions of the LISA Laser Link: Ranging, Clock Noise Transfer and Data Communication. Class. Quantum Grav. 2011, 28, 094008. [Google Scholar] [CrossRef]
  18. Klipstein, W.; Halverson, P.G.; Peters, R.; Cruz, R.; Shaddock, D. Clock Noise Removal in LISA. In Proceedings of the Laser Interferometer Space Antenna: 6th International LISA Symposium, Greenbelt, MD, USA, 19–23 June 2006; Volume 873, pp. 312–318. [Google Scholar]
  19. Barke, S.; Brause, N.; Bykov, I.; Esteban Delgado, J.J.; Enggaard, A.; Gerberding, O.; Heinzel, G.; Kullmann, J.; Pedersen, S.M.; Rasmussen, T. LISA Metrology System—Final Report; AEI: Hannover, Germany, 2014. [Google Scholar]
  20. Li, Y.; Wang, C.; Wang, L.; Liu, H.; Jin, G. A Laser Interferometer Prototype with Pico-Meter Measurement Precision for Taiji Space Gravitational Wave Detection Missionin China. Microgravity Sci. Technol. 2020, 32, 331–338. [Google Scholar] [CrossRef]
  21. Ren, Z.; Jun, Z.; Jiqiao, L.; Dijun, C.; Yan, Y.; Weibiao, C. Solid State Tunable Single-Frequency Laser Based on Non-Planar Ring Oscillator. Chin. J. Lasers 2011, 38, 1102011. [Google Scholar] [CrossRef]
  22. Gao, R.; Liu, H.; Zhao, Y.; Luo, Z.; Jin, G. Automatic, High-Speed, High-Precision Acquisition Scheme with QPD for the Taiji Program. Opt. Express 2021, 29, 821. [Google Scholar] [CrossRef] [PubMed]
  23. Zhao, Y. The Research on the Tilt to Length Coupling Noise in Inter-Satellite Interference Link for the Space-Based Gravitational Wave Detection; Chinese Academy of Sciences: Beijing, China, 2021. [Google Scholar]
  24. Deb, K.; Pratap, A.; Agarwal, S.; Meyarivan, T. A Fast and Elitist Multiobjective Genetic Algorithm: NSGA-II. IEEE Trans. Evol. Comput. 2002, 6, 182–197. [Google Scholar] [CrossRef]
  25. Luo, Z.; Wang, Y.; Wu, Y.; Hu, W.; Jin, G. The Taiji Program: A Concise Overview. Prog. Theor. Exp. Phys. 2021, 2021, 05A108. [Google Scholar] [CrossRef]
  26. Liu, H.; Li, Y.; Jin, G. Numerical Simulations of Arm-Locking for Taiji Space Gravitational Waves Detection. Microgravity Sci. Technol. 2021, 33, 41. [Google Scholar] [CrossRef]
  27. Wan, C. A Study on nW-Level Weak Light Optical Phase-Locking Techniques. Master’s Thesis, Huazhong University of Science and Technology, Wuhan, China, 2012. [Google Scholar]
Figure 1. Carrier, first-order sideband (normalized power over the modulation depth m), and the ratio between the first-order sideband and carrier.
Sensors 23 09431 g001
Figure 2. Flowchart of the algorithm.
Sensors 23 09431 g002
Figure 3. Pareto-optimal solution plane: (a) Scatter plot of the total readout displacement noise with the modulation depth; USO frequency; and beat-note frequency in a feasible range along the x-, y-, and z-axes, respectively. The total readout displacement noise δ x total is represented by the colored bar. (b) Scatter plot of the beat-note frequency in a feasible range with the modulation depth; USO frequency; and total readout displacement noise along the x-, y-, and z-axes, respectively. The beat-note frequency in a feasible range is represented by the colored bar.
Sensors 23 09431 g003
Figure 4. The sensitivity curve of the Taiji program detection limit (red) and after optimization (blue).
Sensors 23 09431 g004
Figure 5. Variation of Preceive and the total readout displacement noise as a function of Ptel. The x-, left-hand y-, and right-hand y-axes show Ptel, Preceive, and the total readout displacement noise, respectively.
Sensors 23 09431 g005
Figure 6. Variations of the optimal Plocal value and the minimum total readout displacement noise with fupper. The x-, left-hand y-, and right-hand y-axes show fupper, the optimal Plocal, and the minimum total readout displacement noise, respectively.
Sensors 23 09431 g006
Table 1. Taiji program parameters.
ParameterSymbolValue
Electron charge constante1.6 × 10−19 C
Heterodyne interference efficiency ε het 0.8 [20]
Photodiode responsivityRpd0.68 A/W [20]
Relative intensity laser noiseRIN1 × 10−8 [21]
Photodetector phase numberNpd4
Photodetector voltage noise δ U pd 2   nV / Hz
Photodiode capacitance C pd 10 pF
Current noise δ I pd 1 . 5   pA / Hz [22]
Laser power transmitted through the telescope P tel 2 W [7]
Total optical efficiency ε opt 0.853 [23]
Arm lengthL3 × 109 m [6]
Diameter of telescopeD40 cm [7]
Table 2. Time consumption of each step.
StepsAlgorithmTime Consumption
Step 1Nondominated sorting genetic algorithm II [24]240 s
Step 2Round0.005 s
Step 3Exhaustive enumeration1 s
Step 4Optimization0.03 s
Table 3. Pareto-optimal feasible solutions obtained from hierarchical optimization algorithm.
Numberflower
(MHz)
fupper
(MHz)
Feasible RangefADC
(MHz)
fPT
(MHz)
fUSO
(MHz)
m δ x total
( pm / Hz )
Plocal
( mW )
132523929041400.444.212.06
232523636138430.444.232.06
332523686622440.484.472.06
432523626018600.504.572.06
532422848234440.444.241.99
642522716848280.444.162.06
742522706746900.444.172.06
832422656340950.444.181.99
942522888637840.444.242.06
1042522595733630.444.282.06
1142522595733630.444.282.06
1242522706823800.484.442.06
1342522585616240.524.652.06
1432321969445120.444.121.92
1532321615935990.444.191.92
1642421656240300.444.191.99
1742421848234440.444.241.99
1842421888637840.444.211.99
1932321605817400.504.521.92
2052521595733630.444.282.06
Disclaimer/Publisher’s Note: The statements, opinions and data contained in all publications are solely those of the individual author(s) and contributor(s) and not of MDPI and/or the editor(s). MDPI and/or the editor(s) disclaim responsibility for any injury to people or property resulting from any ideas, methods, instructions or products referred to in the content.

