
Action Quality Assessment Model Using Specialists’ Gaze Location and Kinematics Data—Focusing on Evaluating Figure Skating Jumps


Abstract
:1. Introduction
1.1. Background
- Because the samples are from the same action class, the differences among the instances are subtle;
- The entire action sequence must be “seen” to quantify the quality of action correctly and meaningfully;
- AQA datasets are very small compared to action recognition datasets.
- Using kinematic data from a tracking system in addition to video features;
- Enabling the model to learn the gaze location of competition specialists such as judges and skaters when inputting video features.
- (1).
- To examine the differences in eye movements between judges and skaters when evaluating the GOE score of figure skating jumps (Part A);
- (2).
- To propose a model for the grade of execution score of figure skating jumps using kinematic data from the tracking system and specialists’ gaze location (Part B).
- We observed a significant difference in the gaze location percentages between judges and skaters, when adjusting for the skaters’ technical abilities. Both groups primarily focused on the upper body; however, the skaters tended to focus on the face, while judges focused more on the lower body and skating boots. These findings offer a new perspective for research on the eye movement patterns of sports officials;
- We proposed a prediction model that utilized kinematic data from tracking systems, specialist gaze locations, and image information. This model enhanced the accuracy of the baseline model, suggesting new possibilities for human–machine collaboration in AQA tasks.
1.2. Related Work
1.2.1. AQA of Figure Skating
1.2.2. Performance Analysis of Figure Skating Jumps in Sports Sciences
1.2.3. Eye Movements of Sports Judges Research in Sports Psychology
2. Methods
2.1. Method of Specialists’ Eye Movements—Part A
2.1.1. Participants
- Judges: Subjects held a judge’s qualification approved by the National Federation and were not registered as skaters with the federation in the year the experiment was conducted. They also had passed a grade 6 technical test for skaters during their competitive skating career;
- Skaters: Subjects were registered with the National Federation, and they had passed a grade 6 technical test for skaters.
2.1.2. Task
2.1.3. Video
2.1.4. Eye Tracker
2.1.5. Procedure
- All jumps are 30 double-axel jumps in the ladies’ senior category and had no under-rotation or other technical deductions;
- GOE guidelines (same as Table 1);
- Subjects must wait until the response time appears on the screen, observe the video, and move their eyes as naturally as possible without moving their face.
2.1.6. Eye Tracking Experiment
2.1.7. Variables
- Judgmental performanceExperience as an athlete, particularly the ability to perform a technique to be judged, influences judgmental performance [20]. In this study, we expected no group differences in judgment errors between the judge and skater groups because there was no difference in their competitive ability as skaters. As in previous studies on sports judges research in sports psychology, the mean absolute error (MAE) was used as the evaluation index in this study;
- Number of fixationsBased on the information reduction hypothesis, specialists pay more attention to the task-relevant parts [31]. As judges have a specific specialty in evaluating the performance of figure skating jumps, the judge group is expected to have a longer fixation duration on the parts of the jumps related to the task;
- Fixation durationBased on the information reduction hypothesis, specialists have more time to pay attention to the task-relevant parts of the task [31]. As judges have a specific specialty in evaluating the performance of figure skating jumps, the judge group is expected to have a longer fixation duration on the parts of the jumps related to the task;
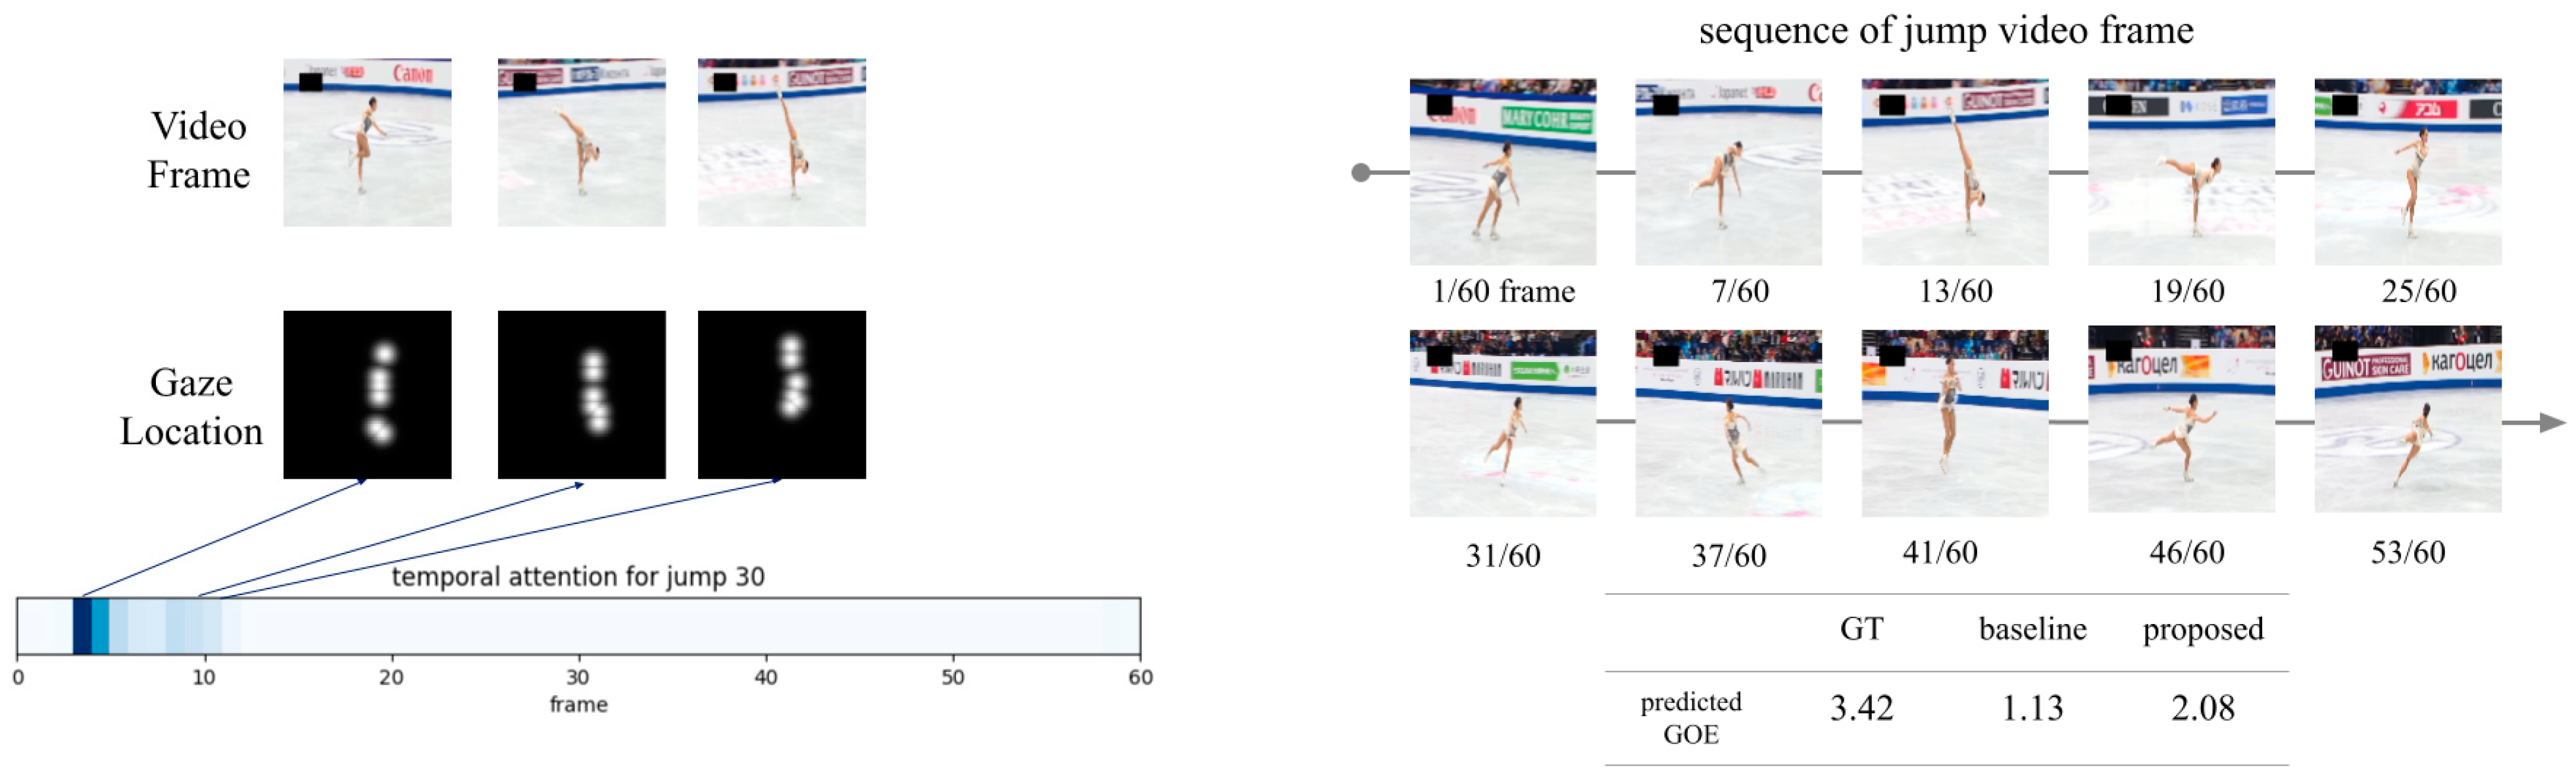
- Gaze locationBased on the two-dimensional coordinates obtained by the eye tracker, we calculated the number of frames and the percentage of gaze locations for the subjects using frame-by-frame analysis [32,33]. The area of interest (AOI) based on the body parts was defined into four areas, as shown in Figure 2. We hypothesized that there would be a difference in percentage between the professionally educated judges’ group and the skaters’ group, with specialists placing their eyes on more task-relevant areas.
2.1.8. Analysis
- A researcher in this study, who had experience in figure skating, determined the take-off point for each jump based on the video frame;
- The starting point of the analysis was 150 frames (approximately 5 s) before the take-off point because the criteria included the execution of steps and unexpected or creative entries before the jump in evaluating the GOE score;
- Eighty-nine frames (approximately 3 s) after the take-off point were set as endpoints for analysis. Based on the above definition, 240 video frames (29.97 FPS) were selected for the analysis;
- As defined above, 480 frames (60 Hz) of eye-tracking data acquired by the eye tracker were used for analysis.
2.2. Method of Predictive Model of Figure Skating Jump—Part B
2.2.1. Dataset
- VideoAs in Part A, we used 30 videos of double-axel jumps rated 0 or higher in GOE by all judges in the 2019 World Championships ladies’ short program. Each jump video contained 240 frames, and provisional scores were blacked out;
- Kinematic featuresIce Scorp, a tracking technology for media content used to visualize skater jump data, was implemented in the competition. For detailed information on Ice Scorp, please refer to previous papers [12,13]. The vertical height, horizontal distance, and speed after landing on ice (landing speed) were obtained for each of the 30 jumps. We were provided these data from Qoncept Inc., which is developing a tracking system;
- Gaze locationTwo-dimensional eye coordinates (480 frames) of the six specialists (three judges and three skaters) for each jump video were obtained in the Part A experiment;
- Ground truth (GT) of GOE scoreWe extracted the GOE score for each jump provided by each judge from the official results page of the competition [34]. Note that the GOE score used in this study was the trimmed average of nine judges and incorporated values in the range of 0–5.
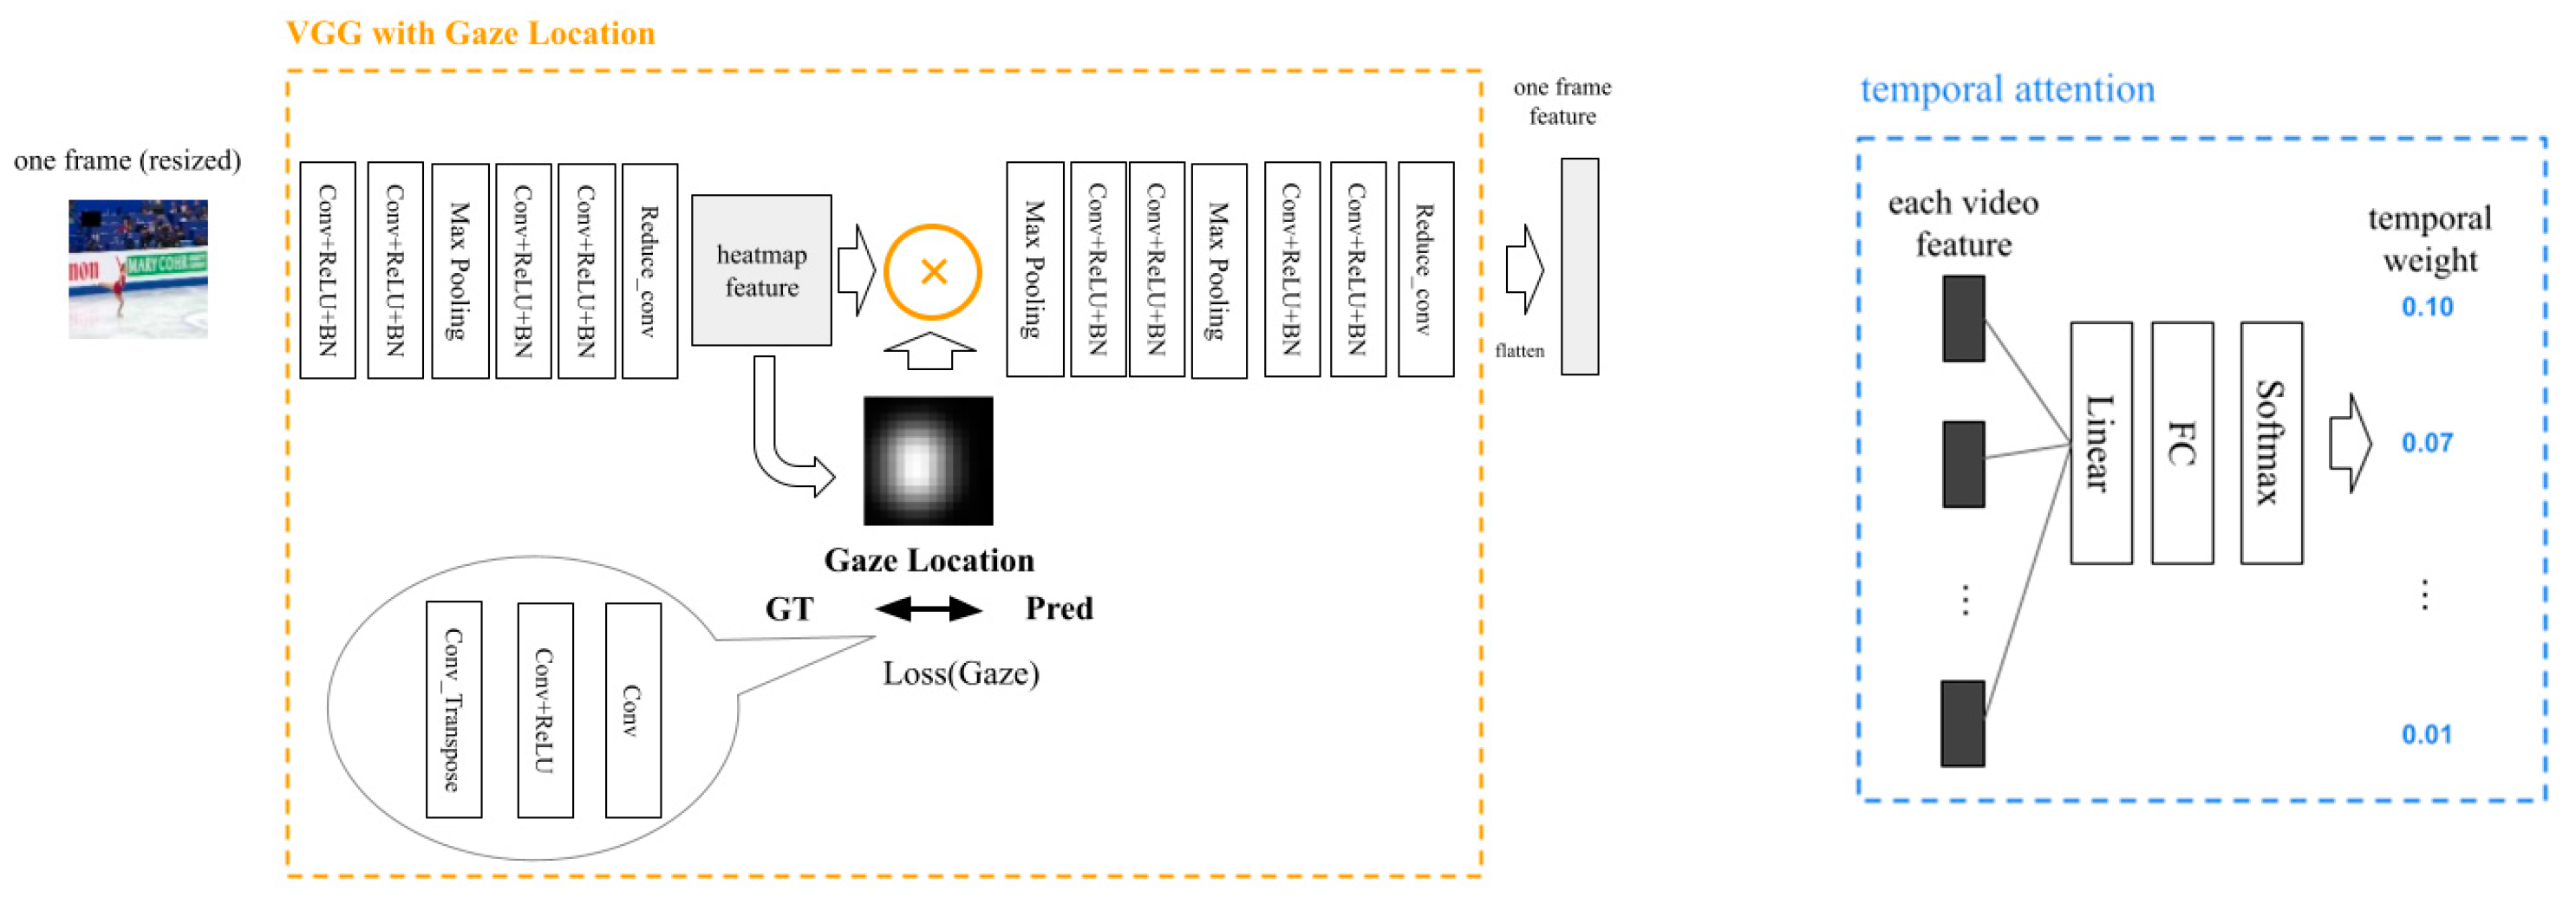
2.2.2. Proposed Model
2.2.3. Accuracy Verification Experiment
- Points of consideration
- Utilizing specialists’ gaze location: We compared the proposed model with a baseline model to demonstrate its effectiveness and examined which of the specialists’ gazes should be used in the proposed model (three skaters, three judges, or all six);
- Where to place specialists’ gaze location in the network: We examined where it would be most effective to implement information reduction using the specialist gaze in the network. As shown in Figure 5, we set P1–P4 as the shallowest to the deepest layer and examined how the accuracy changed when the gaze was multiplied by each of them. For comparison with the baseline model, all the models were implemented in P2 as the default position, which was the middle layer.
- Implementation details
- Evaluation
3. Results
3.1. Result of Specialists’ Eye Movements—Part A
3.1.1. Judgment Performance
3.1.2. Number of Fixations
3.1.3. Fixation Duration
3.1.4. Gaze Location
3.2. Result of Predictive Model of Figure Skating Jump—Part B
4. Discussion
5. Conclusions
Author Contributions
Funding
Institutional Review Board Statement
Informed Consent Statement
Data Availability Statement
Acknowledgments
Conflicts of Interest
References
- Lei, Q.; Du, J.X.; Zhang, H.B.; Ye, S.; Chen, D.S. A Survey of Vision-Based Human Action Evaluation Methods. Sensors 2019, 19, 4129. [Google Scholar] [CrossRef]
- Parmar, P. On Action Quality Assessment, UNLV Thesis, Dissertations, Professional Papers, and Capstones; University of Nevada, Las Vegas: Las Vegas, NV, USA, 2019; Volume 3833. [Google Scholar] [CrossRef]
- Tran, D.; Bourdev, L.; Fergus, R.; Torresani, L.; Paluri, M. Learning Spatiotemporal Features with 3D Convolutional Networks. In Proceedings of the IEEE International Conference on Computer Vision (ICCV), Washington, DC, USA, 7–13 December 2015; Volume 2015, pp. 4489–4497. [Google Scholar] [CrossRef]
- Carreira, J.; Zisserman, A. Quo Vadis, Action Recognition? A New Model and the Kinetics Dataset. In Proceedings of the IEEE Conference on Computer Vision and Pattern Recognition (CVPR), Honolulu, HI, USA, 21–26 July 2017; Volume 2017, pp. 4724–4733. [Google Scholar] [CrossRef]
- Pirsiavash, H.; Vondrick, C.; Torralba, A. Assessing the Quality of Actions. In Proceedings of the European Conference on Computer Vision, Zurich, Switzerland, 6–12 September 2014; Springer: Berlin/Heidelberg, Germany, 2014; pp. 556–571. [Google Scholar] [CrossRef]
- Li, H.; Lei, Q.; Zhang, H.; Du, J.; Gao, S. Skeleton-Based Deep Pose Feature Learning for Action Quality Assessment on Figure Skating Videos. J. Vis. Commun. Image Represent. 2022, 89, 103625. [Google Scholar] [CrossRef]
- Parmar, P.; Morris, B.T. Learning to Score Olympic Events. In Proceedings of the IEEE Conference on Computer Vision and Pattern Recognition Workshops 2017, Honolulu, HI, USA, 21–26 July 2017; pp. 76–84. [Google Scholar] [CrossRef]
- Xu, C.; Fu, Y.; Zhang, B.; Chen, Z.; Jiang, Y.G.; Xue, X. Learning to Score Figure Skating Sport Videos. IEEE Trans. Circuits Syst. Video Technol. 2019, 30, 4578–4590. [Google Scholar] [CrossRef]
- Han, C.; Shen, F.; Chen, L.; Lian, X.; Gou, H.; Gao, H. MLA-LSTM: A Local and Global Location Attention LSTM Learning Model for Scoring Figure Skating. Systems 2023, 11, 21. [Google Scholar] [CrossRef]
- International Skating Union. Single & Pair Skating: Scale of Values, Levels of Difficulty and Guidelines for Marking Grade of Execution Season; 2018/19 (Communication No. 2186); International Skating Union: Scheveningen, The Netherlands, 2018; Volume 2018. [Google Scholar]
- ISU Press Release, The New Range of Grade of Execution. 2018. Available online: https://www.isu.org/media-centre/press-releases/2018-8/18119-new-grade-of-execution-2018-final/file (accessed on 10 November 2023).
- Hirosawa, S.; Watanabe, M.; Aoki, Y. Determinant Analysis and Developing Evaluation Indicators of Grade of Execution Score of Double Axel Jump in Figure Skating. J. Sports Sci. 2022, 40, 470–481. [Google Scholar] [CrossRef]
- Kosaka, Y. ‘Professionals Figure Skate Wo Sasaeru Hitobito (Professionals People Behind Figure Skating),’ Professionals Volume 14; IceScope, Fusosha: Tokyo, Japan, 2020; pp. 106–113. (In Japanese) [Google Scholar]
- Ziv, G.; Lidor, R.; Zach, S.; Brams, S.; Helsen, W.F. Gaze Behavior of Referees in Sport—A Review. Front. Sports Act. Living 2020, 2, 572891. [Google Scholar] [CrossRef] [PubMed]
- Kredel, R.; Vater, C.; Klostermann, A.; Hossner, E.J. Eye-Tracking Technology and the Dynamics of Natural Gaze Behavior in Sports: A Systematic Review of 40 Years of Research. Front. Psychol. 2017, 8, 1845. [Google Scholar] [CrossRef] [PubMed]
- Shinji, S.; Yasuo, I.; Ippei, A.; Katsumi, A. Jump Height in Ladies Single Figure Skating in the 18th Winter Olympic Games in Nagano 1998. In Proceedings of the 17 International Symposium on Biomechanics in Sports, Perth, Australia, 30 June–6 July 1999; pp. 105–108. [Google Scholar]
- King, D.; Smith, S.; Higginson, B.; Muncasy, B.; Scheirman, G. Characteristics of Triple and Quadruple Toe-Loops Performed During the Salt Lake City 2002 Winter Olympics. Sports Biomech. 2004, 3, 109–123. [Google Scholar] [CrossRef]
- Helsen, W.; Bultynck, J.B. Physical and Perceptual-Cognitive Demands of Top-Class Refereeing in Association Football. J. Sports Sci. 2004, 22, 179–189. [Google Scholar] [CrossRef] [PubMed]
- Clare, M. Sports Officials and Officiating: Science and Practice; Routledge: Oxfordshire, UK, 2014; p. 176. [Google Scholar]
- Pizzera, A.; Markus, R. Perceptual Judgments of Sports Officials Are Influenced by Their Motor and Visual Experience. J. Appl. Sport Psychol. 2011, 24, 59–72. [Google Scholar] [CrossRef]
- Pizzera, A. Gymnastic Judges Benefit from Their Own Motor Experience as Gymnasts. Res. Q. Exerc. Sport 2012, 83, 603–607. [Google Scholar] [CrossRef] [PubMed]
- Melanie, M.; Marcel, S.; Thomas, H. The Relationship Between the Perceived Movement Quality and the Kinematic Pattern of Complex Skills in Gymnastic. J. Hum. Kinet. 2021, 77, 5–13. [Google Scholar]
- Bard, C.; Fleury, M.; Carrière, L.; Hallé, M. Analysis of Gymnastics Judges’ Visual Search. Res. Q. Exerc. Sport 1980, 51, 267–273. [Google Scholar] [CrossRef]
- Pizzera, A.; Möller, C.; Plessner, H. Gaze Behavior of Gymnastics Judges: Where Do Experienced Judges and Gymnasts Look While Judging? Res. Q. Exerc. Sport 2018, 89, 112–119. [Google Scholar] [CrossRef] [PubMed]
- Flessas, K.; Mylonas, D.; Panagiotaropoulou, G.; Tsopani, D.; Korda, A.; Siettos, C.; Di Cagno, A.; Evdokimidis, I.; Smyrnis, N. Judging the Judges’ Performance in Rhythmic Gymnastics. Med. Sci. Sports Exerc. 2015, 47, 640–648. [Google Scholar] [CrossRef] [PubMed]
- Luis del Campo, V.; Espada Gracia, I. Exploring Visual Patterns and Judgments Predicated on Role Specificity: Case Studies of Expertise in Gymnastics. Curr. Psychol. 2018, 37, 934–941. [Google Scholar] [CrossRef]
- Mack, M. Exploring Cognitive and Perceptual Judgment Processes in Gymnastics Using Essential Kinematics Information. Adv. Cogn. Psychol. 2020, 16, 34–44. [Google Scholar] [CrossRef] [PubMed]
- Hancock, D.J.; Bennett, S.; Roaten, H.; Chapman, K.; Stanley, C. An Analysis of Literature on Sport Officiating Research. Res. Q. Exerc. Sport 2021, 92, 607–617. [Google Scholar] [CrossRef]
- Skating, I.S.U. Ladies Short Program |2019 ISU World Figure Skating Championships Saitama JPN|, YouTube. Available online: https://youtu.be/WKDXWfUW7W8 (accessed on 10 November 2023).
- Olsen, A.; Matos, R. Identifying Parameter Values for an I-VT Fixation Filter Suitable for Handling Data Sampled with Various Sampling Frequencies. In ETRA ’12, Proceedings of the Symposium on Eye Tracking Research and Applications, Santa Barbara, CA, USA, 28–30 March 2012; Association for Computing Machinery: New York, NY, USA, 2012; pp. 317–320. [Google Scholar] [CrossRef]
- Gegenfurtner, A.; Lehtinen, E.; Säljö, R. Expertise Differences in the Comprehension of Visualizations: A Meta-analysis of Eye-Tracking Research in Professional Domains. Educ. Psychol. Rev. 2011, 23, 523–552. [Google Scholar] [CrossRef]
- Nagano, T.; Kato, T.; Fukuda, T. Visual Behaviors of Soccer Players While Kicking with the Inside of the Foot. Percept. Mot. Skills 2006, 102, 147–156. [Google Scholar] [CrossRef]
- Kato, T. Using “Enzan No Metsuke” (Gazing at the Far Mountain) as a Visual Search Strategy in Kendo. Front. Sports Act. Living 2020, 2, 40. [Google Scholar] [CrossRef] [PubMed]
- ISU World Figure Skating Championships. 2019. Available online: http://www.isuresults.com/results/season1819/wc2019/index.htm (accessed on 10 November 2023).
- Simonyan, K.; Zisserman, A. Very Deep Convolutional Networks for Large-Scale Image Recognition. In Proceedings of the 3rd International Conference on Learning Representations (ICLR 2015), San Diego, CA, USA, 7–9 May 2015. [Google Scholar]
- Lin, T.Y.; Goyal, P.; Girshick, R.; He, K.; Dollar, P. Focal Loss for Dense Object Detection. IEEE Trans. Pattern Anal. Mach. Intell. 2018, 42, 318–327. [Google Scholar] [CrossRef] [PubMed]
- Zhou, X.; Wang, D.; Krähenbühl, P. Objects as Points. arXiv 2019, arXiv:1904.07850. [Google Scholar]
- Carter, B.T.; Luke, S.G. Best Practices in Eye Tracking Research. Int. J. Psychophysiol. 2020, 155, 49–62. [Google Scholar] [CrossRef] [PubMed]
- Findlay, L.C.; Ste-Marie, D.M. A Reputation Bias in Figure Skating Judging. J. Sport Exerc. Psychol. 2004, 26, 154–166. [Google Scholar] [CrossRef]


| No. | Criterion |
|---|---|
| 1 | very good height and very good length (of all jumps in a combo or sequence) |
| 2 | good take-off and landing |
| 3 | effortless throughout (including rhythm in jump combination) |
| 4 | steps before the jump, unexpected or creative entry |
| 5 | very good body position from take-off to landing |
| 6 | element matches the music |
| Dataset | Data Type | Methods | |
|---|---|---|---|
| [5] | MIT-Skate | Video (Pose) | Pose + DCT |
| [6] | MIT-Skate/Fis-V | Video (Pose) | STPE-ATRE-SP |
| [7] | MIT-Skate | Video (RGB) | C3D-SVR |
| [8] | MIT-Skate/Fis-V | Video (RGB) | SA-LSTM, MCS-LSTM |
| [9] | MIT-Skate/Fis-V | Video (RGB) | MS-LAM, MLA-LSTM |
| Subject | MAE ± SD | 95% CI |
|---|---|---|
| Judge A | 1.181 ± 0.662 | 0.934–1.428 |
| Judge B | 0.986 ± 0.786 | 0.692–1.279 |
| Judge C | 1.010 ± 0.679 | 0.756–1.263 |
| Skater A | 0.871 ± 0.595 | 0.649–1.094 |
| Skater B | 0.900 ± 0.668 | 0.650–1.150 |
| Skater C | 0.971 ± 0.627 | 0.737–1.206 |
| Judges | 1.059 ± 0.107 | 0.794–1.323 |
| Skaters | 0.914 ± 0.052 | 0.786–1.042 |
| Group | Video | MAE ± SD | 95% CI |
|---|---|---|---|
| Judges | 1 | 0.825 ± 0.611 | 0.646–1.004 |
| 2 | 1.292 ± 0.751 | 1.073–1.511 | |
| Skaters | 1 | 0.837 ± 0.593 | 0.664–1.010 |
| 2 | 0.991 ± 0.674 | 0.794–1.188 |
| Subject | Number of Fixations ± SD | 95% CI |
|---|---|---|
| Judge A | 11.167 ± 2.705 | 10.157–12.177 |
| Judge B | 13.800 ± 3.872 | 12.354–15.246 |
| Judge C | 16.467 ± 2.837 | 15.407–17.526 |
| Skater A | 15.533 ± 2.801 | 14.488–16.579 |
| Skater B | 12.167 ± 3.130 | 10.998–13.336 |
| Skater C | 12.367 ± 2.822 | 11.313–13.420 |
| Judges | 13.811 ± 1.536 | 9.994–17.628 |
| Skaters | 13.356 ± 1.707 | 9.114–17.597 |
| Subject | Fixation Duration (ms) ± SD | 95% CI |
|---|---|---|
| Judge A | 5465.833 ± 1098.456 | 5055.663–5876.004 |
| Judge B | 6446.333 ± 1037.293 | 6059.002–6833.665 |
| Judge C | 6305.867 ± 859.441 | 5984.946–6626.787 |
| Skater A | 5247.500 ± 1183.477 | 4805.582–5689.418 |
| Skater B | 5173.033 ± 908.389 | 4833.835–5512.231 |
| Skater C | 5941.400 ± 1169.816 | 5504.584–6378.216 |
| Judges | 6072.678 ± 188.735 | 5603.833–6541.523 |
| Skaters | 5453.978 ± 145.550 | 5092.412–5815.543 |
| Group | Video | Fixation Duration (ms) ± SD | 95% CI |
|---|---|---|---|
| Judges | 1 | 5892.311 ± 1062.856 | 5581.772–6202.850 |
| 2 | 6253.044 ± 1085.546 | 5935.875–6570.213 | |
| Skaters | 1 | 5794.511 ± 804.047 | 5559.589–6029.433 |
| 2 | 5113.444 ± 1315.342 | 4729.135–5497.753 |
| Overall | ||||
| (Frame) | Face | Upper Body | Lower Body | Boots |
| Judges | 8857 | 17,461 | 9183 | 2560 |
| Skaters | 13,130 | 15,946 | 5333 | 909 |
| (%) | ||||
| Judges | 23.27% | 45.88% | 24.13% | 6.73% |
| Skaters | 37.18% | 45.15% | 15.10% | 2.57% |
| Video 1 | ||||
| (Frame) | Face | Upper Body | Lower Body | Boots |
| Judges | 3809 | 8807 | 4468 | 1790 |
| Skaters | 6081 | 8291 | 2733 | 528 |
| (%) | ||||
| Judges | 20.18% | 46.66% | 23.67% | 9.48% |
| Skaters | 34.48% | 47.01% | 15.51% | 2.99% |
| Video 2 | ||||
| (Frame) | Face | Upper Body | Lower Body | Boots |
| Judges | 5048 | 8654 | 4715 | 770 |
| Skaters | 6285 | 8069 | 1925 | 140 |
| (%) | ||||
| Judges | 26.31% | 45.10% | 24.57% | 4.01% |
| Skaters | 38.28% | 49.14% | 11.72% | 0.85% |
| No. | Model | RMSE | Corr. | MAE |
|---|---|---|---|---|
| 1 | KF | 1.200 | 0.020 | 0.978 |
| 2 | Video | 1.141 | 0.184 | 0.890 |
| 3 | KF + Video (baseline model) | 0.954 | 0.338 | 0.767 |
| 4 | KF + Video + judges’ GL | 0.900 | 0.509 | 0.632 |
| 5 | KF + Video + skaters’ GL | 0.816 | 0.655 | 0.741 |
| 6 | KF + Video + all GL | 0.908 | 0.544 | 0.741 |
| 7 | KF + Video + judges’ GL + TA | 0.930 | 0.431 | 0.735 |
| 8 | KF + Video + skaters’ GL + TA | 0.924 | 0.516 | 0.797 |
| 9 | KF + Video + all GL + TA | 0.775 | 0.697 | 0.653 |
| Position | RMSE | Corr. | MAE |
|---|---|---|---|
| P1 | 0.992 | 0.356 | 0.799 |
| P2 | 0.775 | 0.697 | 0.653 |
| P3 | 1.053 | 0.303 | 0.810 |
| P4 | 1.067 | 0.284 | 0.933 |
| Group/Model | RMSE | Corr. |
|---|---|---|
| Judges | 1.278 | 0.592 |
| Skaters | 1.112 | 0.664 |
| Proposed model (No. 9) | 0.775 | 0.697 |
Disclaimer/Publisher’s Note: The statements, opinions and data contained in all publications are solely those of the individual author(s) and contributor(s) and not of MDPI and/or the editor(s). MDPI and/or the editor(s) disclaim responsibility for any injury to people or property resulting from any ideas, methods, instructions or products referred to in the content. |
© 2023 by the authors. Licensee MDPI, Basel, Switzerland. This article is an open access article distributed under the terms and conditions of the Creative Commons Attribution (CC BY) license (https://creativecommons.org/licenses/by/4.0/).
Share and Cite
Hirosawa, S.; Kato, T.; Yamashita, T.; Aoki, Y. Action Quality Assessment Model Using Specialists’ Gaze Location and Kinematics Data—Focusing on Evaluating Figure Skating Jumps. Sensors 2023, 23, 9282. https://doi.org/10.3390/s23229282
Hirosawa S, Kato T, Yamashita T, Aoki Y. Action Quality Assessment Model Using Specialists’ Gaze Location and Kinematics Data—Focusing on Evaluating Figure Skating Jumps. Sensors. 2023; 23(22):9282. https://doi.org/10.3390/s23229282
Chicago/Turabian StyleHirosawa, Seiji, Takaaki Kato, Takayoshi Yamashita, and Yoshimitsu Aoki. 2023. "Action Quality Assessment Model Using Specialists’ Gaze Location and Kinematics Data—Focusing on Evaluating Figure Skating Jumps" Sensors 23, no. 22: 9282. https://doi.org/10.3390/s23229282
APA StyleHirosawa, S., Kato, T., Yamashita, T., & Aoki, Y. (2023). Action Quality Assessment Model Using Specialists’ Gaze Location and Kinematics Data—Focusing on Evaluating Figure Skating Jumps. Sensors, 23(22), 9282. https://doi.org/10.3390/s23229282