
Estimation of Lower Limb Joint Angles and Joint Moments during Different Locomotive Activities Using the Inertial Measurement Units and a Hybrid Deep Learning Model


Abstract
:1. Introduction
2. Materials and Methods
2.1. Gait Dataset
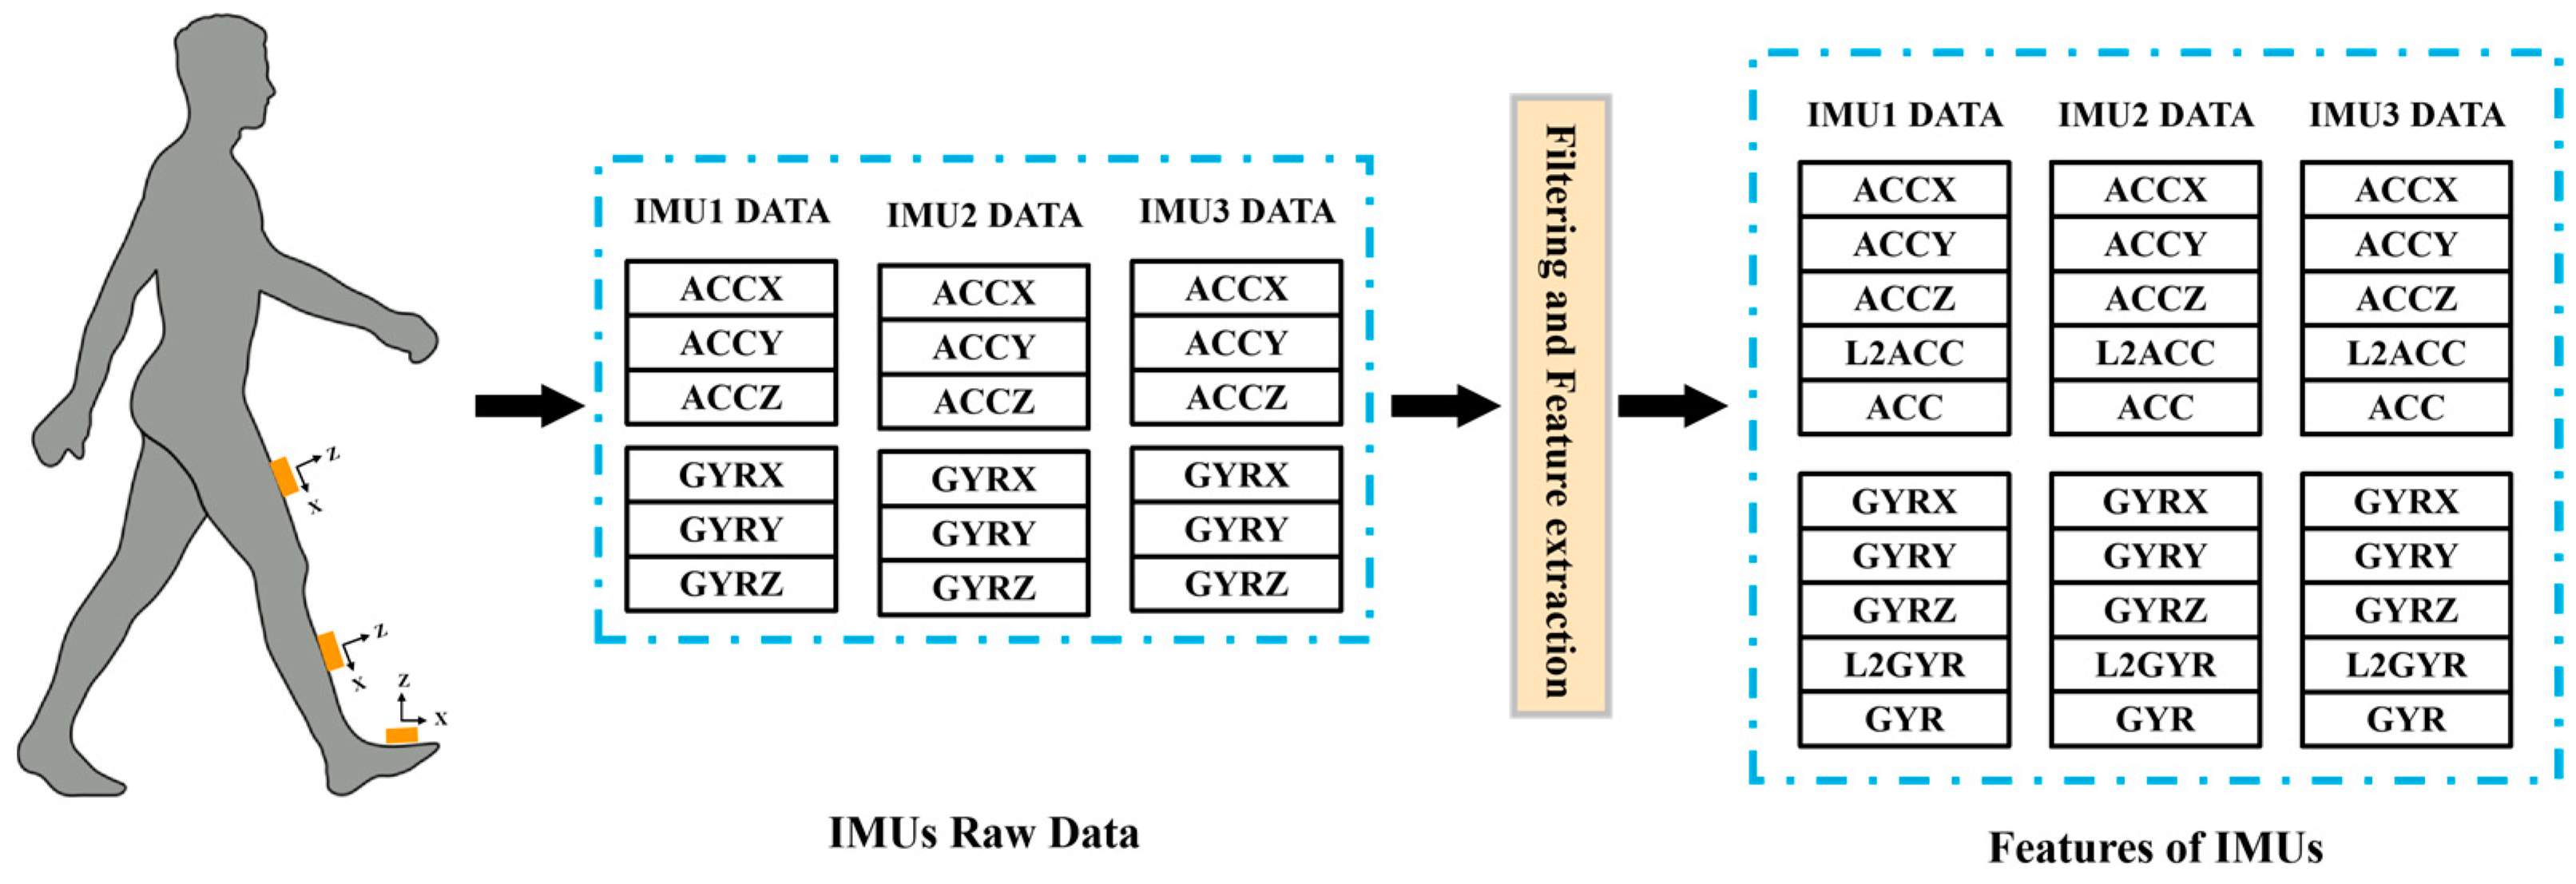
2.2. Data Preprocessing and Feature Extraction
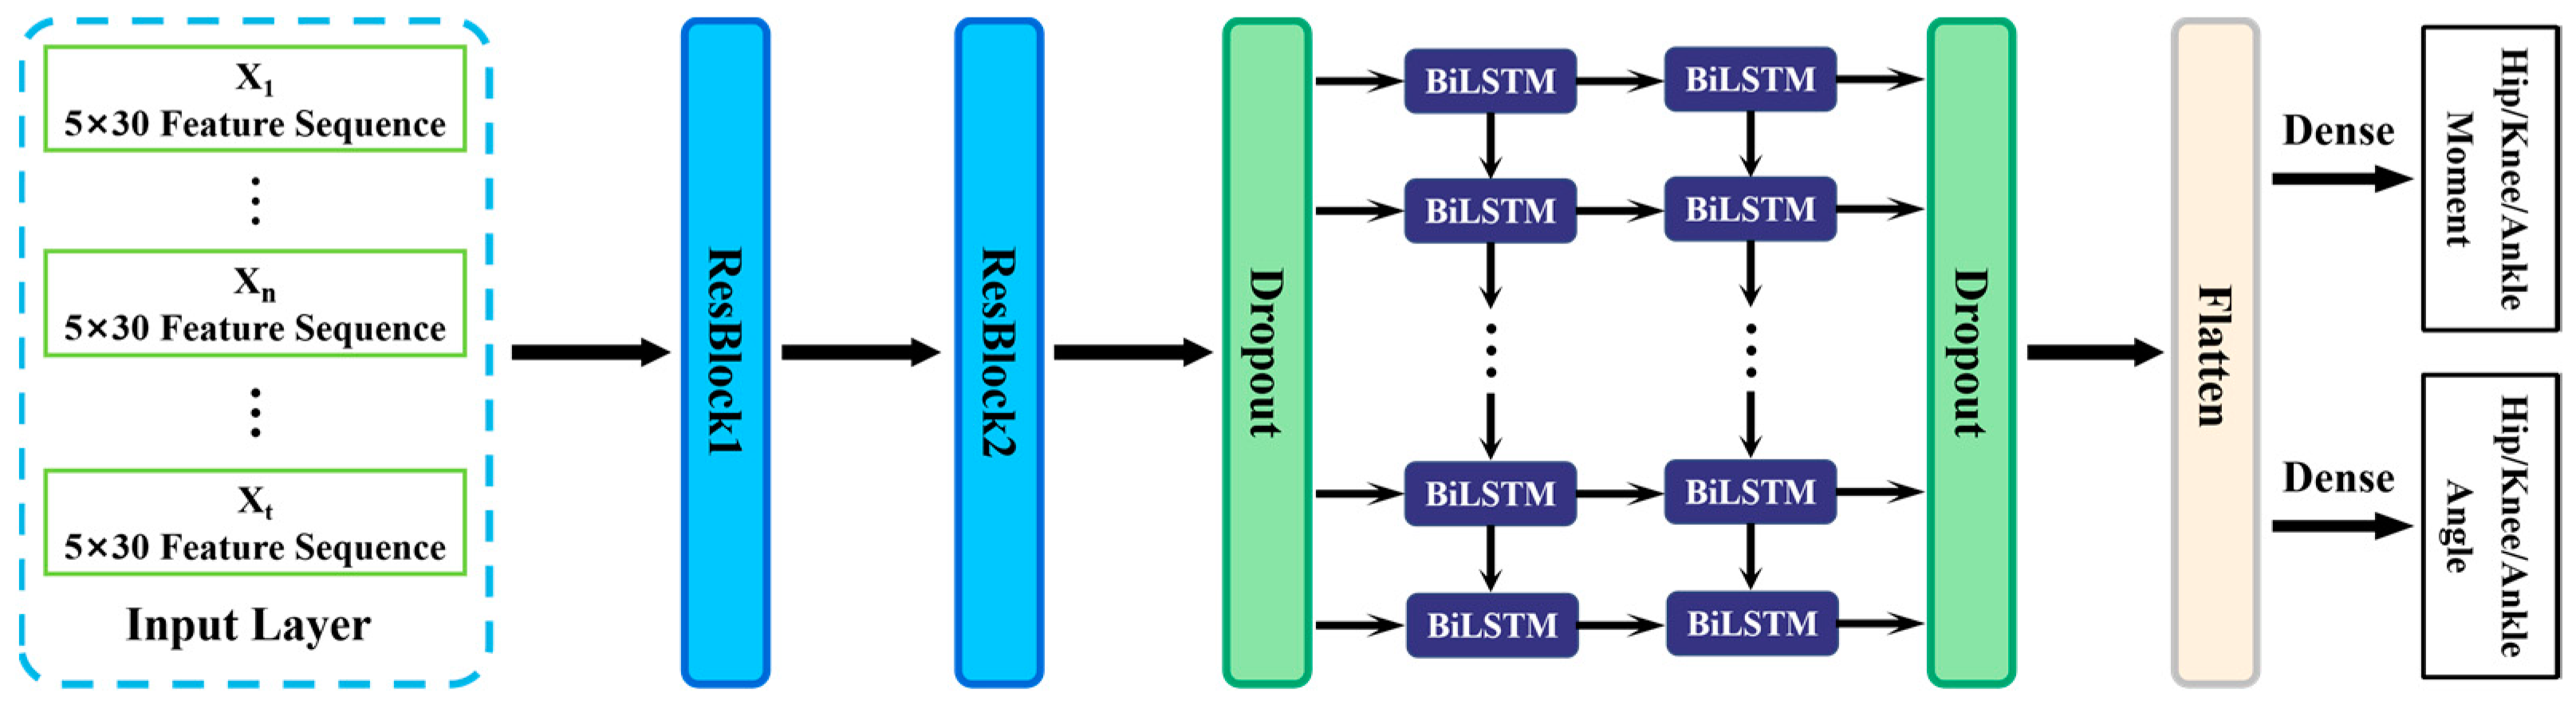
2.3. The Proposed TCN-BiLSTM Framework
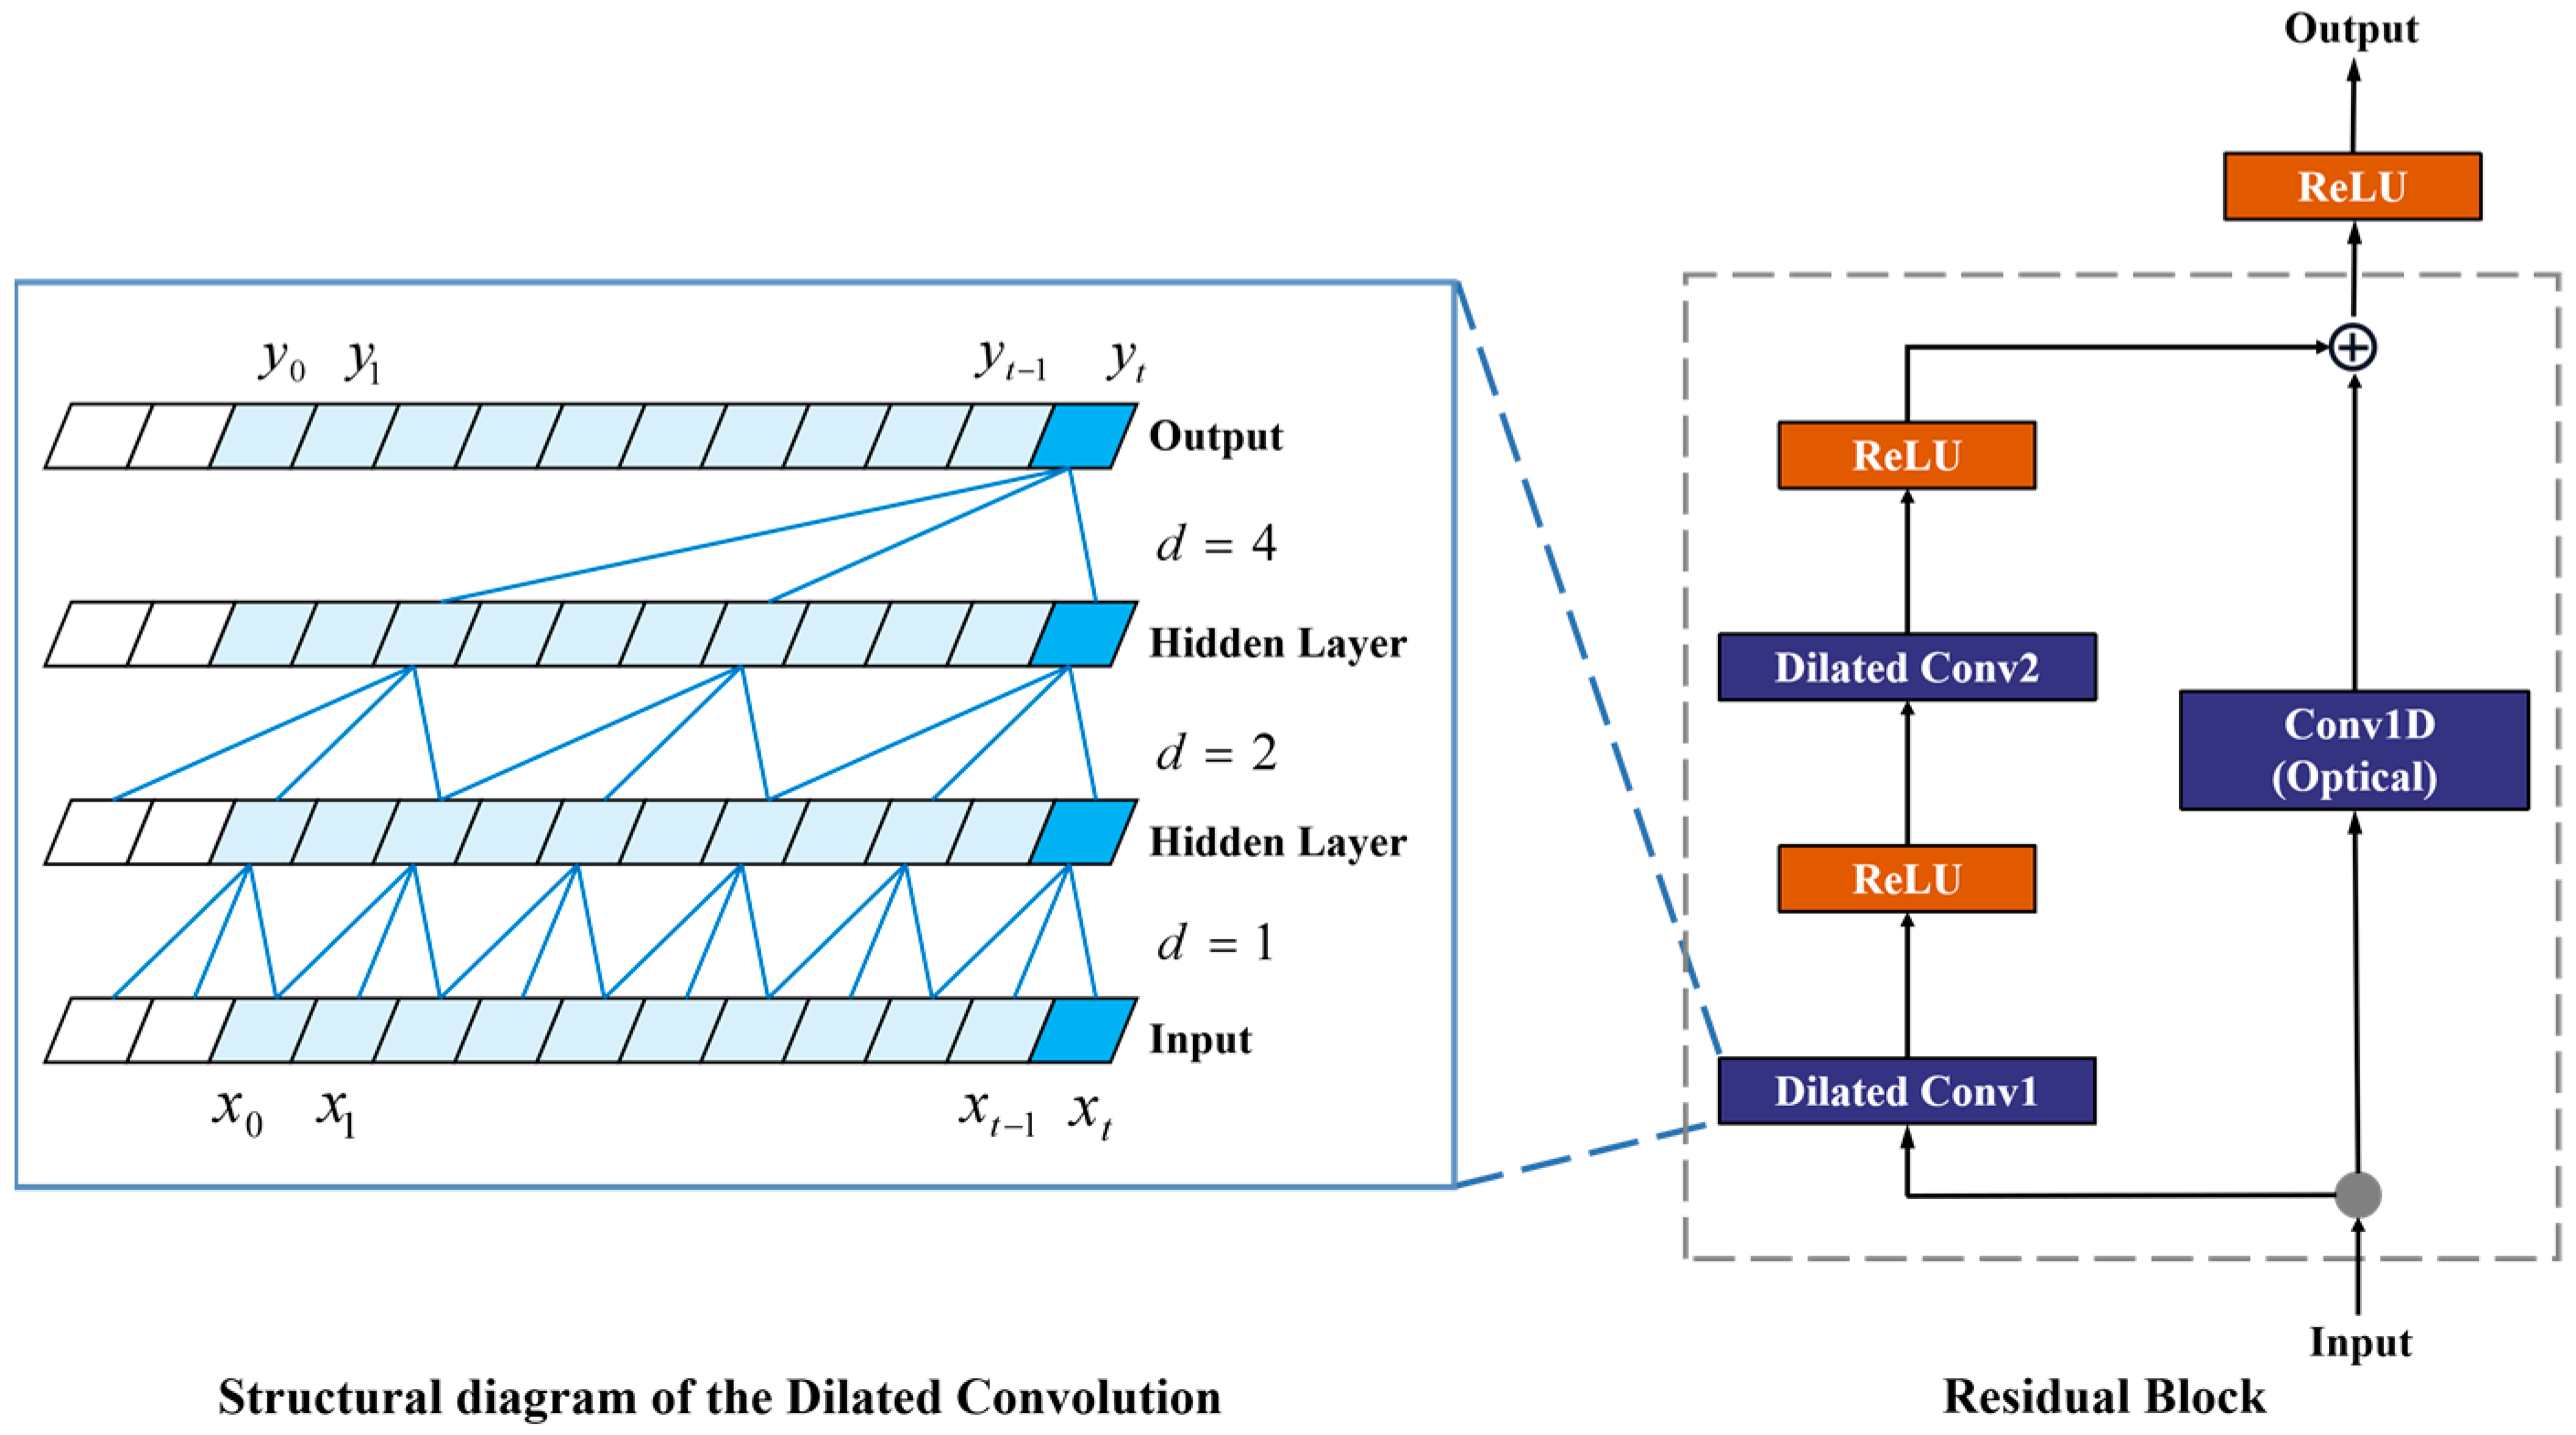
2.4. Temporal Convolutional Neural Network Module
2.5. BiLSTM Module
2.6. Baseline Models
2.7. Dataset Segmentation Strategy
2.8. Evaluation Metrics
2.9. Implementation Details
3. Results
4. Discussion
5. Conclusions
Author Contributions
Funding
Institutional Review Board Statement
Informed Consent Statement
Data Availability Statement
Conflicts of Interest
Appendix A


References
- Baker, R.; Esquenazi, A.; Benedetti, M.G.; Desloovere, K. Gait analysis: Clinical facts. Eur. J. Phys. Rehabil. Med. 2016, 52, 560–574. [Google Scholar] [PubMed]
- Fatoye, F.A.; Palmer, S.; van der Linden, M.L.; Rowe, P.J.; Macmillan, F. Gait kinematics and passive knee joint range of motion in children with hypermobility syndrome. Gait Posture 2011, 33, 447–451. [Google Scholar] [CrossRef] [PubMed]
- Weygers, I.; Kok, M.; Konings, M.; Hallez, H.; De Vroey, H.; Claeys, K. Inertial Sensor-Based Lower Limb Joint Kinematics: A Methodological Systematic Review. Sensors 2020, 20, 673. [Google Scholar] [CrossRef] [PubMed]
- Wang, X.; Kyrarini, M.; Ristic-Durrant, D.; Spranger, M.; Graeser, A. Monitoring of Gait Performance Using Dynamic Time Warping on IMU-Sensor Data. In Proceedings of the IEEE International Symposium on Medical Measurements and Applications (MeMeA), Benevento, Italy, 15–18 May 2016; pp. 268–273. [Google Scholar]
- Bakhshi, S.; Mahoor, M.H.; Davidson, B.S. Development of a body joint angle measurement system using IMU sensors. In Proceedings of the 33rd Annual International Conference of the IEEE Engineering-in-Medicine-and-Biology-Society (EMBS), Boston, MA, USA, 30 August–3 September 2011; pp. 6923–6926. [Google Scholar]
- Karatsidis, A.; Bellusci, G.; Schepers, H.M.; De Zee, M.; Andersen, M.S.; Veltink, P.H. Estimation of Ground Reaction Forces and Moments During Gait Using Only Inertial Motion Capture. Sensors 2017, 17, 75. [Google Scholar] [CrossRef] [PubMed]
- Ancillao, A.; Tedesco, S.; Barton, J.; O’flynn, B. Indirect Measurement of Ground Reaction Forces and Moments by Means of Wearable Inertial Sensors: A Systematic Review. Sensors 2018, 18, 2564. [Google Scholar] [CrossRef]
- Seel, T.; Raisch, J.; Schauer, T. IMU-Based Joint Angle Measurement for Gait Analysis. Sensors 2014, 14, 6891–6909. [Google Scholar] [CrossRef]
- Buchanan, T.S.; Lloyd, D.G.; Manal, K.; Besier, T.F. Neuromusculoskeletal modeling: Estimation of muscle forces and joint moments and movements from measurements of neural command. J. Appl. Biomech. 2004, 20, 367–395. [Google Scholar] [CrossRef]
- Picerno, P. 25 years of lower limb joint kinematics by using inertial and magnetic sensors: A review of methodological approaches. Gait Posture 2017, 51, 239–246. [Google Scholar] [CrossRef]
- Fan, B.; Li, Q.; Tan, T.; Kang, P.; Shull, P.B. Effects of IMU Sensor-to-Segment Misalignment and Orientation Error on 3-D Knee Joint Angle Estimation. IEEE Sens. J. 2022, 22, 2543–2552. [Google Scholar] [CrossRef]
- Dejnabadi, H.; Jolles, B.M.; Casanova, E.; Fua, P.; Aminian, K. Estimation and visualization of sagittal kinematics of lower limbs orientation using body-fixed sensors. IEEE Trans. Biomed. Eng. 2006, 53, 1385–1393. [Google Scholar] [CrossRef]
- Liu, K.; Liu, T.; Shibata, K.; Inoue, Y.; Zheng, R. Novel approach to ambulatory assessment of human segmental orientation on a wearable sensor system. J. Biomech. 2009, 42, 2747–2752. [Google Scholar] [CrossRef] [PubMed]
- Nazarahari, M.; Noamani, A.; Ahmadian, N.; Rouhani, H. Sensor-to-body calibration procedure for clinical motion analysis of lower limb using magnetic and inertial measurement units. J. Biomech. 2019, 85, 224–229. [Google Scholar] [CrossRef] [PubMed]
- Teachasrisaksakul, K.; Zhang, Z.Q.; Yang, G.Z. In situ sensor-to-segment calibration for whole body motion capture. In Proceedings of the 2015 IEEE 12th International Conference on Wearable and Implantable Body Sensor Networks (BSN), Cambridge, MA, USA, 9–12 June 2015; pp. 1–5. [Google Scholar]
- Mundt, M.; Thomsen, W.; Witter, T.; Koeppe, A.; David, S.; Bamer, F.; Potthast, W.; Markert, B. Prediction of lower limb joint angles and moments during gait using artificial neural networks. Med. Biol. Eng. Comput. 2020, 58, 211–225. [Google Scholar] [CrossRef] [PubMed]
- Bin Hossain, M.S.; Guo, Z.; Choi, H. Estimation of Hip, Knee, and Ankle Joint Moment Using a Single IMU Sensor on Foot Via Deep Learning. In Proceedings of the 7th IEEE/ACM Conference on Connected Health–Applications, Systems and Engineering Technologies (CHASE), Washington, DC, USA, 17–19 November 2022; pp. 25–33. [Google Scholar]
- Mundt, M.; Johnson, W.R.; Potthast, W.; Markert, B.; Mian, A.; Alderson, J. A Comparison of Three Neural Network Approaches for Estimating Joint Angles and Moments from Inertial Measurement Units. Sensors 2021, 21, 4535. [Google Scholar] [CrossRef]
- Sung, J.; Han, S.; Park, H.; Cho, H.-M.; Hwang, S.; Park, J.W.; Youn, I. Prediction of Lower Extremity Multi-Joint Angles during Overground Walking by Using a Single IMU with a Low Frequency Based on an LSTM Recurrent Neural Network. Sensors 2022, 22, 53. [Google Scholar] [CrossRef] [PubMed]
- Sun, T.; Li, D.; Fan, B.; Tan, T.; Shull, P.B. Real-Time Ground Reaction Force and Knee Extension Moment Estimation During Drop Landings Via Modular LSTM Modeling and Wearable IMUs. IEEE J. Biomed. Health Inform. 2023, 27, 3222–3233. [Google Scholar] [CrossRef]
- Lim, H.; Kim, B.; Park, S. Prediction of Lower Limb Kinetics and Kinematics during Walking by a Single IMU on the Lower Back Using Machine Learning. Sensors 2020, 20, 130. [Google Scholar] [CrossRef]
- Mundt, M.; Koeppe, A.; Bamer, F.; David, S.; Markert, B. Artificial Neural Networks in Motion Analysis—Applications of Unsupervised and Heuristic Feature Selection Techniques. Sensors 2020, 20, 4581. [Google Scholar] [CrossRef]
- Mundt, M.; Koeppe, A.; David, S.; Witter, T.; Bamer, F.; Potthast, W.; Markert, B. Estimation of Gait Mechanics Based on Simulated and Measured IMU Data Using an Artificial Neural Network. Front. Bioeng. Biotechnol. 2020, 8, 41. [Google Scholar] [CrossRef]
- Renani, M.S.; Eustace, A.M.; Myers, C.A.; Clary, C.W. The Use of Synthetic IMU Signals in the Training of Deep Learning Models Significantly Improves the Accuracy of Joint Kinematic Predictions. Sensors 2021, 21, 5876. [Google Scholar] [CrossRef]
- Camargo, J.; Ramanathan, A.; Flanagan, W.; Young, A. A comprehensive, open-source dataset of lower limb biomechanics in multiple conditions of stairs, ramps, and level-ground ambulation and transitions. J. Biomech. 2021, 119, 110320. [Google Scholar] [CrossRef] [PubMed]
- Molinaro, D.D.; Kang, I.; Camargo, J.; Gombolay, M.C.; Young, A.J. Subject-Independent, Biological Hip Moment Estimation During Multimodal Overground Ambulation Using Deep Learning. IEEE Trans. Med. Robot. Bionics 2022, 4, 219–229. [Google Scholar] [CrossRef]
- Ilyas, Z.; Anam, K.; Widjonarko; Avian, C.; Muttaqin, A.Z.; Ramadhan, M.E. Evaluation of Gated-Recurrent Unit for Estimating Finger-Joint Angle using Surface Electromyography Signal. In Proceedings of the 2022 9th International Conference on Electrical Engineering, Computer Science and Informatics (EECSI), Jakarta, Indonesia, 6–7 October 2022; pp. 25–28. [Google Scholar]
- Delp, S.L.; Anderson, F.C.; Arnold, A.S.; Loan, P.; Habib, A.; John, C.T.; Guendelman, E.; Thelen, D.G. OpenSim: Open-source software to create and analyze dynamic Simulations of movement. IEEE Trans. Biomed. Eng. 2007, 54, 1940–1950. [Google Scholar] [CrossRef] [PubMed]
- Bin Hossain, M.S.; Dranetz, J.; Choi, H.; Guo, Z. DeepBBWAE-Net: A CNN-RNN Based Deep SuperLearner for Estimating Lower Extremity Sagittal Plane Joint Kinematics Using Shoe-Mounted IMU Sensors in Daily Living. IEEE J. Biomed. Health Inform. 2022, 26, 3906–3917. [Google Scholar] [CrossRef] [PubMed]
- Molinaro, D.D.; Park, E.O.; Young, A.J. Anticipation and Delayed Estimation of Sagittal Plane Human Hip Moments using Deep Learning and a Robotic Hip Exoskeleton. In Proceedings of the 2023 IEEE International Conference on Robotics and Automation (ICRA), London, UK, 29 May–2 June 2023; pp. 12679–12685. [Google Scholar]
- Barua, A.; Zakia, U.; Menon, C.; Jiang, X. Deep Learning Techniques in Estimating Ankle Joint Power Using Wearable IMUs. IEEE Access 2021, 9, 83041–83054. [Google Scholar] [CrossRef]
- Bai, S.; Kolter, J.Z.; Koltun, V.J.A. An Empirical Evaluation of Generic Convolutional and Recurrent Networks for Sequence Modeling. arXiv 2018, arXiv:1803.01271. [Google Scholar]
- Siami-Namini, S.; Tavakoli, N.; Namin, A.S. The Performance of LSTM and BiLSTM in Forecasting Time Series. In Proceedings of the 2019 IEEE International Conference on Big Data (Big Data), Los Angeles, CA, USA, 9–12 December 2019; pp. 3285–3292. [Google Scholar]
- He, K.; Zhang, X.; Ren, S.; Sun, J. In Deep Residual Learning for Image Recognition. In Proceedings of the 2016 IEEE Conference on Computer Vision and Pattern Recognition (CVPR), Las Vegas, NV, USA, 27–30 June 2016; pp. 770–778. [Google Scholar]
- Gers, F.A.; Schmidhuber, J.; Cummins, F. Learning to Forget: Continual Prediction with LSTM. Neural Comput. 2000, 12, 2451–2471. [Google Scholar] [CrossRef]
- Tang, X.; Chen, H.; Xiang, W.; Yang, J.; Zou, M. Short-Term Load Forecasting Using Channel and Temporal Attention Based Temporal Convolutional Network. Electr. Power Syst. Res. 2022, 205, 107761. [Google Scholar] [CrossRef]
- Zhu, R.; Liao, W.; Wang, Y. Short-term prediction for wind power based on temporal convolutional network. Energy Rep. 2020, 6, 424–429. [Google Scholar] [CrossRef]
- Gholami, M.; Napier, C.; Menon, C. Estimating Lower Extremity Running Gait Kinematics with a Single Accelerometer: A Deep Learning Approach. Sensors 2020, 20, 2939. [Google Scholar] [CrossRef]
- De Brabandere, A.; Emmerzaal, J.; Timmermans, A.; Jonkers, I.; Vanwanseele, B.; Davis, J. A Machine Learning Approach to Estimate Hip and Knee Joint Loading Using a Mobile Phone-Embedded IMU. Front. Bioeng. Biotechnol. 2020, 8, 320. [Google Scholar] [CrossRef] [PubMed]
- Hossain, M.S.B.; Guo, Z.; Choi, H. Estimation of Lower Extremity Joint Moments and 3D Ground Reaction Forces Using IMU Sensors in Multiple Walking Conditions: A Deep Learning Approach. IEEE J. Biomed. Health Inform. 2023, 27, 2829–2840. [Google Scholar] [CrossRef] [PubMed]
- Ligorio, G.; Sabatini, A.M. A Novel Kalman Filter for Human Motion Tracking with an Inertial-Based Dynamic Inclinometer. IEEE Trans. Biomed. Eng. 2015, 62, 2033–2043. [Google Scholar] [CrossRef]
- Fan, B.; Li, Q.; Liu, T. Improving the accuracy of wearable sensor orientation using a two-step complementary filter with state machine-based adaptive strategy. Meas. Sci. Technol. 2018, 29, 115104. [Google Scholar] [CrossRef]
- Madgwick, S.O.H.; Wilson, S.; Turk, R.; Burridge, J.; Kapatos, C.; Vaidyanathan, R. An Extended Complementary Filter for Full-Body MARG Orientation Estimation. IEEE Trans. Mechatron. 2020, 25, 2054–2064. [Google Scholar] [CrossRef]
- Gui, P.; Tang, L.; Mukhopadhyay, S. MEMS Based IMU for Tilting Measurement: Comparison of Complementary and Kalman Filter Based Data Fusion. In Proceedings of the 10th IEEE Conference on Industrial Electronics and Applications, Auckland, New Zealand, 15–17 June 2015; pp. 1998–2003. [Google Scholar]
- Hernandez, V.; Dadkhah, D.; Babakeshizadeh, V.; Kulić, D. Lower body kinematics estimation from wearable sensors for walking and running: A deep learning approach. Gait Posture 2021, 83, 185–193. [Google Scholar] [CrossRef] [PubMed]
- Senanayake, D.; Halgamuge, S.; Ackland, D.C. Real-time conversion of inertial measurement unit data to ankle joint angles using deep neural networks. J. Biomech. 2021, 125, 110552. [Google Scholar] [CrossRef]
- Tan, T.; Wang, D.; Shull, P.B.; Halilaj, E. IMU and Smartphone Camera Fusion for Knee Adduction and Knee Flexion Moment Estimation During Walking. IEEE Trans. Ind. Inform. 2023, 19, 1445–1455. [Google Scholar] [CrossRef]
- Dorschky, E.; Nitschke, M.; Martindale, C.F.; Bogert, A.J.v.D.; Koelewijn, A.D.; Eskofier, B.M. CNN-Based Estimation of Sagittal Plane Walking and Running Biomechanics From Measured and Simulated Inertial Sensor Data. Front. Bioeng. Biotechnol. 2020, 8, 604. [Google Scholar] [CrossRef]
- Yoon, J.; Jarrett, D.; van der Schaar, M. Time-series Generative Adversarial Networks. Adv. Neural Inf. Process. Syst. 2019, 32. [Google Scholar]
- Sun, N.; Cao, M.; Chen, Y.; Chen, Y.; Wang, J.; Wang, Q.; Chen, X.; Liu, T. Continuous Estimation of Human Knee Joint Angles by Fusing Kinematic and Myoelectric Signals. IEEE Trans. Neural Syst. Rehabil. Eng. 2022, 30, 2446–2455. [Google Scholar] [CrossRef] [PubMed]


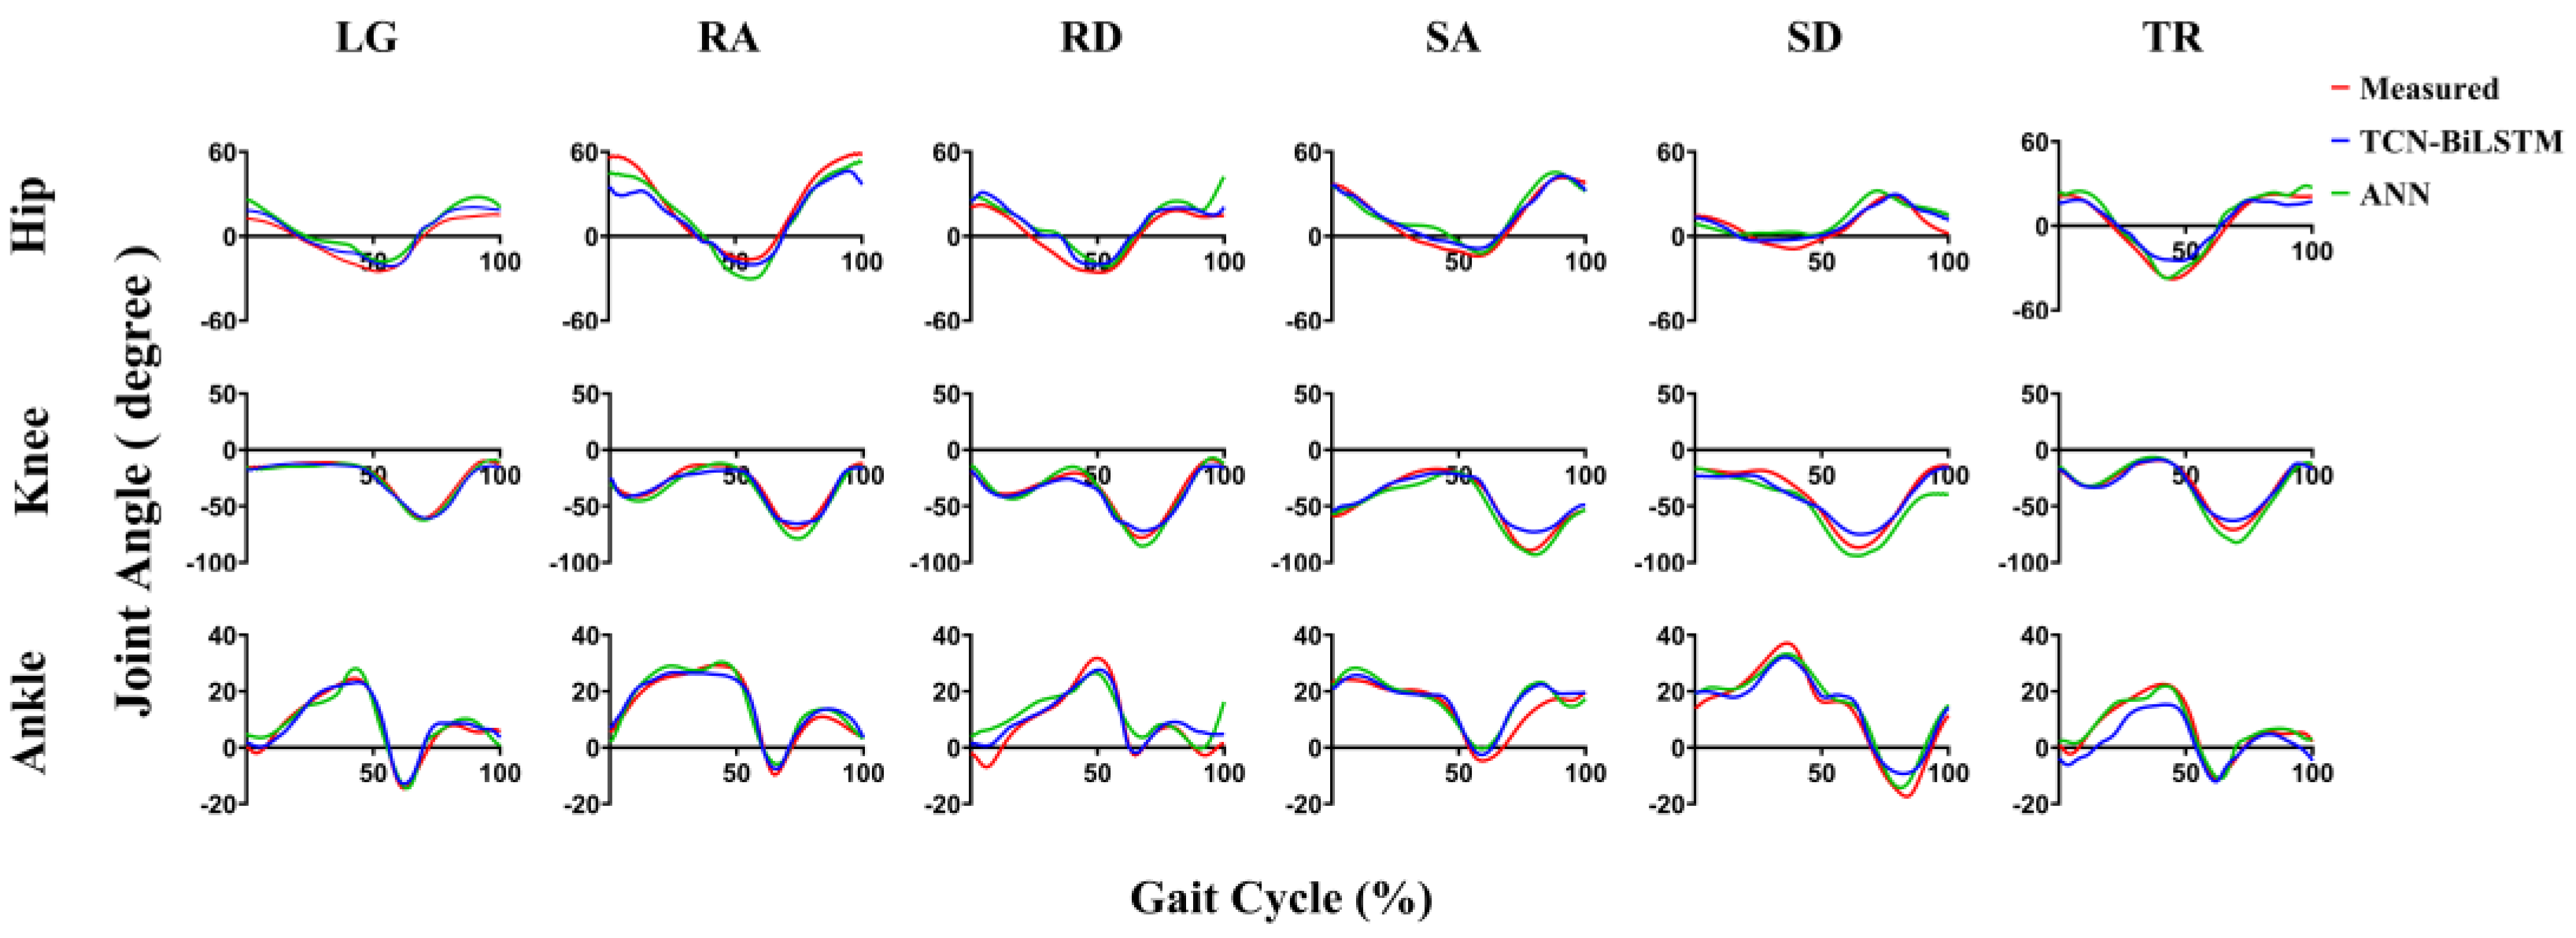
| Hip Joint | Knee Joint | Ankle Joint | ||||
|---|---|---|---|---|---|---|
| PCC | RMSE (°) | PCC | RMSE (°) | PCC | RMSE (°) | |
| Level Ground | 0.91 ± 0.08 | 9.47 ± 2.70 | 0.94 ± 0.06 | 7.75 ± 2.51 | 0.90 ± 0.05 | 4.36 ± 1.10 |
| Ramp | 0.89 ± 0.05 | 10.61 ± 2.89 | 0.92 ± 0.04 | 8.78 ± 2.29 | 0.89 ± 0.06 | 5.87 ± 1.08 |
| Stair | 0.90 ± 0.04 | 9.27 ± 2.93 | 0.95 ± 0.03 | 9.38 ± 2.13 | 0.92 ± 0.03 | 6.13 ± 1.00 |
| Treadmill | 0.95 ± 0.02 | 8.51 ± 2.71 | 0.95 ± 0.04 | 7.73 ± 2.14 | 0.91 ± 0.04 | 4.46 ± 0.92 |
| Mean | 0.91 ± 0.05 | 9.47 ± 2.81 | 0.94 ± 0.04 | 8.41 ± 2.27 | 0.91 ± 0.05 | 5.21 ± 1.03 |
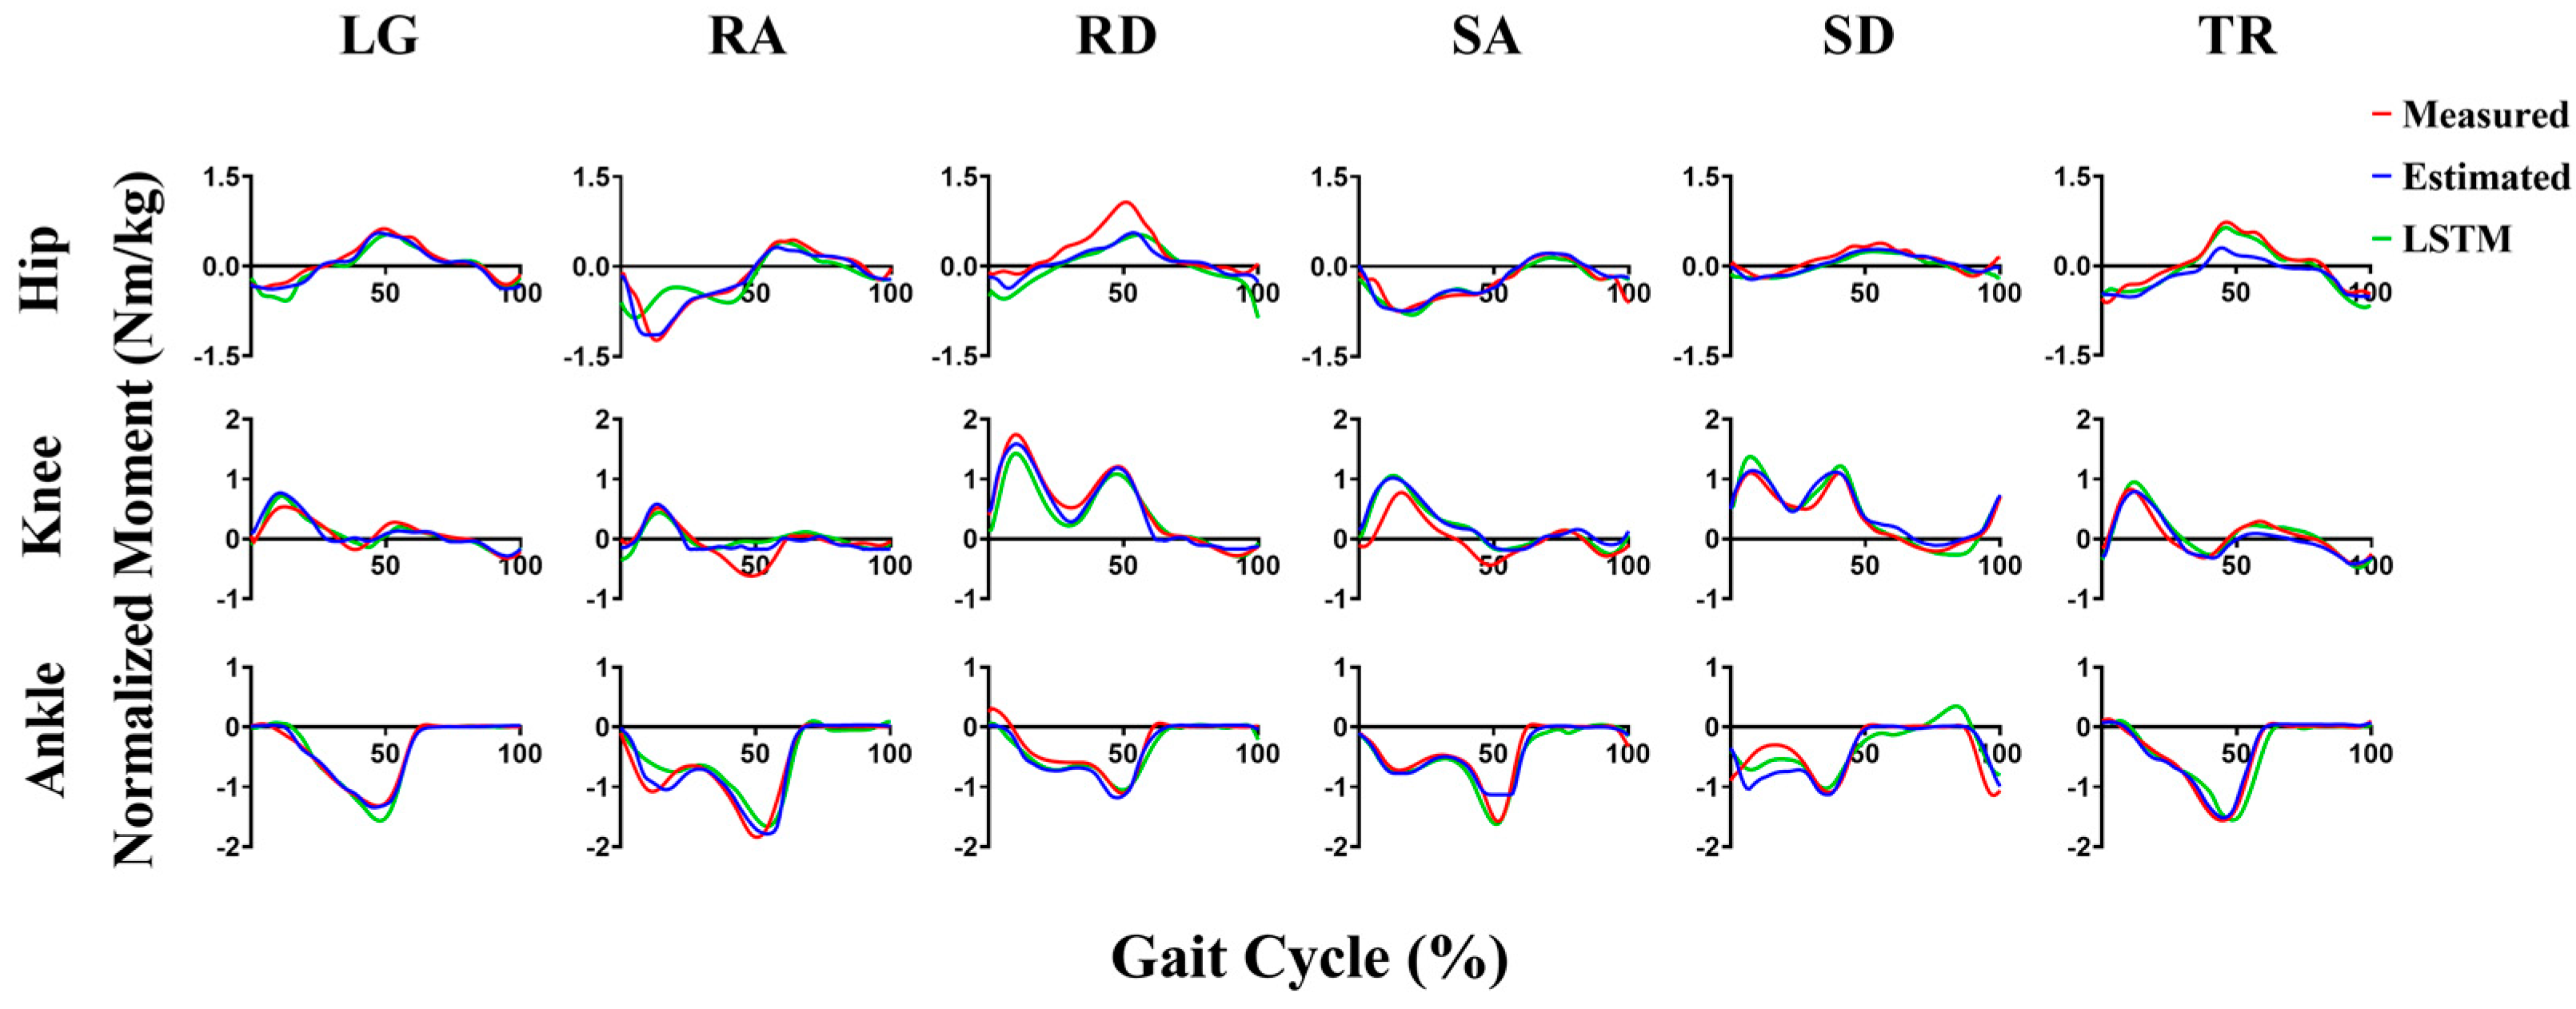
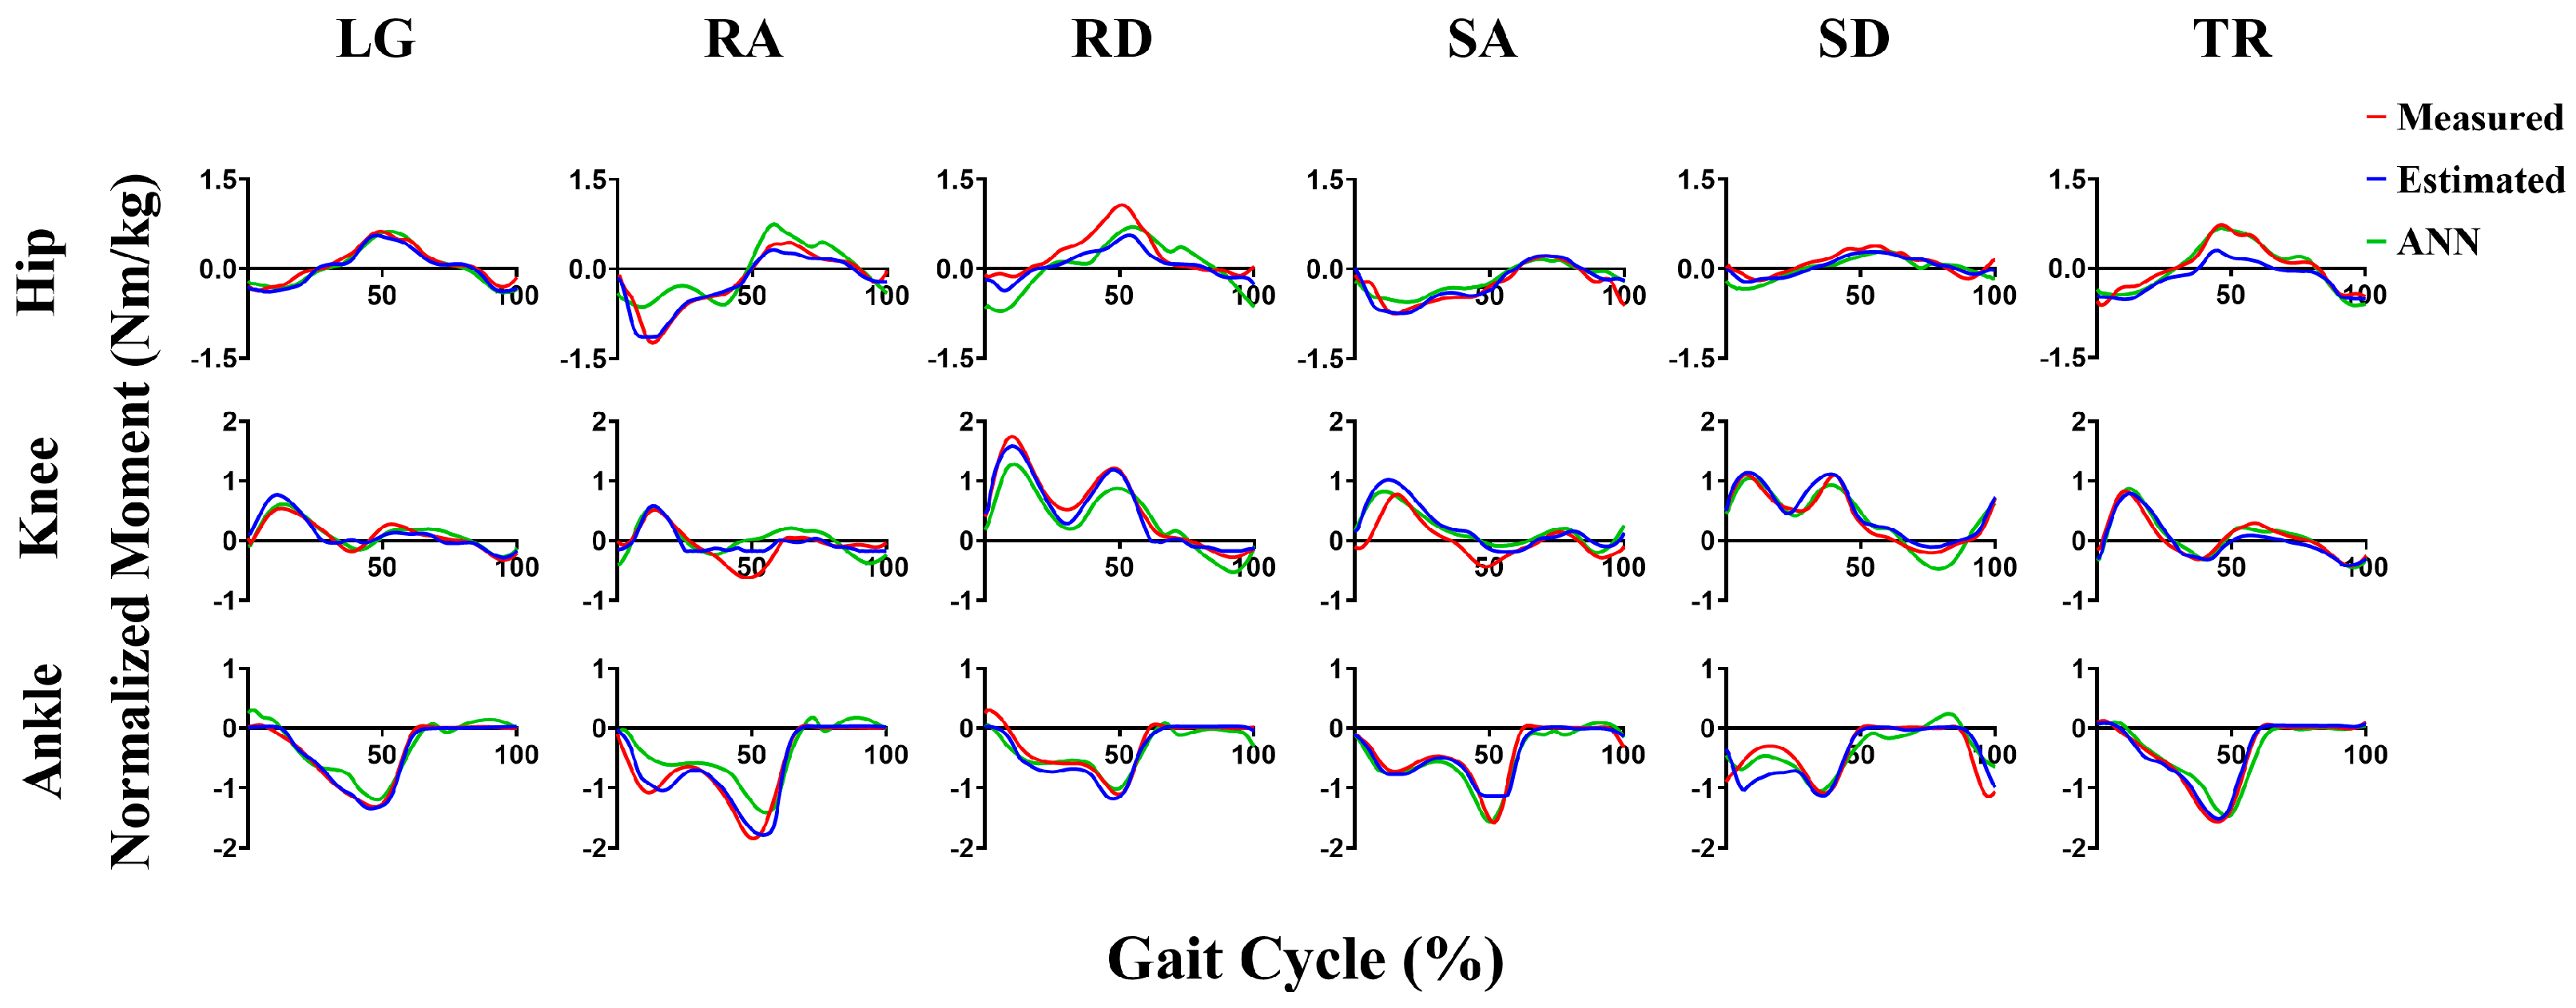
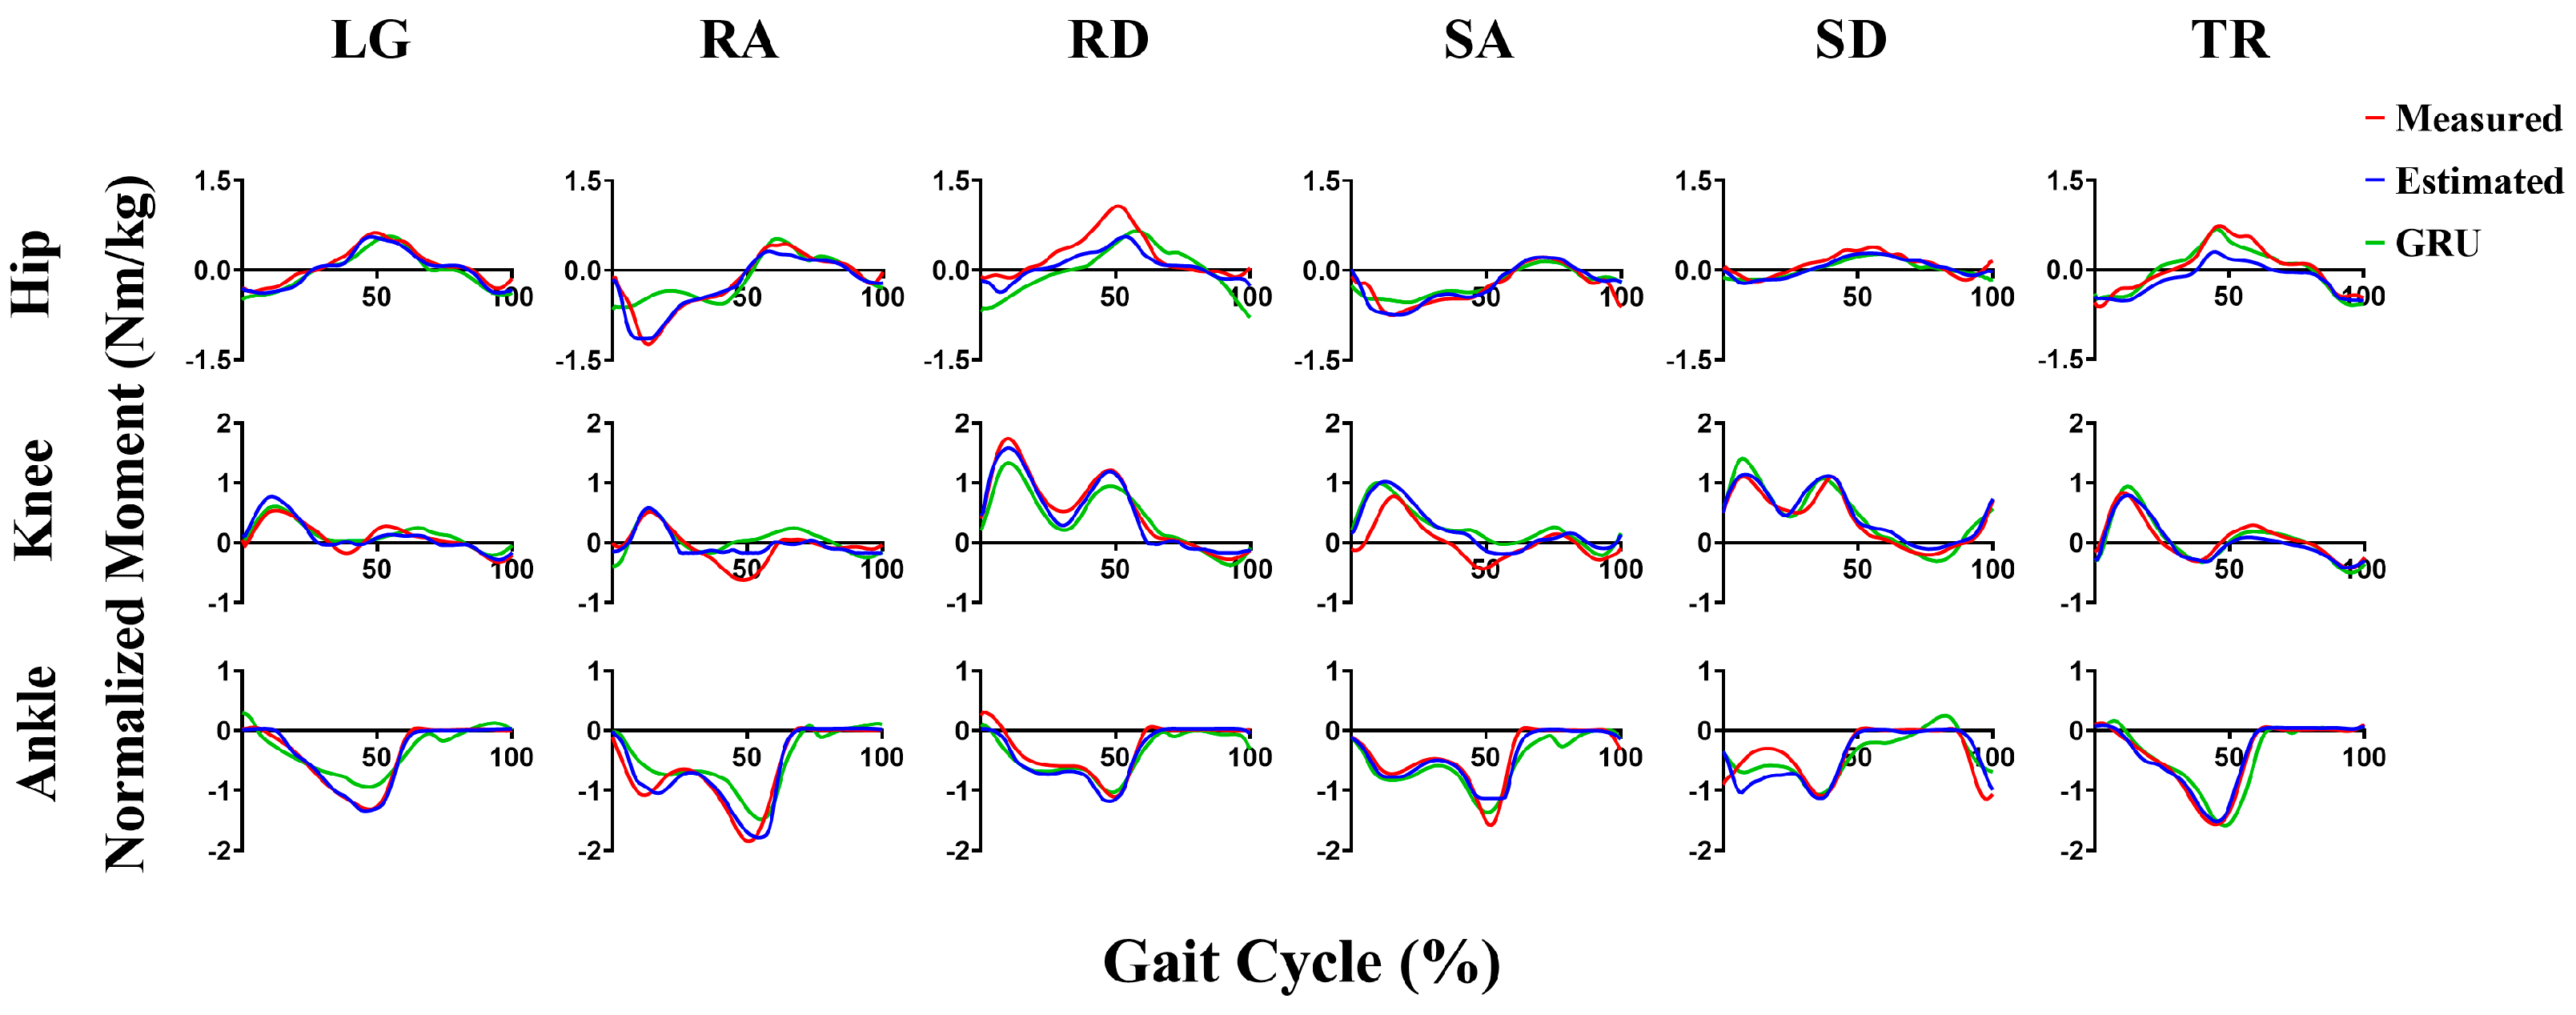
| Hip Joint | Knee Joint | Ankle Joint | ||||
|---|---|---|---|---|---|---|
| PCC | RMSE (Nm/kg) | PCC | RMSE (Nm/kg) | PCC | RMSE (Nm/kg) | |
| Level Ground | 0.80 ± 0.14 | 0.22 ± 0.09 | 0.72 ± 0.14 | 0.22 ± 0.07 | 0.87 ± 0.09 | 0.27 ± 0.08 |
| Ramp | 0.84 ± 0.07 | 0.29 ± 0.06 | 0.90 ± 0.04 | 0.25 ± 0.06 | 0.93 ± 0.04 | 0.20 ± 0.04 |
| Stair | 0.80 ± 0.05 | 0.19 ± 0.02 | 0.89 ± 0.04 | 0.22 ± 0.05 | 0.88 ± 0.05 | 0.23 ± 0.04 |
| Treadmill | 0.94 ± 0.02 | 0.22 ± 0.06 | 0.90 ± 0.05 | 0.16 ± 0.04 | 0.94 ± 0.05 | 0.20 ± 0.06 |
| Mean | 0.85 ± 0.07 | 0.23 ± 0.06 | 0.85 ± 0.07 | 0.21 ± 0.06 | 0.91 ± 0.06 | 0.23 ± 0.06 |
| LSTM | ANN | GRU | TCN-BiLSTM | |
|---|---|---|---|---|
| Level Ground | 0.90 * | 0.90 * | 0.85 * | 0.91 |
| Ramp | 0.86 * | 0.88 | 0.84 * | 0.90 |
| Stair | 0.90 * | 0.90 * | 0.89 * | 0.92 |
| Treadmill | 0.94 | 0.95 * | 0.94 | 0.94 |
| LSTM | ANN | GRU | TCN-BiLSTM | |
|---|---|---|---|---|
| Level Ground | 0.76 * | 0.78 * | 0.74 * | 0.80 |
| Ramp | 0.82 * | 0.81 * | 0.81 * | 0.89 |
| Stair | 0.84 * | 0.81 * | 0.82 * | 0.86 |
| Treadmill | 0.92 | 0.93 | 0.92 | 0.93 |
Disclaimer/Publisher’s Note: The statements, opinions and data contained in all publications are solely those of the individual author(s) and contributor(s) and not of MDPI and/or the editor(s). MDPI and/or the editor(s) disclaim responsibility for any injury to people or property resulting from any ideas, methods, instructions or products referred to in the content. |
© 2023 by the authors. Licensee MDPI, Basel, Switzerland. This article is an open access article distributed under the terms and conditions of the Creative Commons Attribution (CC BY) license (https://creativecommons.org/licenses/by/4.0/).
Share and Cite
Wang, F.; Liang, W.; Afzal, H.M.R.; Fan, A.; Li, W.; Dai, X.; Liu, S.; Hu, Y.; Li, Z.; Yang, P. Estimation of Lower Limb Joint Angles and Joint Moments during Different Locomotive Activities Using the Inertial Measurement Units and a Hybrid Deep Learning Model. Sensors 2023, 23, 9039. https://doi.org/10.3390/s23229039
Wang F, Liang W, Afzal HMR, Fan A, Li W, Dai X, Liu S, Hu Y, Li Z, Yang P. Estimation of Lower Limb Joint Angles and Joint Moments during Different Locomotive Activities Using the Inertial Measurement Units and a Hybrid Deep Learning Model. Sensors. 2023; 23(22):9039. https://doi.org/10.3390/s23229039
Chicago/Turabian StyleWang, Fanjie, Wenqi Liang, Hafiz Muhammad Rehan Afzal, Ao Fan, Wenjiong Li, Xiaoqian Dai, Shujuan Liu, Yiwei Hu, Zhili Li, and Pengfei Yang. 2023. "Estimation of Lower Limb Joint Angles and Joint Moments during Different Locomotive Activities Using the Inertial Measurement Units and a Hybrid Deep Learning Model" Sensors 23, no. 22: 9039. https://doi.org/10.3390/s23229039
APA StyleWang, F., Liang, W., Afzal, H. M. R., Fan, A., Li, W., Dai, X., Liu, S., Hu, Y., Li, Z., & Yang, P. (2023). Estimation of Lower Limb Joint Angles and Joint Moments during Different Locomotive Activities Using the Inertial Measurement Units and a Hybrid Deep Learning Model. Sensors, 23(22), 9039. https://doi.org/10.3390/s23229039