Abstract
Atmospheric drag is an important influencing factor in precise orbit determination and the prediction of low-orbit space debris. It has received widespread attention. Currently, calculating atmospheric drag mainly relies on different atmospheric density models. This experiment was designed to explore the impact of different atmospheric density models on the orbit prediction of space debris. In the experiment, satellite laser ranging data published by the ILRS (International Laser Ranging Service) were used as the basis for the precise orbit determination for space debris. The prediction error of space debris orbits at different orbital heights using different atmospheric density models was used as a criterion to evaluate the impact of atmospheric density models on the determination of space-target orbits. Eight atmospheric density models, DTM78, DTM94, DTM2000, J71, RJ71, JB2006, MSIS86, and NRLMSISE00, were compared in the experiment. The experimental results indicated that the DTM2000 atmospheric density model is best for determining and predicting the orbits of LEO (low-Earth-orbit) targets.
1. Introduction
Atmospheric drag is an important influencing factor in determining and predicting the orbits of low-orbit space debris. Density distribution is a key physical quantity in studies of the variation laws of satellite motion under the influence of atmospheric drag. The so-called atmospheric density model is a mathematical model that calculates atmospheric density and its changes at corresponding time positions based on relevant parameters [1,2,3,4].
At present, some of the most commonly used atmospheric density models for space debris orbit determination and prediction include the Jacchia series, the Mass Spectrometer Incoherent Scatter Radar (MSIS) series, the Drag Temperature Model (DTM) series, and so on [5]. MSIS is an empirical atmospheric density model series that combines approximate neutral gas particle density, temperature, and solar radiation flux (F10.7) values, and values describing the geomagnetic activity (Ap) levels. The mathematical model of this mode is a spherical harmonic suitable for remote observation with multiple satellites [6,7,8,9,10]. The Jacchia model series is an atmospheric model established using satellite orbital decay data, and a series of other models have been developed based on this foundation, such as Jacchia–Bowman 2006. The basis for the Jacchia–Bowman 2006 (JB2006) atmospheric density model is the COSPAR International Reference Atmosphere 72 (CIRA72) atmospheric density model. The JB2006 model uses a new half-year density equation to replace the old equation in the Jacchia model series with a new solar index. In addition, several other equation-modeling methods have been incorporated in the JB2006 model to correct daily variations in errors [11,12,13,14]. DTM is a semi-empirical model that describes the temperature, density, and composition of the Earth’s thermosphere. The earliest DTM model is based on the Jacchia model, which more accurately represents the atmospheric density under extreme solar and geomagnetic conditions compared to the Jacchia model. The DTM model series is the result of simulation under moderate solar conditions, making it suitable for various applications [15,16,17].
There are two main ways to evaluate the performance of the above density modes: first, comparative analysis at the density level; second, analysis of the application level of orbit prediction [18]. Qiu Hongxing analyzed the impact of eight commonly used atmospheric density models on orbit prediction accuracy using GPS data [19]. Liu Wei and others used GPS data from the Tiangong Space Station to analyze the impact of atmospheric density models under different geomagnetic and solar radiance intensities on orbit prediction accuracy [20].
In the application of space target orbit determination, we found that some atmospheric density models do not seem to be ideal. When using satellite laser ranging data released by the ILRS [21] for orbit determination, some atmospheric density models are unable to perform orbit determination. In the case of using certain atmospheric models, the process of iteratively fitting observation data for orbit prediction in orbit determination calculations does not converge, making it impossible to complete orbit determination calculations. Therefore, an idea emerged to quantitatively compare the advantages and disadvantages of different atmospheric density models. Based on previous research [22,23,24,25], this method uses satellite laser ranging data published by the ILRS for orbit determination. This method evaluates the impact of different atmospheric density models on orbit prediction by using several specific space targets to represent retired satellites in space debris types. In contrast to the GPS data mentioned above, the laser ranging data of the experimental target can be easily obtained from the official website of the ILRS. By comparing orbital prediction errors, we can study the impact of different atmospheric density models on orbital prediction accuracy.
2. Basic Methods
We performed the orbit determination of space targets in this experiment using the following methodology [26,27]:
- (1)
- Obtain measurement data;
- (2)
- Preprocess measurement data to eliminate outliers;
- (3)
- Set parameters for each dynamic model;
- (4)
- Obtain the initial position velocity, and bring it into the mechanical model to obtain the acceleration for orbit integration calculations;
- (5)
- Obtain orbit prediction at the target time, incorporate observation values, and use appropriate algorithms for iterative calculations. In this experiment, the least squares method was applied to calculate the correction using observed data;
- (6)
- Calculate the difference between the position vector obtained from the iteration of the epoch time and the observation data. Determine whether the difference is less than the preset convergence limit, and, if it is less, the orbit determination calculation is completed. It is also possible to determine whether the orbit determination calculation is completed by iteratively calculating the correction value. If the correction value is less than the preset convergence limit, the orbit determination calculation is completed. This experiment uses correction values to determine convergence.
The basic steps for orbit prediction in this experiment are as follows:
- (1)
- Obtain the initial range velocity (IRV). In this experiment, IRV refers to the position and velocity parameters of the experimental target at the beginning of the prediction;
- (2)
- Bring this IRV into the mechanical model to calculate the acceleration value of targets at this epoch;
- (3)
- Incorporate the position parameters, velocity parameters, and acceleration values into the orbit integrator to calculate the position and velocity parameters 30 s afterward. This experiment uses an Adam Cowell integrator with an integration period of 30 s;
- (4)
- From step 3, we can obtain new position and velocity parameters. Introduce new positional velocity parameters into the dynamic model to obtain the acceleration values at the new epoch;
- (5)
- Incorporate the position parameters, velocity parameters, and acceleration values obtained from step 4 into the orbit integrator to calculate position and velocity parameters 30 s afterwards;
- (6)
- Repeat steps 4 and 5 until the target time position is reached.
In the above orbit determination and prediction calculations, atmospheric drag is an important component of the dynamic model. The atmospheric density is an important parameter for calculating atmospheric drag; therefore, the atmospheric density model affects the orbit determination and prediction of space debris in low Earth orbit.
In this way, the errors caused by different atmospheric density models will continue to accumulate and amplify.
There are currently not many low Earth orbit space debris observations with high-precision observation data. As one of the sources of space debris, scrapped satellites are used to represent space debris in this study. Laser ranging data are an important component of high-precision observation data for space targets. Therefore, this study selected satellite data publicly released by ILRS as the experimental object. Although the experimental target has not yet been scrapped, it has the same operational logic as space debris when these targets do not transfer their orbits. In this experiment, three days of laser ranging data were used to determine and predict orbits. This ensured that the target to be calculated had sufficient data points. Some low-orbit targets have limited observation data points, making it difficult to determine their orbits with daily data. Observation outliers need to be removed before orbit determination. In this experiment, we used a simplified dynamic model (SGP4) for orbit prediction to screen out observation data with errors greater than the preset limits. Orbit determination calculation is a continuous iterative fitting calculation that utilizes observation data and orbit prediction results. For low-Earth-orbit satellites, if the time span of the observation data is too large, the accumulated error in orbit prediction will be very large. When performing orbit determination iteration calculations, the fitting calculation results will not converge. If the reference observation data time span is too long, it will result in a large quantity of valid data being removed as outliers. Therefore, we ultimately decided to choose three days of observation data. For example, using data from 1 January to 3 January 2015, orbit determination and prediction were carried out to obtain the space debris prediction velocity and position parameters (P) from 0:00 on 5 January 2015 to 0:00 on 6 January 2015, UTC time. We then compared the orbit prediction results, P, with the orbit determination results from January 5th, D, and calculated the ERROR value (unit: m) as the evaluation value for the different atmospheric density models. The ERROR equation is as follows:
In this equation, D is the result of orbit determination, and P is the position parameter of the orbit prediction. In this experiment, one data point was obtained every minute. Therefore, there were a total of 1441 data points for orbit prediction from 24 h to 48 h. The larger the value obtained, the lower the accuracy.
To quantitatively evaluate the impact of different atmospheric density models on the space debris orbit determination calculation, we propose the following method: extrapolate the average accuracy of the prediction error from 24 to 48 h, calculated using different atmospheric density models for target space debris at different altitudes, from high to low. The scoring method is to rank the prediction errors of different density models in the same time period from small to large. Because this article considers a total of eight models, the score is inversely proportional to the error ranking with a score from 8 to 1. The highest score is 8 points, and the lowest score is 1 point. Thus, by adding up the accuracy scores of the same target debris and atmospheric densities throughout the year, we can obtain emission scores ranging from high to low for different orbital altitude and atmospheric density models. Based on this series of scoring results, a quantitative evaluation can be performed based on the impact of different atmospheric density models on the orbit determination calculations.
3. Selection of Experimental Data
Taking the DTM atmospheric model as an example, the density of the thermosphere atmosphere at an altitude of 120–1500 km can be calculated using the following equations [16,28]:
where . is the outer atmospheric temperature, is the diffusion coefficient of He and H, is the atomic or molecular mass of the component, is the gravitational acceleration at 120 km altitude, is the vertical temperature gradient, k is the Boltzmann constant, is the altitude, is the density of component i at an altitude of 120 km, and is used to describe periodic and nonperiodic changes. Periodic changes are defined as annual and semiannual terms, as well as diurnal, semidiurnal, and terdiurnal terms [16].
The above equations show that the solar radio flux and the geomagnetic index are important factors affecting the atmospheric density. F10.7 is the solar radiation flux at a wavelength of 10.7 cm (2800 MHz), which can well describe the radiation level of the Sun [28,29,30,31,32,33,34,35]. Figure 1 shows the time variation of the F10.7 radiation intensity; the data are from the public data of the National Oceanic and Atmospheric Administration [36].
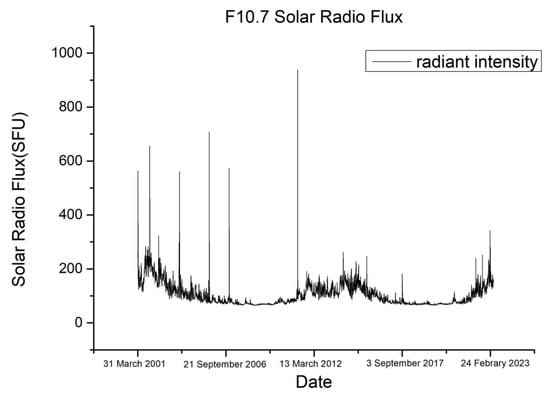
Figure 1.
F10.7 solar radio flux versus time.
Figure 1 shows that the solar flux intensity reached a peak in 2015. The solar intensity changed dramatically in that year, so we used the 2015 data for this experiment. This experiment used space debris laser ranging data publicly released by the ILRS as the basis for orbit determination and prediction. Target selection should strive to cover different orbital altitudes. Based on the above requirements, the target space debris selected for this experiment is described in Table 1 based on public data [37,38].

Table 1.
Selection of space debris for the experimental target.
For low-orbit space debris, atmospheric drag is the most important non-conservative perturbation force affecting its orbit, and its calculation method is as follows:
In the equation, is the drag coefficient of the space debris, is the windward area of the space debris perpendicular to the direction of the motion velocity, is the velocity of the space debris relative to the atmosphere, is the unit vector of , is the atmospheric density. Therefore, the acceleration generated by atmospheric resistance can be expressed as:
In the equation, is the area-mass ratio, which is a parameter describing the physical characteristics of the space debris and an important parameter for calculating the impact of atmospheric drag on the space debris.
The data volume of these five satellites is relatively sufficient, and their geometric shapes are relatively simple. They cover a track altitude ranging from 450 km to 1500 km, and their mission time range just covers the solar variation peak in 2015. The processing results of these five satellites can represent the space debris, which is the retired satellites with small area-mass ratios.
The perturbation force of space debris in low Earth orbit can be divided into two categories: the conservative forces and the non-conservative forces. The conservative forces include the gravity of the Earth; the gravity of the Sun, the Moon, and other celestial bodies; the solid tide and ocean tide perturbation; and the relativistic perturbation. The non-conservative forces include the atmospheric resistance, the solar light pressure, the Earth-shine radiation pressure, etc. [39,40,41]. The influence of the atmospheric model explored on orbit determination in this experiment is a non-conservative force perturbation. To control the variables, the same model is used for all other perturbations.
- The 70-order JGM3 Earth gravity field model is used for the Earth gravity calculation [42];
- The planetary ephemeris DE200 provided by the Jet Propulsion Laboratory (JPL) of the United States is used to calculate the gravity of the solar, lunar, and other celestial bodies [43];
- The TOPEX 3.0 model is used for ocean tide perturbation calculation, and the solid tide calculation is represented by the coefficient change in the spherical harmonics of the Earth’s gravity field [26,27];
- The relativistic perturbation can be calculated using the following equation [44]:
- The non-conservative force solar light pressure and the Earth radiation pressure are related to the Sun–Earth position and the solar flux intensity; This study computes the Earth radiation pressure according to a Ph.D. dissertation by Knocke P, 1989 [45]; The solar radiation pressure in this study is modeled by the following equations [46]:where,k is the Earth shadow factor;is the unit vector from the satellite to the Sun;, , and the area-to-mass-ratio can be treated as the parameters related to the space target;Au is the astronomical unit in meters;r is the distance between the satellite and the Sun in meters;Ps is the solar radiation pressure near the Earth;
- The Cowell numerical integration method is adopted for integration calculation, and the calculation is carried out in 30 s steps;
- The initial orbit state vector calculated for orbit determination includes the position vector and the velocity vector at the initial time, both of which are calculated according to the TLE (tow line element) published by NORAD.
4. Data-Processing Results
The data disclosed by the ILRS included data from multiple satellite laser ranging stations. Orbit determination and prediction were performed on a single satellite over three days of multi-station data. We evaluated and calculated the ERROR value according to the method described in Section 2. Taking the 2015 data processing results of the SpinSat satellite as an example, the orbit prediction errors of the different atmospheric density models are described in Table 2.

Table 2.
Prediction error of SpinSat using different atmospheric density models in 2015.
The orbit altitude of the SpinSat satellite is 425 km. The first column in the table is the time of the root mean square error (RMSE). Next, each column shows the prediction errors of the different atmospheric density models. The unit of error is in meters. In the table, “none” represents a failure to successfully determine the orbit using the model.
According to the method described in Section 2 and the prediction error results in Table 2, the error ranking table obtained is as in Table 3.

Table 3.
Table of scores for the 1-day prediction error of SpinSat using different atmospheric density models in 2015.
By calculating the scores in each column, we determined the advantages and disadvantages of the orbital prediction applications for the different atmospheric density models at a 425 km orbital altitude in 2015.
Table 4 shows the calculation results of the laser ranging data for all of 2015. The columns represent different atmospheric density models, and each row represents satellites with different orbital altitudes. Using the 2015 global station laser ranging data for orbit determination and prediction for different atmospheric density models, Table 4 shows the quantitative evaluation ranking scores of the atmospheric density models with different orbital altitudes based on the evaluation method proposed in Section 2. The scores for each grid in Table 4 are the sum of the corresponding model’s application scores for the orbit prediction throughout 2015. Taking the corresponding score of the DTM78 column in the Spinsat row as an example, this score is the sum of all the scores in the DTM78 column in Table 3.

Table 4.
One-day prediction error scores for different atmospheric density models at different orbital altitudes in 2015.
From Table 4, it is not difficult to see that the different atmospheric density models have different impacts on the accuracy of orbit determination and prediction for satellites with different orbital altitudes. The representative accuracy calculation results from the 2015 data are taken and plotted below.
In Figure 2, the vertical axis represents the prediction error of different atmospheric density models in meters, and the horizontal axis is the time since 00:00 on the first day of observation data in days. Based on the data in Table 4, DTM2000 and RJ71 are more suitable for orbit determination and prediction calculated using global laser ranging data at an orbital altitude of 400 km.
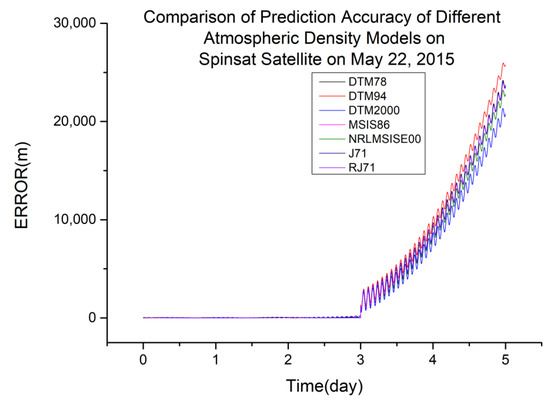
Figure 2.
Comparison of the prediction accuracies of different atmospheric density models using the SpinSat satellite from 22 May 2015.
As shown in Table 4, NRLMSISE00 is more suitable for orbit determination and prediction calculated using global laser ranging data at an orbital altitude of 485 km. Figure 3 shows a typical scenario.
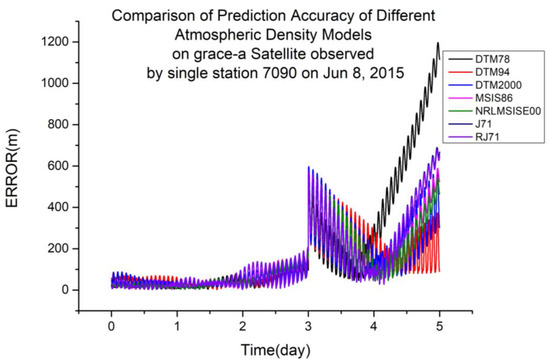
Figure 3.
Comparison of the prediction accuracies of different atmospheric density models using the GRACE-A satellite on 5 July 2015.
As shown in Table 4, JB2006 is more suitable for orbit determination and prediction calculated using global laser ranging data at an orbital altitude of 720 km. Figure 4 shows a typical scenario.
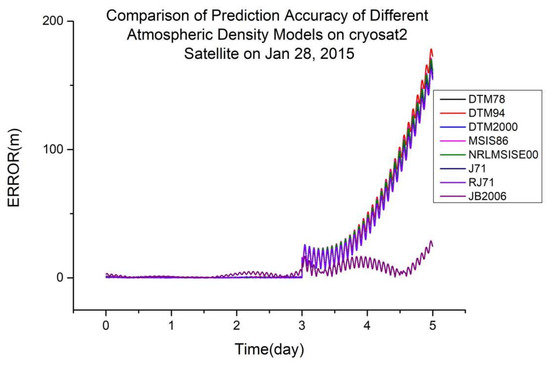
Figure 4.
Comparison of the prediction accuracies of different atmospheric density models using the CryoSat2 satellite on 28 January 2015.
As shown in Table 4, DTM2000 is more suitable for orbit determination and prediction calculated using global laser ranging data at an orbital altitude of 815 km. Figure 5 shows a typical scenario.
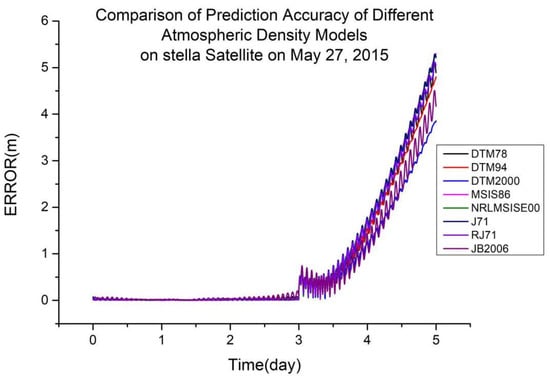
Figure 5.
Comparison of the prediction accuracies of different atmospheric density models on the Stella satellite on 27 May 2015.
As shown in Table 4, JB2006 is more suitable for orbit determination and prediction calculated using global laser ranging data at an orbital altitude of 1490 km. Figure 6 shows a typical scenario.
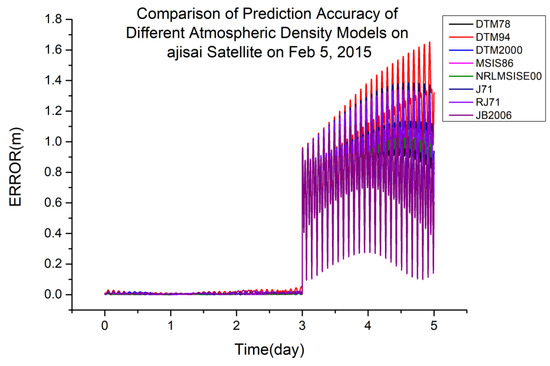
Figure 6.
Comparison of the prediction accuracies of different atmospheric density models using the Ajisai satellite on 5 February 2015.
To explore the impact of different atmospheric density models on the orbit determination and prediction calculated using single-station satellite laser ranging data, data from the Yarragadee Station in Australia (station number 7090) were selected for calculation. The station has a large time span and sufficient data points, which is conducive to orbit determination calculation. Using the same calculation method as for the multi-station data, single-station ranging data were calculated. Table 3 shows the results of the orbit prediction accuracy ranking using station 7090 laser ranging data in 2015.
From Table 5, it is not difficult to see that the calculation accuracies of the different atmospheric density models calculated using single-station laser ranging data varied with different orbital altitudes. The representative accuracy calculation results from the 2015 data are taken and plotted below.

Table 5.
One-day prediction error scores for different atmospheric density models at different orbital altitudes observed by a single station (7090) in 2015.
As shown in Table 5, MSIS86 is more suitable for orbit determination and prediction calculated using single-station laser ranging data at an orbital altitude of 1490 km. Figure 7 shows a typical scenario.
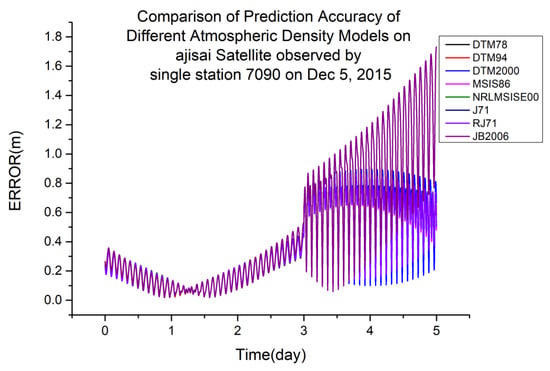
Figure 7.
Comparison of prediction accuracies of different atmospheric density models using the Ajisai satellite, observed from a single station (7090) on 5 December 2015.
As shown in Table 5, JB2006 is more suitable for orbit determination and prediction calculated using single-station laser ranging data at an orbital altitude of 720 km. Figure 8 shows a typical scenario.
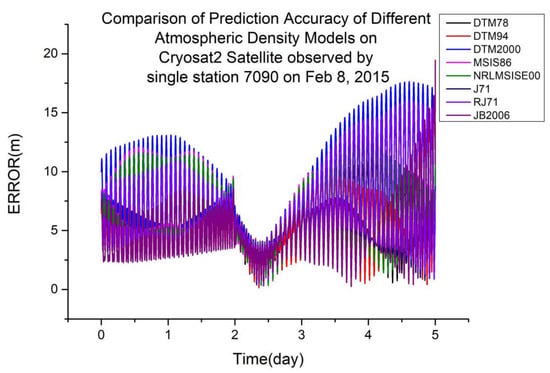
Figure 8.
Comparison of prediction accuracies of different atmospheric density models using the Cryosat2 satellite, observed from a single station (7090) on 8 February 2015.
As shown in Table 5, DTM94 is more suitable for orbit determination and prediction calculated using single-station laser ranging data at an orbital altitude of 485 km. Figure 9 shows a typical scenario.
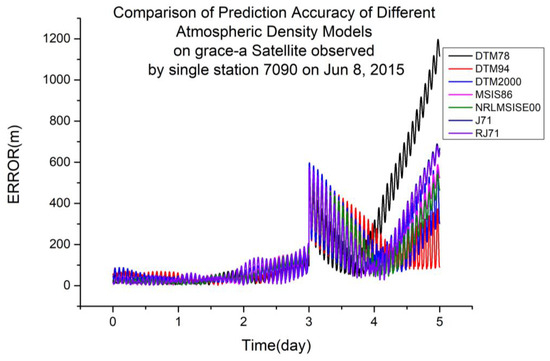
Figure 9.
Comparison of prediction accuracies of different atmospheric density models using the GRACE-A satellite, observed from a single station (7090) on 8 June 2015.
5. Discussion
Table 6 shows the results of summarizing the scores of the same atmospheric density model. Table 6 summarizes the scores of various atmospheric densities in different situations in Table 4 and Table 5. Taking DTM2000 for example, this score is the sum of the data in the DTM2000 column of Table 4 and the data in the DTM2000 column of Table 5. The scores of each atmospheric model are arranged from high to low in Table 6. It is not difficult to see that the DTM2000 atmospheric density model has the highest error prediction score, followed by the RJ71 model, and the JB2006 model has the lowest score.

Table 6.
Prediction error scores for different atmospheric density models.
6. Conclusions
To quantitatively evaluate the impact of different atmospheric density models on the orbit prediction calculations, we proposed a scoring method based on the extrapolation accuracy of different atmospheric density models at different orbit altitudes. This method is based on published space-target laser ranging data, which are used to determine the orbits of space targets at different orbital altitudes and use different atmospheric density models for orbit prediction. The prediction accuracies of specific time periods were ranked and scored from highest to lowest and then aggregated to obtain a quantitative atmospheric density model orbit prediction accuracy scoring table.
- The advantages and disadvantages of atmospheric density models vary at different orbital altitudes. For multi-station laser ranging data, the best-performing atmospheric density models at an altitude of 425 km are DTM2000 and RJ71; the best-performing atmospheric density model at an altitude of 485 km is NRLMSISE00; the best-performing atmospheric density model at an altitude of 720 km is JB2006; the best-performing atmospheric density model at an altitude of 815 km is DTM2000; and the best-performing atmospheric density model at an altitude of 1490 km is JB2006.
- For single-station laser ranging data from station number 7090, the best-performing atmospheric density model at an altitude of 485 km is DTM94; the best-performing atmospheric density model at an altitude of 720 km is JB2006; and the best-performing atmospheric density model at an altitude of 1490 km is MSIS86.
Summarizing the scores shows that the DTM2000 atmospheric density model is the best for orbit prediction calculations of low-Earth-orbit space debris, which is retired satellites with small area–mass ratios. The RJ71 model and the NRLMSISE00 model followed closely in terms of scores. The difference in scores between these three models is not very significant, and using these three models for low-Earth-orbit prediction error results will be more stable.
Author Contributions
Conceptualization, Z.L. and Y.D.; methodology, Z.L. and Y.D.; software, Z.L. and Y.D.; validation, Y.D.; formal analysis, Y.D.; investigation, Y.D.; resources, Z.L., C.L. and Z.K.; data curation, Z.K., M.S. and J.S.; writing—original draft preparation, Y.D.; writing—review and editing, Z.L.; visualization, Y.D. and L.C.; supervision, Z.L.; project administration, Z.L. and Z.K.; funding acquisition, Z.L. and Z.K. All authors have read and agreed to the published version of the manuscript.
Funding
This research was funded by the Natural Science Foundation of China (No. U2031129), the Natural Science Foundation of China (No. 12273080), and the Youth Innovation Promotion Association CAS (2018079).
Data Availability Statement
Not applicable.
Acknowledgments
The authors are grateful to the International Laser Ranging Service for its public data.
Conflicts of Interest
The authors declare no conflict of interest.
References
- Namgaladze, A.A.; Korenkov, Y.N.; Klimenko, V.V.; Karpov, I.V.; Bessarab, F.S.; Surotkin, V.A.; Glushchenko, T.A.; Naumova, N.M. Global model of the thermosphere-ionosphere-protonosphere system. Pure Appl. Geophys. 1988, 127, 219–254. [Google Scholar] [CrossRef]
- Vallado, D.A.; Finkleman, D. A critical assessment of satellite drag and atmospheric density modeling. Acta Astronaut. 2014, 95, 141–165. [Google Scholar] [CrossRef]
- Picone, J.M.; Emmert, J.T.; Lean, J.L. Thermospheric densities derived from spacecraft orbits: Accurate processing of two-line element sets. J. Geophys. Res. Atmos. 2005, 110, A03301. [Google Scholar] [CrossRef]
- Schlegel, K.; Lühr, H.; St.-Maurice, J.-P.; St.-Maurice, J.-P.; Crowley, G.; Hackert, C. Thermospheric density structures over the polar regions observed with CHAMP. Ann. Geophys. 2005, 23, 1659–1672. [Google Scholar] [CrossRef]
- Ridley, A.; Deng, Y.; Tóth, G. The global ionosphere–thermosphere model. J. Atmos. Sol.-Terr. Phys. 2006, 68, 839–864. [Google Scholar] [CrossRef]
- Hedin, A.E.; Salah, J.E.; Evans, J.V.; Reber, C.A.; Newton, G.P.; Spencer, N.W.; Kayser, D.C.; Alcaydé, D.; Bauer, P.; Cogger, L.; et al. A global thermospheric model based on mass spectrometer and incoherent scatter data MSIS, 1. N2 density and temperature. J. Geophys. Res. Atmos. 1977, 82, 2139–2147. [Google Scholar] [CrossRef]
- Hedin, A.E. A Revised thermospheric model based on mass spectrometer and incoherent scatter data: MSIS-83. J. Geophys. Res. Atmos. 1983, 88, 10170–10188. [Google Scholar] [CrossRef]
- Hedin, A.E. MSIS-86 thermospheric model. J. Geophys. Res. Space Phys. 1987, 92, 4649–4662. [Google Scholar] [CrossRef]
- Nicholas, A.; Picone, J.; Thonnard, S.; Meier, R.; Dymond, K.; Drob, D. A methodology for using optimal MSIS parameters retrieved from SSULI data to compute satellite drag on LEO objects. J. Atmos. Sol.-Terr. Phys. 2000, 62, 1317–1326. [Google Scholar] [CrossRef]
- Picone, J.M.; Hedin, A.E.; Drob, D.P.; Aikin, A.C. NRLMSISE-00 empirical model of the atmosphere: Statistical comparisons and scientific issues. J. Geophys. Res. Space Phys. 2002, 107, SIA-15. [Google Scholar] [CrossRef]
- Barlier, F.; Berger, C.; Falin, J.L.; Kockarts, G.; Thuillier, G. A thermospheric model based on satellite drag data. Ann. Géophysique 1978, 34, 9–24. [Google Scholar]
- Roberts, C.E. An analytic model for upper atmosphere densities based upon Jacchia’s 1970 models. Celest. Mech. Dyn. Astron. 1971, 4, 368–377. [Google Scholar] [CrossRef]
- Jacchia, L.G. Variations in thermospheric composition: A model based on mass spectrometer and satellite drag data. J. Geophys. Res. Atmos. 1974, 79, 1923–1927. [Google Scholar] [CrossRef]
- Bowman, B.R.; Tobiska, W.K.; Marcos, F.A.; Valladares, C. The JB2006 empirical thermospheric density model. J. Atmos. Sol.-Terr. Phys. 2008, 70, 774–793. [Google Scholar] [CrossRef]
- Berger, C.; Biancale, R.; Barlier, F.; Ill, M. Improvement of the empirical thermospheric model DTM: DTM94—A comparative review of various temporal variations and prospects in space geodesy applications. J. Geod. 1998, 72, 161–178. [Google Scholar] [CrossRef]
- Bruinsma, S.L.; Sánchez-Ortiz, N.; Olmedo, E.; Guijarro, N. Evaluation of the DTM-2009 thermosphere model for benchmarking Purposes. Space Weather Space Clim. 2012, 2, A04. [Google Scholar] [CrossRef][Green Version]
- Bruinsma, S. The DTM-2013 thermosphere model. J. Space Weather Space Clim. 2015, 5, 1–8. [Google Scholar] [CrossRef]
- Wei, L.I.; Jiancun, G.O.; Siqing, L.I.; Ronglan, W.A. Assessment of thermosphere models based on orbit prediction. Chin. J. Space Sci. 2019, 39, 757–763. (In Chinese) [Google Scholar]
- Qiu, H.; Wu, L.; Zhang, W. Comparison of atmospheric density models for LEO satellite orbit determination and orbit forecast. J. Spacecr. TT&C Technol. 2006, 25, 12–18. (In Chinese) [Google Scholar]
- Liu, W.; Wang, R.; Liu, S. Accuracy Analysis of LEO Forecast under Four Typical Space Environment. Manned Spacefl. 2017, 23, 177–184. (In Chinese) [Google Scholar] [CrossRef]
- Available online: ftp://edc.dgfi.tum.de/pub/slr/data/npt_crd/ (accessed on 3 April 2022).
- Licata, R.J.; Mehta, P.M.; Tobiska, W.K. Impact of Space Weather Driver Forecast Uncertainty on Drag and Orbit Prediction. In Proceedings of the 2020 AAS/AIAA Astrodynamics Specialist Conference, South Lake Tahoe, CA, USA, 9–13 August 2020. [Google Scholar]
- Wang, K.; Liu, J.; Su, H.; El-Mowafy, A.; Yang, X. Real-Time LEO Satellite Orbits Based on Batch Least-Squares Orbit Determination with Short-Term Orbit Prediction. Remote Sens. 2022, 15, 133. [Google Scholar] [CrossRef]
- Wang, Z.; Zhang, Y.; Wen, G.; Bai, S.; Cai, Y.; Huang, P.; Han, D. Atmospheric Density Model Optimization and Spacecraft Orbit Prediction Improvements Based on Q-Sat Orbit Data. arXiv 2021, arXiv:2112.03113. [Google Scholar] [CrossRef]
- Bussy-Virat, C.D.; Ridley, A.J. Estimation of the thermospheric density using ephemerides of the CYGNSS and Swarm constellations. J. Atmos. Sol.-Terr. Phys. 2021, 221, 105687. [Google Scholar] [CrossRef]
- Cordelli, E.; Vananti, A.; Schildknecht, T. Analysis of laser ranges and angular measurements data fusion for space debris orbit determination. Adv. Space Res. 2019, 65, 419–434. [Google Scholar] [CrossRef]
- Hobbs, D.; Bohm, P. Precise Orbit Determination for Low Earth Orbit Satellites. Ann. Marie Curie Fellowsh. Assoc. 2006, 4, 128–135. [Google Scholar]
- Müller, S.; Lühr, H.; Rentz, S. Solar and magnetospheric forcing of the low latitude thermospheric mass density as observed by CHAMP. Ann. Geophys. 2009, 27, 2087–2099. [Google Scholar] [CrossRef]
- Walterscheid, R.L. Solar cycle effects on the upper atmosphere—Implications for satellite drag. J. Spacecr. Rocket. 1989, 26, 439–444. [Google Scholar] [CrossRef]
- Ponthieu, J.-J.; Killeen, T.L.; Lee, K.-M.; Carignan, G.R.; Hoegy, W.R.; Brace, L.H. Ionosphere-thermosphere momentum coupling at solar maximum and solar minimum from DE-2 and AE-C data. Phys. Scr. 1988, 37, 447–453. [Google Scholar] [CrossRef]
- Qian, L.; Burns, A.G.; Solomon, S.C.; Wang, W.; Zhang, Y. Solar cycle variations of thermospheric composition at the solstices. J. Geophys. Res. Space Phys. 2016, 121, 3740–3749. [Google Scholar] [CrossRef]
- Buonsanto, M.J.; Solomon, S.C.; Tobiska, W.K. Comparison of measured and modeled solar EUV flux and its effect on the E-F1 region ionosphere. J. Geophys. Res. Atmos. 1992, 97, 10513–10524. [Google Scholar] [CrossRef]
- Hedin, A.E. Correlations between thermospheric density and temperature, solar EUV flux, and 10.7-cm flux variations. J. Geophys. Res. Atmos. 1984, 89, 9828–9834. [Google Scholar] [CrossRef]
- Tobiska, W.K.; Bouwer, S.D.; Bowman, B.R. The development of new solar indices for use in thermospheric density modeling. J. Atmos. Sol.-Terr. Phys. 2008, 70, 803–819. [Google Scholar] [CrossRef]
- Emmert, J.T.; Lean, J.L.; Picone, J.M. Record-low thermospheric density during the 2008 solar minimum. Geophys. Res. Lett. 2010, 37, 245–269. [Google Scholar] [CrossRef]
- Available online: http://celestrak.org/SpaceData/ (accessed on 3 July 2023).
- Available online: https://ilrs.gsfc.nasa.gov/missions/satellite_missions/current_missions/index.html (accessed on 16 August 2023).
- Available online: https://www.space-track.org/#/gp (accessed on 16 August 2023).
- Sang, J.; Li, B.; Chen, J.; Zhang, P.; Ning, J. Analytical representations of precise orbit predictions for Earth orbiting space objects. Adv. Space Res. 2016, 59, 698–714. [Google Scholar] [CrossRef]
- Li, B.; Sang, J.; Zhang, Z. A Real-Time Orbit Determination Method for Smooth Transition from Optical Tracking to Laser Ranging of Debris. Sensors 2016, 16, 962. [Google Scholar] [CrossRef] [PubMed]
- Li, B.; Sang, J.; Ning, J. A multiscaling-based semi-analytic orbit propagation method for the catalogue maintenance of space debris. J. Spat. Sci. 2020, 65, 123–145. [Google Scholar] [CrossRef]
- Sośnica, K.; Thaller, D.; Jäggi, A.; Dach, R.; Beutler, G. Sensitivity of Lageos Orbits to Global Gravity Field Models. Artif. Satell. 2012, 47, 47–65. [Google Scholar] [CrossRef]
- Standish, E.M. Orientation of the JPL Ephemerides, DE 200/LE 200, to the dynamical equinox of J 2000. Astron. Astrophys. 1982, 114, 297–302. [Google Scholar]
- McCarthy, D.D. IERS Conventions 1996; IERS Technical Note 21; U.S. Naval Observatory: Washington, DC, USA, 1996. [Google Scholar]
- Knocke, P.C. Earth Radiation Pressure Effects on Satellites. Ph.D. Theis, The University of Texas at Austin, Austin, TX, USA, 1989. [Google Scholar]
- Belkin, S.O.; Kuznetsov, E.D. Orbital flips due to solar radiation pressure for space debris in near-circular orbits. Acta Astronaut. 2021, 178, 360–369. [Google Scholar] [CrossRef]
Disclaimer/Publisher’s Note: The statements, opinions and data contained in all publications are solely those of the individual author(s) and contributor(s) and not of MDPI and/or the editor(s). MDPI and/or the editor(s) disclaim responsibility for any injury to people or property resulting from any ideas, methods, instructions or products referred to in the content. |
© 2023 by the authors. Licensee MDPI, Basel, Switzerland. This article is an open access article distributed under the terms and conditions of the Creative Commons Attribution (CC BY) license (https://creativecommons.org/licenses/by/4.0/).