

Physical Demands in the Worst-Case Scenarios of Elite Futsal Referees Using a Local Positioning System

 ,
,  , ,
, ,  ,
,  and
and 
Abstract
:1. Introduction
2. Materials and Methods
2.1. Experimental Approach to the Problem
2.2. Participants
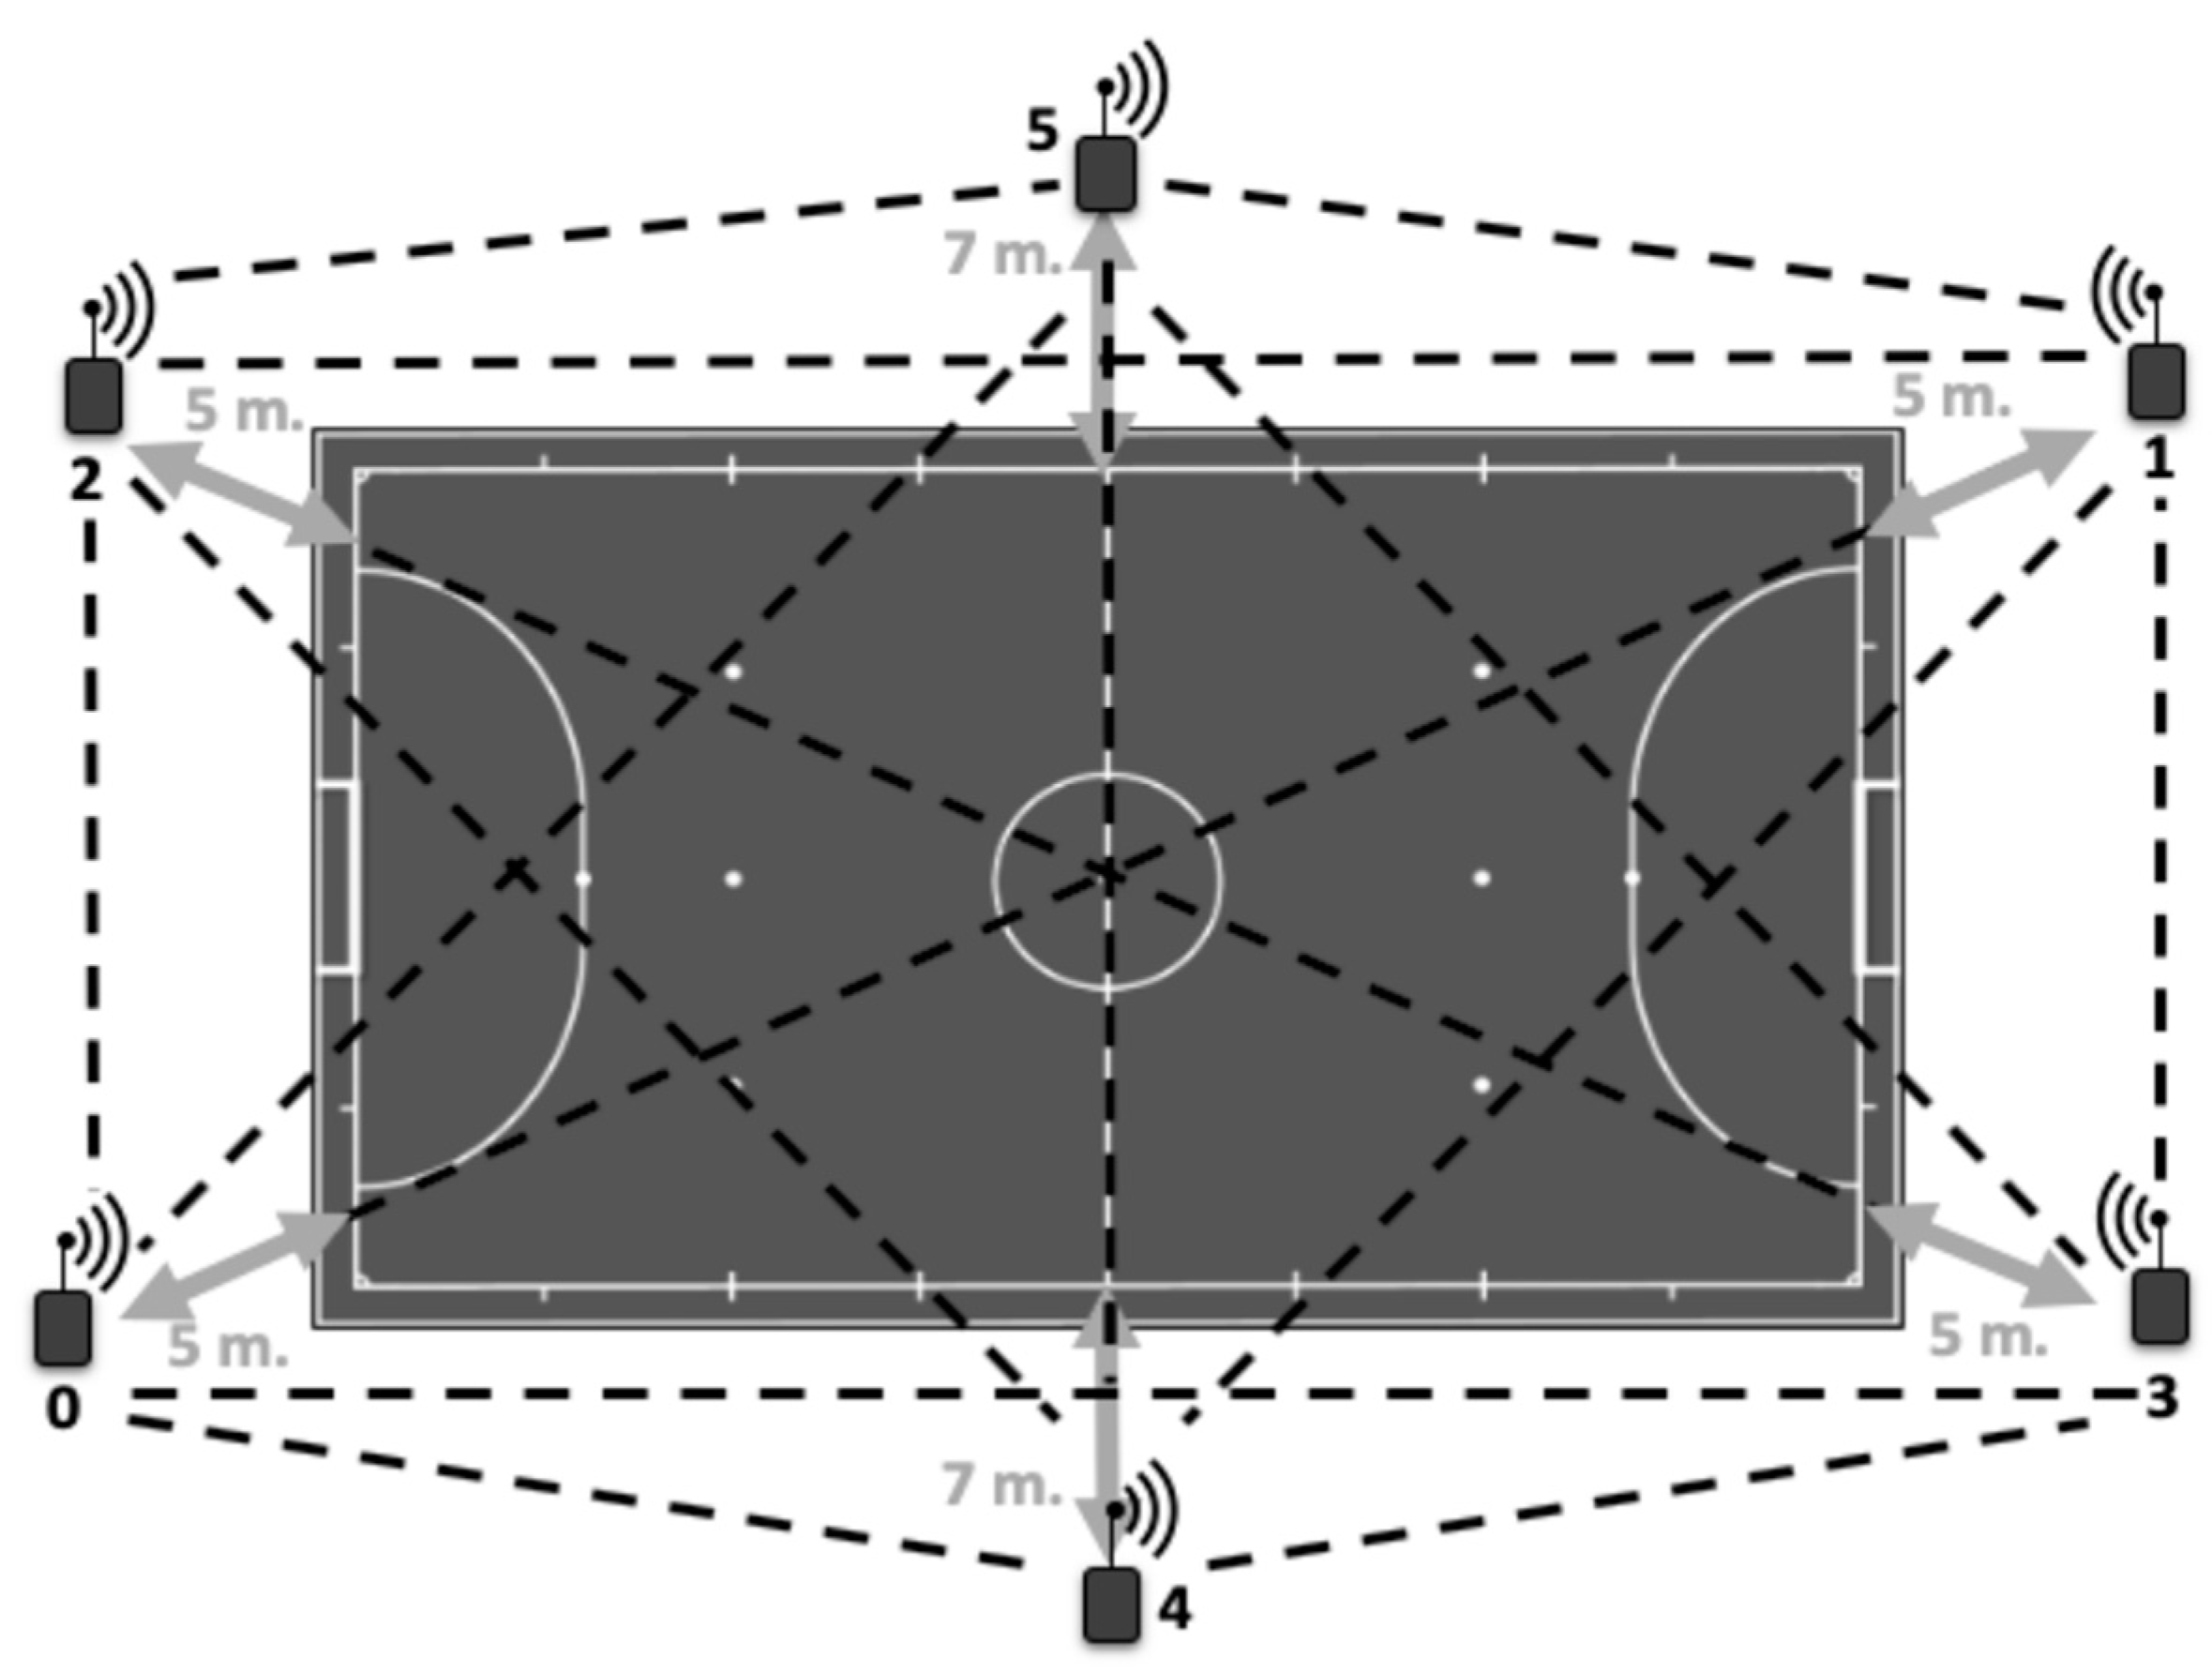
2.3. Equipment
2.4. Procedures
2.5. Data Processing
2.6. Statistical Analysis
3. Results
4. Discussion
5. Conclusions
Author Contributions
Funding
Institutional Review Board Statement
Informed Consent Statement
Data Availability Statement
Acknowledgments
Conflicts of Interest
References
- Martínez-Torremocha, G.; Martin-Sanchez, M.L.; Garcia-Unanue, J.; Felipe, J.L.; Moreno-Pérez, V.; Paredes-Hernández, V.; Gallardo, L.; Sanchez, J. Physical demands on professional Spanish football referees during matches. Sci. Med. Footb. 2022, 11, 1–7. [Google Scholar] [CrossRef]
- Scott, M.T.U.; Scott, T.J.; Kelly, V.G. The Validity and Reliability of Global Positioning Systems in Team Sport. J. Strength Cond. Res. 2016, 30, 1470–1490. [Google Scholar] [CrossRef] [PubMed]
- Castillo, D.; Weston, M.; McLaren, S.J.; Cámara, J.; Yanci, J. Relationships Between Internal and External Match-Load Indicators in Soccer Match Officials. Int. J. Sports Physiol. Perform. 2017, 12, 922–927. [Google Scholar] [CrossRef] [PubMed]
- Castillo, D.; Cámara, J.; Lozano, D.; Berzosa, C.; Yanci, J. The association between physical performance and match-play activities of field and assistants soccer referees. Res. Sports Med. 2019, 27, 283–297. [Google Scholar] [CrossRef] [PubMed]
- Rebelo, A.N.; Ascensão, A.A.; Magalhães, J.F.; Bischoff, R.; Bendiksen, M.; Krustrup, P. Elite Futsal Refereeing: Activity Profile and Physiological Demands. J. Strength Cond. Res. 2011, 25, 980–987. [Google Scholar] [CrossRef]
- Yeemin, W.; Dias, C.S.; Fonseca, A.M. A Systematic Review of Psychological Studies Applied to Futsal. J. Hum. Kinet. 2016, 50, 247–257. [Google Scholar] [CrossRef]
- Barbero-Alvarez, J.C.; Soto, V.M.; Barbero-Alvarez, V.; Granda-Vera, J. Match analysis and heart rate of futsal players during competition. J. Sports Sci. 2008, 26, 63–73. [Google Scholar] [CrossRef]
- Weston, M.; Castagna, C.; Impellizzeri, F.M.; Bizzini, M.; Williams, A.M.; Gregson, W. Science and Medicine Applied to Soccer Refereeing. Sports Med. 2012, 42, 615–631. [Google Scholar] [CrossRef]
- Riiser, A.; Andersen, V.; Sæterbakken, A.; Ylvisaker, E.; Moe, V.F. Running Performance and Position is Not Related to Decision-Making Accuracy in Referees. Sports Med. Int. Open 2019, 3, E66–E71. [Google Scholar] [CrossRef]
- Ribeiro, J.N.; Gonçalves, B.; Coutinho, D.; Brito, J.; Sampaio, J.; Travassos, B. Activity Profile and Physical Performance of Match Play in Elite Futsal Players. Front. Psychol. 2020, 11, 1709. [Google Scholar] [CrossRef]
- Ahmed, H.; Davison, G.; Dixon, D. Analysis of activity patterns, physiological demands and decision-making performance of elite Futsal referees during matches. Int. J. Perform. Anal. Sport. 2017, 17, 737–751. [Google Scholar] [CrossRef]
- Serrano, C.; Sánchez-Sánchez, J.; Felipe, J.L.; Hernando, E.; Gallardo, L.; Garcia-Unanue, J. Physical Demands in Elite Futsal Referees During Spanish Futsal Cup. Front. Psychol. 2021, 12, 625154. [Google Scholar] [CrossRef]
- Méndez, C.; Gonçalves, B.; Santos, J.; Ribeiro, J.N.; Travassos, B. Attacking Profiles of the Best Ranked Teams From Elite Futsal Leagues. Front. Psychol. 2019, 10, 1370. [Google Scholar] [CrossRef]
- Spyrou, K.T.; Freitas, T.; Marín-Cascales, E.; Herrero-Carrasco, R.E.; Alcaraz, P. External match load and the influence of contextual factors in elite futsal. Biol. Sport. 2022, 39, 349–354. [Google Scholar] [CrossRef] [PubMed]
- Illa, J.; Fernandez, D.; Reche, X.; Serpiello, F.R. Positional Differences in the Most Demanding Scenarios of External Load Variables in Elite Futsal Matches. Front. Psychol. 2021, 12, 625126. [Google Scholar] [CrossRef]
- Serrano, C.; Felipe, J.L.; Garcia-Unanue, J.; Ibañez, E.; Hernando, E.; Gallardo, L.; Sanchez, J. Local Positioning System Analysis of Physical Demands during Official Matches in the Spanish Futsal League. Sensors 2020, 20, 4860. [Google Scholar] [CrossRef] [PubMed]
- Oliva-Lozano, J.M.; Rojas-Valverde, D.; Gómez-Carmona, C.D.; Fortes, V.; Pino-Ortega, J. Worst case scenario match analysis and contextual variables in professional soccer players: A longitudinal study. Biol. Sport. 2020, 37, 429–436. [Google Scholar] [CrossRef] [PubMed]
- Menaspà, P. Are rolling averages a good way to assess training load for injury prevention? Br. J. Sports Med. 2017, 51, 618–619. [Google Scholar] [CrossRef] [PubMed]
- Reardon, C.; Tobin, D.P.; Tierney, P.; Delahunt, E. The worst case scenario: Locomotor and collision demands of the longest periods of gameplay in professional rugby union. PLoS ONE 2017, 12, e0177072. [Google Scholar] [CrossRef] [PubMed]
- Bastida Castillo, A.; Gómez Carmona, C.D.; De La Cruz Sánchez, E.; Pino Ortega, J. Accuracy.; intra- and inter-unit reliability, and comparison between GPS and UWB-based position-tracking systems used for time–motion analyses in soccer. Eur. J. Sport Sci. 2018, 18, 450–457. [Google Scholar] [CrossRef]
- Bastida-Castillo, A.; Gómez-Carmona, C.; De la Cruz-Sánchez, E.; Reche-Royo, X.; Ibáñez, S.; Pino Ortega, J. Accuracy and Inter-Unit Reliability of Ultra-Wide-Band Tracking System in Indoor Exercise. Appl. Sci. 2019, 9, 939. [Google Scholar] [CrossRef]
- Sczyslo, S.; Schroeder, J.; Galler, S.; Kaiser, T. Hybrid localization using UWB and inertial sensors. In Proceedings of the 2008 IEEE International Conference on Ultra-Wideband, IEEE, Hannover, Germany, 10–12 September 2008; pp. 89–92. [Google Scholar]
- Serpiello, F.R.; Hopkins, W.G.; Barnes, S.; Tavrou, J.; Duthie, G.M.; Aughey, R.J.; Ball, K. Validity of an ultra-wideband local positioning system to measure locomotion in indoor sports. J. Sports Sci. 2018, 36, 1727–1733. [Google Scholar] [CrossRef] [PubMed]
- Stevens, T.G.A.; de Ruiter, C.J.; van Niel, C.; van de Rhee, R.; Beek, P.J.; Savelsbergh, G.J.P. Measuring Acceleration and Deceleration in Soccer-Specific Movements Using a Local Position Measurement (LPM) System. Int. J. Sports Physiol. Perform. 2014, 9, 446–456. [Google Scholar] [CrossRef] [PubMed]
- Martin-Garcia, A.; Castellano, J.; Diaz, A.G.; Cos, F.; Casamichana, D. Positional demands for various-sided games with goalkeepers according to the most demanding passages of match play in football. Biol. Sport 2019, 36, 171–180. [Google Scholar] [CrossRef]
- Vázquez-Guerrero, J.; Ayala, F.; Garcia, F.; Sampaio, J. The Most Demanding Scenarios of Play in Basketball Competition From Elite Under-18 Teams. Front. Psychol. 2020, 11, 552. [Google Scholar] [CrossRef]
- Dixon, D. A Pilot Study of the Physiological Demands of Futsal Referees Engaged in International Friendly Matches. Am. J. Sports Sci. Med. 2014, 2, 103–107. [Google Scholar] [CrossRef]
- Illa, J.; Fernandez, D.; Reche, X.; Carmona, G.; Tarragó, J.R. Quantification of an Elite Futsal Team’s Microcycle External Load by Using the Repetition of High and Very High Demanding Scenarios. Front. Psychol. 2020, 11, 577624. [Google Scholar] [CrossRef]
- García-Santos, D.; Gómez-Ruano, M.A.; Vaquera, A.; Ibáñez, S.J. Systematic review of basketball referees’ performances. Int. J. Perform. Anal. Sport 2020, 20, 495–533. [Google Scholar] [CrossRef]

| Time Window (s) | 30 (a) | 60 (b) | 120 (c) | 180 (d) | 300 (e) | |||||
|---|---|---|---|---|---|---|---|---|---|---|
| n = 28 | Mean | SD | Mean | SD | Mean | SD | Mean | SD | Mean | SD |
| Total distance (m·min−1) | 143.30 | 14.61 | 115.39 a | 9.28 | 94.47 a,b | 6.21 | 87.20 a,b,c | 4.76 | 66.22 a,b,c,d | 3.22 |
| HSR Distance (m·min−1) | 66.44 | 17.73 | 40.23 a | 11.33 | 24.21 a,b | 7.06 | 18.90 a,b,c | 5.38 | 12.89 a,b,c,d | 3.40 |
| HSR count (n·min−1) | 6.79 | 2.27 | 4.00 a | 1.12 | 2.64 a,b | 0.61 | 2.13 a,b,c | 0.55 | 1.48 a,b,c,d | 0.27 |
| Sprint Distance (m·min−1) | 51.21 | 15.81 | 28.38 a | 10.90 | 17.11 a,b | 6.67 | 12.78 a,b,c | 4.80 | 8.39 a,b,c,d | 3.06 |
| Sprint count (n·min−1) | 5.57 | 2.13 | 3.14 a | 1.35 | 1.95 a,b | 0.70 | 1.48 a,b,c | 0.57 | 1.00 a,b,c,d | 0.36 |
| HI Acc Distance (m·min−1) | 42.46 | 10.67 | 26.20 a | 7.34 | 17.21 a,b | 4.60 | 13.63 a,b,c | 3.90 | 9.48 a,b,c,d | 3.03 |
| HI Dec Distance (m·min−1) | 39.79 | 10.83 | 24.99 a | 6.30 | 16.01 a,b | 4.20 | 13.34 a,b,c | 3.53 | 9.31 a,b,c,d | 2.56 |
| Time Window (s) | 30 (a) | 60 (b) | 120 (c) | 180 (d) | 300 (e) | ||||||
|---|---|---|---|---|---|---|---|---|---|---|---|
| n = 14 | Mean | SD | Mean | SD | Mean | SD | Mean | SD | Mean | SD | |
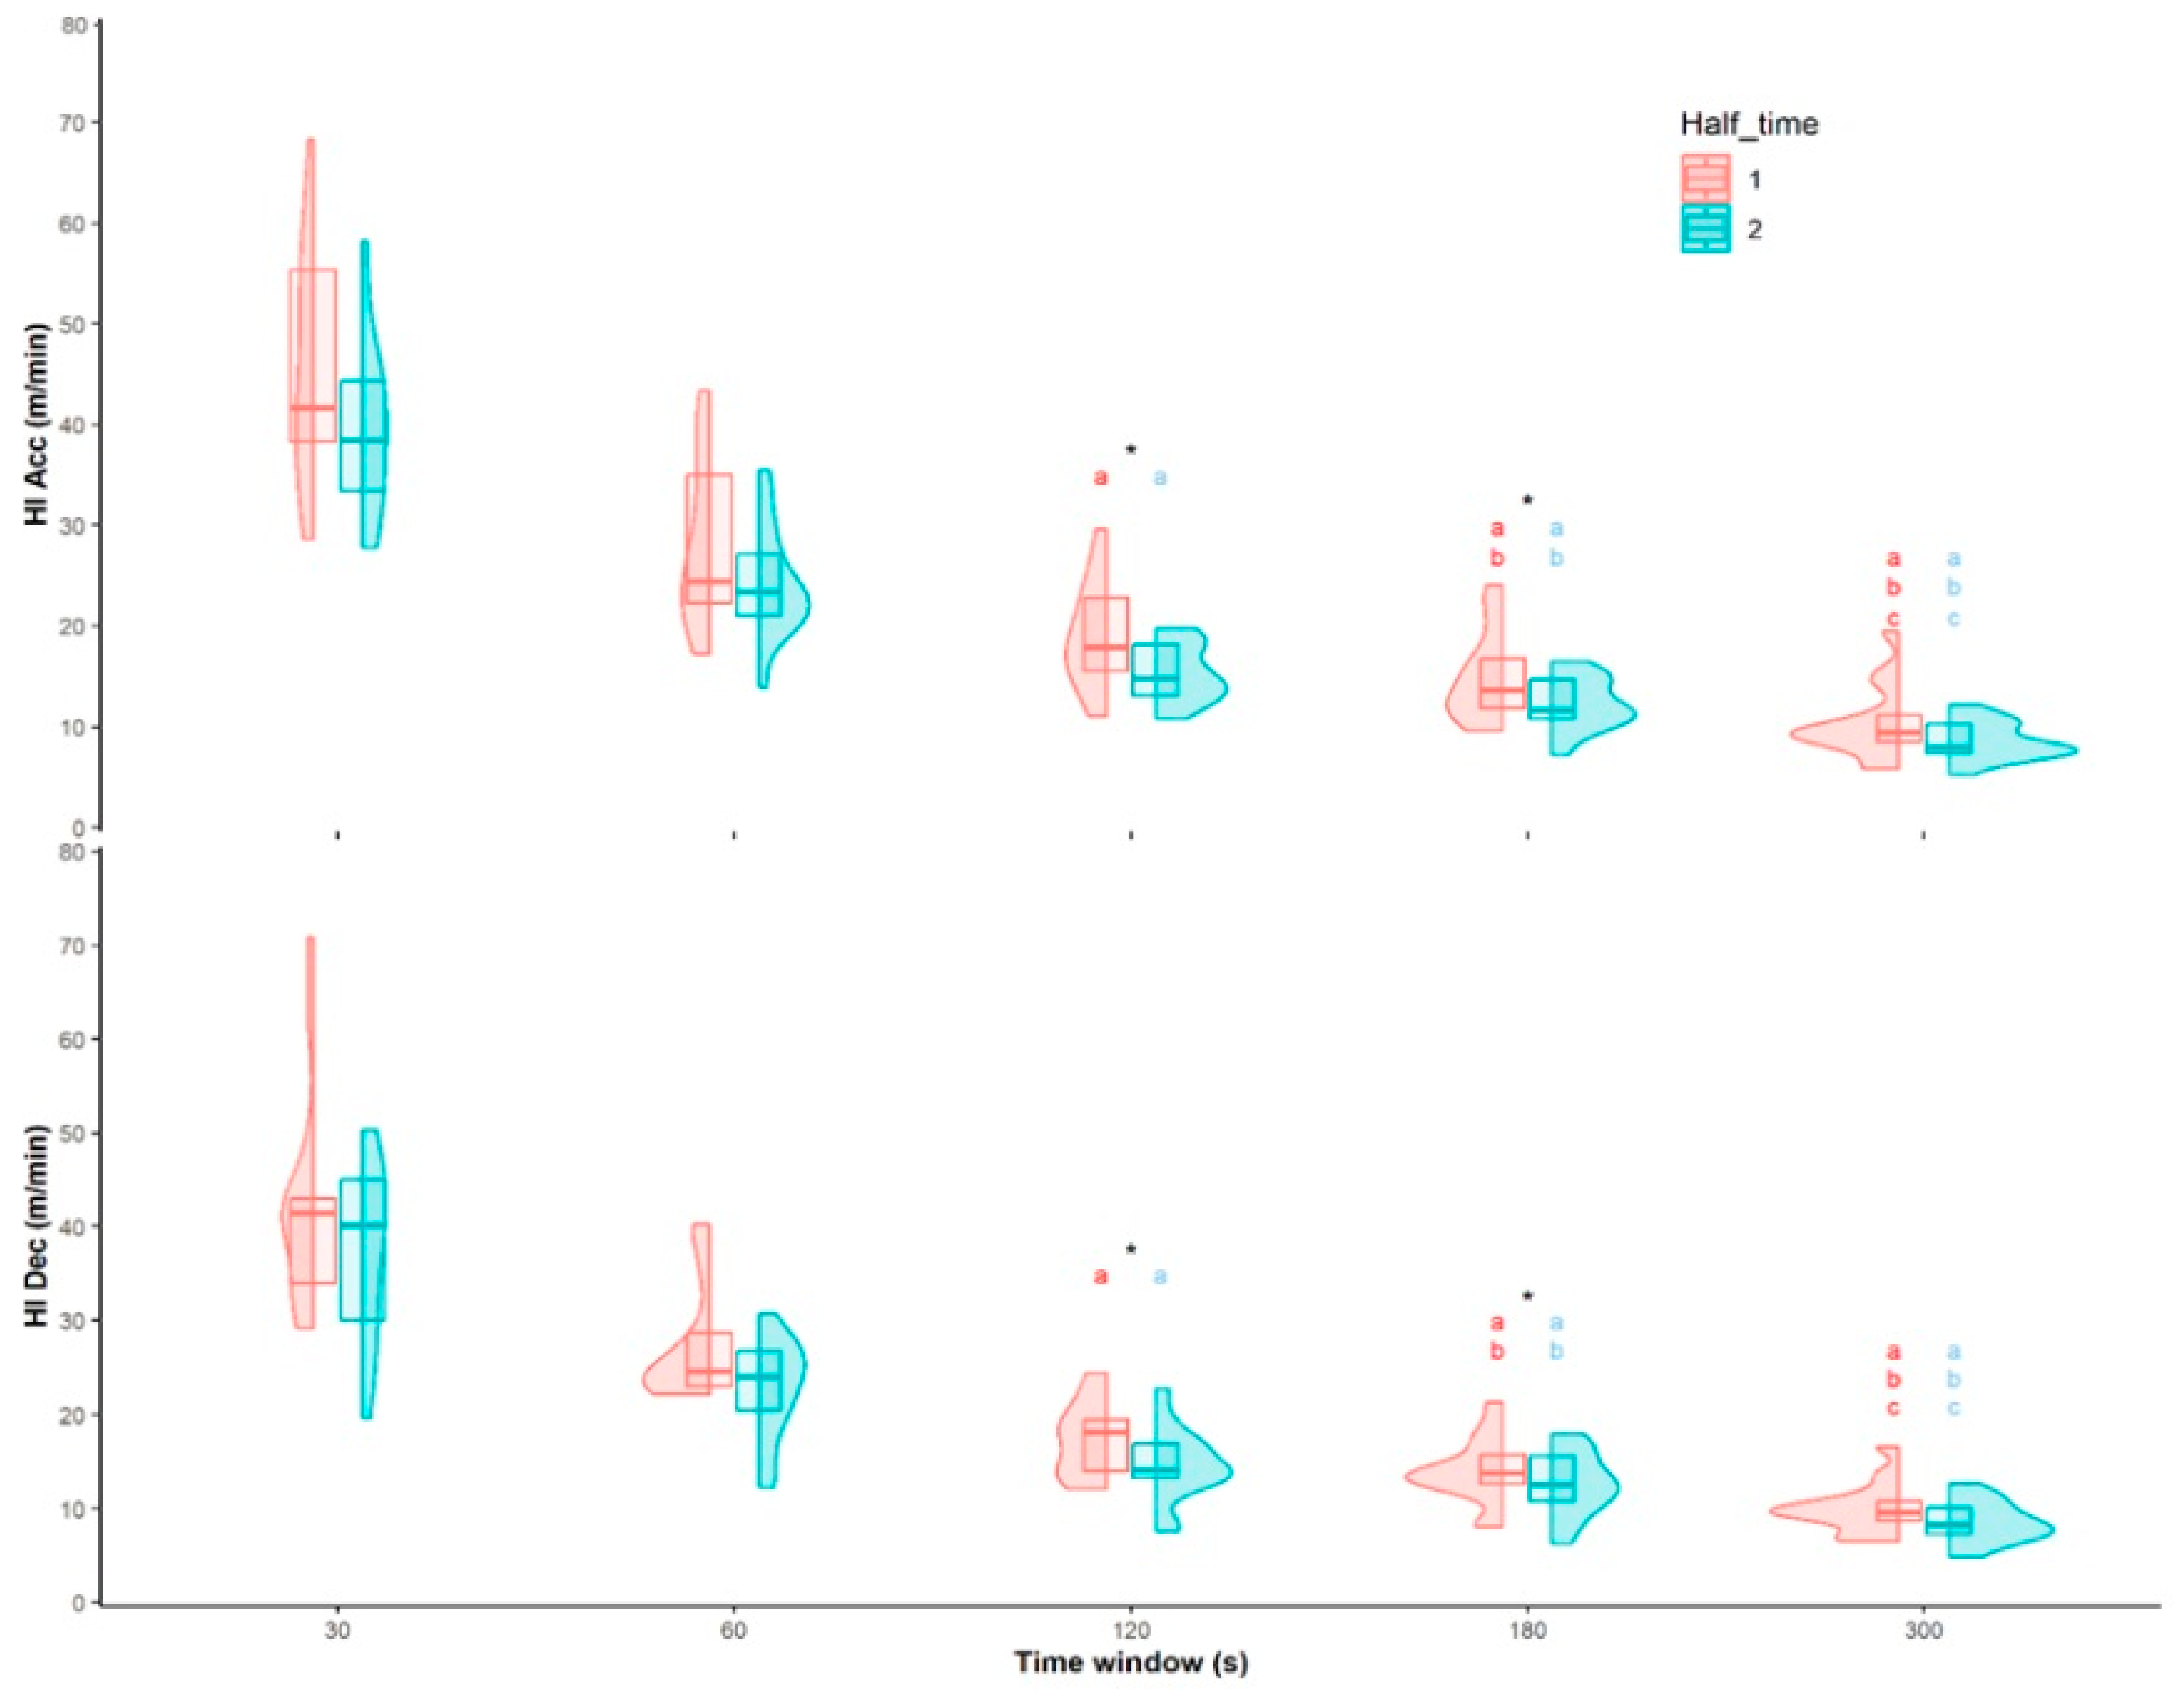
| First Half | Total distance (m·min−1) | 144.90 | 12.72 | 116.42 | 8.91 | 98.12 *,a | 5.15 | 88.32 a,b | 4.99 | 66.43 a,b,c | 2.76 |
| HSR Distance (m·min−1) | 66.15 | 15.64 | 41.35 | 9.72 | 25.54 *,a | 5.87 | 19.68 a,b | 4.92 | 13.36 *,a,b,c | 2.66 | |
| Sprint Distance (m·min−1) | 51.93 | 15.01 | 29.08 | 10.27 | 17.59 a | 6.10 | 13.38 a,b | 4.45 | 8.71 a,b,c | 2.63 | |
| HI Acc Distance (m·min−1) | 45.44 | 11.99 | 28.24 | 8.49 | 19.06 *,a | 5.30 | 14.97 *,a,b | 4.59 | 10.39 a,b,c | 3.72 | |
| HI Dec Distance (m·min−1) | 42.32 | 11.88 | 27.43 | 6.33 | 17.38 a | 4.07 | 14.03 a,b | 3.62 | 10.06 a,b,c | 2.72 | |
| Second Half | Total distance (m·min−1) | 141.71 | 16.61 | 114.35 | 9.85 | 90.83 a | 4.98 | 86.07 a,b | 4.41 | 66.01 a,b,c | 3.72 |
| HSR Distance (m·min−1) | 66.73 | 20.21 | 39.12 | 13.03 | 22.89 a | 8.08 | 18.13 a,b | 5.89 | 12.42 a,b,c | 4.07 | |
| Sprint Distance (m·min−1) | 50.49 | 17.11 | 27.68 | 11.85 | 16.62 a | 7.40 | 12.18 a,b | 5.21 | 8.07 a,b,c | 3.51 | |
| HI Acc Distance (m·min−1) | 39.48 | 8.59 | 24.17 | 5.57 | 15.35 a | 2.90 | 12.29 a,b | 2.58 | 8.58 a,b,c | 1.88 | |
| HI Dec Distance (m·min−1) | 37.25 | 9.40 | 22.55 | 5.44 | 14.62 a | 4.00 | 12.64 a,b | 3.43 | 8.56 a,b,c | 2.23 | |
Disclaimer/Publisher’s Note: The statements, opinions and data contained in all publications are solely those of the individual author(s) and contributor(s) and not of MDPI and/or the editor(s). MDPI and/or the editor(s) disclaim responsibility for any injury to people or property resulting from any ideas, methods, instructions or products referred to in the content. |
© 2023 by the authors. Licensee MDPI, Basel, Switzerland. This article is an open access article distributed under the terms and conditions of the Creative Commons Attribution (CC BY) license (https://creativecommons.org/licenses/by/4.0/).
Share and Cite
Martinez-Torremocha, G.; Sanchez-Sanchez, J.; Alonso-Callejo, A.; Martin-Sanchez, M.L.; Serrano, C.; Gallardo, L.; Garcia-Unanue, J.; Felipe, J.L. Physical Demands in the Worst-Case Scenarios of Elite Futsal Referees Using a Local Positioning System. Sensors 2023, 23, 8662. https://doi.org/10.3390/s23218662
Martinez-Torremocha G, Sanchez-Sanchez J, Alonso-Callejo A, Martin-Sanchez ML, Serrano C, Gallardo L, Garcia-Unanue J, Felipe JL. Physical Demands in the Worst-Case Scenarios of Elite Futsal Referees Using a Local Positioning System. Sensors. 2023; 23(21):8662. https://doi.org/10.3390/s23218662
Chicago/Turabian StyleMartinez-Torremocha, Gemma, Javier Sanchez-Sanchez, Antonio Alonso-Callejo, Maria Luisa Martin-Sanchez, Carlos Serrano, Leonor Gallardo, Jorge Garcia-Unanue, and Jose Luis Felipe. 2023. "Physical Demands in the Worst-Case Scenarios of Elite Futsal Referees Using a Local Positioning System" Sensors 23, no. 21: 8662. https://doi.org/10.3390/s23218662
APA StyleMartinez-Torremocha, G., Sanchez-Sanchez, J., Alonso-Callejo, A., Martin-Sanchez, M. L., Serrano, C., Gallardo, L., Garcia-Unanue, J., & Felipe, J. L. (2023). Physical Demands in the Worst-Case Scenarios of Elite Futsal Referees Using a Local Positioning System. Sensors, 23(21), 8662. https://doi.org/10.3390/s23218662