
A Fine-Grained Semantic Alignment Method Specific to Aggregate Multi-Scale Information for Cross-Modal Remote Sensing Image Retrieval

Abstract
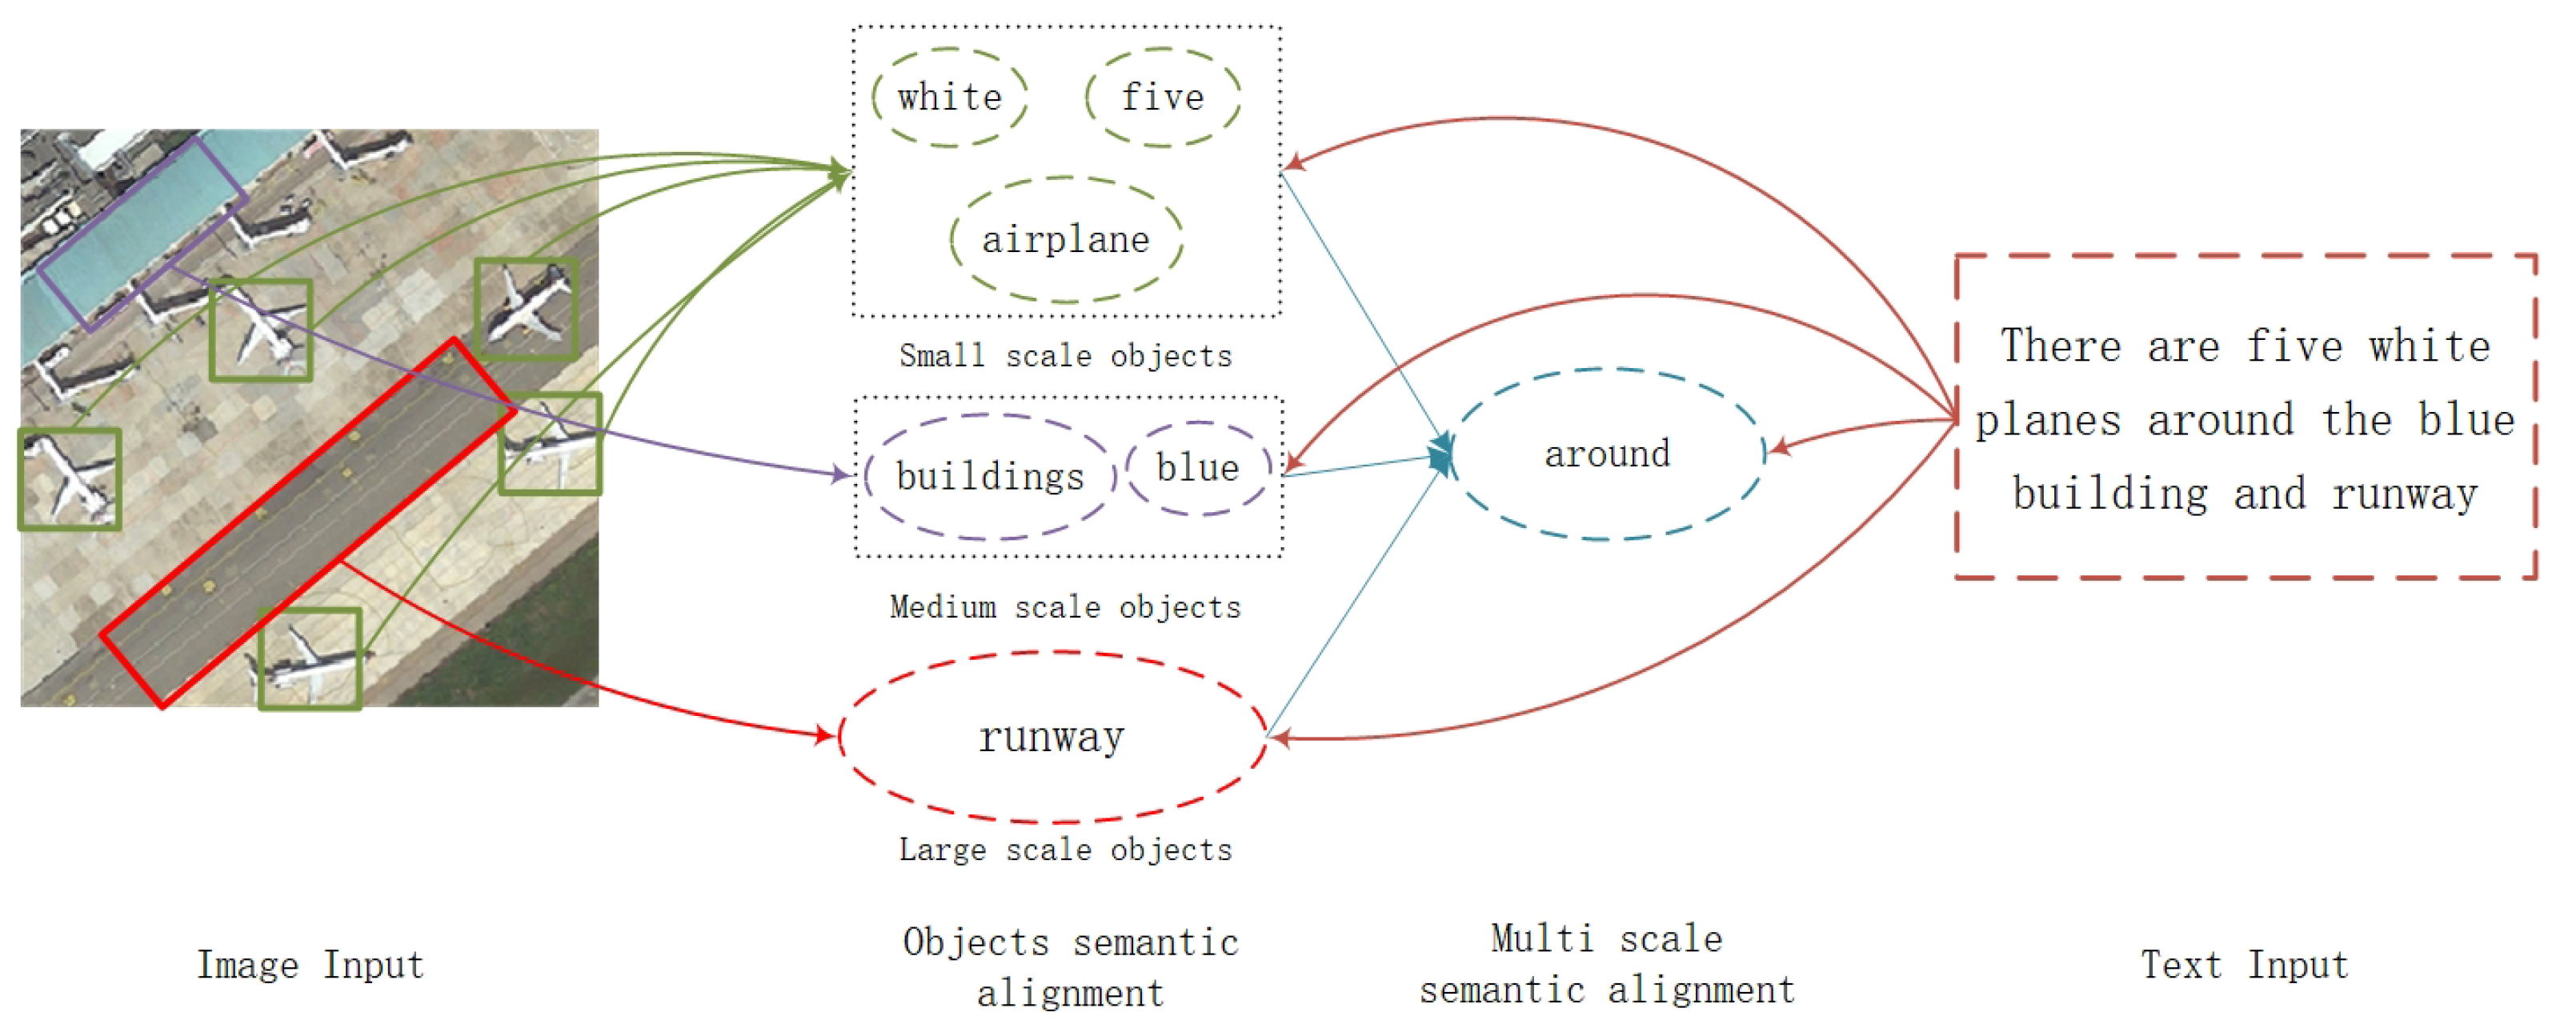
:1. Introduction
2. Related Work
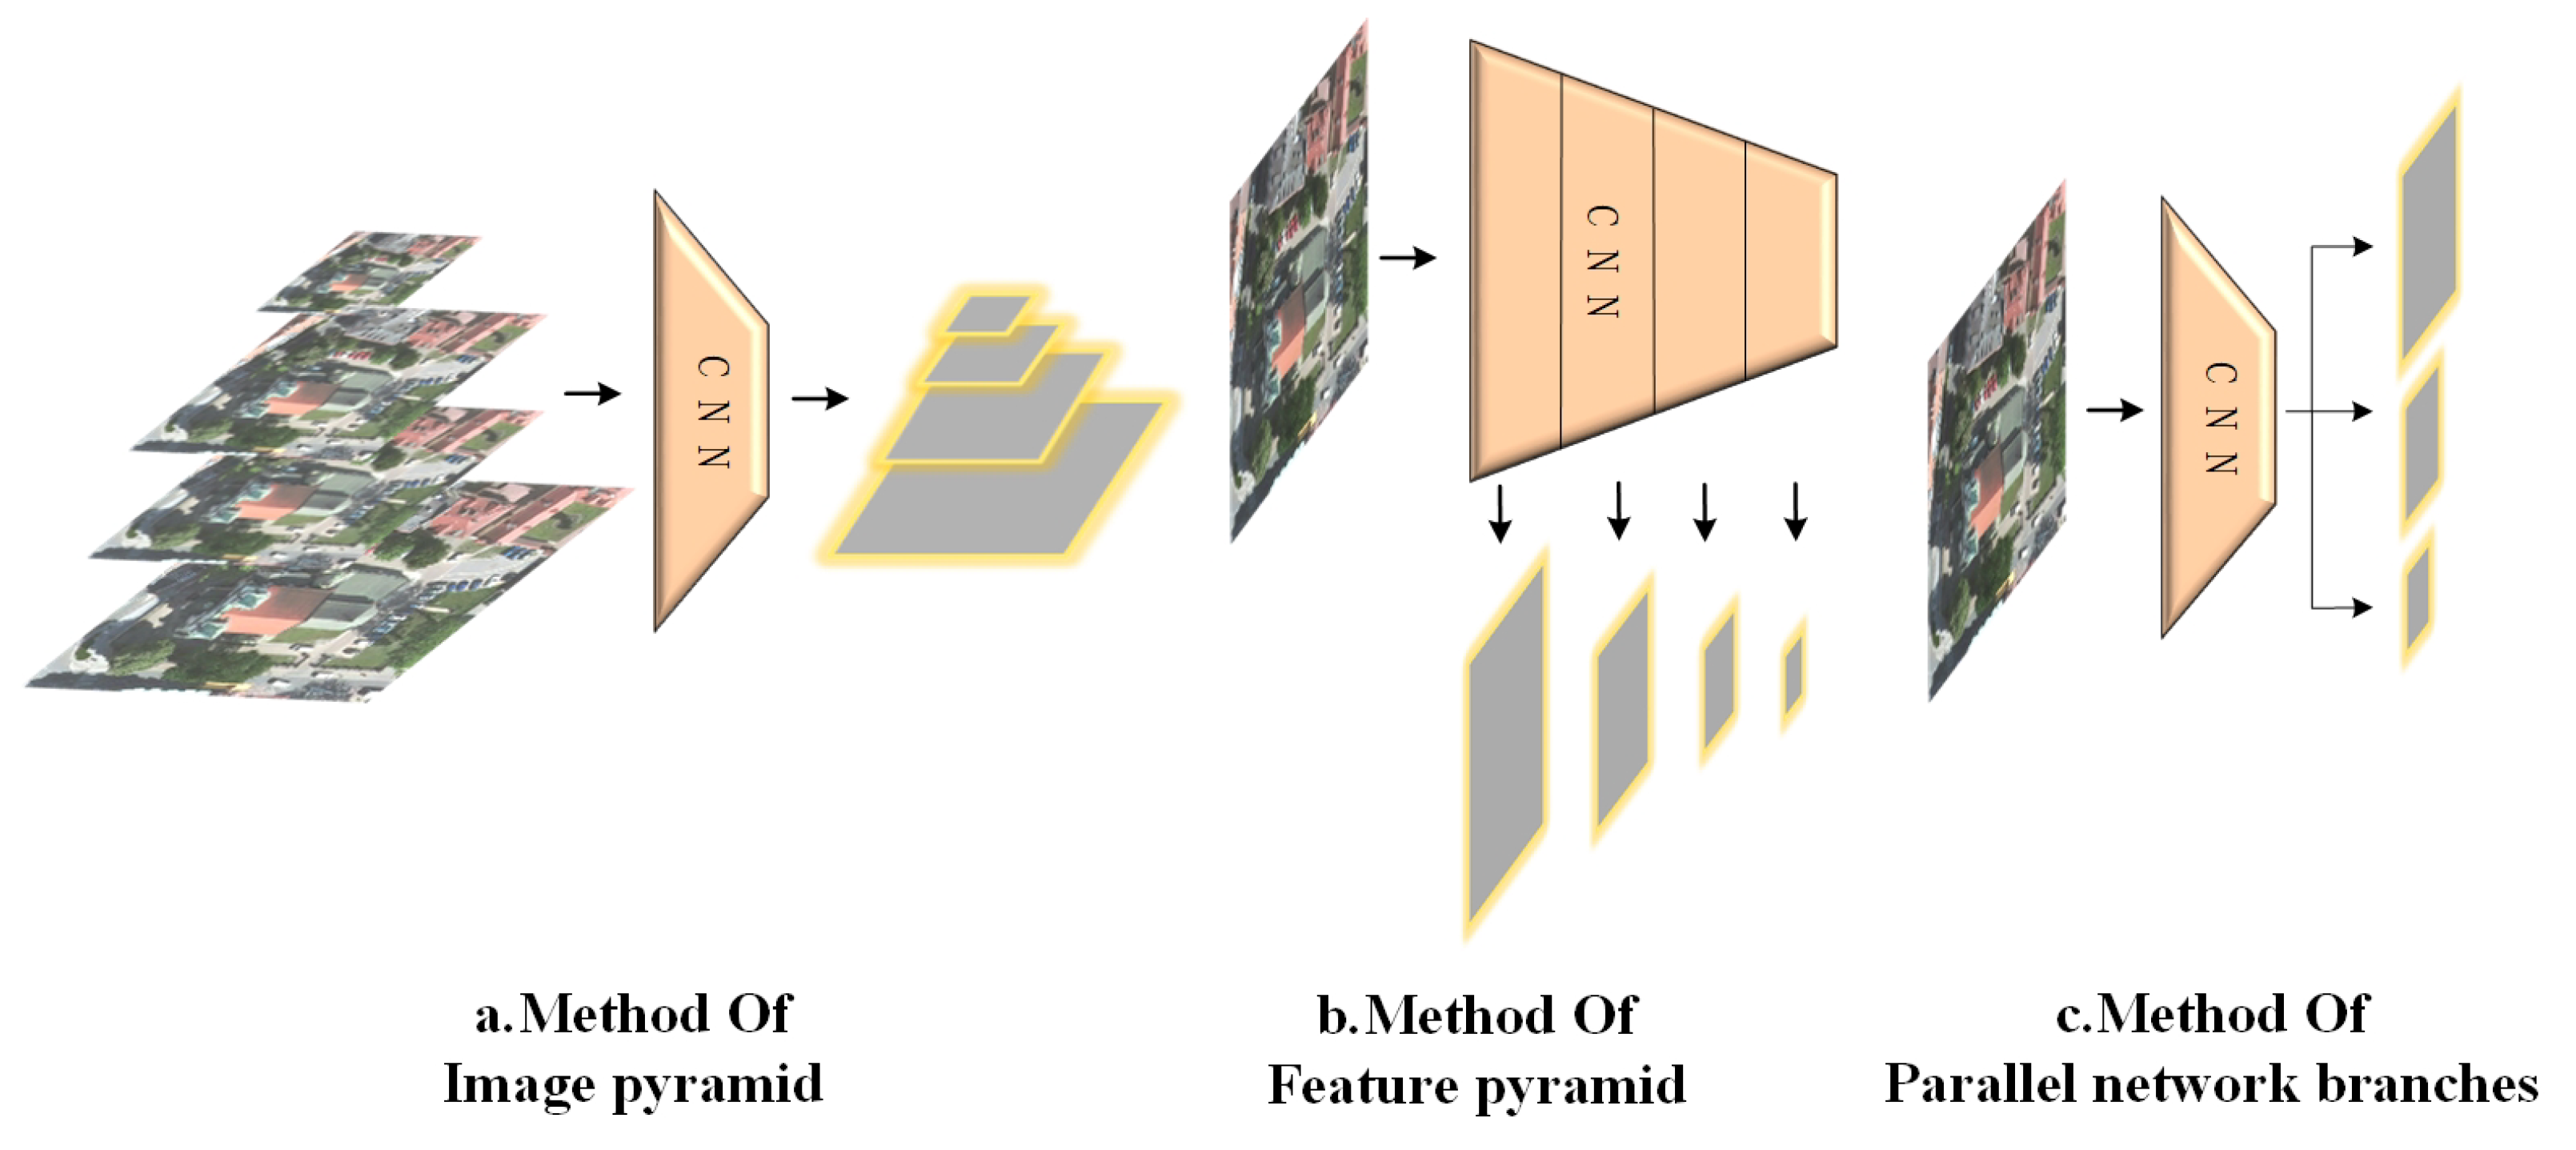
2.1. Image Pyramid
2.2. Parallel Network Branches
2.3. Cross-Layer Feature Connection
2.4. Summary of the Literature
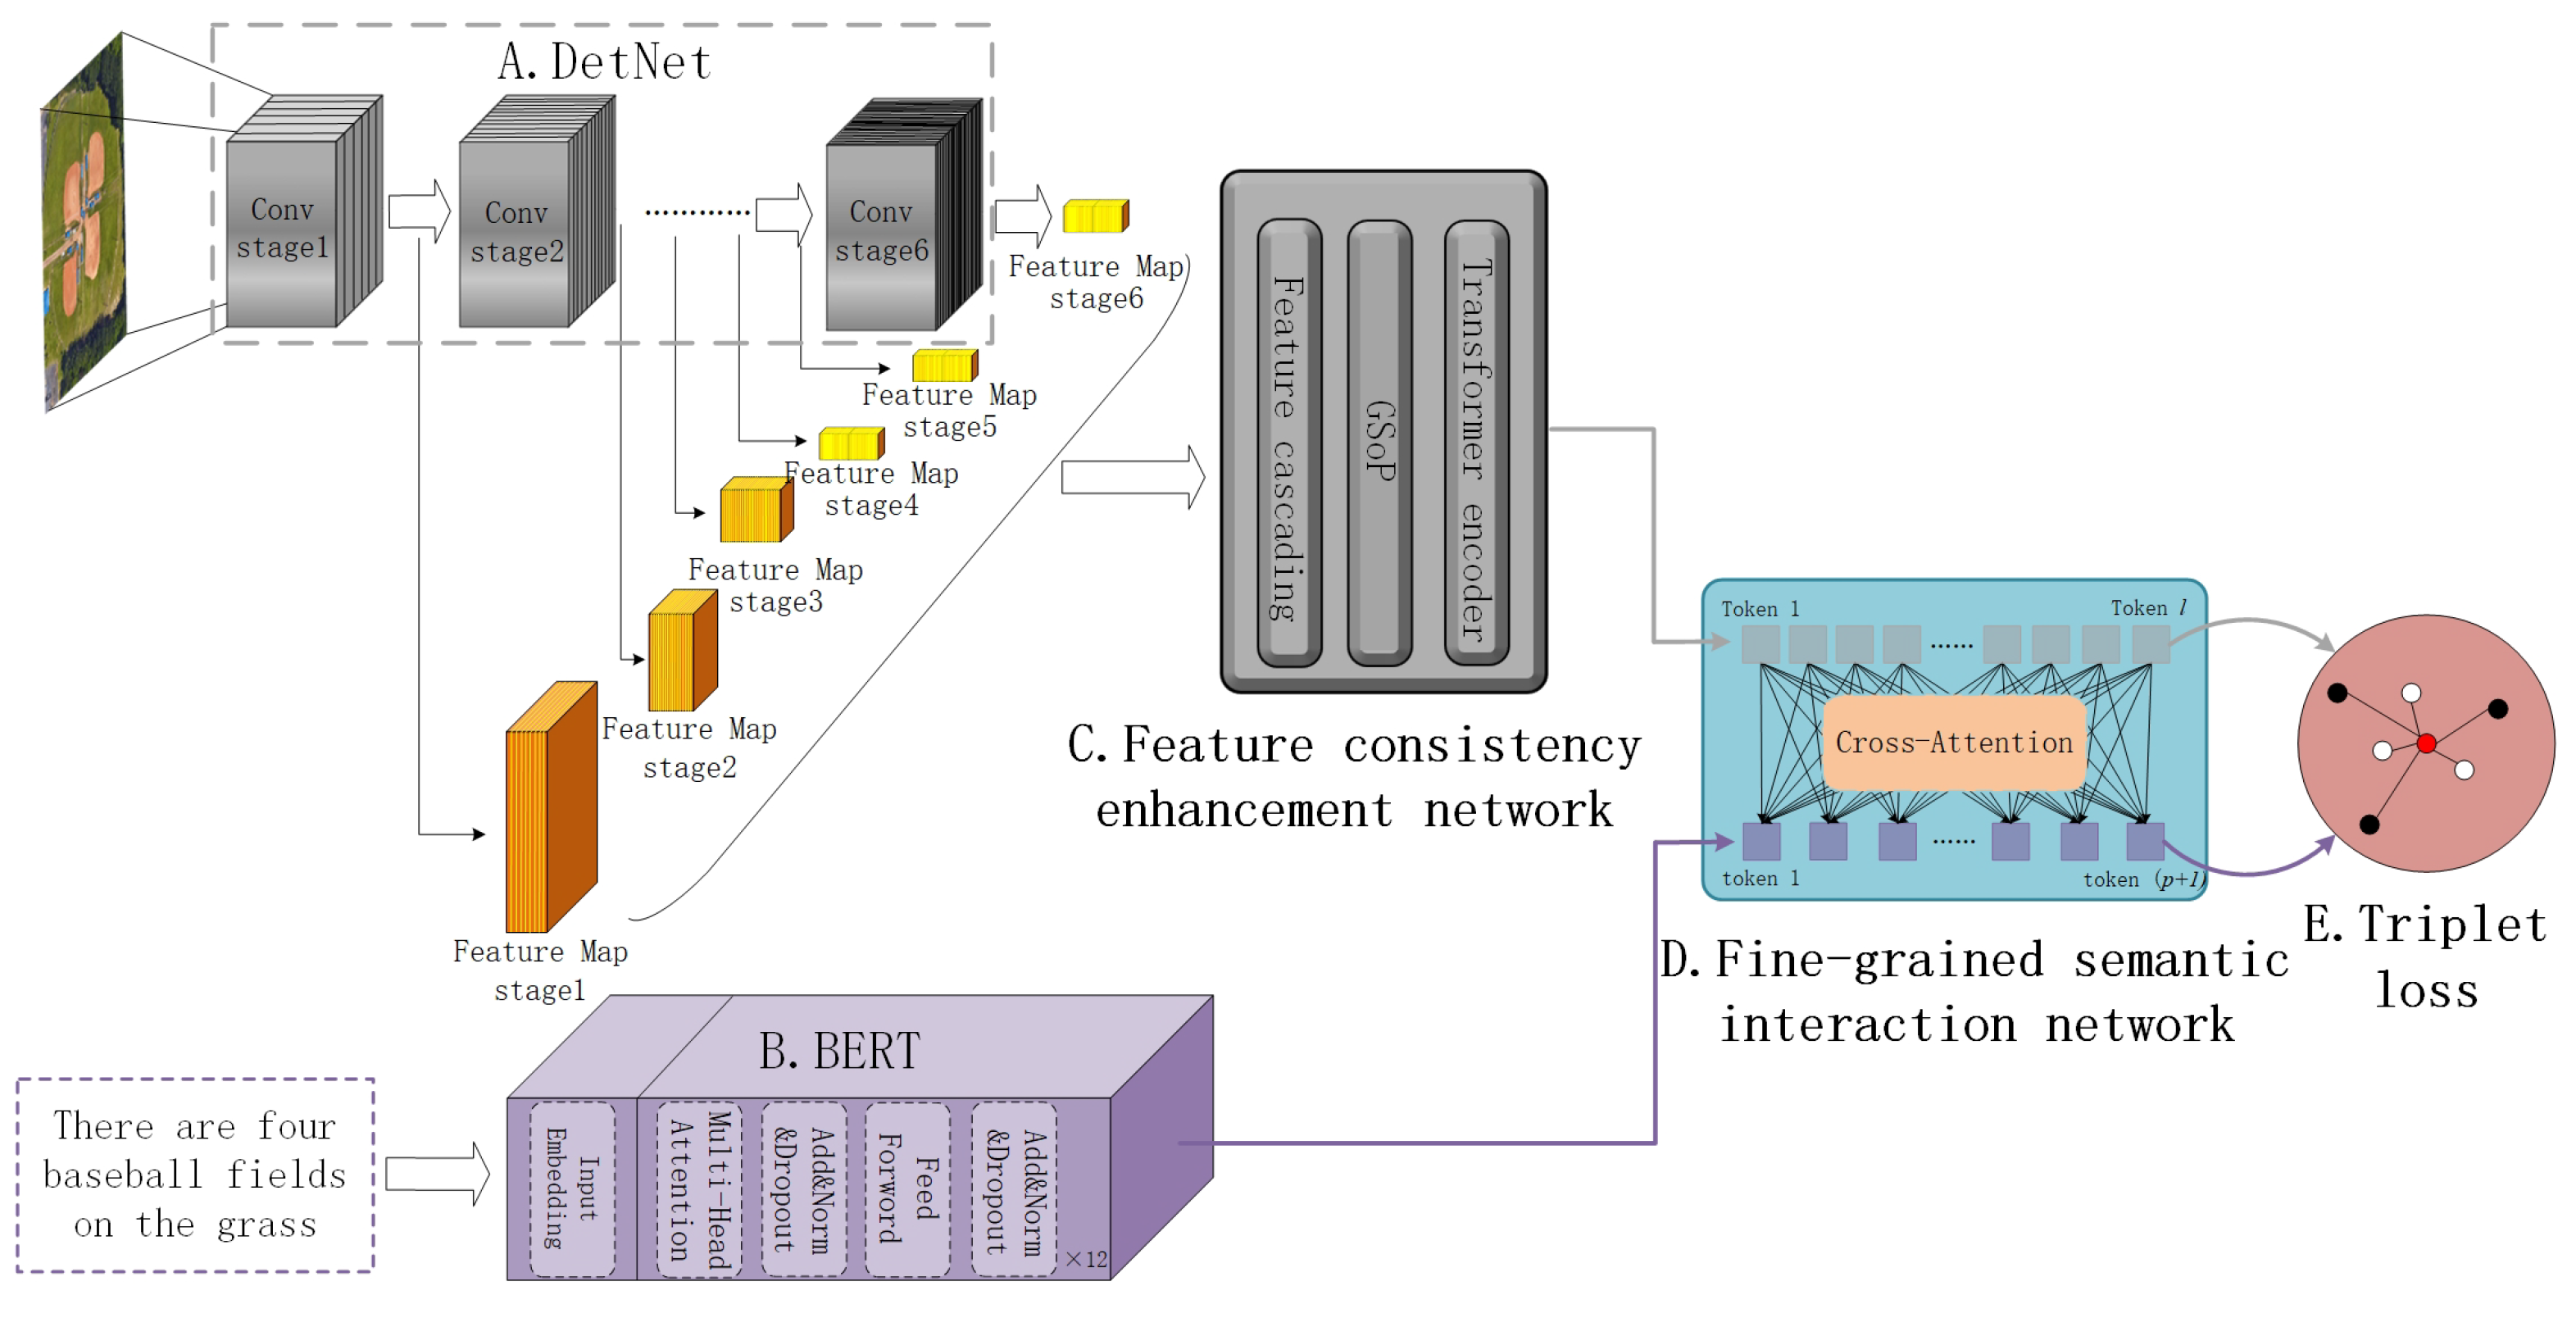
3. Methodology
3.1. Single-Modal Embedding
3.2. Feature Consistency Enhancement Network
3.2.1. Feature Cascading
3.2.2. Channel Attention Based on Global Second-Order Pooling
3.2.3. Self-Attention Based on the Transformer Framework
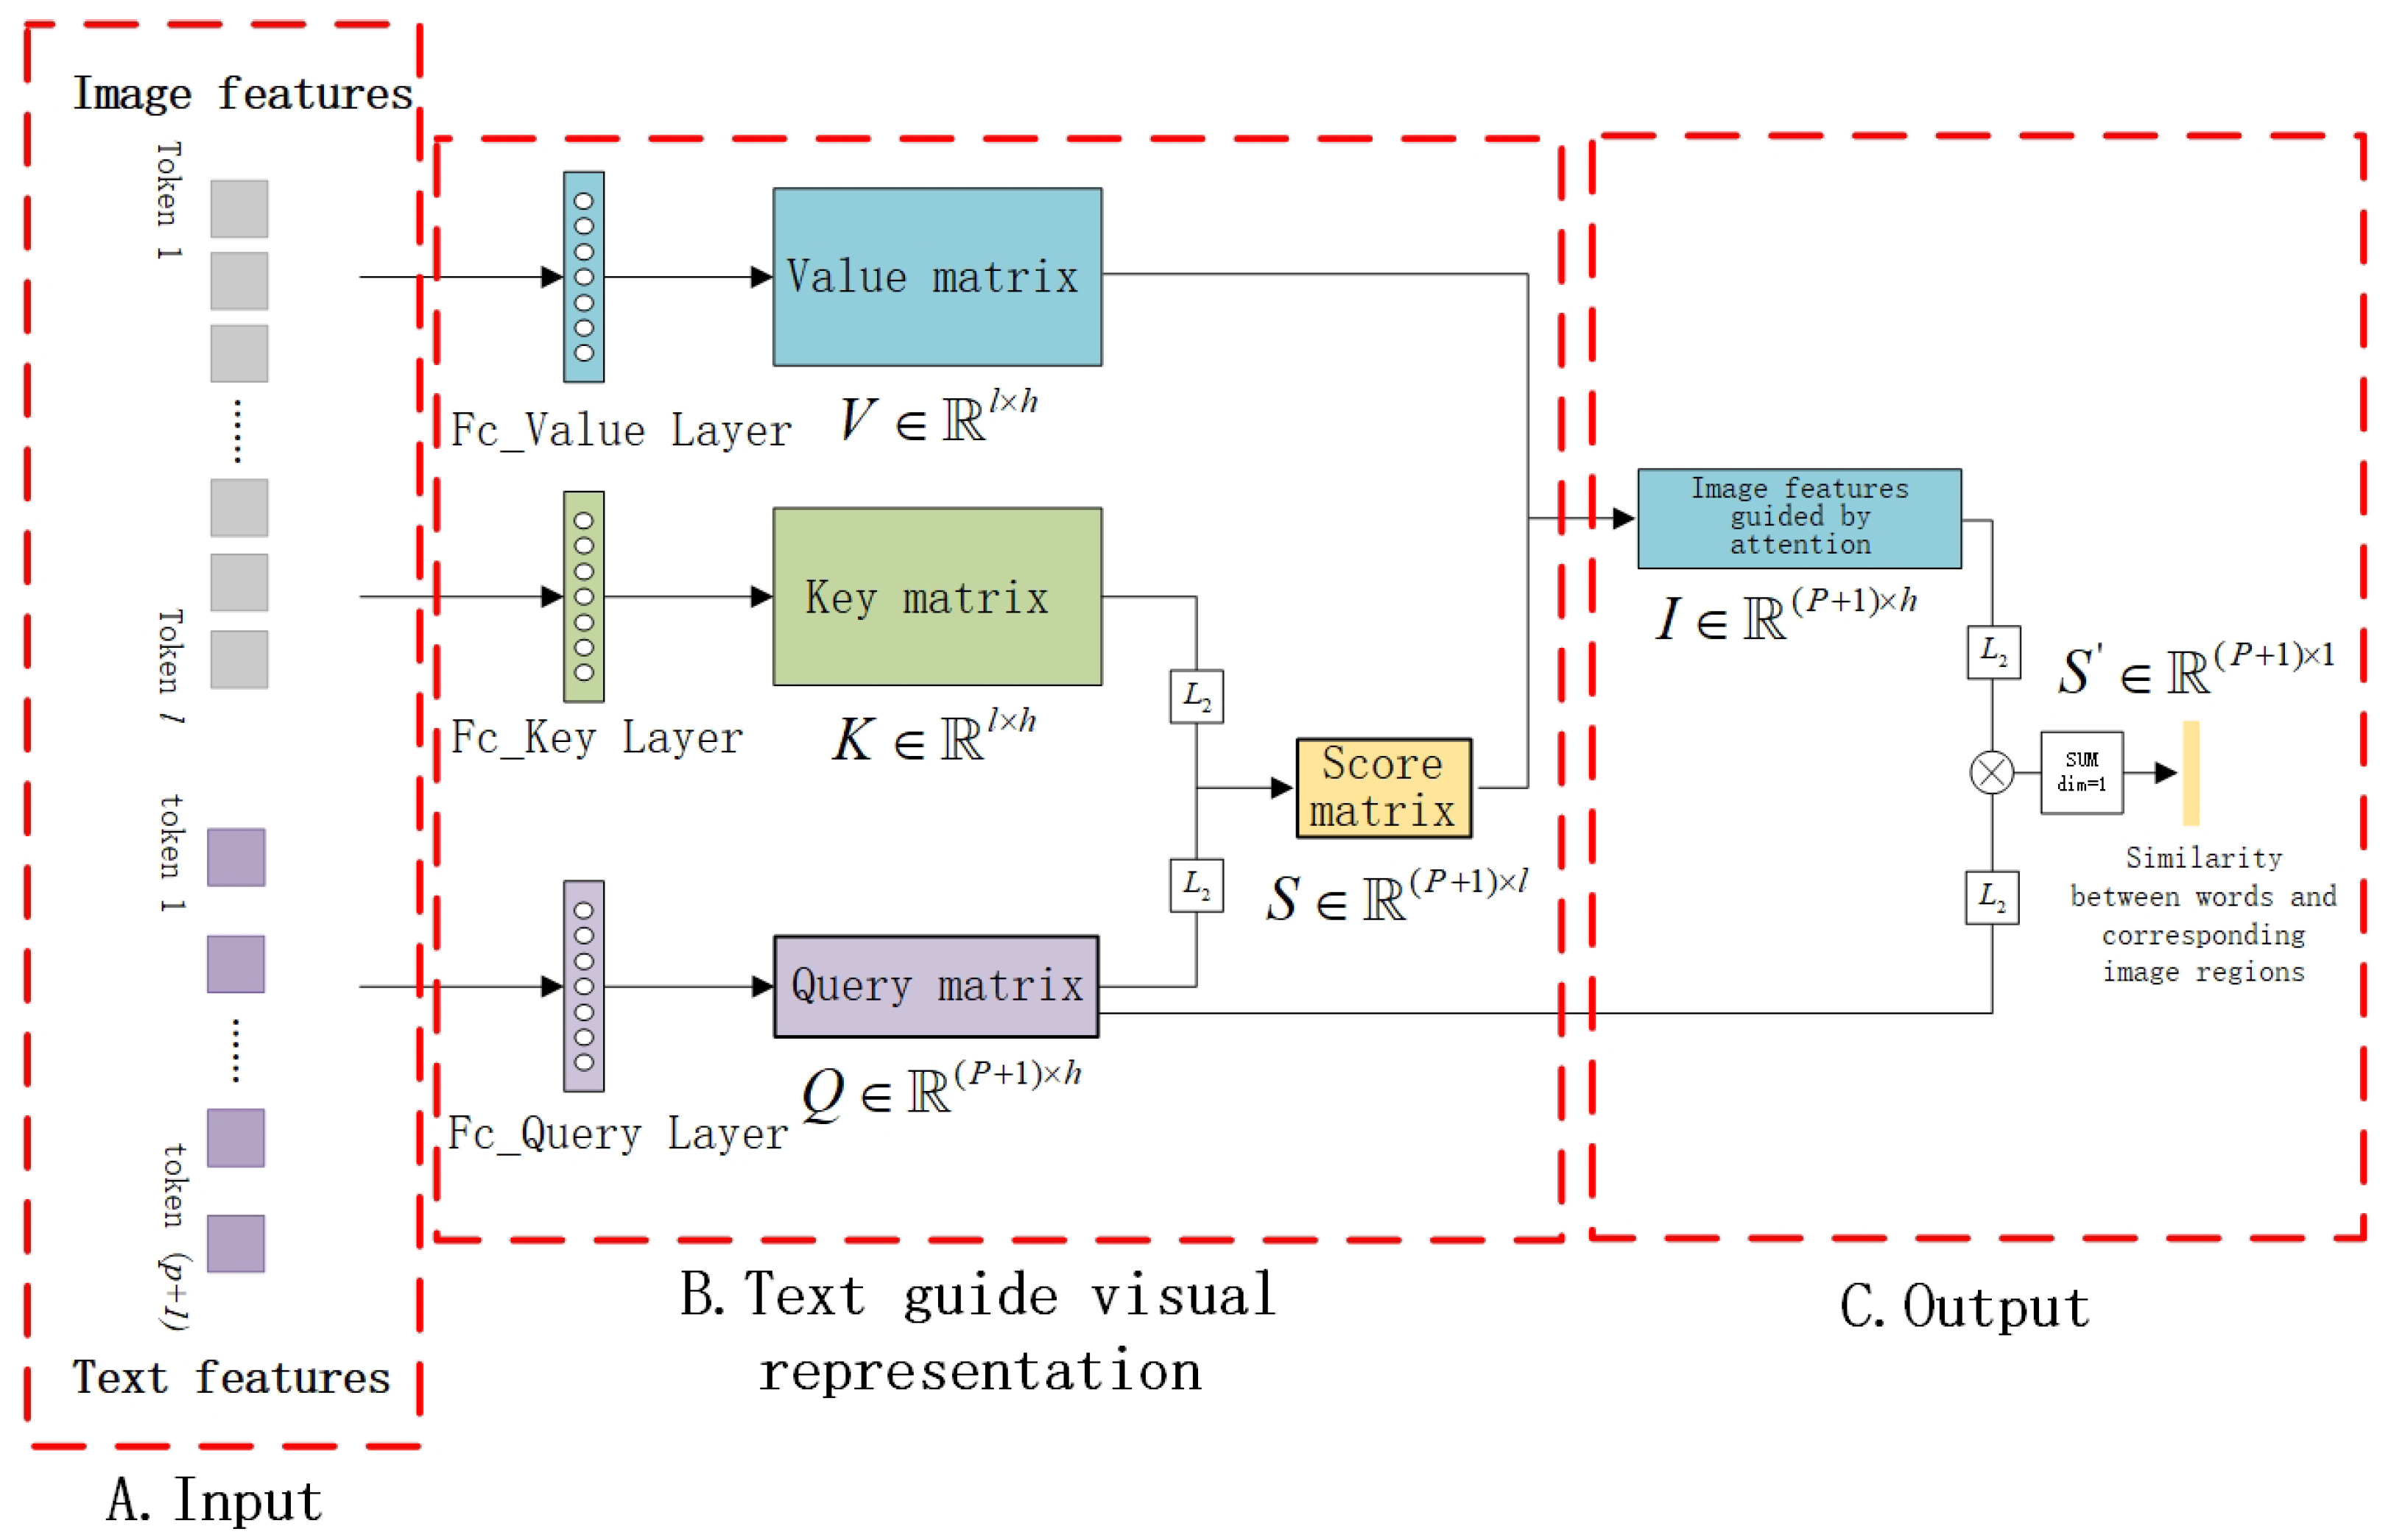
3.3. Fine-Grained Semantic Alignment Network
3.4. Target Function
4. Experimental Results
4.1. Dataset and Assessment Indices
4.2. Experimental Settings
4.3. Basic Experiments
4.3.1. Basic Experiments on RSICD
4.3.2. Basic Experiments on RSITMD
4.3.3. Search Results
4.4. Ablation Study Experiments
4.4.1. Different Backbone Networks of Image Coding
4.4.2. Different Multi-Scale Feature Construction Methods and Feature Consistency Enhancement Modules
4.4.3. Different Semantic Interaction Methods
4.4.4. Different Margins
5. Discussion
6. Conclusions
Author Contributions
Funding
Institutional Review Board Statement
Informed Consent Statement
Data Availability Statement
Acknowledgments
Conflicts of Interest
References
- Liang, W.; Li, J.; Diao, W.; Sun, X.; Fu, K.; Wu, Y. FGATR-Net: Automatic Network Architecture Design for Fine-Grained Aircraft Type Recognition in Remote Sensing Images. Remote Sens. 2020, 12, 4187. [Google Scholar] [CrossRef]
- Heijden, G.M.F.; Proctor, A.D.C.; Calders, K.; Chandler, C.J.; Field, R.; Foody, G.M.; Krishna Moorthy, S.M.; Schnitzer, S.A.; Waite, C.E.; Boyd, D.S. Making (Remote) Sense of Lianas. J. Ecol. 2022, 110, 498–513. [Google Scholar] [CrossRef]
- Zhang, X.; Wang, Z.; Zhang, J.; Wei, A. MSANet: An Improved Semantic Segmentation Method Using Multi-Scale Attention for Remote Sensing Images. Remote Sens. Lett. 2022, 13, 1249–1259. [Google Scholar] [CrossRef]
- Rusnák, M.; Goga, T.; Michaleje, L.; Šulc Michalková, M.; Máčka, Z.; Bertalan, L.; Kidová, A. Remote Sensing of Riparian Ecosystems. Remote Sens. 2022, 14, 2645. [Google Scholar] [CrossRef]
- Xiong, J.; Chen, T.; Wang, M.; He, J.; Wang, L.; Wang, Z. A Method for Fully Automatic Building Footprint Extraction From Remote Sensing Images. Can. J. Remote Sens. 2022, 48, 520–533. [Google Scholar] [CrossRef]
- Algarni, A.D.; Alturki, N.; Soliman, N.F.; Abdel-Khalek, S.; Mousa, A.A.A. An Improved Bald Eagle Search Algorithm with Deep Learning Model for Forest Fire Detection Using Hyperspectral Remote Sensing Images. Can. J. Remote Sens. 2022, 48, 609–620. [Google Scholar] [CrossRef]
- Agersborg, J.A.; Luppino, L.T.; Anfinsen, S.N.; Jepsen, J.U. Toward Targeted Change Detection with Heterogeneous Remote Sensing Images for Forest Mortality Mapping. Can. J. Remote Sens. 2022, 48, 826–848. [Google Scholar] [CrossRef]
- Wei, H.; Ma, L.; Liu, Y.; Du, Q. Combining Multiple Classifiers for Domain Adaptation of Remote Sensing Image Classification. IEEE J. Sel. Top. Appl. Earth Obs. Remote Sens. 2021, 14, 1832–1847. [Google Scholar] [CrossRef]
- Luo, C.; Ma, L. Manifold Regularized Distribution Adaptation for Classification of Remote Sensing Images. IEEE Access 2018, 6, 4697–4708. [Google Scholar] [CrossRef]
- Tong, X.Y.; Xia, G.S.; Lu, Q.; Shen, H.; Li, S.; You, S.; Zhang, L. Land-Cover Classification with High-Resolution Remote Sensing Images Using Transferable Deep Models. Remote Sens. Environ. 2020, 237, 111322. [Google Scholar] [CrossRef]
- Scott, G.J.; Klaric, M.N.; Davis, C.H.; Shyu, C.R. Entropy-Balanced Bitmap Tree for Shape-Based Object Retrieval From Large-Scale Satellite Imagery Databases. IEEE Trans. Geosci. Remote Sens. 2011, 49, 1603–1616. [Google Scholar] [CrossRef]
- Demir, B.; Bruzzone, L. Hashing-Based Scalable Remote Sensing Image Search and Retrieval in Large Archives. IEEE Trans. Geosci. Remote Sens. 2016, 54, 892–904. [Google Scholar] [CrossRef]
- Chi, M.; Plaza, A.; Benediktsson, J.A.; Sun, Z.; Shen, J.; Zhu, Y. Big Data for Remote Sensing: Challenges and Opportunities. Proc. IEEE 2016, 104, 2207–2219. [Google Scholar] [CrossRef]
- Cao, R.; Zhang, Q.; Zhu, J.; Li, Q.; Li, Q.; Liu, B.; Qiu, G. Enhancing Remote Sensing Image Retrieval Using a Triplet Deep Metric Learning Network. Int. J. Remote Sens. 2020, 41, 740–751. [Google Scholar] [CrossRef]
- Sumbul, G.; Ravanbakhsh, M.; Demir, B. Informative and Representative Triplet Selection for Multilabel Remote Sensing Image Retrieval. IEEE Trans. Geosci. Remote Sens. 2022, 60, 11. [Google Scholar] [CrossRef]
- Yun, M.S.; Nam, W.J.; Lee, S.W. Coarse-to-Fine Deep Metric Learning for Remote Sensing Image Retrieval. Remote Sens. 2020, 12, 219. [Google Scholar] [CrossRef]
- Roy, S.; Sangineto, E.; Demir, B.; Sebe, N. Metric-Learning-Based Deep Hashing Network for Content-Based Retrieval of Remote Sensing Images. IEEE Geosci. Remote Sens. Lett. 2021, 18, 226–230. [Google Scholar] [CrossRef]
- Yuan, Z.; Zhang, W.; Fu, K.; Li, X.; Deng, C.; Wang, H.; Sun, X. Exploring a Fine-Grained Multiscale Method for Cross-Modal Remote Sensing Image Retrieval. IEEE Trans. Geosci. Remote Sens. 2022, 60, 1–19. [Google Scholar] [CrossRef]
- Abdullah, T.; Bazi, Y.; Al Rahhal, M.M.; Mekhalfi, M.L.; Rangarajan, L.; Zuair, M. TextRS: Deep Bidirectional Triplet Network for Matching Text to Remote Sensing Images. Remote Sens. 2020, 12, 405. [Google Scholar] [CrossRef]
- Rahhal, M.M.A.; Bazi, Y.; Abdullah, T.; Mekhalfi, M.L.; Zuair, M. Deep Unsupervised Embedding for Remote Sensing Image Retrieval Using Textual Cues. Appl. Sci. 2020, 10, 8931. [Google Scholar] [CrossRef]
- Cheng, Q.; Zhou, Y.; Fu, P.; Xu, Y.; Zhang, L. A Deep Semantic Alignment Network for the Cross-Modal Image-Text Retrieval in Remote Sensing. IEEE J. Sel. Top. Appl. Earth Obs. Remote Sens. 2021, 14, 4284–4297. [Google Scholar] [CrossRef]
- Cheng, Q.; Zhou, Y.; Huang, H.; Wang, Z. Multi-Attention Fusion and Fine-Grained Alignment for Bidirectional Image-Sentence Retrieval in Remote Sensing. IEEE/CAA J. Autom. Sin. 2022, 9, 1532–1535. [Google Scholar] [CrossRef]
- Yuan, Z.; Zhang, W.; Tian, C.; Rong, X.; Zhang, Z.; Wang, H.; Fu, K.; Sun, X. Remote Sensing Cross-Modal Text-Image Retrieval Based on Global and Local Information. IEEE Trans. Geosci. Remote Sens. 2022, 60, 1–16. [Google Scholar] [CrossRef]
- Yu, H.; Yao, F.; Lu, W.; Liu, N.; Li, P.; You, H.; Sun, X. Text-Image Matching for Cross-Modal Remote Sensing Image Retrieval via Graph Neural Network. IEEE J. Sel. Top. Appl. Earth Obs. Remote Sens. 2023, 16, 812–824. [Google Scholar] [CrossRef]
- Yuan, Z.; Zhang, W.; Rong, X.; Li, X.; Chen, J.; Wang, H.; Fu, K.; Sun, X. A Lightweight Multi-Scale Crossmodal Text-Image Retrieval Method in Remote Sensing. IEEE Trans. Geosci. Remote Sens. 2022, 60, 1–19. [Google Scholar] [CrossRef]
- Alsharif, N.A.; Bazi, Y.; Al Rahhal, M.M. Learning to Align Arabic and English Text to Remote Sensing Images Using Transformers. In Proceedings of the 2022 IEEE Mediterranean and Middle-East Geoscience and Remote Sensing Symposium (M2GARSS), Istanbul, Turkey, 7–9 March 2022; pp. 9–12. [Google Scholar] [CrossRef]
- Mikriukov, G.; Ravanbakhsh, M.; Demir, B. Unsupervised Contrastive Hashing for Cross-Modal Retrieval in Remote Sensing. In Proceedings of the ICASSP 2022—2022 IEEE International Conference on Acoustics, Speech and Signal Processing (ICASSP), Singapore, Singapore, 23–27 May 2022; pp. 4463–4467. [Google Scholar] [CrossRef]
- Li, H.; Xiong, W.; Cui, Y.; Xiong, Z. A Fusion-Based Contrastive Learning Model for Cross-Modal Remote Sensing Retrieval. Int. J. Remote Sens. 2022, 43, 3359–3386. [Google Scholar] [CrossRef]
- Lv, Y.; Xiong, W.; Zhang, X.; Cui, Y. Fusion-Based Correlation Learning Model for Cross-Modal Remote Sensing Image Retrieval. IEEE Geosci. Remote Sens. Lett. 2022, 19, 1–5. [Google Scholar] [CrossRef]
- Yao, F.; Sun, X.; Liu, N.; Tian, C.; Xu, L.; Hu, L.; Ding, C. Hypergraph-Enhanced Textual-Visual Matching Network for Cross-Modal Remote Sensing Image Retrieval via Dynamic Hypergraph Learning. IEEE J. Sel. Top. Appl. Earth Obs. Remote Sens. 2023, 16, 688–701. [Google Scholar] [CrossRef]
- Wang, Y.; Ma, J.; Li, M.; Tang, X.; Han, X.; Jiao, L. Multi-Scale Interactive Transformer for Remote Sensing Cross-Modal Image-Text Retrieval. In Proceedings of the IGARSS 2022—2022 IEEE International Geoscience and Remote Sensing Symposium, Kuala Lumpur, Malaysia, 17–22 July 2022; pp. 839–842. [Google Scholar] [CrossRef]
- Li, Y.; Chen, Y.; Wang, N.; Zhang, Z.X. Scale-Aware Trident Networks for Object Detection. In Proceedings of the 2019 IEEE/CVF International Conference on Computer Vision (ICCV), Seoul, Republic of Korea, 27 October–2 November 2019; pp. 6053–6062. [Google Scholar] [CrossRef]
- Li, Z.; Peng, C.; Yu, G.; Zhang, X.; Deng, Y.; Sun, J. DetNet: Design Backbone for Object Detection. In Computer Vision—ECCV 2018; Ferrari, V., Hebert, M., Sminchisescu, C., Weiss, Y., Eds.; Springer International Publishing: Cham, Switzerland, 2018; Volume 11213, pp. 339–354. [Google Scholar] [CrossRef]
- Elizar, E.; Zulkifley, M.A.; Muharar, R.; Zaman, M.H.M.; Mustaza, S.M. A Review on Multiscale-Deep-Learning Applications. Sensors 2022, 22, 7384. [Google Scholar] [CrossRef]
- He, K.; Zhang, X.; Ren, S.; Sun, J. Spatial Pyramid Pooling in Deep Convolutional Networks for Visual Recognition. IEEE Trans. Pattern Anal. Mach. Intell. 2015, 37, 1904–1916. [Google Scholar] [CrossRef]
- Adelson, E.H.; Anderson, C.H.; Bergen, J.R.; Burt, P.J.; Ogden, J.M. Pyramid Methods in Image Processing. RCA Eng. 1983, 29, 33–41. [Google Scholar]
- Lowe, D.G. Distinctive Image Features from Scale-Invariant Keypoints. Int. J. Comput. Vis. 2004, 60, 91–110. [Google Scholar] [CrossRef]
- Dalal, N.; Triggs, B. Histograms of Oriented Gradients for Human Detection. In Proceedings of the 2005 IEEE Computer Society Conference on Computer Vision and Pattern Recognition (CVPR’05), San Diego, CA, USA, 20–25 June 2005; Volume 1, pp. 886–893. [Google Scholar] [CrossRef]
- Hao, Z.; Liu, Y.; Qin, H.; Yan, J.; Li, X.; Hu, X. Scale-Aware Face Detection. In Proceedings of the 2017 IEEE Conference on Computer Vision and Pattern Recognition (CVPR), Honolulu, HI, USA, 21–26 July 2017; pp. 1913–1922. [Google Scholar] [CrossRef]
- Singh, B.; Davis, L.S. An Analysis of Scale Invariance in Object Detection—SNIP. In Proceedings of the 2018 IEEE/CVF Conference on Computer Vision and Pattern Recognition, Salt Lake City, UT, USA, 18–23 June 2018; pp. 3578–3587. [Google Scholar] [CrossRef]
- Singh, B.; Najibi, M.; Davis, L.S. SNIPER: Efficient Multi-Scale Training. In Proceedings of the 2018 International Conference on Neural Information Processing Systems (NIPS), Montréal, QC, Canada, 3–8 December 2018; pp. 9333–9343. [Google Scholar]
- Dollar, P.; Wojek, C.; Schiele, B.; Perona, P. Pedestrian Detection: A Benchmark. In Proceedings of the 2009 IEEE Conference on Computer Vision and Pattern Recognition, Miami, FL, USA, 20–25 June 2009; pp. 304–311. [Google Scholar] [CrossRef]
- Chen, L.C.; Papandreou, G.; Kokkinos, I.; Murphy, K.; Yuille, A.L. DeepLab: Semantic Image Segmentation with Deep Convolutional Nets, Atrous Convolution, and Fully Connected CRFs. IEEE Trans. Pattern Anal. Mach. Intell. 2018, 40, 834–848. [Google Scholar] [CrossRef] [PubMed]
- Kim, S.W.; Kook, H.K.; Sun, J.Y.; Kang, M.C.; Ko, S.J. Parallel Feature Pyramid Network for Object Detection. In Computer Vision—ECCV 2018; Lecture Notes in Computer Science; Ferrari, V., Hebert, M., Sminchisescu, C., Weiss, Y., Eds.; Springer: Cham, Switzerland, 2018; pp. 239–256. [Google Scholar] [CrossRef]
- Chen, L.C.; Papandreou, G.; Schroff, F.; Adam, H. Rethinking Atrous Convolution for Semantic Image Segmentation. arXiv 2017, arXiv:1706.05587. [Google Scholar]
- Zhao, H.; Shi, J.; Qi, X.; Wang, X.; Jia, J. Pyramid Scene Parsing Network. In Proceedings of the 2017 IEEE Conference on Computer Vision and Pattern Recognition (CVPR), Honolulu, HI, USA, 21–26 July 2017; pp. 6230–6239. [Google Scholar] [CrossRef]
- Liu, W.; Anguelov, D.; Erhan, D.; Szegedy, C.; Reed, S.; Fu, C.Y.; Berg, A.C. SSD: Single Shot MultiBox Detector. In Computer Vision—ECCV 2016; Lecture Notes in Computer Science; Leibe, B., Matas, J., Sebe, N., Welling, M., Eds.; Springer: Cham, Switzerland, 2016; pp. 21–37. [Google Scholar] [CrossRef]
- Sermanet, P.; LeCun, Y. Traffic Sign Recognition with Multi-Scale Convolutional Networks. In Proceedings of the The 2011 International Joint Conference on Neural Networks, San Jose, CA, USA, 31 July–5 August 2011; pp. 2809–2813. [Google Scholar] [CrossRef]
- Lin, T.-Y.; Dollár, P.; Girshick, R.; He, K.; Hariharan, B.; Belongie, S. Feature Pyramid Networks for Object Detection. arXiv 2016, arXiv:1612.03144. [Google Scholar]
- Liu, S.; Qi, L.; Qin, H.; Shi, J.; Jia, J. Path Aggregation Network for Instance Segmentation. In Proceedings of the 2018 IEEE/CVF Conference on Computer Vision and Pattern Recognition, Salt Lake City, UT, USA, 18–23 June 2018; pp. 8759–8768. [Google Scholar] [CrossRef]
- Kong, T.; Sun, F.; Huang, W.; Liu, H. Deep Feature Pyramid Reconfiguration for Object Detection. In Computer Vision—ECCV 2018; Lecture Notes in Computer Science; Ferrari, V., Hebert, M., Sminchisescu, C., Weiss, Y., Eds.; Springer: Cham, Switzerland, 2018; pp. 172–188. [Google Scholar] [CrossRef]
- Pang, J.; Chen, K.; Shi, J.; Feng, H.; Ouyang, W.; Lin, D. Libra R-CNN: Towards Balanced Learning for Object Detection. In Proceedings of the 2019 IEEE/CVF Conference on Computer Vision and Pattern Recognition (CVPR), Long Beach, CA, USA, 15–20 June 2019; pp. 821–830. [Google Scholar] [CrossRef]
- Tan, M.; Pang, R.; Le, Q.V. EfficientDet: Scalable and Efficient Object Detection. In Proceedings of the 2020 IEEE/CVF Conference on Computer Vision and Pattern Recognition (CVPR), Seattle, WA, USA, 13–19 June 2020; pp. 10778–10787. [Google Scholar] [CrossRef]
- Ghiasi, G.; Lin, T.Y.; Le, Q.V. NAS-FPN: Learning Scalable Feature Pyramid Architecture for Object Detection. In Proceedings of the 2019 IEEE/CVF Conference on Computer Vision and Pattern Recognition (CVPR), Long Beach, CA, USA, 15–20 June 2019; pp. 7029–7038. [Google Scholar] [CrossRef]
- Ren, S.; Zhou, D.; He, S.; Feng, J.; Wang, X. Shunted Self-Attention via Multi-Scale Token Aggregation. In Proceedings of the 2022 IEEE/CVF Conference on Computer Vision and Pattern Recognition (CVPR), New Orleans, LA, USA, 18–24 June 2022; pp. 10843–10852. [Google Scholar] [CrossRef]
- Kim, W.; Son, B.; Kim, I. Vilt: Vision-and-language transformer without convolution or region supervision. In Proceedings of the 38th International Conference on Machine Learning, Virtual Event, 18–24 July 2021; pp. 5583–5594. [Google Scholar]
- He, K.; Zhang, X.; Ren, S.; Sun, J. Deep Residual Learning for Image Recognition. In Proceedings of the 2016 IEEE Conference on Computer Vision and Pattern Recognition (CVPR), Las Vegas, NV, USA, 27–30 June 2016; pp. 770–778. [Google Scholar] [CrossRef]
- Devlin, J.; Chang, M.W.; Lee, K.; Toutanova, K. BERT: Pre-Training of Deep Bidirectional Transformers for Language Understanding. In Proceedings of the 2019 Conference of the North American Chapter of the Association for Computational Linguistics: Human Language Technologies; Association for Computational Linguistics: Minneapolis, MN, USA, 2019; pp. 4171–4186. [Google Scholar] [CrossRef]
- Gao, Z.; Xie, J.; Wang, Q.; Li, P. Global Second-Order Pooling Convolutional Networks. In Proceedings of the 2019 IEEE/CVF Conference on Computer Vision and Pattern Recognition (CVPR), Long Beach, CA, USA, 15–20 June 2019; pp. 3019–3028. [Google Scholar] [CrossRef]
- Hu, J.; Shen, L.; Albanie, S.; Sun, G.; Wu, E. Squeeze-and-Excitation Networks. IEEE Trans. Pattern Anal. Mach. Intell. 2020, 42, 2011–2023. [Google Scholar] [CrossRef] [PubMed]
- Guo, M.H.; Xu, T.X.; Liu, J.J.; Liu, Z.N.; Jiang, P.T.; Mu, T.J.; Zhang, S.H.; Martin, R.R.; Cheng, M.M.; Hu, S.M. Attention Mechanisms in Computer Vision: A Survey. Comput. Vis. Media 2022, 8, 331–368. [Google Scholar] [CrossRef]
- Faghri, F.; Fleet, D.J.; Kiros, J.R.; Fidler, S. VSE++: Improving Visual-Semantic Embeddings with Hard Negatives. arXiv 2017, arXiv:1707.0561. [Google Scholar]
- Lu, X.; Wang, B.; Zheng, X.; Li, X. Exploring Models and Data for Remote Sensing Image Caption Generation. IEEE Trans. Geosci. Remote Sens. 2018, 56, 2183–2195. [Google Scholar] [CrossRef]
- Huang, Y.; Wu, Q.; Song, C.; Wang, L. Learning Semantic Concepts and Order for Image and Sentence Matching. In Proceedings of the 2018 IEEE/CVF Conference on Computer Vision and Pattern Recognition, Salt Lake City, UT, USA, 18–23 June 2018; pp. 6163–6171. [Google Scholar] [CrossRef]
- Lee, K.H.; Chen, X.; Hua, G.; Hu, H.; He, X. Stacked Cross Attention for Image-Text Matching. arXiv 2018, arXiv:1803.08024. [Google Scholar]


| Method | Text Retrieval | Image Retrieval | |||||
|---|---|---|---|---|---|---|---|
| R@1 | R@5 | R@10 | R@1 | R@5 | R@10 | mR | |
| SCAN-t2i | 4.39 | 10.90 | 17.64 | 3.91 | 16.20 | 26.49 | 13.25 |
| SCAN-i2t | 5.85 | 12.89 | 19.84 | 3.71 | 16.40 | 26.73 | 14.23 |
| AMFMN-soft | 5.05 | 14.53 | 21.57 | 5.05 | 19.74 | 31.04 | 16.02 |
| AMFMN-fusion | 5.39 | 15.08 | 23.40 | 4.90 | 18.28 | 31.44 | 16.42 |
| AMFMN-sim | 5.21 | 14.72 | 21.57 | 4.08 | 17.00 | 30.60 | 15.53 |
| CMFM-Net | 5.40 | 18.66 | 28.55 | 5.31 | 18.57 | 30.03 | 17.75 |
| HyperMatch | 7.14 | 20.04 | 31.02 | 6.08 | 20.37 | 33.82 | 19.75 |
| FAAMI | 10.44 | 22.66 | 30.89 | 8.11 | 25.59 | 41.37 | 23.18 |
| Method | Text Retrieval | Image Retrieval | |||||
|---|---|---|---|---|---|---|---|
| R@1 | R@5 | R@10 | R@1 | R@5 | R@10 | mR | |
| SCAN-t2i | 10.18 | 28.53 | 38.49 | 10.10 | 28.98 | 43.53 | 26.64 |
| SCAN-i2t | 11.06 | 25.88 | 39.38 | 9.82 | 29.38 | 42.12 | 26.28 |
| AMFMN-soft | 11.06 | 25.88 | 39.82 | 9.82 | 33.94 | 51.90 | 28.74 |
| AMFMN-fusion | 11.06 | 29.20 | 38.72 | 9.96 | 34.03 | 52.96 | 29.32 |
| AMFMN-sim | 10.63 | 24.78 | 41.81 | 11.51 | 34.69 | 54.87 | 29.72 |
| CMFM-Net | 10.84 | 28.76 | 40.04 | 10.00 | 32.83 | 47.21 | 28.28 |
| HyperMatch | 11.73 | 28.10 | 38.05 | 9.16 | 32.31 | 46.64 | 27.66 |
| FBCLM | 12.84 | 30.53 | 45.89 | 10.44 | 37.01 | 57.94 | 32.44 |
| FAAMI | 16.15 | 35.62 | 48.89 | 12.96 | 42.39 | 59.96 | 35.99 |
| RSICD | RSITMD | ||||||
|---|---|---|---|---|---|---|---|
| Method | mR | Time | FLOPs | Method | mR | Time | FLOPs |
| FAAMI–Res50 | 21.33 | 602 s | 3.8 × 10⁹ | FAAMI–Res50 | 32.63 | 269 s | 3.8 × 10⁹ |
| FAAMI–Res152 | 22.89 | 699 s | FAAMI–Res152 | 34.06 | 323 s | ||
| FAAMI–DetNet | 21.42 | 626 s | FAAMI–DetNet | 33.66 | 284 s | ||
| RSICD | ||||||||
|---|---|---|---|---|---|---|---|---|
| Method | Text Retrieval | Image Retrieval | mR | Time | ||||
| R@1 | R@5 | R@10 | R@1 | R@5 | R@10 | |||
| No MS | 8.70 | 21.11 | 30.16 | 6.80 | 23.06 | 38.70 | 21.42 | 626 s |
| With SPP | 9.52 | 21.66 | 28.79 | 7.13 | 25.56 | 40.16 | 22.14 | 675 s |
| No FCEM | 8.07 | 21.12 | 28.98 | 6.87 | 24.26 | 39.60 | 21.48 | 603 s |
| No GSoP | 8.88 | 20.92 | 30.26 | 6.38 | 24.72 | 41.15 | 22.05 | 664 s |
| No TF | 9.34 | 21.93 | 30.71 | 7.06 | 24.33 | 39.91 | 22.21 | 793 s |
| with SPP & No FCEM | 8.8 | 20.93 | 29.61 | 6.16 | 24.24 | 39.45 | 21.53 | 592 s |
| FAAMI | 10.44 | 22.66 | 30.89 | 8.11 | 25.59 | 41.37 | 23.18 | 809 s |
| RSITMD | ||||||||
|---|---|---|---|---|---|---|---|---|
| Method | Text Retrieval | Image Retrieval | mR | Time | ||||
| R@1 | R@5 | R@10 | R@1 | R@5 | R@10 | |||
| No MS | 13.71 | 30.42 | 48.23 | 11.58 | 40.13 | 57.88 | 33.66 | 284 s |
| With SPP | 14.82 | 34.29 | 47.12 | 13.41 | 40.22 | 59.46 | 34.89 | 292 s |
| No FCEM | 13.27 | 34.07 | 46.68 | 11.93 | 40.56 | 59.16 | 34.27 | 274 s |
| No GSoP | 13.05 | 33.85 | 50.00 | 10.53 | 41.86 | 60.71 | 35.00 | 293 s |
| No TF | 14.60 | 33.85 | 47.35 | 12.52 | 40.80 | 58.76 | 34.64 | 357 s |
| with SPP & No FCEM | 11.95 | 33.41 | 48.45 | 11.81 | 41. 42 | 59.12 | 34.36 | 253 s |
| FAAMI | 16.15 | 35.62 | 48.89 | 12.96 | 42.39 | 59.96 | 35.99 | 368 s |
Disclaimer/Publisher’s Note: The statements, opinions and data contained in all publications are solely those of the individual author(s) and contributor(s) and not of MDPI and/or the editor(s). MDPI and/or the editor(s) disclaim responsibility for any injury to people or property resulting from any ideas, methods, instructions or products referred to in the content. |
© 2023 by the authors. Licensee MDPI, Basel, Switzerland. This article is an open access article distributed under the terms and conditions of the Creative Commons Attribution (CC BY) license (https://creativecommons.org/licenses/by/4.0/).
Share and Cite
Zheng, F.; Wang, X.; Wang, L.; Zhang, X.; Zhu, H.; Wang, L.; Zhang, H. A Fine-Grained Semantic Alignment Method Specific to Aggregate Multi-Scale Information for Cross-Modal Remote Sensing Image Retrieval. Sensors 2023, 23, 8437. https://doi.org/10.3390/s23208437
Zheng F, Wang X, Wang L, Zhang X, Zhu H, Wang L, Zhang H. A Fine-Grained Semantic Alignment Method Specific to Aggregate Multi-Scale Information for Cross-Modal Remote Sensing Image Retrieval. Sensors. 2023; 23(20):8437. https://doi.org/10.3390/s23208437
Chicago/Turabian StyleZheng, Fuzhong, Xu Wang, Luyao Wang, Xiong Zhang, Hongze Zhu, Long Wang, and Haisu Zhang. 2023. "A Fine-Grained Semantic Alignment Method Specific to Aggregate Multi-Scale Information for Cross-Modal Remote Sensing Image Retrieval" Sensors 23, no. 20: 8437. https://doi.org/10.3390/s23208437
APA StyleZheng, F., Wang, X., Wang, L., Zhang, X., Zhu, H., Wang, L., & Zhang, H. (2023). A Fine-Grained Semantic Alignment Method Specific to Aggregate Multi-Scale Information for Cross-Modal Remote Sensing Image Retrieval. Sensors, 23(20), 8437. https://doi.org/10.3390/s23208437