Abstract
Technological advancements are enabling new applications within biomedical engineering. As a connection point between the outer environment and the human system, the oral cavity offers unique opportunities for sensing technologies. This paper systematically reviews the performance of measurement systems tested in the human oral cavity. Performance was defined by metrics related to accuracy and agreement estimation. A comprehensive search identifying human studies that reported on the accuracy or agreement of intraoral sensors found 85 research papers. Most of the literature (62%) was in dentistry, followed by neurology (21%), and physical medicine and rehabilitation (12%). The remaining papers were on internal medicine, obstetrics, and aerospace medicine. Most of the studies applied force or pressure sensors (32%), while optical and image sensors were applied most widely across fields. The main challenges for future adoption include the lack of large human trials, the maturity of emerging technologies (e.g., biochemical sensors), and the absence of standardization of evaluation in specific fields. New research should aim to employ robust performance metrics to evaluate their systems and incorporate real-world evidence as part of the evaluation process. Oral cavity sensors offer the potential for applications in healthcare and wellbeing, but for many technologies, more research is needed.
1. Introduction
The development of sensor technologies fuelled the evolution of biomedical sciences [1,2]. Ubiquitous devices allowed continuous and real-time monitoring of individuals in the most diverse settings and applications [3]. As a connecting point between the outer environment and human systems, the oral cavity offers unique opportunities for non-invasive monitoring not found in other conveniently available locations in the body.
The oral cavity is an important part of the human body. It is an accessible invasive anatomical site with a direct linkage to the digestive and respiratory systems [4,5]. It also has proximity to the brain and offers a connection to the circulatory and nervous systems [6]. The oral cavity is a gateway for air, food, medications, infectious microbes, and toxic substances to the body [7]. Besides being the obvious site for maintaining dental health, the oral cavity also has systemic importance for human health. Several systematic chronic diseases (such as rheumatoid arthritis, atherosclerosis, and Alzheimer’s disease) have been connected to oral diseases [8,9].
The oral cavity has been the focus of dentistry for decades. However, several medical fields are now looking to harness the prognostic potential of this site by placing sensors in it. Saliva and breathed air are rich biologic media that can be analyzed for potential diseases, infectious agents, or metabolic changes [10,11,12]. Respiration can also be leveraged for non-invasive disease diagnosis through the detection of certain biomarkers [11,12,13]. The aforementioned proximity to the brain and nervous system and the direct role in speech, swallowing and breathing makes the oral cavity a further promising site for monitoring and diagnosing neurological pathologies.
Nonetheless, the oral cavity is a harsh environment for sensors. The constant contact with air, matter, metabolites, and enzymes greatly limits the sensor technologies, materials and approaches that can be applied inside the mouth. The presence of bones, teeth and hard and soft tissues provides challenges in terms of sensor placement and design. The wet environment of the oral cavity also demands the use of wet materials or wet-endurable materials [14,15,16]. Integration of these materials with different solid substrates is a requirement for the stable performance of some intraoral sensors [17]. Furthermore, considerations in terms of hygiene are paramount for gaining regulatory approval.
Advances in sensor technologies have progressed the research and development of oral cavity sensors [18,19]. Whilst early stage testing and validation of body sensors can be performed on models (including computational models, animal models and biomimetic models), a successful sensor will need to be tested in humans. The testing will need to fit the requirements, which can differ depending on the setting (e.g., clinical, sports, or home settings).
Clinical trials are crucial to measuring the safety and effectiveness of devices, confirming, validating, and complementing data from the bench and/or animal testing [20]. Human trials are also important for identifying and mitigating usability errors due to human factors, a mandatory evaluation of medical devices [21]. Contrary to the belief that human factors are easy or “common sense,” the numerous product recalls and adverse events reinforce the need to test sensor systems for a wide range of users to account for person-to-person variation [22]. Most studies explore a research concept and only reported laboratory results, as the oral cavity is an extremely challenging location for real-world (clinical) testing. Furthermore, clear reporting on performance metrics is required to allow for comparisons between developed oral cavity sensor techniques.
This review systematically identifies and assesses which sensor technologies were successfully employed in the oral cavity and how they performed. This work will help identify challenges and possible research gaps associated with the development of oral sensors. The main research questions are:
- What sensor technologies have been tested in the human mouth?
- Which fields of study develop sensor technologies for the mouth?
- What is the performance of these sensors in terms of accuracy and/or agreement?
2. Methods
This systematic review was structured following the Preferred Reporting Items for Systematic Reviews and Meta-Analyses (PRISMA) guideline [23,24]. The review was registered with PROSPERO (CRD42020199089).
The literature search was conducted in Medline, Embase, IEEEXplore, Scopus and Web of Science. The search strategy included the keywords: (“Monitoring device” OR “Transducer” OR “Sensor” OR “Microsensor” OR “Sensing device” OR “Biosensor” OR “Biosensing” OR “Instrumented”) AND (“Oral” OR “Mouth” OR “Intraoral” OR “Mouthguard” OR “Tooth”). The search terms were selected and combined to obtain all papers related to measurement systems and sensor placements inside the oral cavity of humans. The final search included all English-language peer-reviewed papers published until the 12th of October 2022.
All peer-reviewed journal articles evaluating the performance of sensors placed in the oral cavity were included if they consisted of trials conducted on living humans. Studies based on animal testing were excluded. The performance evaluation needed to be the primary or secondary outcome of the study for inclusion. Extended abstracts, conference papers, posters and unpublished studies were not accepted for further review. No restrictions based on clinical settings or participant groups were imposed. Only methods where the actual sensing instrument is placed inside of the oral cavity were selected, even if part of the signal processing was performed outside of the mouth. Studies in which the sensing device is positioned outside of the mouth, but connected to the oral cavity through pipes, tubes, or any other channels, were excluded. Studies must contain an outcome measure–methodology alone does not suffice, and they must report estimates of accuracy/agreement, including measures of statistical uncertainty using valid statistical methods. The list of appropriate statistical methods was built following [25,26,27]. Accepted methods for estimation of agreement were Bland–Altman plot/limits of agreement analysis, intraclass correlation coefficient, Lin’s concordance correlation coefficient, British standards reproducibility/repeatability coefficient, Kappa and Weighted kappa coefficients. Accepted methods for estimation of accuracy were accuracy, sensitivity, specificity, false-positive rate, false-negative rate, mean square error/deviation, root mean square error/deviation, mean absolute error/deviation, and metrics derived from those.
All eligible studies that could not be accessed through library services were attempted to be obtained by contacting the corresponding author.
The primary outcome was to describe the current availability and performance of oral cavity sensors tested in living humans. The secondary outcomes were to assess the quality of the methodology reporting concerning the adapted Specialist Unit for Review Evidence (SURE) [28] and the Quality Assessment of Diagnostic Accuracy Studies–2 (QUADAS-2) [29]. A total of 13 items were selected for the quality assessment.
The titles, abstracts and full texts were screened by two reviewers (LAB and MTK). Clearly unrelated studies were rejected. Quality assessment was performed by LAB and confirmed by a second reader (MTK). At any stage, in cases of discrepancies unresolved by discussion, the third reviewer (JHMB) was consulted.
Due to the heterogeneous nature of study designs, results and outcomes, a formal quantitative analysis would not be appropriate. Instead, similar numerical reports were combined to provide a narrative summary.
3. Results
A total of 13,899 studies were found in the searched databases. After duplicate removal 6950 papers went through the title and abstract screen and 5356 papers were excluded. The remaining 491 papers were fully read, and 85 papers were finally selected. The PRISMA flow diagram of search results is shown in Figure 1. Figure 2 and Figure 3 provide the breakdown of the fields of study and sensor technologies that were addressed by the identified literature.
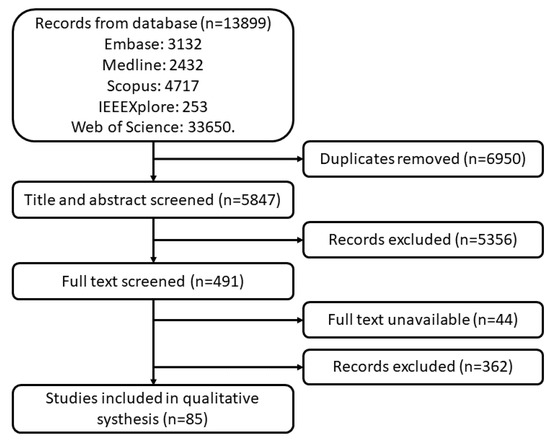
Figure 1.
PRISMA flow diagram of search results.
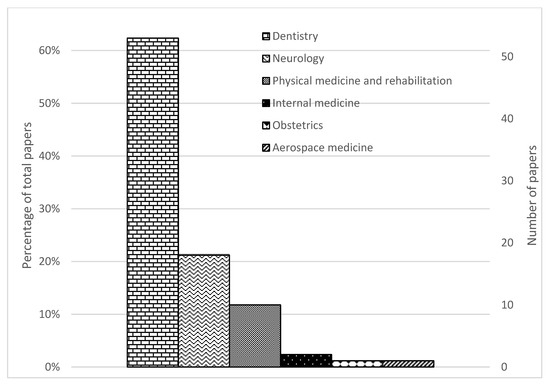
Figure 2.
PRISMA flow diagram of search results.
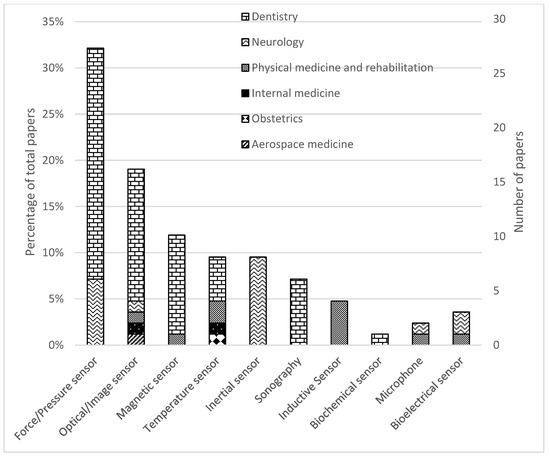
Figure 3.
Distribution of papers by field of study and sensor technology.
Forty-four full texts were not retrieved. Attempts to contact the authors were made, but no responses were received.
3.1. Quality Assessment
Several aspects regarding the paper quality were assessed in this review (see Table 1). Across all literature, 47 papers (47/85, 55%) reported an appropriate reference standard for the human tests. The main reason for this is that some measurements were validated in vitro using calibration machines. In total, 26 (26/85, 31%) of the papers did not report ethical approval, but it should be noted that 10 papers were published before the 5th revision of the Declaration of Helsinki [30] in the year 2000. It was also found that 22 papers (22/85, 26%) did not adequately report the limitations of their research.

Table 1.
Quality Assessment Checklist.
3.2. Fields of Study
The identified studies were classified according to the definitions by the American Medical Association [31] and the American Dental Association [32]. Around 62% (53/85) of the studies were in dentistry, 21% (18/85) were in neurology, 12% (10/85) were on physical medicine and rehabilitation, 2% (2/85) was on internal medicine, 1% (1/85) was on obstetrics and 1% (1/85) was on aerospace medicine.
3.3. Sensor Technologies
Categorizing the papers based on sensor technology we observe that 27 studies (27/85, 32%) employed force or pressure sensors (21/85 in dentistry and 6/85 in neurology). Sixteen studies (16/85, 19%) employed optical or image sensors, including x-ray (12/85 in dentistry, 1/85 in neurology, 1/85 in physical medicine and rehabilitation, 1/85 in aerospace medicine). A total of ten studies (10/85, 12%) employed magnetic sensors (9/85 in dentistry, 1/85 in physical medicine and rehabilitation). Eight studies (8/85, 9%) employed inertial measurement units for neurology. Eight studies (8/85, 9%) used temperature sensors (4/85 in dentistry, 2/85 in physical medicine and rehabilitation, 1/85 in internal medicine, and 1/85 in obstetrics). Seven studies (6/85, 7%) used sonography in dentistry. Four studies (4/85, 5%) used inductive sensors for physical medicine and rehabilitation. Three studies (3/85, 4%) tested bioelectrical sensors (2/85 in neurology, 1/85 in physical medicine and rehabilitation). Two studies (2/85, 2%) tested microphones (1/85 in neurology, 1/85 in physical medicine and rehabilitation). One study (1/85, 1%) tested a biosensor for dentistry. A breakdown of (i) sensor technologies, (ii) their applications, (iii) the metrics reported and (iv) the considerations me in thereviewed papers can be found in Table 2.
Table 2.
A list of field of application for each sensor technology, as well as their performance metric and any technical consideration reported on within the papers. It should be noted that a single paper or study might explore multiple sensor technologies.
3.4. Study Settings
About half of the studies (41/85, 48%) had a small sample size with 20 or fewer subjects. On some occasions this did not reflect on the size of the dataset acquired, as multiple measurements were taken from individuals under different conditions or separate sessions.
A total of 42 studies (42/85, 49%) were performed in academic settings with 31 studies including only healthy adults, five studies (5/85, 6%) included participants with some health or dental condition, four studies had mixed populations (4/85, 5%), and one study was conducted on a healthy paediatric sample population (1/85, 1%). Thirty-five studies (35/85, 41%) were performed in a clinical setting including university hospitals, with 32 studies (32/85, 38%) being performed with subjects who suffered from a health or dental condition and two studies performed with only healthy volunteers (2/85, 2%). Eight studies (8/85, 9%) were performed in a sport setting with a group of healthy volunteers. One study (1/85, 1%) did not specify the study population.
3.5. Agreement and Accuracy
A total of 31 studies (31/85, 36%) mentioned agreement metrics. Seven studies (7/85, 8%) reported Bland–Altman analysis, 16 studies (16/85, 19%) reported intraclass correlation coefficients, 8 studies (8/85, 9%) reported Kappa analysis and one study (1/85, 1%) applied concordance correlation coefficient.
In total, 62 studies (62/85, 73%) reported accuracy metrics. Twenty-five (25/85, 29%) studies reported classification accuracy in terms of predictive accuracy and derived metrics. Thirty-seven (37/85, 44%) studies reported accuracy in terms of error rates.
3.5.1. Dentistry
A total of 53 studies were found in the area of dentistry and an overview of paper characteristics is given in Table S1 of the Supplementary Material.
Four studies (4/85, 5%) within endodontics reported the accuracy of modified pulse oximeters in diagnosing dental pulp vitality. Reported accuracies were between 98.75% and 100% while sensitivities ranged between 97.5 to 100% and specificity was found to always be 100% [51,52,53,54].
One study (1/85, 1%) used blood perfusion images to diagnose subsurface cancer. The imager had an overall sensitivity of 96.6% and specificity of 100%. Accuracy in differentiating specific cancer cells from normal tissue varied between 96.6 and 100% [65].
One study (1/85, 1%) used a biochemical sensor to measure salivary pH. The study identified, embedded a miniature pH sensor in a denture and tested it on a 69-year-old woman for 7.5 h. The system presented a calibration error of a maximum of 0.15 pH between pH 5 to 9 (maximum 3%), and up to 0.42 pH for pH ranging from 2 to 12 (maximum 21%) [107].
Five studies in prosthodontics (5/85, 6%) used magnetic systems to perform resonance frequency analysis, a technique where a peg screwed or glued to a tooth (or implant pin) is vibrated using controlled pulses until a mechanical resonance frequency is found [108]. Three studies published by the same group reported agreement metrics for the Osstell devices for measuring implant stability through resonance frequency analysis. Using the intraclass correlation coefficient the studies reported repeatability and reproducibility for the transducer between 0.96 and 0.98 [68,69,70]. Two studies reported sensitivity and specificity of the use of resonance frequency analysis in the diagnosis of tooth ankylosis (specificity of 100% and a sensitivity of 20 to 53.3% depending on measurement direction) [71] and implant failure (sensitivity of 95.2% and specificity of 71.4% with the optimal threshold value) [67].
Seven studies in oral radiology (7/85, 8%) describe imaging technology in dentistry for assessing dental health and diagnosing dental caries and bone defects. Two studies reported the diagnostic accuracy of an image sensor using near-infrared light transillumination for proximal caries detection in permanent teeth. One reported sensitivity of 99.1%, specificity of 94.1%, and accuracy of 97.1% [57]. The study reported Cohen’s kappa coefficient of 93.9% for assessing agreement between caries detection readings [57]. The other study reported sensitivities of up to 84.8%, specificities of up to 97.1%, and accuracies of up to 96.9% for detecting different caries when comparing near-infrared radiology to bitewing radiology. This study also reported sensitivities of up to 88.8%, specificities of up to 97%, and accuracies of up to 99.4% for detecting different caries when compared to clinical direct observation. Agreement between compared methods yielded Kappa coefficients between 0.24 and 0.86 [63]. Three studies used intraclass correlation coefficients to measure the reliability of digital intraoral radiography for a dental assessment. A photostimulable phosphor storage plate x-ray sensor had up to 98.1% agreement with clinical practice in detecting bone defects [60], and up to 51% of observers agreed with the potential of vertical bitewing radiographs in detecting caries when compared with horizontal bitewings [61], while specialists’ agreement on overall image quality superiority from a complementary metal-oxide-semiconductor (CMOS) sensor over a charge-coupled device (CCD) was 66% (95% CI 30% to 87%) [56]. Vertical bitewing images had agreement varying from 23.4 to 51% when compared to horizontal images and clinical observation in identifying caries and bone loss. One study had two specialists identifying artefacts in intraoral periapical and bitewing radiographs. Observers’ agreement resulted in a Kappa coefficient of 99%, operator errors were 70.4%, while plate errors were 19.3% and scanning errors 10.3% [59]. One study reported an agreement of 53.7% with Cronbach Alpha of 84.2% between two specialists for the measurement of external root resorption in the paediatric population. The mean error was 0.73 ± 2.16 mm while the mean absolute error was 1.81 ± 1.40 mm [58].
Four studies (4/85, 5%) applied magnetic sensors in orthodontics. Three studies (3/85, 4%) published by the same group investigated the use of four to eight magnetic sensors embedded in epoxy resin for measuring tooth displacement in orthodontic treatments. The studies reported the calibration/linearity error of the system in measuring the displacement of a tooth. A digital micro-gauge sensor placed in a motorized testing machine was used for calibration. The studies reported errors ranging from 0.2% to 10% depending on the number of sensors and data processing used [72,73,74]. The errors derived from temperature variation were also explored and it was found that displacement measurements varied between 0.20 and 0.33 µm/°C [73]. One study (1/85, 1%) used two tri-axial magnetic sensors placed in the oral-cavity, a controlled magnetic field and a soft polyurethane rubber sample to measure chewing force. The root mean squared error of 1.39 N between the compression pressure tested on the rubber sample and the chewing force estimated from the magnetic sensors [109].
Four studies (4/85, 5%) applied temperature sensors in dentistry. Three studies identified (3/85, 4%), applied thermosensitive microsensors to record the wear time of a sleep apnoea oral appliance. The sensors are encapsulated in medical resin or silicone and are designed to record the temperature at fixed intervals (in minutes) over a period of several months. The temperature records are used to identify how long users wore the appliance in the mouth. All studies reported the under-recording error as their accuracy metric. Recorded wear time had an error varying from 1.70 to 4.2% depending on the device used, as well as the monitoring period [77,79,80]. One study used Bland–Altman analysis and intraclass correlation coefficients as reliability metrics when comparing the digitally registered used time with patient-reported use times. The Bland–Altman limit for digitally registered usage was −0.17 (95% CI: 1.47 to −1.81) hours and the intraclass correlation coefficient was 0.847 (95% CI: 0.834–0.859) for digital and manual record agreements [80]. As a secondary outcome, one study also found that palatal sensors registered a wider temperature range than sensors in the lower buccal sulcus [79]. One study (1/85, 1%) used a thermocouple to measure the temperature difference between intact and gold-restored teeth during intake of hot and cold drinks. The study reported an error of 0.4% when calibrating the sensor between 10–40 °C in a controlled water bath [83].
Thirteen studies (13/85, 15%) were interested in quantifying bite strength in adult patients and healthy adult and paediatric populations. Seven studies reported calibration error and those four studies assessed accuracy drifts due to temperature [35,43], dynamic forces [110], and force direction [110]. Calibration errors reported were less than 1% [36,41,111], around 2% calibration [38,43], and above 4% [33,34]. The error values are not directly comparable because of the variable sensor designs, testing conditions, and error calculations used. Five studies used intraclass correlation coefficient to measure the repeatability of bite force measurements using force sensing resistors (ICC = 0.93) [46], a miniature load cell (ICC = 0.719) [112], or bite forks (ICC = 0.3–0.64 for inter-observer reliability and ICC = 0.63–0.96 for intra-observer reliability) [47,48,109]. One study used Kappa analysis to calculate inter-device reliability (Kappa = 0.8132 ± 0.0544 and 0.8303 ± 0.0538) [109]. One study employed Bland-Analysis to calculate the reliability of a bite force sensor. The study reported 99.5% reliability but did not present any Bland-Analysis plots [113].
One study (1/85, 1%) used a capacitive-type pressure-mapping sensor to classify oral hypofunction in the elderly population. The authors identified low occlusal force with a sensitivity of 75 to 79% and specificity of 75 to 81% [50].
Four studies (4/85, 5%) were interested in measuring soft-tissue forces on teeth. One study employed an intraclass correlation coefficient to quantify the reliability of a beam-type pressure sensor and a diaphragm-type pressure sensor for measuring lip pressure on teeth. The reported ICC ranged from 0.86 to 0.98 for the beam-type sensor and 0.97 to 0.99 for the diaphragm-type sensor [37]. The other three studies reported calibration errors ranging from 1.5% to 4% [35,114,115].
Two studies (2/85, 2%) were interested in diagnosing sleep bruxism based on mouth-clenching patterns. One study reported diagnostic accuracy based on data collected from one healthy subject (sensitivity ranging from 80 to 100% and specificity from 75 to 100%) [49]. Another study used a customized retainer with a pressure sensor in eight subjects to classify bruxism events and reported accuracy of 82.2%, f1-score of 72.4%, sensitivity of 66.5%, specificity of 90.7%, positive predictability of 84.4%, and negative predictability of 83.8% [39].
Another paper (1/85, 1%) quantified the force exerted by a laryngoscope, on the soft tissue of the mouth, during transoral surgery [40]. The study employed force-sensing resistors embedded in a custom-designed laryngoscope cover. The system was calibrated in a specially designed machine and calibration error was accessed in both static and dynamic conditions. The study also evaluated errors due to prolonged application or off-centred forces. A calibration error of less than 5% was mentioned [40].
A total of six papers (6/85, 7%) investigated the performance of sonography in humans. Four studies evaluated the use of ultrasound systems for assessing soft tissue in the mouth, while two studies evaluated the use of ultrasound for assessing oral cancer.
Three studies (3/85, 4%) reported agreement metrics on bone loss and soft-tissue identification. One study used the intraclass correlation coefficient to assess the reproducibility of measurement of buccal bone loss around implants using a linear 12.5 MHz ultrasound [95]. Measurements of moderate bone loss levels had an intraclass correlation coefficient of 0.76 to 0.81 while assessment of marginal bone loss at normal and advanced bone loss levels had an intraclass correlation coefficient of 0.63 to 0.73. The method error ranged from 4.2 to 6.6% [95]. One study evaluated the performance of a new hockey stick transducer in measuring periodontal pockets. Bland–Altman analysis demonstrated that 95% of the replicates fell within 3.2 mm of the differences between the new transducer and the current clinical reference. The agreement between rates was 0.61 to 0.90 [92]. Another study designed a 25 MHz brightness-mode ultrasound transducer and applied Cohen’s kappa coefficient to evaluate its reliability in distinguishing soft tissues in the mouth [94]. The inter-observer agreement to obtain a correct positioning of the probe for interpretable images was κ = 0.90 (p < 0.05), to distinguish the bone level κ = 0.97 (p < 0.05), to distinguish the marginal gingiva was κ = 0.90 (p < 0.05), to visualize the mucogingival line was κ = 0.79 (p < 0.05) [94].
Three studies (3/85, 4%) reported predictive accuracy as accuracy metrics for detecting peritonsillar abscess (100%, 95% CI = 75 to 100%) [97], for diagnostic of oral (100%, specificity 91%, and predictive value 94%) and oropharyngeal cancer invasion in the mandibula (sensitivity 77%, specificity 85%, and predictive value 81%), and to guide the need for neck dissection for cancer treatment (positive predictive value of 36.7%, identifying 63.3% of neck dissections as negative) [93]. One paper (1/85, 1%) reported the mean measurement error of tongue cancer tumour thickness, with measurements made using a 15–7 MHz linear ultrasound. These were then compared against histological findings. The average ultrasound measurement error established was 1.28 mm [96]. This study also generated Bland–Altman plots, but precise results could not be extracted from the figures and the plots were not discussed in the text.
3.5.2. Neurology
A total of 18 studies were found for neurology. The study characteristics of these papers are given in Table S2 of the Supplementary Material.
One of the studies found (1/85, 1%) used an intraoral microphone to track breathing during sleep and diagnose obstructive sleep apnoea. It compared the automatic classification of apnoea (and snoring events) based on audio data captured by a tracheal microphone with that of an oral microphone [105]. The oral microphone captured sound frequencies on the spectrum around 1 kHz, which were not present in the data of the tracheal microphone. The oral sensor had a sensitivity of 96.6%, a positive predictive value of 96.6% and a false negative rate of 3.4%, while the tracheal microphone had a sensitivity of 72.9%, a positive predictive value of 97.7% and a false negative rate of 27.1% [105].
Research (1/85, 1%) was also conducted to explore measurements of blood oxygen levels in the mouth for application in sleep apnoea [55]. They found the accuracy of a mouth photoplethysmogram when compared to a fingertip pulse oximeter in awake healthy volunteers, to be 99% [55].
Six studies (6/85, 7%) focused on using pressure sensors for measuring tongue-palatal forces related to swallowing and speech. One paper reported on the classification accuracy (from 93% to 96%) of swallow and non-swallow events, based on the pressure of the tongue on the palate [116]. A second paper showed that a similar sensing technique could yield a sensitivity of 60–87% and a specificity of 71–94% for diagnosing dysphagia in stroke patients [117]. A third study compared sensors for measuring oro-lingual pressures during speech (maximum errors of 8–16% depending on the sensor) [42]. Finally, three studies used the intraclass correlation coefficient to measure the repeatability of tongue-palatal pressure measurements (ICC ranged from 0.687 to 0.956 depending on the conditions) [44,45,118]. One study also reported a standard error of measurement of 14.2% and a minimal detectable change of 38.5% [118].
Two studies used bioelectrical sensors in swallowing and speech. One study used Cohen’s kappa and reported an agreement of 95.6% to 95.8% between trans membranous EMG and needle EMG for assessment of oral cavity muscles (Prevalence-adjusted-bias-adjusted kappa of 0.91 to 0.92) [103]. Another study assessed neuromuscular pathology in the oral cavity and the conduction properties of the tongue (0.1% accuracy) [102].
A total of eight papers (8/85, 9%) investigated the application of microelectromechanical system (MEMS) inertial sensors in the mouth with the intent to monitor head impacts.
One study used the concordance correlation coefficient to evaluate the reliability of commercial mouthguards in impact tests with anthropomorphic test devices (ATDs). Mouthguards were found to have an overall concordance correlation coefficient ranging from 0.80 to 0.97 [86].
Four studies reported normalized root mean square errors for linear and angular accelerations and velocity. Three studies reported errors from impacting anthropomorphic test devices (outcomes ranged from 4.08 ± 1.56% to 9.9 ± 4.4% for linear acceleration, from 9.08 ± 2.98% to 9.7 ± 7.0% for angular acceleration, and 4.39 ± 1.20% to 10.4 ± 9.9% for angular velocity) [88,90,119]. One study reported errors from video-tracked kinematics (15.5 ± 6.0% for anterior-posterior linear acceleration, 18.1 ± 10.0% for inferior–superior linear acceleration, and 12.2 ± 7.0% for sagittal angular velocity), and also reported relative displacement error of the mouthguard in comparison with an earplug reference point (errors of displacement within 1 mm. More than 90% of the errors were within 0.5 mm) [87].
Five studies (5/85, 6%) reported accuracy in detecting video-validated head impacts as accuracy metrics. Mouthguards were found to have an overall sensitivity ranging from 69.2% to 100% and a positive predictive value ranging from 55.0 to 96.4% depending on the device, minimum impact threshold, and data processing technique [85,86,88,89]. Using a series of untuned classifiers, one study reported an average true positives rate of 77.84% and a true negative rate of 89.55% [91]. The best classifier identified was an XGBoost-based model with true positive rates ranging from 94.67 to 100% and true negative rates ranging from 95.65 to 96.83% depending on the used dataset [91].
Physical and Rehabilitation Medicine
Six studies (6/85, 7%) evaluated the accuracy of tongue-computer interfaces for severely paralyzed individuals (see Table S3 of the Supplementary Material). Four papers used inductive sensor keys fixed on a palatal plate activated by a ferromagnetic activation unit either glued or pierced to the tip of the tongue. One paper used computer vision and an endoscope camera attached to a mouthguard to identify tongue movements [66]. One study applied four 3-axis magnetic sensors to track the movements of a magnetic tracer glued on the tongue [75].
Three of the six papers used a throughput metric based on movement speed, and accuracy to evaluate generic typing performance. This metric was used to identify the best system layout for typing and tracing tasks. The other two studies used error rates to quantify the performance of the systems in error-free writing and moving cursors and select targets on a screen. For the inductive system, the overall throughput in typing with the keyboard keys was 1.73 bits/s [98], for typing with the mousepad it was 0.60 bits/s [99]. The magnetic system had an overall throughput of 1.25 bits/s in virtual maze navigation and tapping tasks [75].
Two studies out of the six studies reported average correct characters type per minute e and the overall error rate as metrics of performance in typing tasks. The endoscope interface had an average error-free typing rate of 8.152 correct characters/min (maximum 19.34 correct characters/min) and an overall error of 4.95% [66] while the inductive system average performance of 11.6 correct characters/min, with mean error rates ranging from 0 to 36.2% in error-free text writing [101]. One of them reported root mean squared error as low as 0.97 mm (6.5%) when used as a joystick for moving a cursor in the computer [100]. One also tested for operational errors and involuntary activations of the system due to speech and temperature errors [99].
One study (1/85, 1%) assessed the mean error rate and the accuracy of a palatal electrotactile display for rehabilitating tongue motor control individuals with neurotraumas and neurological disorders. The participants identified the stimulation signals with 92.5% accuracy. The mean error reduced from 3.97 ± 0.11 to 0.53 ± 0.19 with proper training [104].
Bland–Altman’s plots were used in one paper (1/85, 1%) to evaluate commercial oral thermometers in estimating body temperature. Oral temperatures were found to have a mean difference to core temperature smaller than −0.1 °C when at rest, 0.9, 0.6 and 0.5 °C colder in recovery, exercise in the heat with wind, and exercise in heat without wind, respectively [81]. Mean differences above 0.5 °C were considered unacceptable by the study. Another study compared the accuracy of a mouthguard instrumented with a digital thermometer when tested in a range of temperatures in a controlled water bath and when worn by a human subject. The study observed that even when the mean absolute error from the experiments is similar (around 0.2 °C) the time to steady state varied significantly (690 s for the water bath compared to 1110 s for the human test) [78].
One study (1/85, 1%) used a microphone embedded in a mouthguard to estimate the perceived exertion of athletes in running exercises. The study reported a normalised root-mean-squared error of 16.20% [106].
Internal Medicine
Two studies were found for internal medicine (2/85, 2%). One study evaluated the performance of resonance Raman spectroscopy in measuring tissue haemoglobin oxygenation noninvasively in critically ill patients against central venous haemoglobin oxygen saturation. The study reported a Clarke Error Grid where 84.8% of the data was within the accurate and acceptable grids. The clinical utility yielded an agreement of 0.45 [64]. The other study evaluated the agreement between commercial electronic thermometers against a gold-standard arterial thermometer in estimating the body temperature of patients in critical care (see Table S4 of the Supplementary Material). Oral temperature measured using a battery-free mercury electronic thermometer was found to have a mean error of −0.62 ± 0.34 °C from the arterial temperature reference [84]. The same study reported a mean error of –0.46 ± 0.16 °C of measurement from the axilla compared to the reference using the same device [84].
Obstetrics
Table S5 of the Supplementary Material includes the characteristics of one paper (1/85, 1%) that observed a significant difference between oral temperature measurements from electronic and disposable chemical devices in postpartum mothers (mean difference −0.169 ± 0.397 °C) [82].
Aerospace Medicine
One study (1/85, 1%) (see Table S6 of the Supplementary Material) applied a near-infrared spectra sensor for measuring the blood oxygen level in pilots as a marker for the detection of hypoxia. The study reported the root mean squared error (RMSE) for measuring blood oxygen level (RMSE = 0.266) and blood flow (RMSE = 0.003) in altitude [62].
4. Discussion
The goal of this review was to provide a comprehensive overview of human studies that reported on the performance of oral-based sensor technologies. The use of such sensing systems in, e.g., clinical and sports settings could provide multiple potential benefits. The fast improvement of microtechnology in recent years combined with the interest in data science and artificial intelligence opens possibilities for sophisticated uses of biological and physical signals that are measurable in the mouth (e.g., image sensors combined with classification algorithms to detect oral pathologies, or inertial sensors combined with artificial intelligence to classify head impacts).
4.1. Summary of Evidence
The number of papers, study designs and sensor technologies vary widely across the fields of study.
As expected, dentistry represents the majority of the papers with studies investigating bite force, soft tissue, implant stability, and oral pathologies. Dentistry also has the earliest reports of intraoral sensors development, with 37% of the identified studies published before 2010. Later studies focused more on the assessment of dental health, as well as the detection and diagnosis of pathologies, such as caries, cancer, and bruxism. Future studies could include a combination of sensing technologies and machine learning algorithms to further expand on the classification and characterization of oral diseases.
Neurology is the second field of study with most papers exploring intraoral sensors. All the identified studies in this field were published after the year 2000. The research has mainly explored the miniaturization of sensor technology and the advancements in computer capabilities to facilitate the diagnostic of neurological disorders using the oral cavity. The field has extensively applied machine learning algorithms for data cleaning and pathology characterization. However, multisensorial approaches and establishing a commonly accepted medical reference of certain conditions (such as traumatic brain injury) are recommended. This should reduce biases and provides a more clinical generalisable assessment of the technologies.
In a similar trend, the field of physical medicine and rehabilitation is rather new to this area with all papers found being published after 2010. There is a research focus on the potential that the oral cavity might bring in improving the wellbeing of paralyzed individuals and athletes. As the application of sensor technologies enables objective measurement of athletic performance and fitness, more applications of intraoral sensors for non-clinical scenarios are expected to appear. This will likely become a growing area of research interest.
The three other fields of the study found were internal medicine, obstetrics, and aerospace medicine. It shows that the sensing within the oral cavity scales across a variety of bio(medical) fields, even those usually dominated by sensor technologies that explore other body parts.
On the sensor development frontier, the most used sensors are force and pressure sensors, possibly due to the early interest in bite forces. More recently, force sensors have been used to properly quantify tongue strength, biting and deglutition patterns of individuals [42,44,45,116,117]. The use of force sensors combined with machine learning techniques enables the design of assistive technologies that aim to improve the quality of life of patients [116].
The most recent sensor advancements were focused on optical or image sensors, despite the likelihood that radiographic technologies could be under-reported in this review. Due to safety issues related to ionizing radiation, most of the digital intraoral radiology sensors are not tested in vivo and therefore did not qualify for this review. Indeed, even though some papers report strong accuracy and agreement metrics, they are frequently only tested in extracted teeth or cadavers [120,121,122]. Other reviews explore intraoral radiology in more detail [123,124]. With advancements in image processing algorithms, imaging devices are ideally placed to leverage these developments to further improve the image analsyis pipeline and provide automatic detection or diagnosis of medical conditions.
Additionally, on the rise is the use of inertial sensors in the mouth for the detection of head impacts. It is noticeable that similar methodologies for the evaluation of the devices across several research groups have been applied, which indicated good standardization in this area of research. Based on the studies found, there are however still technical barriers to using sensor data to accurately monitor head impacts and relating the data with concussions. These mainly relate to the accurate representation of head injury and the current data modalities that are being measured. On a technological level, future studies may focus on combining the data from inertial sensors with other sensor technologies to further understand the physiological outcomes of head injuries.
This review also observed some papers highlighting the difficulties in the oral environment. For temperature sensors, besides the moist environment, the mouth poses challenges due to the wide temperature variation of the oral cavity. Indeed, the studies observed temperature variations in the oral cavity between 25.9 and 43.5 °C [79]. This study also observed different temperature variations depending on the location in the oral cavity. These results have great implications for the monitoring of body temperature through the mouth. Some of the identified studies applied electronic thermometers under the tongue in sublingual pockets. These measures were taken following the standard medical practice to reduce the effect of mouth breathing and saliva evaporation, which are known to change the temperature in the mouth. However, this practice may not be viable for sensors that are kept in the mouth for long periods. Especially if they are meant to be used during for example physical activity. Future studies could investigate appropriate sensor placements, sensitivities, and response times to mitigate the challenges of measuring temperatures in the oral cavity.
Only one study employing a biochemical sensor in the oral cavity was found. Although recent studies suggest there is great potential for the use of intraoral biomarkers in health monitoring, most of the recent advancements were evaluated in laboratory bench and animal tests. They were not yet focused on reporting the accuracy and agreement of the sensors in more real-world conditions. The challenges remain in how to best deal with temperature variation, the ingestion of food and liquids, and the variability of the salivation rate. These are likely barriers to the use of biochemical sensors in the human oral cavity and need to be addressed.
Other sensors used in the mouth were microphones. One study suggests that intraoral breathing audio has a higher signal-to-noise ratio than tracheal sensors, and another study demonstrated the potential use of intraoral breathing audio to estimate perceived exertion. As could be said for research topics with few studies, this may indicate that issues related to usability and technological challenges are great barriers to the use of intraoral sensors. Nevertheless, oral microphones offer a great opportunity for monitoring athletic performance, if technical challenges related to data processing are addressed.
One interesting recent advancement was the use of bioelectrical sensors to assess tongue properties and facilitate the diagnostic of speech and swallowing disorders and rehabilitate tongue motor control in individuals with neurotraumas. All the studies with this technology were published after 2020, which demonstrates a recent maturity in the technology. Forthcoming studies in bioelectrical sensors should further investigate the clinical relevance of measured signals, especially tongue impedance.
Within the studies analysed, the area of implant stability sensors demands further investigation. A vibrating magnetic system allows clinicians to predict the survival rate and diagnose bone adhesion of teeth and implants. Although this review found three papers reporting the reliability of the measurement system, all three studies were published by the same research group, had similar methods, a possible overlap of the sampled population and came to the same conclusion from their findings [68,69,70]. The results from these studies should be reviewed with care since it is unclear how generalizable the findings are. More studies exploring the use of the resonance frequency analysis technique in different populations and different study designs would strengthen the evidence available.
The application of oral sensors is linked to specific clinical problems. It is therefore important to develop sensing devices that are traceable, and the development pipeline should include planning and testing to ensure reliability, safety, and stability requirements are met. Meeting these requirements allows a manufacturer to bring this medical technology to market. Medical devices cannot reach the market without clear evidence in terms of safety and performance. For this reason, MedTech development often uses a development road map based on the V Model [125] with some iterative cycles to allow for agile development techniques to be integrated [126].
As illustrated in Figure 4, the V model structure accommodates the generation of documentation and requirements planning, while agile techniques can be integrated to cater for the variability of the development. The system development starts with the definition of the intended use. At this stage, the scope and application are established through discussions with stakeholders. Next comes the stage of “system requirements specification”. During this step, the details of the clinic use, functionalities, control, performance, size, etc are defined. The third step consist of defining the system architecture and decomposing the system into subsystems. Subdivisions can consist of hardware, data handling, data presentation, etc. The fourth step is the subsystem definition, where appropriate technical solutions are chosen for each subsystem, such as the sensor technology, resolution, range, sensitivity, response times, encapsulation, placement, power, communication, and so forth. The fifth step combines implementation and unit testing. In this step, unit tests are used to ensure early verification of specific components of the hardware and software. It is also used for the quantification of some non-functional performance parameters for each component. Following the implementation, a series of test phases ensures that the systems, subsystems, and all main modules work according to the needs and requirements that have been established in the previous phases. Subsystem tests verify that each separate subsystem has the desired behaviour and output once stimulated by know signals. The design and integration tests verify that all the system modules and subsystems behave as desired once integrated with other subsystems. The system validation and verification tests ensure that the system can be applied in the desired setting. It should show that the system is effective in the target application. Finally, once all the development phases are completed, the system should be able to be applied as intended.
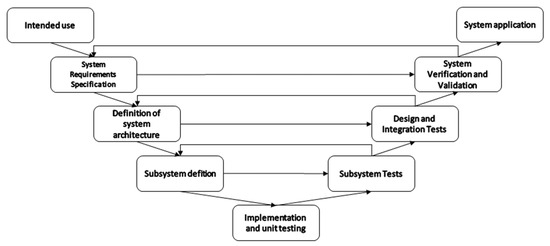
Figure 4.
Graphical representation of a V-Model development road map of measuring systems.
As this review focused on accuracy and agreement established during application within living humans, most of the captured studies report on tests that are considered in the later phases of the V-model. This can also be observed in the information given in Table 2. The considerations only include notes that are related to the stage at which a certain technology is tested. Some information that is relevant at the unit testing, for example, phase might not be captured, as this is not something that is frequently assessed alongside system verification and validation.
4.2. Limitations
Several challenges and limitations were identified in the synthesis of this review. A publication bias is identified due to the choice of searching only peer-reviewed journal articles. This choice limited the identification of early conference papers reporting new technological advancements or commercially driven projects resulting in an overall low number of representative reports of each area of study and sensor technology. The choice, however, was taken to facilitate finding high-quality reports with more meaningful data from potentially more mature fields of study.
The inclusion criteria accepting only measurements of accuracy and agreement and rejecting papers mentioning only correlation or other insufficient performance metrics also greatly limited the potential for finding new studies addressing other research fields or some of the challenges observed in the identified fields. The inclusion choice was taken to enable finding studies with concrete impactful results. However, until research on a certain technology reaches maturity to allow for agreement and accuracy metrics to be carefully assessed there is potential for under-reporting and lead-time bias.
The inclusion criteria also meant that studies focused on later stages of the development, resulting in reports with limited information on technical details of each sensor technology, whilst more information was included with regard to the validation of the systems during real-world applications.
5. Conclusions
Oral-cavity sensor systems are mostly researched in dentistry and neurology. Specific applications have already reached a certain level of technological maturity, such as the measurement of bite strength and forces on teeth. However, other sensing technologies are lacking behind and promising developments in, e.g., biochemical sensors still require further translational research. A key source of error identified for oral cavity sensing is temperature variations, this factor will impact the measurement outcomes of many sensors. In particular, the levels of accuracy and agreement obtained in a laboratory environment might not be representative of performance in the real world. New research should be encouraged to employ robust performance metrics to evaluate their systems and to increase real-world data collection.
Supplementary Materials
The following supporting information can be downloaded at: https://www.mdpi.com/article/10.3390/s23020588/s1, Table S1: Summary of Dentistry Study Characteristics; Table S2: Summary of Neurology Study Characteristics; Table S3: Summary of Physical Medicine and Rehabilitation Study Characteristics; Table S4: Summary of Internal Medicine Study Characteristics; Table S5: Summary of Obstetrics Study Characteristics; Table S6: Summary of Aerospace Medicine Study Characteristics.
Author Contributions
Conceptualization, L.d.A.e.B. and J.H.M.B.; methodology, L.d.A.e.B., M.T.K. and J.H.M.B.; formal analysis, L.d.A.e.B., M.T.K. and J.H.M.B.; investigation, L.d.A.e.B.; resources, L.d.A.e.B.; data curation, L.d.A.e.B.; writing—original draft preparation, L.d.A.e.B.; writing—review and editing, L.d.A.e.B., M.T.K. and J.H.M.B.; visualization, L.d.A.e.B. and J.H.M.B.; supervision, J.H.M.B.; project administration, J.H.M.B.; funding acquisition, J.H.M.B. All authors have read and agreed to the published version of the manuscript.
Funding
This project was funded by the EPSRC Impact Acceleration Grant EP/R511742/1.
Institutional Review Board Statement
Not applicable.
Informed Consent Statement
Not applicable.
Data Availability Statement
Not applicable.
Acknowledgments
The authors would like to thank the dentist Volnei Vienc for his contribution to understanding dentistry and oral health studies.
Conflicts of Interest
The authors declare no conflict of interest.
References
- Neuman, M.R. Physical Sensors for Biomedical Applications; CRC Press: Boca Raton, FL, USA, 2018; ISBN 9781351084086. [Google Scholar]
- Jones, D.P. Biomedical Sensors; Sensor Technology Series; Momentum Press: New York, NY, USA, 2010; ISBN 9781606500569. [Google Scholar]
- Paulovich, F.V.; de Oliveira, M.C.F.; Oliveira, O.N. A Future with Ubiquitous Sensing and Intelligent Systems. ACS Sens. 2018, 3, 1433–1438. [Google Scholar] [CrossRef] [PubMed]
- Mosca, A.C.; Chen, J. Food-Saliva Interactions: Mechanisms and Implications. Trends Food Sci. Technol. 2017, 66, 125–134. [Google Scholar] [CrossRef]
- Brodsky, L. Chapter 35—Structure and Development of the Upper Respiratory System in Infants and Children. In Pediatric Critical Care; Fuhrman, B.P., Zimmerman, J.J.B.T.-P.C.C., Eds.; Mosby: Saint Louis, MO, USA, 2011; pp. 485–489. ISBN 978-0-323-07307-3. [Google Scholar]
- McDowell, J. Encyclopedia of Human Body Systems; Greenwood: Westport, CT, USA, 2010; ISBN 9780313391750. [Google Scholar]
- Glandular Mechanisms of Salivary Secretion, 1st ed.; Garrett, J.R., Ekström, J., Anderson, L.C., Sharpe, P.T., Eds.; S. Karger Publishers: Basel, Switzerland, 1998; ISBN 3805566301. [Google Scholar]
- Olsen, I.; Singhrao, S.K.; Potempa, J. Citrullination as a Plausible Link to Periodontitis, Rheumatoid Arthritis, Atherosclerosis and Alzheimer’s Disease. J. Oral Microbiol. 2018, 10, 1487742. [Google Scholar] [CrossRef] [PubMed]
- Kharlamova, N.; Jiang, X.; Sherina, N.; Potempa, B.; Israelsson, L.; Quirke, A.-M.; Eriksson, K.; Yucel-Lindberg, T.; Venables, P.J.; Potempa, J.; et al. Antibodies to Porphyromonas Gingivalis Indicate Interaction Between Oral Infection, Smoking, and Risk Genes in Rheumatoid Arthritis Etiology. Arthritis Rheumatol. 2016, 68, 604–613. [Google Scholar] [CrossRef]
- Pfaffe, T.; Cooper-White, J.; Beyerlein, P.; Kostner, K.; Punyadeera, C. Diagnostic Potential of Saliva: Current State and Future Applications. Clin. Chem. 2011, 57, 675–687. [Google Scholar] [CrossRef]
- Malon, R.S.P.; Sadir, S.; Balakrishnan, M.; Córcoles, E.P. Saliva-Based Biosensors: Noninvasive Monitoring Tool for Clinical Diagnostics. Biomed. Res. Int. 2014, 2014, 1–20. [Google Scholar] [CrossRef]
- Windmiller, J.R.; Wang, J. Wearable Electrochemical Sensors and Biosensors: A Review. Electroanalysis 2013, 25, 29–46. [Google Scholar] [CrossRef]
- Aguirre, A.; Testa-Weintraub, L.A.; Banderas, J.A.; Haraszthy, G.G.; Reddy, M.S.; Levine, M.J. Sialochemistry: A Diagnostic Tool? Crit. Rev. Oral Biol. Med. 1993, 4, 343–350. [Google Scholar] [CrossRef]
- Yuk, H.; Lu, B.; Zhao, X. Hydrogel Bioelectronics. Chem. Soc. Rev. 2019, 48, 1642–1667. [Google Scholar] [CrossRef]
- Nishizawa, M. Soft, Wet and Ionic Microelectrode Systems. Bull. Chem. Soc. Jpn. 2018, 91, 1141–1149. [Google Scholar] [CrossRef]
- Jinno, H.; Fukuda, K.; Xu, X.; Park, S.; Suzuki, Y.; Koizumi, M.; Yokota, T.; Osaka, I.; Takimiya, K.; Someya, T. Stretchable and Waterproof Elastomer-Coated Organic Photovoltaics for Washable Electronic Textile Applications. Nat. Energy 2017, 2, 780–785. [Google Scholar] [CrossRef]
- Yuk, H.; Zhang, T.; Lin, S.; Parada, G.A.; Zhao, X. Tough Bonding of Hydrogels to Diverse Non-Porous Surfaces. Nat. Mater. 2016, 15, 190–196. [Google Scholar] [CrossRef] [PubMed]
- Mitsubayashi, K.; Arakawa, T. Cavitas Sensors: Contact Lens Type Sensors & Mouthguard Sensors. Electroanalysis 2016, 28, 1170–1187. [Google Scholar] [CrossRef]
- Wang, J.; Yu, J.; Wang, T.; Li, C.; Wei, Y.; Deng, X.; Chen, X. Emerging Intraoral Biosensors. J. Mater. Chem. B 2020, 8, 3341–3356. [Google Scholar] [CrossRef] [PubMed]
- Clinical Evaluation of Medical Devices—Principles and Case Studies; Becker, K.M., Whyte, J.J., Eds.; Humana Press: Totowa, NJ, USA, 2006; ISBN 978-1-58829-422-7. [Google Scholar]
- North, B. The Growing Role of Human Factors and Usability Engineering for Medical Devices. What’s Required in the New Regulatory Landscape. Available online: http://www.bsigroup.com/LocalFiles/en-GB/Medical-devices/whitepapers/The growing role of human factors and usability engineering for medical devices.pdf (accessed on 16 April 2021).
- Branaghan, R.J.; O’Brian, J.S.; Hildebrand, E.A.; Foster, L.B. Humanizing Healthcare—Human Factors for Medical Device Design; Springer International Publishing: Cham, Switzerland, 2021; ISBN 978-3-030-64432-1. [Google Scholar]
- Moher, D.; Liberati, A.; Tetzlaff, J.; Altman, D.G. Preferred Reporting Items for Systematic Reviews and Meta-Analyses: The PRISMA Statement. BMJ 2009, 339, b2535. [Google Scholar] [CrossRef] [PubMed]
- Liberati, A.; Altman, D.G.; Tetzlaff, J.; Mulrow, C.; Gøtzsche, P.C.; Ioannidis, J.P.A.; Clarke, M.; Devereaux, P.J.; Kleijnen, J.; Moher, D. The PRISMA Statement for Reporting Systematic Reviews and Meta-Analyses of Studies That Evaluate Healthcare Interventions: Explanation and Elaboration. BMJ 2009, 339, b2700. [Google Scholar] [CrossRef]
- Tang, W.; Hu, J.; Zhang, H.; Wu, P.; He, H. Kappa Coefficient: A Popular Measure of Rater Agreement. Shanghai Arch Psychiatry 2015, 27, 62–67. [Google Scholar] [CrossRef]
- Ranganathan, P.; Pramesh, C.; Aggarwal, R. Common Pitfalls in Statistical Analysis: Measures of Agreement. Perspect. Clin. Res. 2017, 8, 187–191. [Google Scholar] [CrossRef]
- Watson, P.F.; Petrie, A. Method Agreement Analysis: A Review of Correct Methodology. Theriogenology 2010, 73, 1167–1179. [Google Scholar] [CrossRef]
- Specialist Unit for Review Evidence Questions to Assist with the Critical Appraisal of Qualitative Studies. Available online: http://www.cardiff.ac.uk/specialist-unit-for-review-evidence/resources/critical-appraisal-%0Ahttp://www.cardiff.ac.uk/__data/assets/pdf_file/0006/212766/SURE_RCTs-and-other-experimental-studies_Checklist_2015-update.pdf (accessed on 14 March 2021).
- Whiting, P.F.; Weswood, M.E.; Rutjes, A.W.S.; Reitsma, J.B.; Bossuyt, P.N.M.; Kleijnen, J. Evaluation of QUADAS, a Tool for the Quality Assessment of Diagnostic Accuracy Studies. BMC Med. Res. Methodol. 2006, 6, 1–8. [Google Scholar] [CrossRef]
- WMA Declaration of Helsinki–Ethical Principles for Medical Research Involving Human Subjects. Available online: https://www.wma.net/policies-post/wma-declaration-of-helsinki-ethical-principles-for-medical-research-involving-human-subjects/ (accessed on 16 April 2021).
- American Medical Association FREIDA’s Specialty Guide—American Medical Association. Available online: https://freida.ama-assn.org/specialty (accessed on 16 April 2021).
- Dental Specialties—American Dental Association. Available online: https://www.ada.org/en/ncrdscb/dental-specialties (accessed on 16 April 2021).
- Bonakdarchian, M.; Askari, N.; Askari, M. Effect of Face Form on Maximal Molar Bite Force with Natural Dentition. Arch. Oral Biol. 2009, 54, 201–204. [Google Scholar] [CrossRef] [PubMed]
- Ferrario, V.F.; Sforza, C.; Serrao, G.; Dellavia, C.; Tartaglia, G.M. Single Tooth Bite Forces in Healthy Young Adults. J. Oral. Rehabil. 2004, 31, 18–22. [Google Scholar] [CrossRef] [PubMed]
- Lear, C.S.C.; Catz, J.; Grossman, R.C.; Flanagan, J.B.; Moorrees, C.F.A. Measurement of Lateral Muscle Forces on the Dental Arches. Arch. Oral Biol. 1965, 10, 669–690. [Google Scholar] [CrossRef]
- Lundgren, D.; Laurell, L. Occlusal Forces in Prosthetically Restored Dentitions: A Methodological Study. J. Oral Rehabil. 1984, 11, 29–37. [Google Scholar] [CrossRef] [PubMed]
- Shellhart, W.C.; Moawad, M.I.; Paterson, R.L.; Matheny, J. Lip Adaptation to Simulated Dental Arch Expansion. Part 1: Reliability and Precision of Two Lip Pressure Measurement Mechanisms. Angle Orthod. 1996, 66, 249–254. [Google Scholar] [PubMed]
- Gibbs, C.H.; Anusavice, K.J.; Young, H.M.; Jones, J.S.; Esquivel-Upshaw, J.F. Maximum Clenching Force of Patients with Moderate Loss of Posterior Tooth Support: A Pilot Study. J. Prosthet. Dent. 2002, 88, 498–502. [Google Scholar] [CrossRef]
- O’Hare, E.; Cogan, J.A.; Dillon, F.; Lowery, M.; O’Cearbhaill, E.D.; O’Hare, E.; Cogan, J.A.; Dillon, F.; Lowery, M.; O’Cearbhaill, E.D.; et al. An Intraoral Non-Occlusal MEMS Sensor for Bruxism Detection. IEEE Sens. J. 2022, 22, 153–161. [Google Scholar] [CrossRef]
- Ponukumati, A.S.; Wu, X.; Kahng, P.W.; Skinner, J.; Paydarfar, J.A.; Halter, R.J. A System for Characterizing Intraoperative Force Distribution during Operative Laryngoscopy. IEEE Trans. Biomed. Eng. 2020, 67, 2616–2627. [Google Scholar] [CrossRef]
- Mansour, R.M. Piezoelectric Transducers for Oral Force Monitoring. J. Med. Eng. Technol. 1977, 1, 95–97. [Google Scholar] [CrossRef]
- Searl, J.P. Comparison of Transducers and Intraoral Placement Options for Measuring Lingua-Palatal Contact Pressure during Speech. J. Speech Lang. Hear. Res. 2003, 46, 1444–1456. [Google Scholar] [CrossRef]
- Luffingham, J.K. A Technique for the Measurement of Soft Tissue Pressures Acting upon Teeth. Arch. Oral Biol. 1968, 13, 309–318. [Google Scholar] [CrossRef] [PubMed]
- Manning, M.; Casey, V.; Conway, R.; Saunders, J.; Perry, A. A Study of Healthy Adults’ Oro-Lingual Effort During Swallowing Using OroPress, A New Portable Wireless Measurement Tool. Dysphagia 2016, 31, 442–451. [Google Scholar] [CrossRef] [PubMed]
- McCormack, J.; Casey, V.; Conway, R.; Saunders, J.; Perry, A. OroPress a New Wireless Tool for Measuring Oro-Lingual Pressures: A Pilot Study in Healthy Adults. J. Neuroeng. Rehabil. 2015, 12, 32. [Google Scholar] [CrossRef][Green Version]
- Fernandes, C.P.; Glantz, P.O.J.; Svensson, S.A.; Bergmark, A. A Novel Sensor for Bite Force Determinations. Dent. Mater. 2003, 19, 118–126. [Google Scholar] [CrossRef] [PubMed]
- Levartovsky, S.; Peleg, G.; Matalon, S.; Tsesis, I.; Rosen, E. Maximal Bite Force Measured via Digital Bite Force Transducer in Subjects with or without Dental Implants—A Pilot Study. Appl. Sci. 2022, 12, 1544. [Google Scholar] [CrossRef]
- Khan, A.A.; McCreary, B.; Owatz, C.B.; Schindler, W.G.; Schwartz, S.A.; Keiser, K.; Hargreaves, K.M. The Development of a Diagnostic Instrument for the Measurement of Mechanical Allodynia. J. Endod. 2007, 33, 663–666. [Google Scholar] [CrossRef]
- Mcauliffe, P.; Kim, J.H.; Diamond, D.; Lau, K.T.; O’Connell, B.C. A Sleep Bruxism Detection System Based on Sensors in a Splint—Pilot Clinical Data. J. Oral Rehabil. 2015, 42, 34–39. [Google Scholar] [CrossRef]
- Iwasaki, M.; Maeda, I.; Kokubo, Y.; Tanaka, Y.; Ueno, T.; Ohara, Y.; Motokawa, K.; Hayakawa, M.; Shirobe, M.; Edahiro, A.; et al. Standard Values and Concurrent Validity of a Newly Developed Occlusal Force-Measuring Device among Community-Dwelling Older Adults: The Otassha Study. Int. J. Environ. Res. Public Health 2022, 19, 5588. [Google Scholar] [CrossRef]
- Janani, K.; Palanivelu, A.; Sandhya, R. Diagnostic Accuracy of Dental Pulse Oximeter with Customized Sensor Holder, Thermal Test and Electric Pulp Test for the Evaluation of Pulp Vitality: An In Vivo Study. Braz. Dent. Sci. 2020, 23. [Google Scholar] [CrossRef]
- Janani, K.; Ajitha, P.; Sandhya, R.; Subbaiyan, H.; Jose, J. Efficiency of New Custom-Made Pulse Oximeter Sensor Holder in Assessment of Actual Pulp Status. J. Fam. Med. Prim. Care 2020, 9, 3333–3337. [Google Scholar] [CrossRef]
- Pozzobon, M.H.; de Sousa Vieira, R.; Alves, A.M.H.; Reyes-Carmona, J.; Teixeira, C.S.; de Souza, B.D.M.; Felippe, W.T. Assessment of Pulp Blood Flow in Primary and Permanent Teeth Using Pulse Oximetry. Dent. Traumatol. 2011, 27, 184–188. [Google Scholar] [CrossRef] [PubMed]
- Gopikrishna, V.; Tinagupta, K.; Kandaswamy, D. Evaluation of Efficacy of a New Custom-Made Pulse Oximeter Dental Probe in Comparison With the Electrical and Thermal Tests for Assessing Pulp Vitality. J. Endod. 2007, 33, 411–414. [Google Scholar] [CrossRef] [PubMed]
- Soltanzadeh, R.; Moussavi, Z. Design an Oral Photoplethysmogram for Deriving Peripheral Oxygen Saturation Level. J. Med. Devices Trans. ASME 2015, 9, 020922. [Google Scholar] [CrossRef]
- Aziman, C.; Hellén-Halme, K.; Shi, X.-Q. A Comparative Study on Image Quality of Two Digital Intraoral Sensors. Dentomaxillofacial Radiol. 2019, 48, 20190063. [Google Scholar] [CrossRef] [PubMed]
- Dündar, A.; Çiftçi, M.E.; İşman, Ö.; Aktan, A.M. In Vivo Performance of Near-Infrared Light Transillumination for Dentine Proximal Caries Detection in Permanent Teeth. Saudi Dent. J. 2020, 32, 187–193. [Google Scholar] [CrossRef] [PubMed]
- Taravati, S.; Balak, Z.; Rakhshan, V. Diagnostic Accuracy of Periapical Radiography in Detection and Measurement of the External Root Resorption in Primary Molars: A Single-Blind Prospective Clinical Study. Int. J. Dent. 2022, 2022, 1–10. [Google Scholar] [CrossRef]
- Elkhateeb, S.M.; Aloyouny, A.Y.; Omer, M.M.S.; Mansour, S.M. Analysis of Photostimulable Phosphor Image Plate Artifacts and Their Prevalence. World J. Clin. Cases 2022, 10, 437–447. [Google Scholar] [CrossRef]
- Moghadam, A.A.; Nemati, S.; Mirshafa, S.N.; Nikbin, A. Correlation between Digital Intra-Oral System with Pocket Sounding in Detection of Bone Defects. Ann. Dent. Spec. 2017, 5, 110–116. [Google Scholar]
- Natto, Z.S.; Olwi, A.; Abduljawad, F. A Comparison of the Horizontal and Vertical Bitewing Images in Detecting Approximal Caries and Interdental Bone Loss in Posterior Teeth: A Diagnostic Accuracy Randomized Cross over Clinical Trial. J. Dent. Sci. 2022, in press. [Google Scholar] [CrossRef]
- Amini, M.; Hisdal, J.; Gjøvaag, T.; Kapetanovic, N.; Strand, T.E.; Owe, J.O.; Hørthe, J.R.; Mirtaheri, P. Near-Infrared Spectra in Buccal Tissue as a Marker for Detection of Hypoxia. Aerosp. Med. Hum. Perform 2016, 87, 498–504. [Google Scholar] [CrossRef]
- Metzger, Z.; Colson, D.G.; Bown, P.; Weihard, T.; Baresel, I.; Nolting, T. Reflected Near-Infrared Light versus Bite-Wing Radiography for the Detection of Proximal Caries: A Multicenter Prospective Clinical Study Conducted in Private Practices. J. Dent. 2022, 116, 103861. [Google Scholar] [CrossRef] [PubMed]
- Tiba, M.H.; Awad, A.B.; Pennington, A.; Fung, C.M.; Napolitano, L.M.; Park, P.K.; Machado-Aranda, D.A.; Gunnerson, K.J.; Romfh, P.; Ward, K.R. Resonance Raman Spectroscopy Derived Tissue Hemoglobin Oxygen Saturation in Critically Ill and Injured Patients. Shock 2021, 56, 92–97. [Google Scholar] [CrossRef] [PubMed]
- Bhowmik, A.; Ghosh, B.; Pal, M.; Paul, R.R.; Chatterjee, J.; Chakraborty, S. Portable, Handheld, and Affordable Blood Perfusion Imager for Screening of Subsurface Cancer in Resource-Limited Settings. Proc. Natl. Acad. Sci. USA 2022, 119, e2026201119. [Google Scholar] [CrossRef] [PubMed]
- Amin Tily, M.; Al-Nashash, H.; Mir, H. An Intraoral Camera for Supporting Assistive Devices. IEEE Sens. J. 2020, 21, 8553–8563. [Google Scholar] [CrossRef]
- Atieh, M.A.; Alsabeeha, N.H.M.; Payne, A.G.T.; de Silva, R.K.; Schwass, D.S.; Duncan, W.J. The Prognostic Accuracy of Resonance Frequency Analysis in Predicting Failure Risk of Immediately Restored Implants. Clin. Oral Implant. Res. 2014, 25, 29–35. [Google Scholar] [CrossRef]
- Herrero-Climent, M.; Albertini, M.; Rios-Santos, J.-V.; Lázaro-Calvo, P.; Fernández-Palacín, A.; Bullon, P. Resonance Frequency Analysis-Reliability in Third Generation Instruments: Osstell Mentor. Med. Oral Patol. Oral Cir. Bucal 2012, 17, e801–e806. [Google Scholar] [CrossRef]
- Jaramillo, R.; Santos, R.; Lázaro, P.; Romero, M.; Rios-Santos, J.V.; Bullón, P.; Fernández-Palacín, A.; Herrero-Climent, M. Comparative Analysis of 2 Resonance Frequency Measurement Devices: Osstell Mentor and Osstell ISQ. Implant Dent. 2014, 23, 351–356. [Google Scholar] [CrossRef]
- Herrero-Climent, M.; Santos-Garcia, R.; Jaramillo-Santos, R.; Romero-Ruiz, M.M.; Fernandez-Palacin, A.; Lazaro-Calvo, P.; Bullon, P.; Rios-Santos, J.V. Assessment of Osstell Isq’s Reliability for Implant Stability Measurement: A Cross-Sectional Clinical Study. Med. Oral Patol. Oral Cir. Bucal 2013, 18, e877–e882. [Google Scholar] [CrossRef]
- Bertl, M.H.; Weinberger, T.; Schwarz, K.; Gruber, R.; Crismani, A.G. Resonance Frequency Analysis: A New Diagnostic Tool for Dental Ankylosis. Eur. J. Oral Sci. 2012, 120, 255–258. [Google Scholar] [CrossRef]
- Yamada, Y.; Yoshida, N.; Kobayashi, K.; Yamauchi, K. An Application of Magnet and Magnetic Sensor: Measurement System for Tooth Movement. IEEE Trans. Biomed. Eng. 1990, 37, 919–924. [Google Scholar] [CrossRef]
- Yoshida, N.; Koga, Y.; Saimoto, A.; Ishimatsu, T.; Yamada, Y.; Kobayashi, K. Development of a Magnetic Sensing Device for Tooth Displacement under Orthodontic Forces. IEEE Trans. Biomed. Eng. 2001, 48, 354–360. [Google Scholar] [CrossRef] [PubMed]
- Yoshida, N.; Koga, Y.; Kobayashi, K.; Yamada, Y.; Yoneda, T. A New Method for Qualitative and Quantitative Evaluation of Tooth Displacement under the Application of Orthodontic Forces Using Magnetic Sensors. Med. Eng. Phys. 2000, 22, 293–300. [Google Scholar] [CrossRef] [PubMed]
- Park, H.; Ghovanloo, M. An Arch-Shaped Intraoral Tongue Drive System with Built-in Tongue-Computer Interfacing SoC. Sensors 2014, 14, 21565–21587. [Google Scholar] [CrossRef] [PubMed]
- Woodford, S.C.; Robinson, D.L.; Edelmann, C.; Mehl, A.; Röhrle, O.; Vee Sin Lee, P.; Ackland, D.C. Low-Profile Electromagnetic Field Sensors in the Measurement and Modelling of Three-Dimensional Jaw Kinematics and Occlusal Loading. Ann. Biomed. Eng. 2021, 49, 1561–1571. [Google Scholar] [CrossRef]
- Kirshenblatt, S.; Chen, H.; Dieltjens, M.; Pliska, B.; Almeida, F.R. Accuracy of Thermosensitive Microsensors Intended to Monitor Patient Use of Removable Oral Appliances. J. Can. Dent. Assoc. 2018, 84, i2. [Google Scholar] [PubMed]
- de Almeida e Bueno, L.; Milnthorpe, W.; Bergmann, J.H.M. Determining the Performance of a Temperature Sensor Embedded into a Mouthguard. BDJ Open 2022, 8, 23. [Google Scholar] [CrossRef]
- Brierley, C.A.; Benson, P.E.; Sandler, J. How Accurate Are TheraMon® Microsensors at Measuring Intraoral Wear-Time? Recorded vs. Actual Wear Times in Five Volunteers. J. Orthod. 2017, 44, 241–248. [Google Scholar] [CrossRef]
- Gjerde, K.; Lehmann, S.; Naterstad, I.F.; Berge, M.E.; Johansson, A. Reliability of an Adherence Monitoring Sensor Embedded in an Oral Appliance Used for Treatment of Obstructive Sleep Apnoea. J. Oral. Rehabil. 2018, 45, 110–115. [Google Scholar] [CrossRef]
- Morán-Navarro, R.; Courel-Ibáñez, J.; Martínez-Cava, A.; Conesa-Ros, E.; Sánchez-Pay, A.; Mora-Rodriguez, R.; Pallarés, J.G. Validity of Skin, Oral and Tympanic Temperatures During Exercise in the Heat: Effects of Wind and Sweat. Ann. Biomed. Eng. 2019, 47, 317–331. [Google Scholar] [CrossRef]
- Hutton, S.; Probst, E.; Kenyon, C.; Morse, D.; Friedman, B.; Arnold, K.; Helsley, L. Accuracy of Different Temperature Devices in the Postpartum Population. JOGNN J. Obstet. Gynecol. Neonatal Nurs. 2009, 38, 42–49. [Google Scholar] [CrossRef]
- Park, S.; Kim, J.-H.; Lee, M.-K.; Ihm, J.-J.; Ahn, J.-S.; Park, J.-K.; Seo, D.-G. In Vivo Real-time Temperature Measurement on the Surface of Intact and Gold-restored Teeth during Consumption of Hot and Cold Drinks. Eur. J. Oral Sci. 2022, 130, e12870. [Google Scholar] [CrossRef] [PubMed]
- Smith, L.S. Temperature Measurement in Critical Care Adults: A Comparison of Thermometry and Measurement Routes. Biol. Res. Nurs. 2004, 6, 117–125. [Google Scholar] [CrossRef]
- Gabler, L.F.; Huddleston, S.H.; Dau, N.Z.; Lessley, D.J.; Arbogast, K.B.; Thompson, X.; Resch, J.E.; Crandall, J.R. On-Field Performance of an Instrumented Mouthguard for Detecting Head Impacts in American Football. Ann. Biomed. Eng. 2020, 48, 2599–2612. [Google Scholar] [CrossRef] [PubMed]
- Kieffer, E.E.; Begonia, M.T.; Tyson, A.M.; Rowson, S. A Two-Phased Approach to Quantifying Head Impact Sensor Accuracy: In-Laboratory and On-Field Assessments. Ann. Biomed. Eng. 2020, 48, 2613–2625. [Google Scholar] [CrossRef] [PubMed]
- Wu, L.C.; Nangia, V.; Bui, K.; Hammoor, B.; Kurt, M.; Hernandez, F.; Kuo, C.; Camarillo, D.B. In Vivo Evaluation of Wearable Head Impact Sensors. Ann. Biomed. Eng. 2016, 44, 1234–1245. [Google Scholar] [CrossRef] [PubMed]
- Rich, A.M.; Filben, T.M.; Miller, L.E.; Tomblin, B.T.; van Gorkom, A.R.; Hurst, M.A.; Barnard, R.T.; Kohn, D.S.; Urban, J.E.; Stitzel, J.D. Development, Validation and Pilot Field Deployment of a Custom Mouthpiece for Head Impact Measurement. Ann. Biomed. Eng. 2019, 47, 2109–2121. [Google Scholar] [CrossRef]
- Kuo, C.; Wu, L.; Loza, J.; Senif, D.; Anderson, S.C.; Camarillo, D.B. Comparison of Video-Based and Sensor-Based Head Impact Exposure. PLoS ONE 2018, 13, 1–20. [Google Scholar] [CrossRef]
- King, D.; Hume, P.A.; Brughelli, M.; Gissane, C. Instrumented Mouthguard Acceleration Analyses for Head Impacts in Amateur Rugby Union Players over a Season of Matches. Am. J. Sport. Med. 2015, 43, 614–624. [Google Scholar] [CrossRef]
- Goodin, P.; Gardner, A.J.; Dokani, N.; Nizette, B.; Ahmadizadeh, S.; Edwards, S.; Iverson, G.L. Development of a Machine-Learning-Based Classifier for the Identification of Head and Body Impacts in Elite Level Australian Rules Football Players. Front. Sport. Act. Living 2021, 3, 725245. [Google Scholar] [CrossRef]
- Fu, L.; Ling, C.; Jin, Z.; Luo, J.; Palma-Chavez, J.; Wu, Z.; Zhou, J.J.; Zhou, J.J.; Donovan, B.; Qi, B.; et al. Photoacoustic Imaging of Posterior Periodontal Pocket Using a Commercial Hockey-Stick Transducer. J. Biomed. Opt. 2022, 27, 056005. [Google Scholar] [CrossRef]
- Heppt, W.J.; Issing, W.J. Assessment of Tumorous Mandibular Involvement by Transcutaneous Ultrasound and Flexible Endosonography. J. Cranio-Maxillofac. Surg. 1993, 21, 107–112. [Google Scholar] [CrossRef] [PubMed]
- Salmon, B.; le Denmat, D. Intraoral Ultrasonography: Development of a Specific High-Frequency Probe and Clinical Pilot Study. Clin. Oral Investig. 2012, 16, 643–649. [Google Scholar] [CrossRef] [PubMed]
- Bertram, S.; Emshoff, R. Sonography of Periimplant Buccal Bone Defects in Periodontitis Patients: A Pilot Study. Oral Surg. Oral Med. Oral Pathol. Oral Radiol. Endodontol. 2008, 105, 99–103. [Google Scholar] [CrossRef]
- Yesuratnam, A.; Wiesenfeld, D.; Tsui, A.; Iseli, T.A.; Hoorn, S.V.; Ang, M.T.; Guiney, A.; Phal, P.M. Preoperative Evaluation of Oral Tongue Squamous Cell Carcinoma with Intraoral Ultrasound and Magnetic Resonance Imaging—Comparison with Histopathological Tumour Thickness and Accuracy in Guiding Patient Management. Int. J. Oral. Maxillofac. Surg. 2014, 43, 787–794. [Google Scholar] [CrossRef] [PubMed]
- Costantino, T.G.; Satz, W.A.; Dehnkamp, W.; Goett, H. Randomized Trial Comparing Intraoral Ultrasound to Landmark-Based Needle Aspiration in Patients with Suspected Peritonsillar Abscess. Clin. Otolaryngol. 2013, 38, 244. [Google Scholar] [CrossRef]
- Caltenco, H.A.; Lontis, E.R.; Boudreau, S.A.; Bentsen, B.; Struijk, J.; Andreasen Struijk, L.N.S. Tip of the Tongue Selectivity and Motor Learning in the Palatal Area. IEEE Trans. Biomed. Eng. 2012, 59, 174–182. [Google Scholar] [CrossRef]
- Caltenco, H.A.; Lontis, E.R.; Bentsen, B.; Andreasen Struijk, L.N.S. The Impact of Function Location on Typing and Pointing Tasks With an Intraoral Tongue-Computer Interface. Int. J. Hum. Comput. Interact. 2014, 30, 267–277. [Google Scholar] [CrossRef]
- Mohammadi, M.; Knoche, H.; Gaihede, M.; Bentsen, B.; Andreasen Struijk, L.N.S. A High-Resolution Tongue-Based Joystick to Enable Robot Control for Individuals with Severe Disabilities. IEEE Int. Conf. Rehabil. Robot. 2019, 2019, 1043–1048. [Google Scholar] [CrossRef]
- Andreasen Struijk, L.N.S.; Bentsen, B.; Gaihede, M.; Lontis, E.R. Error-Free Text Typing Performance of an Inductive Intra-Oral Tongue Computer Interface for Severely Disabled Individuals. IEEE Trans. Neural Syst. Rehabil. Eng. 2017, 25, 2094–2104. [Google Scholar] [CrossRef]
- Luo, X.; Gutierrez Pulido, H.V.; Rutkove, S.; Sanchez, B. A Bioimpedance-Based Device to Assess the Volume Conduction Properties of the Tongue in Neurological Disorders Affecting Bulbar Function. IEEE Open J. Eng. Med. Biol. 2021, 2, 278–285. [Google Scholar] [CrossRef]
- Menon, D.; Mansfield, P.; Cordice, D.; Studer, C.; O’Leary, M.; Sheean, G.; Bril, V. Pilot Study of a Novel Transmembranous Electromyography Device for Assessment of Oral Cavity and Oropharyngeal Muscles. Muscle Nerve 2022, 65, 303–310. [Google Scholar] [CrossRef]
- Jiang, B.; Kim, J.; Park, H. Palatal Electrotactile Display Outperforms Visual Display in Tongue Motor Learning. IEEE Trans. Neural Syst. Rehabil. Eng. 2022, 30, 529–539. [Google Scholar] [CrossRef] [PubMed]
- Castillo, Y.; Blanco-Almazan, D.; Whitney, J.; Mersky, B.; Jane, R. Characterization of a Tooth Microphone Coupled to an Oral Appliance Device: A New System for Monitoring OSA Patients. In Proceedings of the 2017 39th Annual International Conference of the IEEE Engineering in Medicine and Biology Society (EMBC), Jeju Island, Korea, 11–15 July 2017; Volume 2017, pp. 1543–1546. [Google Scholar]
- de Almeida e Bueno, L.; Kwong, M.T.; Milnthorpe, W.R.F.; Cheng, R.; Bergmann, J.H.M. Applying Ubiquitous Sensing to Estimate Perceived Exertion Based on Cardiorespiratory Features. Sport. Eng. 2021, 24, 9. [Google Scholar] [CrossRef]
- Watanabe, T.; Kobayashi, K.; Suzuki, T.; Oizumi, M.; Clark, G.T. A Preliminary Report on Continuous Recording of Salivary PH Using Telemetry in an Edentulous Patient. Int. J. Prosthodont. 1999, 12, 313–317. [Google Scholar] [PubMed]
- Makary, C.; Rebaudi, A.; Sammartino, G.; Naaman, N. Implant Primary Stability Determined by Resonance Frequency Analysis: Correlation With Insertion Torque, Histologic Bone Volume, and Torsional Stability at 6 Weeks. Implant Dent. 2012, 21, 474–480. [Google Scholar] [CrossRef]
- Patil, S.R.; Maragathavalli, G.; Ramesh, D.N.S.V.; Naidu, G.S.; Alam, M.K.; AlZoubi, I.A. The Reliability of a New Device for Measuring the Maximum Bite Force. Biomed. Res. Int. 2022, 2022, 1–6. [Google Scholar] [CrossRef]
- Kelsey, C.C.; Reid, F.D.; Coplowitz, J.A. A Method of Measuring Pressures against Tissues Supporting Functioning Complete Dentures. J. Prosthet. Dent. 1976, 35, 376–383. [Google Scholar] [CrossRef]
- Mokhtar, E.A.; Rattan, V.; Rai, S.; Jolly, S.S.; Lal, V. Analysis of Maximum Bite Force and Chewing Efficiency in Unilateral Temporomandibular Joint Ankylosis Cases Treated with Buccal Fat Pad Interpositional Arthroplasty. Br. J. Oral Maxillofac. Surg. 2022, 60, 313–319. [Google Scholar] [CrossRef]
- Castroflorio, T.; Icardi, K.; Becchino, B.; Merlo, E.; Debernardi, C.; Bracco, P.; Farina, D. Reproducibility of Surface EMG Variables in Isometric Sub-Maximal Contractions of Jaw Elevator Muscles. J. Electromyogr. Kinesiol. 2006, 16, 498–505. [Google Scholar] [CrossRef]
- Mountain, G.; Wood, D.; Toumba, J. Bite Force Measurement in Children with Primary Dentition. Int. J. Paediatr. Dent. 2011, 21, 112–118. [Google Scholar] [CrossRef]
- Ogata, K.; Nishigawa, G.; Aoki, T.; Maeda, Y.; Okuno, Y. Lateral Forces Exerted on the Abutment Tooth of Complete Mandibular Overdentures. J. Oral Rehabil. 1988, 15, 429–438. [Google Scholar] [CrossRef] [PubMed]
- Luffingham, J.K. Pressure Exerted on Teeth by the Lips and Cheeks. D. Pract. 1968, 19, 61–64. [Google Scholar] [CrossRef]
- Hadley, A.J.; Krival, K.R.; Ridgel, A.L.; Hahn, E.C.; Tyler, D.J. Neural Network Pattern Recognition of Lingual–Palatal Pressure for Automated Detection of Swallow. Dysphagia 2015, 30, 176–187. [Google Scholar] [CrossRef] [PubMed]
- Konaka, K.; Kondo, J.; Hirota, N.; Tamine, K.; Hori, K.; Ono, T.; Maeda, Y.; Sakoda, S.; Naritomi, H. Relationship between Tongue Pressure and Dysphagia in Stroke Patients. Eur. Neurol. 2010, 64, 101–107. [Google Scholar] [CrossRef] [PubMed]
- Martinez, G.; Ventura, L.; Cugusi, L.; Cadeddu, F.; Limoncino, M.; Deriu, F.; Monticone, M.; Manca, A. Healthy Women and Men Do Not Show Differences in Tongue Strength and Regular Effort Saliva Swallows as Assessed by Piezo-Resistive Sensors: Results from a Reproducibility Study. Dysphagia 2022, 37, 1217–1225. [Google Scholar] [CrossRef]
- Waltzman, D.; Sarmiento, K.; Devine, O.; Zhang, X.; DePadilla, L.; Kresnow, M.; Borradaile, K.; Hurwitz, A.; Jones, D.; Goyal, R.; et al. Head Impact Exposures Among Youth Tackle and Flag American Football Athletes. Sport. Health A Multidiscip. Approach 2021, 13, 454–462. [Google Scholar] [CrossRef]
- Kitagawa, H.; Scheetz, J.P.; Farman, A.G. Comparison of Complementary Metal Oxide Semiconductor and Charge-Coupled Device Intraoral X-Ray Detectors Using Subjective Image Quality. Dentomaxillofac. Radiol. 2003, 32, 408–411. [Google Scholar] [CrossRef]
- van Assche, N.; Jacobs, R.; Coucke, W.; van Steenberghe, D.; Quirynen, M. Radiographic Detection of Artificial Intra-Bony Defects in the Edentulous Area. Clin. Oral. Implant. Res. 2009, 20, 273–279. [Google Scholar] [CrossRef]
- Vandenberghe, B.; Jacobs, R.; Yang, J. Diagnostic Validity (or Acuity) of 2D CCD versus 3D CBCT-Images for Assessing Periodontal Breakdown. Oral Surg. Oral Med. Oral Pathol. Oral Radiol. Endodontol. 2007, 104, 395–401. [Google Scholar] [CrossRef]
- Aps, J.K.M.; Lim, L.Z.; Tong, H.J.; Kalia, B.; Chou, A.M. Diagnostic Efficacy of and Indications for Intraoral Radiographs in Pediatric Dentistry: A Systematic Review. Eur. Arch. Paediatr. Dent. 2020, 21, 429–462. [Google Scholar] [CrossRef]
- Honda, E.; Prince, J.L.; Fontanella, V.R.C. State-of-the-Art Digital Imaging in Dentistry: Advanced Research of MRI, CT, CBCT, and Digital Intraoral Imaging. Biomed. Res. Int. 2018, 2018, 1. [Google Scholar] [CrossRef] [PubMed]
- McHugh, M.; McCaffery, F.; Casey, V. Barriers to Adopting Agile Practices When Developing Medical Device Software. In International Conference on Software Process Improvement and Capability Determination, Palma de Mallorca, 29–31 May 2012; Springer: Berlin/Heidelberg, Germany, 2012; pp. 141–147. ISBN 9783642304385. [Google Scholar]
- Khan, A.A.; Akram, M.U.; Salam, A.A.; Butt, W.H. An Enhanced Agile-V Model for System Engineering in Complex Medical Device Development. In Proceedings of the 2022 2nd International Conference on Digital Futures and Transformative Technologies (ICoDT2), Islamabad, Pakistan, 24 May 2022; pp. 1–6. [Google Scholar]


Disclaimer/Publisher’s Note: The statements, opinions and data contained in all publications are solely those of the individual author(s) and contributor(s) and not of MDPI and/or the editor(s). MDPI and/or the editor(s) disclaim responsibility for any injury to people or property resulting from any ideas, methods, instructions or products referred to in the content. |
© 2023 by the authors. Licensee MDPI, Basel, Switzerland. This article is an open access article distributed under the terms and conditions of the Creative Commons Attribution (CC BY) license (https://creativecommons.org/licenses/by/4.0/).