
Unsupervised Mixture Models on the Edge for Smart Energy Consumption Segmentation with Feature Saliency


Abstract
:1. Introduction
2. Prior Works
3. The Unsupervised BAGGMM-Based Feature Selection Model
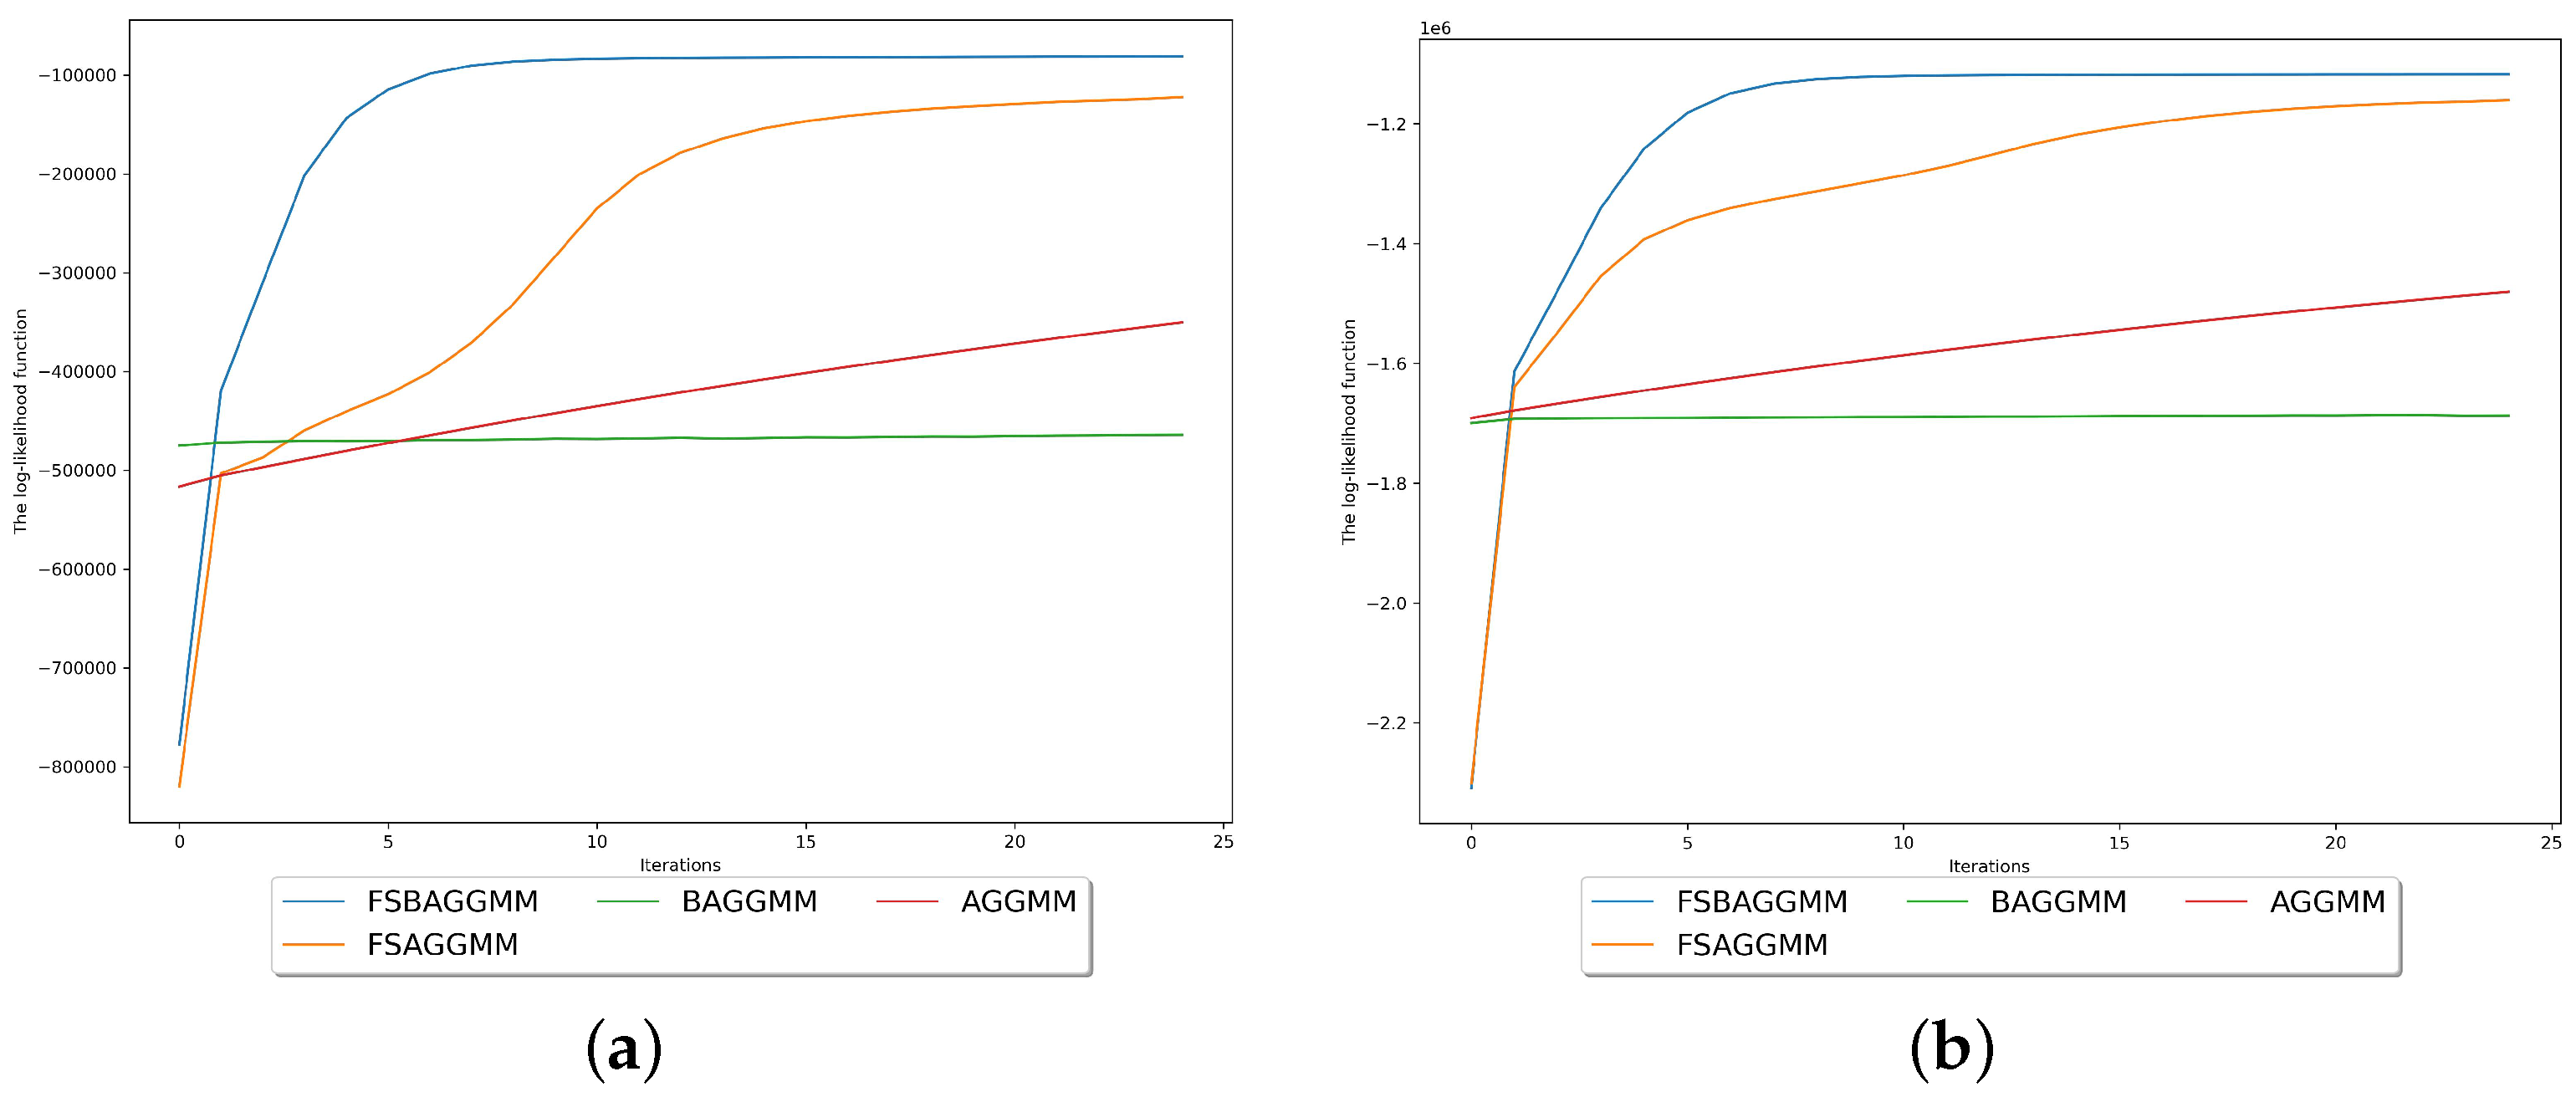
4. Model Parameter Estimation and Selection
4.1. Parameter Estimation Using the EM Algorithm
4.2. Model Selection
| Algorithm 1: Unsupervised FSBAGGMM |
|
4.3. Implementation with HPC
- Enhanced Speed and Efficiency: By employing HPC at the edge, data from smart meters can be processed locally, resulting in quicker analytics and response times. This is especially crucial for utility programs that require timely information, such as demand response and energy efficiency initiatives.
- Scalability: As the deployment of smart meters expands, the amount of data to be processed will proportionally increase. HPC can readily handle this surge, ensuring that the system can scale without compromising on performance.
- Real-Time Analytics for Utility Programs: HPC, coupled with edge cloud computing, can power real-time analytics. For instance, utility providers can swiftly analyze consumption patterns and roll out demand response strategies almost instantaneously. This not only enhances grid reliability but also aids in optimizing energy consumption and costs for consumers.
5. Experimental Results
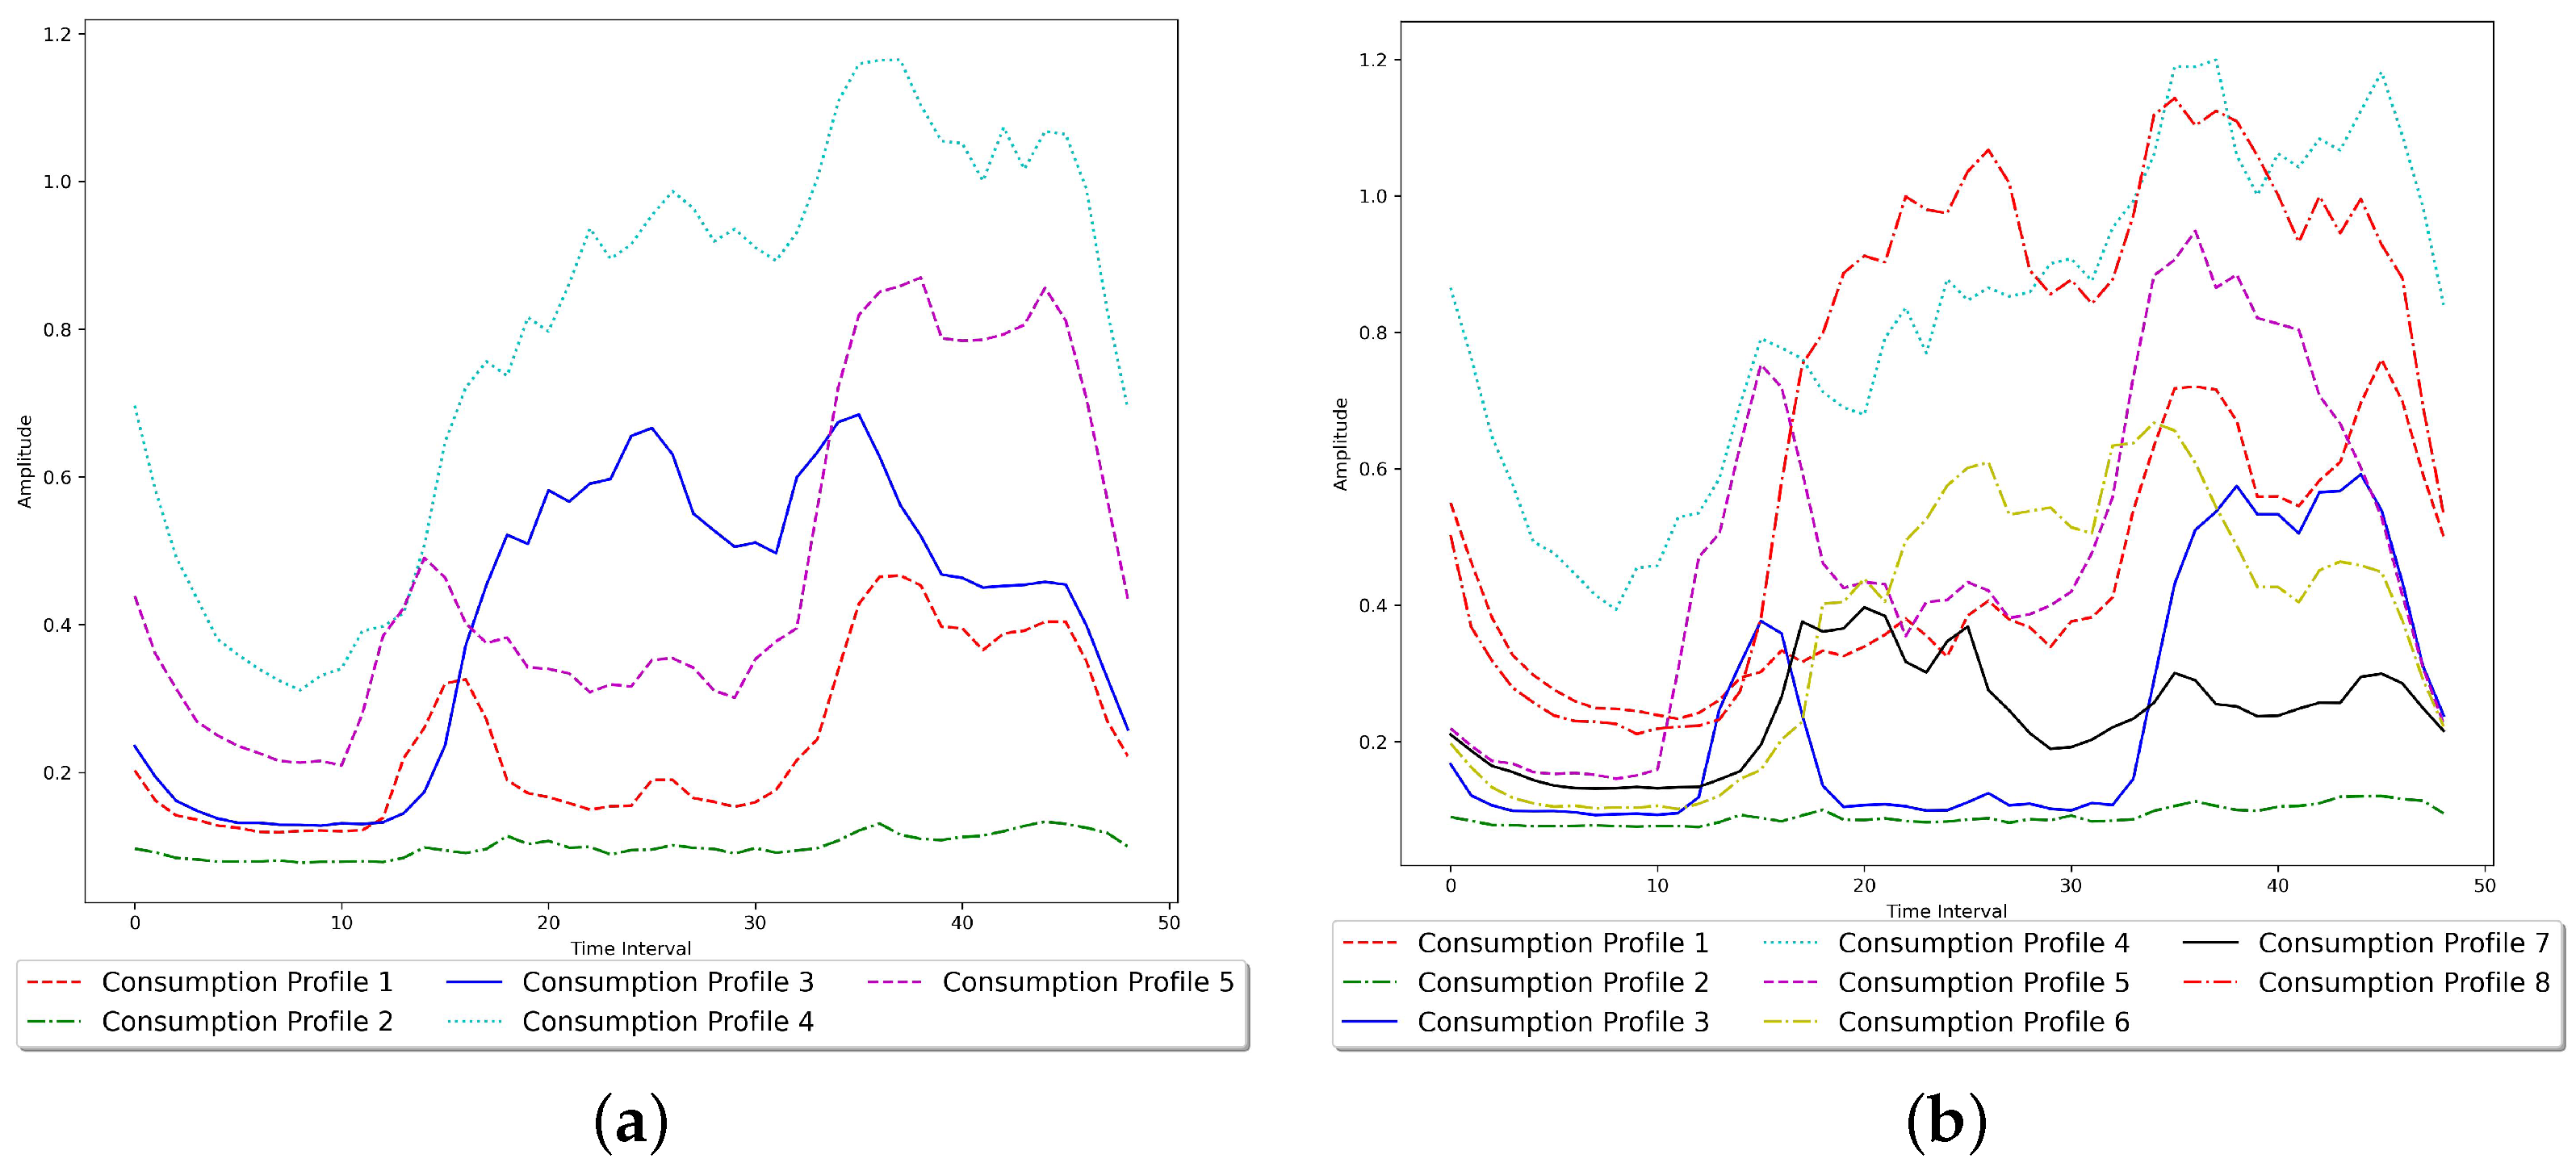
5.1. Synthetic Data
- For each energy consumer in the real-life dataset, only the first 49 smart meter observations are considered.
- The Gaussian mixture model is used to cluster the data into a specific number of clusters. The mean of each cluster is considered a consumption profile.
- Each consumption profile inferred from the previous step is summed with instances generated by Gaussian white noise using five different sets of parameters to form the observations of the synthetic dataset.
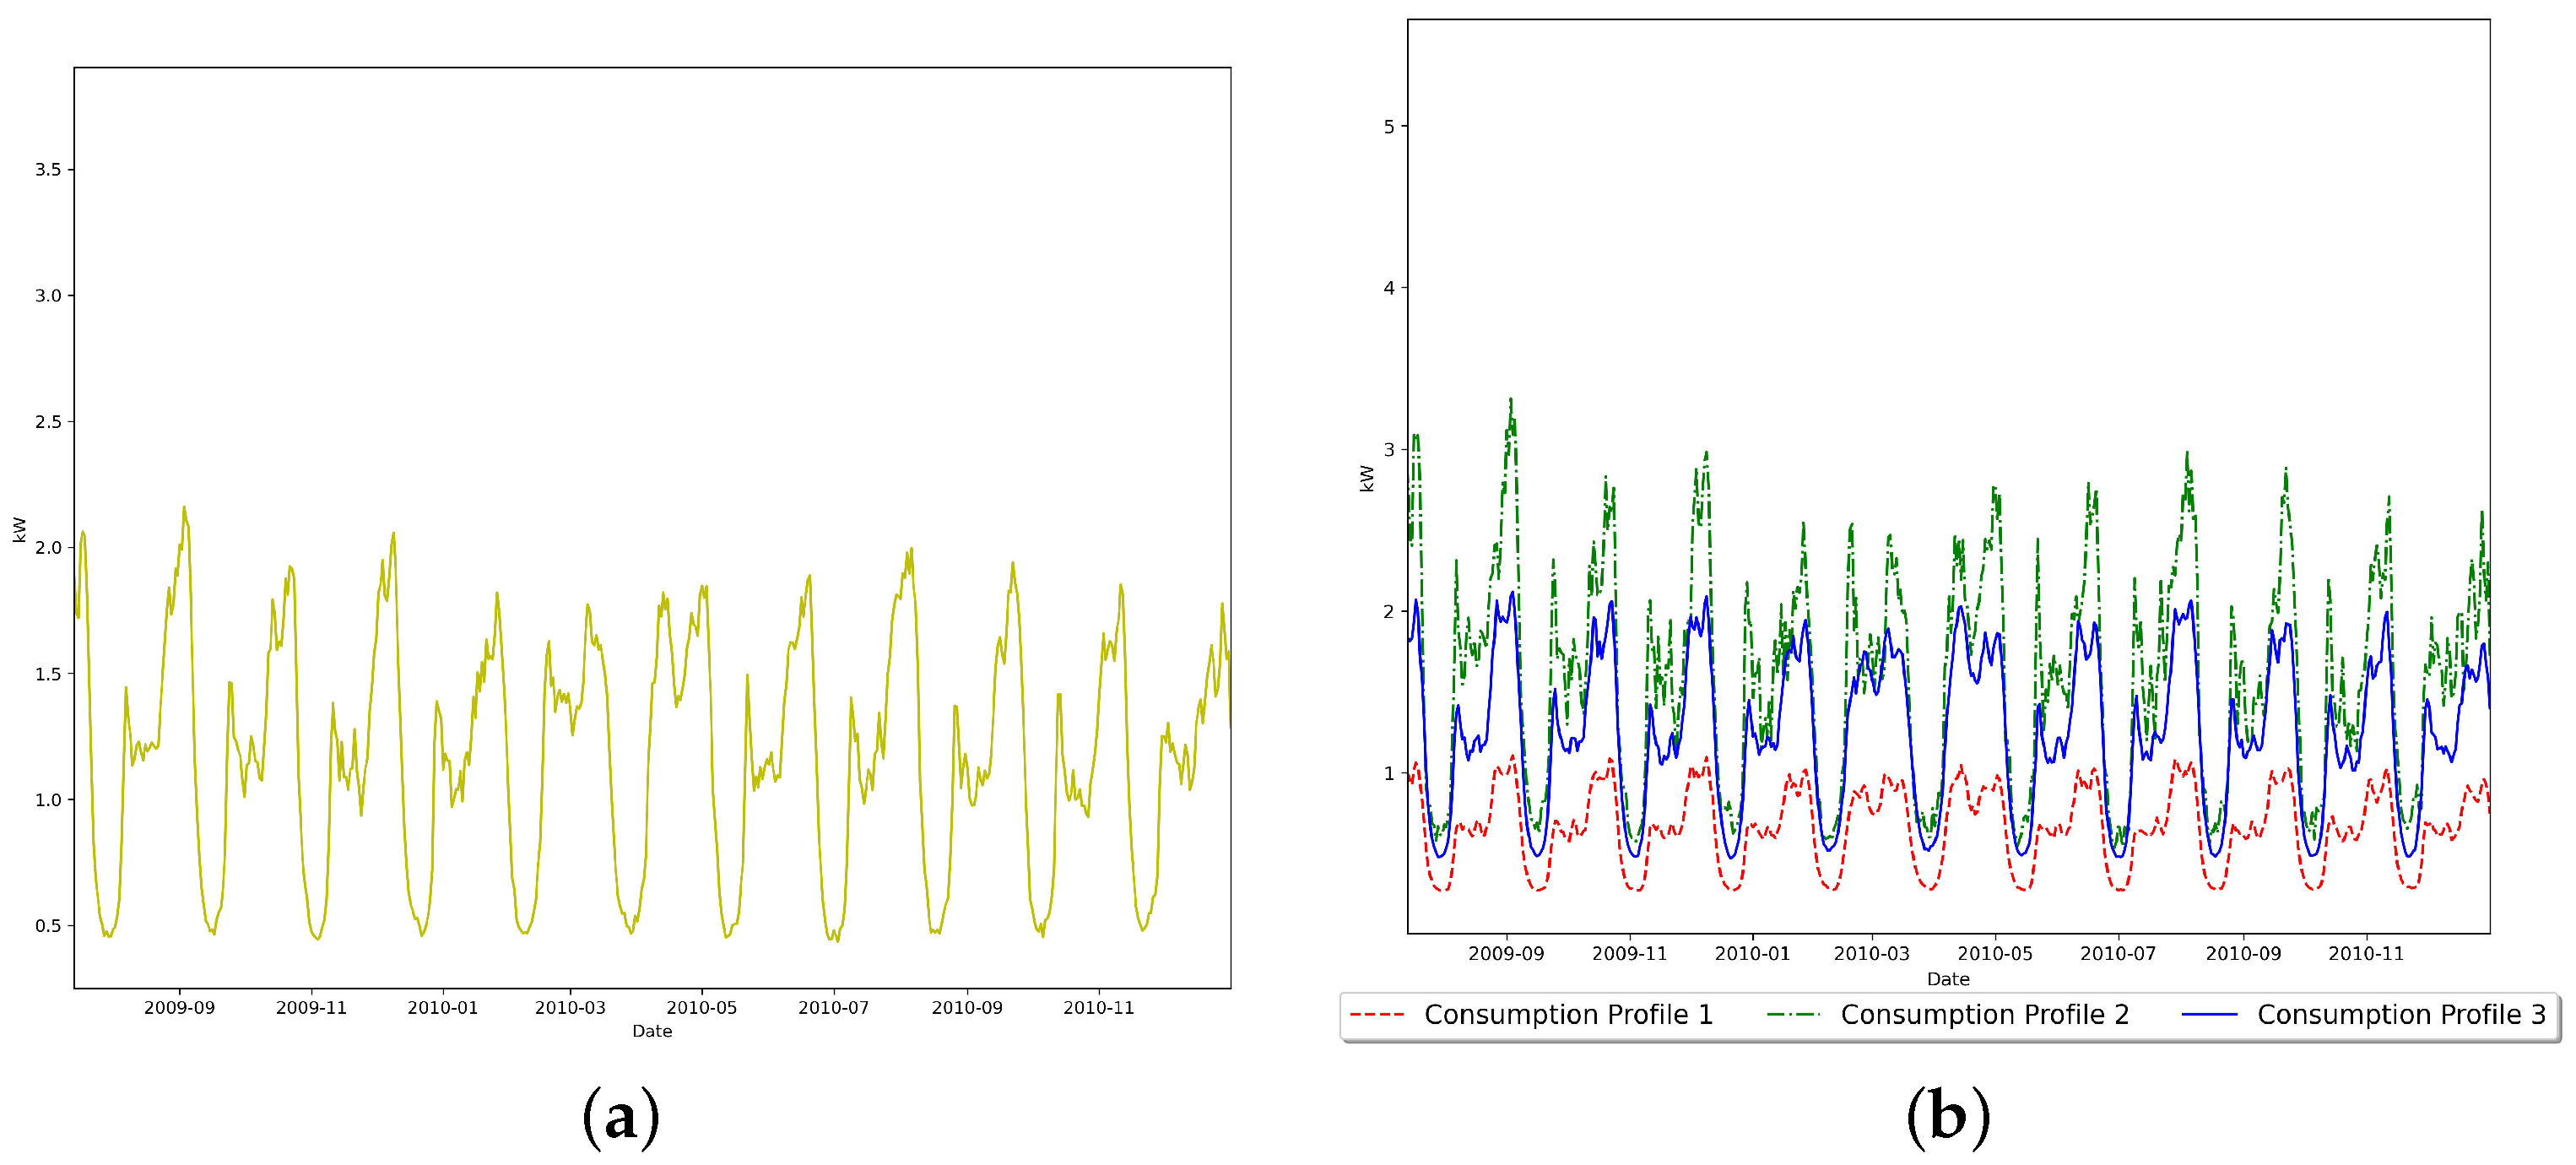
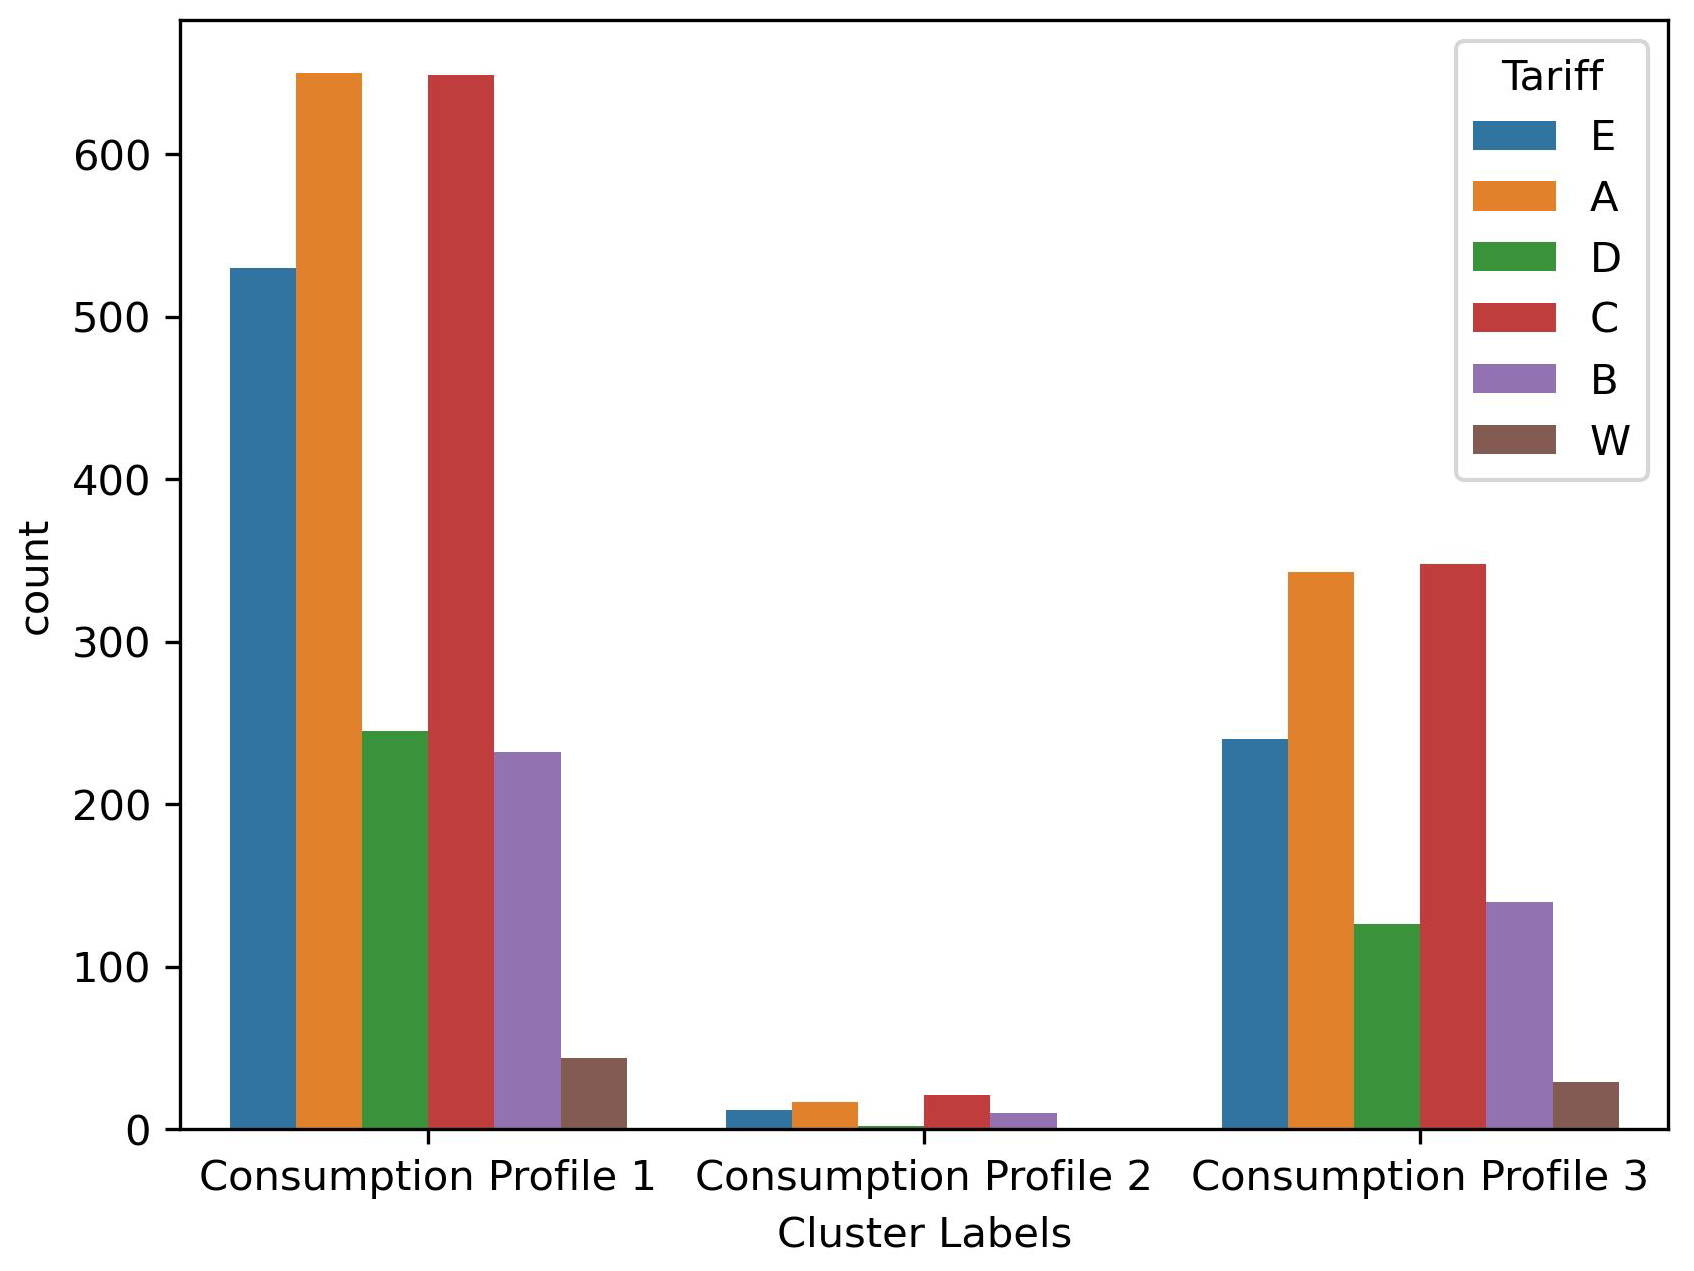
5.2. Real-Life Smart Meter Data
5.2.1. The Commission for Energy Regulation Smart Meter Data
5.2.2. The UK Power Networks Smart Meter Data
- denotes the relative average power for time period (t) over the entire year; it is defined as follows:
- the denotes the mean relative standard deviation of the average power used over the entire year; it is defined as follows:
- The seasonal score is defined as follows:
- The weekend vs. weekday difference score (WD-WE diff. score) is calculated as follows:
6. Discussion
7. Conclusions
Author Contributions
Funding
Data Availability Statement
Conflicts of Interest
Appendix A. Important Partial Derivatives
References
- Lloret, J.; Tomas, J.; Canovas, A.; Parra, L. An integrated IoT architecture for smart metering. IEEE Commun. Mag. 2016, 54, 50–57. [Google Scholar] [CrossRef]
- Kwac, J.; Flora, J.; Rajagopal, R. Household energy consumption segmentation using hourly data. IEEE Trans. Smart Grid 2014, 5, 420–430. [Google Scholar] [CrossRef]
- Haben, S.; Ward, J.; Greetham, D.; Singleton, C.; Grindrod, P.A. New error measure for forecasts of household-level, high resolution electrical energy consumption. Int. J. Forecast. 2014, 30, 246–256. [Google Scholar] [CrossRef]
- CER. CER Smart Metering Project - Electricity Customer Behaviour Trial, 2009–2010 [dataset]. 2012. Available online: https://www.ucd.ie/issda/data/commissionforenergyregulationcer/ (accessed on 5 April 2023).
- Cao, H.; Beckel, C.; Staake, T. Are domestic load profiles stable over time? An attempt to identify target households for demand side management campaigns. In Proceedings of the IECON 2013-39th Annual Conference of The IEEE Industrial Electronics Society, Vienna, Austria, 10–13 November 2013; pp. 4733–4738. [Google Scholar]
- UK Power Networks. SmartMeter Energy Consumption Data in London Households, 2011–2014 [dataset]. 2013. Available online: https://data.london.gov.uk/dataset/smartmeter-energy-use-data-in-london-households (accessed on 28 September 2023).
- Massachusetts (Amherst), (UMass Smart* Dataset—Microgrid Dataset, 2013 Release [dataset]. 2013. Available online: https://traces.cs.umass.edu/index.php/Smart/Smart (accessed on 28 September 2023).
- Alahakoon, D.; Yu, X. Smart electricity meter data intelligence for future energy systems: A survey. IEEE Trans. Ind. Inform. 2015, 12, 425–436. [Google Scholar] [CrossRef]
- Al Khafaf, N.; Jalili, M.; Sokolowski, P. Demand Response Planning Tool using Markov Decision Process. In Proceedings of the 2018 IEEE 16th International Conference on Industrial Informatics (INDIN), Porto, Portugal, 18–20 July 2018; pp. 484–489. [Google Scholar]
- Shahzadeh, A.; Khosravi, A.; Nahavandi, S. Improving load forecast accuracy by clustering consumers using smart meter data. In Proceedings of the 2015 International Joint Conference On Neural Networks (IJCNN), Killarney, Ireland, 12–17 July 2015; pp. 1–7. [Google Scholar]
- Chicco, G.; Napoli, R.; Postolache, P.; Scutariu, M.; Toader, C. Customer characterization options for improving the tariff offer. IEEE Trans. Power Syst. 2003, 18, 381–387. [Google Scholar] [CrossRef]
- Stephenson, P.; Lungu, I.; Paun, M.; Silvas, I.; Tupu, G. Tariff development for consumer groups in internal European electricity markets. In Proceedings of the 16th International Conference and Exhibition on Electricity Distribution, Amsterdam, The Netherlands, 18–21 June 2001; Part 1: Contributions. CIRED. (IEE Conf. Publ No. 482). Volume 5, p. 5. [Google Scholar]
- Chen, C.; Kang, M.; Hwang, J.; Huang, C. Synthesis of power system load profiles by class load study. Int. J. Electr. Power Energy Syst. 2000, 22, 325–330. [Google Scholar] [CrossRef]
- Meignen, S.; Meignen, H. On the modeling of small sample distributions with generalized Gaussian density in a maximum likelihood framework. IEEE Trans. Image Process. 2006, 15, 1647–1652. [Google Scholar] [CrossRef] [PubMed]
- Wang, D.; Xie, W.; Pei, J.; Lu, Z. Moving area detection based on estimation of static background. J. Inform. Comput. Sci. 2005, 2, 129–134. [Google Scholar]
- Palacios, M.; Steel, M. Non-gaussian bayesian geostatistical modeling. J. Am. Stat. Assoc. 2006, 101, 604–618. [Google Scholar] [CrossRef]
- Hedelin, P.; Skoglund, J. Vector quantization based on Gaussian mixture models. IEEE Trans. Speech Audio Process. 2000, 8, 385–401. [Google Scholar] [CrossRef]
- Nguyen, T.; Wu, Q.; Zhang, H. Bounded generalized Gaussian mixture model. Pattern Recognit. 2014, 47, 3132–3142. [Google Scholar] [CrossRef]
- Azam, M.; Bouguila, N. Bounded generalized gaussian mixture model with ica. Neural Process. Lett. 2019, 49, 1299–1320. [Google Scholar] [CrossRef]
- Lindblom, J.; Samuelsson, J. Bounded support Gaussian mixture modeling of speech spectra. IEEE Trans. Speech Audio Process. 2003, 11, 88–99. [Google Scholar] [CrossRef]
- Azam, M.; Bouguila, N. Multivariate bounded support asymmetric generalized Gaussian mixture model with model selection using minimum message length. Expert Syst. Appl. 2022, 204, 117516. [Google Scholar] [CrossRef]
- Raudys, S.; Jain, A.; Small, O. Sample size effects in statistical pattern recognition: Recommendations for practitioners. IEEE Trans. Pattern Anal. Mach. Intell. 1991, 13, 252–264. [Google Scholar] [CrossRef]
- Law, M.; Figueiredo, M.; Jain, A. Simultaneous feature selection and clustering using mixture models. IEEE Trans. Pattern Anal. Mach. Intell. 2004, 26, 1154–1166. [Google Scholar] [CrossRef] [PubMed]
- Pudil, P.; Novovičová, J.; Kittler, J. Floating search methods in feature selection. Pattern Recognit. Lett. 1994, 15, 1119–1125. [Google Scholar] [CrossRef]
- Kohavi, R.; John, G. Wrappers for feature subset selection. Artif. Intell. 1997, 97, 273–324. [Google Scholar] [CrossRef]
- Caruana, R.; Freitag, D. Greedy attribute selection. In Machine Learning Proceedings 1994; Morgan Kaufmann: Cambridge, MA, USA, 1994; pp. 28–36. [Google Scholar]
- Concordia University. High-Performance Computing Facility: Speed [Computing Resource]. 2018. Available online: https://www.concordia.ca/ginacody/aits/speed.html (accessed on 28 September 2023).
- Rafati, A.; Shaker, H.; Ghahghahzadeh, S. Fault Detection and Efficiency Assessment for HVAC Systems Using Non-Intrusive Load Monitoring: A Review. Energies 2022, 15, 341. [Google Scholar] [CrossRef]
- Rodríguez, M.; Cortés, A.; González Alonso, I.; Zalama Casanova, E. Using the Big Data generated by the Smart Home to improve energy efficiency management. Energy Effic. 2016, 9, 249–260. [Google Scholar] [CrossRef]
- Liu, X.; Nielsen, P.A. hybrid ICT-solution for smart meter data analytics. Energy 2016, 115, 1710–1722. [Google Scholar] [CrossRef]
- Al Khafaf, N.; Jalili, M.; Sokolowski, P. A novel clustering index to find optimal clusters size with application to segmentation of energy consumers. IEEE Trans. Ind. Inform. 2020, 17, 346–355. [Google Scholar] [CrossRef]
- Haben, S.; Singleton, C.; Grindrod, P. Analysis and clustering of residential customers energy behavioral demand using smart meter data. IEEE Trans. Smart Grid 2015, 7, 136–144. [Google Scholar] [CrossRef]
- Albert, A.; Rajagopal, R. Smart meter driven segmentation: What your consumption says about you. IEEE Trans. Power Syst. 2013, 28, 4019–4030. [Google Scholar] [CrossRef]
- Erdem, T.; Eken, S. Layer-Wise Relevance Propagation for Smart-Grid Stability Prediction. In Mediterranean Conference on Pattern Recognition and Artificial Intelligence; Springer: Cham, Switzerland, 2021; pp. 315–328. [Google Scholar]
- Breviglieri, P.; Erdem, T.; Eken, S. Predicting smart grid stability with optimized deep models. SN Comput. Sci. 2021, 2, 73. [Google Scholar] [CrossRef]
- Komatsu, H.; Kimura, O. Customer segmentation based on smart meter data analytics: Behavioral similarities with manual categorization for building types. Energy Build. 2023, 283, 112831. [Google Scholar] [CrossRef]
- Chicco, G.; Napoli, R.; Piglione, F. Comparisons among clustering techniques for electricity customer classification. IEEE Trans. Power Syst. 2006, 21, 933–940. [Google Scholar] [CrossRef]
- Chicco, G. Overview and performance assessment of the clustering methods for electrical load pattern grouping. Energy 2012, 42, 68–80. [Google Scholar] [CrossRef]
- Faria, P.; Spinola, J.; Vale, Z. Aggregation and remuneration of electricity consumers and producers for the definition of demand-response programs. IEEE Trans. Ind. Inform. 2016, 12, 952–961. [Google Scholar] [CrossRef]
- Li, D.; Chiu, W.; Sun, H.; Poor, H. Multiobjective optimization for demand side management program in smart grid. IEEE Trans. Ind. Inform. 2017, 14, 1482–1490. [Google Scholar] [CrossRef]
- Al Khafaf, N.; Jalili, M.; Sokolowski, P. Application of Deep Learning Long Short-Term Memory in Energy Demand Forecasting; Springer: Cham, Switzerland, 2019; pp. 31–42. [Google Scholar]
- Li, R.; Li, F.; Smith, N. Multi-resolution load profile clustering for smart metering data. IEEE Trans. Power Syst. 2016, 31, 4473–4482. [Google Scholar] [CrossRef]
- Verdú, S.; Garcia, M.; Senabre, C.; Marin, A.; Franco, F.C. Filtering, and identification of electrical customer load patterns through the use of self-organizing maps. IEEE Trans. Power Syst. 2006, 21, 1672–1682. [Google Scholar] [CrossRef]
- Coke, G.; Tsao, M. Random effects mixture models for clustering electrical load series. J. Time Ser. Anal. 2010, 31, 451–464. [Google Scholar] [CrossRef]
- McLoughlin, F.; Duffy, A.; Conlon, M. Characterising domestic electricity consumption patterns by dwelling and occupant socio-economic variables: An Irish case study. Energy Build. 2012, 48, 240–248. [Google Scholar] [CrossRef]
- Peel, D.; McLachlan, G. Robust mixture modelling using the t distribution. Stat. Comput. 2000, 10, 339–348. [Google Scholar] [CrossRef]
- Liu, C.; Rubin, D.M. Estimation of the t distribution using EM and its extensions, ECM and ECME. Stat. Sin. 1995, 5, 19–39. [Google Scholar]
- Wei, X.; Yang, Z. The infinite Student’s t-factor mixture analyzer for robust clustering and classification. Pattern Recognit. 2012, 45, 4346–4357. [Google Scholar] [CrossRef]
- Allili, M.; Bouguila, N.; Ziou, D. Finite general Gaussian mixture modeling and application to image and video foreground segmentation. J. Electron. Imaging 2008, 17, 013005. [Google Scholar]
- Elguebaly, T.; Bouguila, N. Bayesian learning of finite generalized Gaussian mixture models on images. Signal Process. 2011, 91, 801–820. [Google Scholar] [CrossRef]
- Elguebaly, T.; Bouguila, N. A nonparametric Bayesian approach for enhanced pedestrian detection and foreground segmentation. In Proceedings of the CVPR 2011 WORKSHOPS, Colorado Springs, CO, USA, 20–25 June 2011; pp. 21–26. [Google Scholar]
- Miller, J.; Thomas, J. Detectors for discrete-time signals in non-Gaussian noise. IEEE Trans. Inf. Theory 1972, 18, 241–250. [Google Scholar] [CrossRef]
- Farvardin, N.; Modestino, J. Optimum quantizer performance for a class of non-Gaussian memoryless sources. IEEE Trans. Inf. Theory 1984, 30, 485–497. [Google Scholar] [CrossRef]
- Gao, Z.; Belzer, B.; Villasenor, J.A. comparison of the Z, E/sub 8/, and Leech lattices for quantization of low-shape-parameter generalized Gaussian sources. IEEE Signal Process. Lett. 1995, 2, 197–199. [Google Scholar]
- Elguebaly, T.; Bouguila, N. Finite asymmetric generalized Gaussian mixture models learning for infrared object detection. Comput. Vis. Image Underst. 2013, 117, 1659–1671. [Google Scholar] [CrossRef]
- Elguebaly, T.; Bouguila, N. Model-based approach for high-dimensional non-Gaussian visual data clustering and feature weighting. Digit. Signal Process. 2015, 40, 63–79. [Google Scholar] [CrossRef]
- Hyvärinen, A.; Hoyer, P. Emergence of phase-and shift-invariant features by decomposition of natural images into independent feature subspaces. Neural Comput. 2000, 12, 1705–1720. [Google Scholar] [CrossRef] [PubMed]
- Farag, A.; El-Baz, A.; Gimel’farb, G. Precise segmentation of multimodal images. IEEE Trans. Image Process. 2006, 15, 952–968. [Google Scholar] [CrossRef] [PubMed]
- Bedingfield, S.; Alahakoon, D.; Genegedera, H.; Chilamkurti, N. Multi-granular electricity consumer load profiling for smart homes using a scalable big data algorithm. Sustain. Cities Soc. 2018, 40, 611–624. [Google Scholar] [CrossRef]
- Wang, Y.; Chen, Q.; Kang, C.; Xia, Q.; Luo, M. Sparse and redundant representation-based smart meter data compression and pattern extraction. IEEE Trans. Power Syst. 2016, 32, 2142–2151. [Google Scholar] [CrossRef]
- Yang, J.; Honavar, V. Feature subset selection using a genetic algorithm. Feature Extr. Constr. Sel. 1998, 13, 44–49. [Google Scholar]
- Elguebaly, T.; Bouguila, N. Simultaneous high-dimensional clustering and feature selection using asymmetric Gaussian mixture models. Image Vis. Comput. 2015, 34, 27–41. [Google Scholar] [CrossRef]
- Al-Otaibi, R.; Jin, N.; Wilcox, T.; Flach, P. Feature construction and calibration for clustering daily load curves from smart-meter data. IEEE Trans. Ind. Inform. 2016, 12, 645–654. [Google Scholar] [CrossRef]
- Iglesias, F.; Zseby, T.; Zimek, A. Absolute Cluster Validity. IEEE Trans. Pattern Anal. Mach. Intell. 2019, 42, 2096–2112. [Google Scholar] [CrossRef] [PubMed]
- Melzi, F.; Same, A.; Zayani, M.; Oukhellou, L.A. dedicated mixture model for clustering smart meter data: Identification and analysis of electricity consumption behaviors. Energies 2017, 10, 1446. [Google Scholar] [CrossRef]
- Wallace, C.; Dowe, D.L. MML Clustering of Multi-State, Poisson, von Mises circular and Gaussian distributions. Stat. Comput. 2000, 10, 73–83. [Google Scholar] [CrossRef]
- Wallace, C.; Freeman, P. Estimation and inference by compact coding. J. R. Stat. Soc. Ser. 1987, 49, 240–252. [Google Scholar] [CrossRef]
- Agusta, Y.; Dowe, D. Unsupervised learning of gamma mixture models using minimum message length. In Proceedings of the 3rd IASTED Conference on Artificial Intelligence and Applications, Benalma’dena, Spain, 8–10 September 2003; Acta Press: Benalmadena, Spain, 2003; pp. 457–462. [Google Scholar]
- Elguebaly, T.; Bouguila, N. Background subtraction using finite mixtures of asymmetric gaussian distributions and shadow detection. Mach. Vis. Appl. 2014, 25, 1145–1162. [Google Scholar] [CrossRef]
- Azam, M.; Bouguila, N. Multivariate-bounded Gaussian mixture model with minimum message length criterion for model selection. Expert Syst. 2021, 38, e12688. [Google Scholar] [CrossRef]
- Azam, M.; Bouguila, N. Multivariate bounded support laplace mixture model. Soft Comput. 2020, 24, 13239–13268. [Google Scholar] [CrossRef]
- Wallace, C.; Boulton, D. An information measure for classification. Comput. J. 1968, 11, 185–194. [Google Scholar] [CrossRef]
- Figueiredo, M.; Jain, A. Unsupervised learning of finite mixture models. IEEE Trans. Pattern Anal. Mach. Intell. 2002, 24, 381–396. [Google Scholar] [CrossRef]
- Conway, J.; Sloane, N. Sphere Packings, Lattices and Groups; Springer Science & Business Media: New York, NY, USA, 2013. [Google Scholar]
- Bouguila, N.; Ziou, D. High-dimensional unsupervised selection and estimation of a finite generalized Dirichlet mixture model based on minimum message length. IEEE Trans. Pattern Anal. Mach. Intell. 2007, 29, 1716–1731. [Google Scholar] [CrossRef] [PubMed]
- Bezdek, J.; Pal, N. Some new indexes of cluster validity. IEEE Trans. Syst. Man, Cybern. Part B 1998, 28, 301–315. [Google Scholar] [CrossRef] [PubMed]
- Rousseeuw, P.S. Silhouettes: A graphical aid to the interpretation and validation of cluster analysis. J. Comput. Appl. Math. 1987, 20, 53–65. [Google Scholar] [CrossRef]
- Caliński, T.; Harabasz, J. A dendrite method for cluster analysis. Commun. Stat.-Theory Methods 1974, 3, 1–27. [Google Scholar] [CrossRef]
- Davies, D.L.; Bouldin, D.W. A cluster separation measure. IEEE Trans. Pattern Anal. Mach. Intell. 1979, 2, 224–227. [Google Scholar] [CrossRef]
- Allili, M. Wavelet modeling using finite mixtures of generalized Gaussian distributions: Application to texture discrimination and retrieval. IEEE Trans. Image Process. 2011, 21, 1452–1464. [Google Scholar] [CrossRef] [PubMed]
- Baldi, P.; Brunak, S.; Chauvin, Y.; Andersen, C.; Nielsen, H. Assessing the accuracy of prediction algorithms for classification: An overview. Bioinformatics 2000, 16, 412–424. [Google Scholar] [CrossRef] [PubMed]
- Schwarz, G. Estimating the dimension of a model. Ann. Stat. 1978, 6, 461–464. [Google Scholar] [CrossRef]


| Special Case | Required Change in FSBAGGMM Parameters |
|---|---|
| Feature selection model based on | |
| the Asymmetric Generalized Gaussian Mixture (FSAGGMM) [56] | |
| Feature selection model based on | |
| the Bounded Asymmetric Gaussian Mixture (FSBAGMM) | |
| Feature selection model based on | |
| the Asymmetric Gaussian Mixture (FSAGMM) [62] | |
| Feature selection model based on | |
| the Bounded Generalized Gaussian Mixture (FSBGGMM) | |
| Feature selection model based on | |
| the Generalized Gaussian Mixture (FSGGMM) | |
| Feature selection model based on | |
| the Bounded Gaussian Mixture (FSBGMM) | |
| Feature selection model based on | |
| the Gaussian Mixture (FSGMM) | |
| Feature selection model based on | |
| the Bounded Laplace Mixture (FSBLMM) | |
| Feature selection model based on | |
| the Laplace Mixture (FSLMM) | |
| Asymmetric Generalized Gaussian Mixture Model (AGGMM) [55] | |
| Bounded Asymmetric Gaussian Mixture Model (BAGMM) | |
| Asymmetric Gaussian Mixture Model (AGMM) [69] | |
| Bounded Generalized Gaussian Mixture Model (BGGMM) [18] | |
| Generalized Gaussian Mixture Model (GGMM) [49] | |
| Bounded Gaussian Mixture Model (BGMM) [70] | |
| Gaussian Mixture Model (GMM) | |
| Bounded Laplace Mixture Model (BLMM) [71] | |
| Laplace Mixture Model (LMM) |
| Gaussian White Noise Parameters | Profile 1 | Profile 2 | Profile 3 | Profile 4 | Profile 5 |
|---|---|---|---|---|---|
| = 0.001; = 0.2 | 378 | 370 | 379 | 371 | 382 |
| = 0.01; = 0.2 | 349 | 364 | 356 | 356 | 355 |
| = 0.1; = 0.2 | 352 | 360 | 361 | 359 | 348 |
| = 0.05; = 0.3 | 354 | 358 | 359 | 356 | 353 |
| = 0.01; = 0.3 | 365 | 353 | 357 | 350 | 355 |
| Performance Index (%) | FSBAGGMM | FSAGGMM | BAGGMM | AGGMM |
|---|---|---|---|---|
| ACC | 95.569 | 94.338 | 85.458 | 82.804 |
| TPR/Recall | 88.935 | 85.836 | 63.589 | 56.953 |
| PPV/Precision | 89.458 | 88.149 | 74.838 | 70.500 |
| MCC | 86.291 | 82.921 | 58.170 | 51.104 |
| F1-Score | 88.922 | 85.844 | 63.644 | 57.011 |
| TNR | 97.231 | 96.461 | 90.906 | 89.245 |
| NPV | 97.263 | 96.591 | 92.128 | 90.942 |
| FPR | 2.769 | 3.539 | 9.094 | 10.755 |
| FNR | 11.065 | 14.164 | 36.411 | 43.047 |
| FDR | 10.542 | 11.851 | 25.162 | 29.500 |
| Performance Index | Optimal Performance Indicator | FSBAGGMM | FSAGGMM | BAGGMM | AGGMM |
|---|---|---|---|---|---|
| GOF | Minimum | 3870.683 | 7261.083 | 16,397.633 | 17,765.500 |
| CH | Maximum | 2081.868 | 2046.444 | 1594.215 | 1405.947 |
| S | Maximum | 0.107 | 0.100 | 0.023 | −0.016 |
| DB | Minimum | 2.549 | 2.623 | 2.661 | 2.503 |
| DI | Maximum | 0.224 | 0.219 | 0.209 | 0.209 |
| Xie and Benie Index | Minimum | 1.871 | 1.881 | 2.446 | 2.698 |
| Fowlkes Mallows | Maximum | 0.799 | 0.755 | 0.650 | 0.648 |
| Log Loss | Minimum | 0.625 | 0.901 | 9.741 | 12.138 |
| EOE | Minimum | 0.730 | 0.758 | 1.022 | 1.032 |
| Jaccard | Maximum | 0.889 | 0.858 | 0.636 | 0.570 |
| ROC AUC | Maximum | 0.931 | 0.912 | 0.773 | 0.731 |
| V Measure | Maximum | 0.755 | 0.740 | 0.660 | 0.639 |
| Rand | Maximum | 0.919 | 0.899 | 0.820 | 0.795 |
| Normalized Mutual Information | Maximum | 0.755 | 0.740 | 0.660 | 0.639 |
| Mutual Information | Maximum | 1.213 | 1.181 | 0.969 | 0.887 |
| Homogeneity | Maximum | 0.754 | 0.734 | 0.602 | 0.551 |
| Adjusted Rand | Maximum | 0.749 | 0.691 | 0.524 | 0.497 |
| Adjusted Mutual Info | Maximum | 0.755 | 0.740 | 0.660 | 0.639 |
| Method | FSBAGGMM |
|---|---|
| BIC | 7 |
| AIC | 7 |
| DI | 4 |
| MML | 5 |
| EoE | 5 |
| GT | 5 |
| Method | BAGGMM + FW |
|---|---|
| BIC | 6 |
| AIC | 6 |
| DI | 6 |
| MML | 8 |
| EoE | 8 |
| GT | 8 |
| Gaussian White Noise Parameters | Profile 1 | Profile 2 | Profile 3 | Profile 4 | Profile 5 | Profile 6 | Profile 7 | Profile 8 |
|---|---|---|---|---|---|---|---|---|
| = 0.001; = 0.2 | 445 | 448 | 450 | 444 | 449 | 447 | 442 | 455 |
| = 0.01; = 0.2 | 442 | 449 | 448 | 448 | 448 | 452 | 445 | 448 |
| = 0.1; = 0.2 | 442 | 452 | 455 | 449 | 447 | 443 | 447 | 445 |
| = 0.05; = 0.3 | 445 | 448 | 444 | 451 | 453 | 447 | 442 | 450 |
| = 0.01; = 0.3 | 460 | 459 | 458 | 468 | 457 | 455 | 466 | 457 |
| Performance Index (%) | FSBAGGMM | FSAGGMM | BAGGMM | AGGMM |
|---|---|---|---|---|
| ACC | 91.856 | 88.746 | 88.481 | 87.769 |
| TPR/Recall | 67.459 | 54.969 | 53.862 | 51.021 |
| PPV/Precision | 66.482 | 55.753 | 56.402 | 54.291 |
| MCC | 63.813 | 50.402 | 49.908 | 46.726 |
| F1-Score | 67.422 | 54.983 | 53.922 | 51.078 |
| TNR | 95.347 | 93.570 | 93.418 | 93.012 |
| NPV | 95.456 | 93.921 | 93.926 | 93.528 |
| FPR | 4.653 | 6.430 | 6.582 | 6.988 |
| FNR | 32.541 | 45.031 | 46.138 | 48.979 |
| FDR | 33.518 | 44.247 | 43.598 | 45.709 |
| Performance Index | Optimal Performance Indicator | FSBAGGMM | FSAGGMM | BAGGMM | AGGMM |
|---|---|---|---|---|---|
| GOF | Minimum | 22,539.820 | 36,474.842 | 50,310.225 | 48,011.423 |
| CH | Maximum | 2100.955 | 1766.797 | 1713.450 | 1674.616 |
| S | Maximum | 0.054 | 0.001 | −0.052 | −0.062 |
| DB | Minimum | 3.563 | 4.975 | 6.767 | 6.738 |
| DI | Maximum | 0.210 | 0.213 | 0.208 | 0.194 |
| Xie and Benie | Minimum | 2.883 | 3.619 | 3.683 | 3.784 |
| Fowlkes Mallows | Maximum | 0.574 | 0.486 | 0.518 | 0.503 |
| Log Loss | Minimum | 3.293 | 10.287 | 12.618 | 13.228 |
| EOE | Minimum | 0.620 | 0.637 | 0.685 | 0.675 |
| Jaccard | Maximum | 0.674 | 0.550 | 0.539 | 0.511 |
| ROC AUC | Maximum | 0.814 | 0.743 | 0.737 | 0.720 |
| V Measure | Maximum | 0.644 | 0.565 | 0.593 | 0.586 |
| Rand | Maximum | 0.881 | 0.836 | 0.831 | 0.821 |
| Normalized Mutual Information | Maximum | 0.644 | 0.565 | 0.593 | 0.586 |
| Mutual Info | Maximum | 1.303 | 1.088 | 1.114 | 1.093 |
| Homogeneity | Maximum | 0.627 | 0.523 | 0.536 | 0.526 |
| Adjusted Rand | Maximum | 0.502 | 0.384 | 0.407 | 0.385 |
| Adjusted Mutual Info | Maximum | 0.644 | 0.565 | 0.593 | 0.585 |
| Model Selection Method | FSBAGGMM |
|---|---|
| BIC | 3 |
| AIC | 3 |
| DI | 2 |
| MML | 3 |
| EoE | 4 |
| Performance Index | Metric’s Optimal Value | FSBAGGMM | FSAGGMM | BAGGMM | AGGMM |
|---|---|---|---|---|---|
| S | Maximum | 0.250 | 0.216 | 0.228 | 0.176 |
| CH | Maximum | 7.377 | 5.824 | 6.671 | 5.594 |
| DB | Minimum | 16.951 | 23.832 | 20.626 | 24.577 |
| DI | Maximum | 0.253 | 0.238 | 0.249 | 0.224 |
| Xie and Benie | Minimum | 60.821 | 72.969 | 62.157 | 73.319 |
| EOE | Minimum | 1.460 | 1.764 | 1.613 | 1.822 |
| Consumption Profile Cluster | Average Consumption (kWh) | Annual Consumption Responsibility | Clusters’ Proportion |
|---|---|---|---|
| 1 | 6536.770 | 18.650% | 64.600% |
| 2 | 16,117.190 | 45.980% | 1.700% |
| 3 | 12,394.570 | 35.360% | 33.700% |
| Model Selection Method | FSBAGGMM |
|---|---|
| BIC | 4 |
| AIC | 4 |
| DI | 4 |
| MML | 4 |
| EoE | 2 |
| Performance Index | Metric’s Optimal Value | FSBAGGMM | FSAGGMM | BAGGMM | AGGMM |
|---|---|---|---|---|---|
| S | Maximum | 0.319 | 0.288 | 0.265 | 0.189 |
| CH | Maximum | 1984.843 | 1078.837 | 545.442 | 243.243 |
| DB | Minimum | 1.050 | 1.075 | 2.583 | 3.108 |
| DI | Maximum | 0.027 | 0.023 | 0.019 | 0.012 |
| Xie and Benie | Minimum | 0.550 | 0.719 | 0.939 | 1.283 |
| EOE | Minimum | 0.315 | 0.434 | 0.442 | 0.453 |
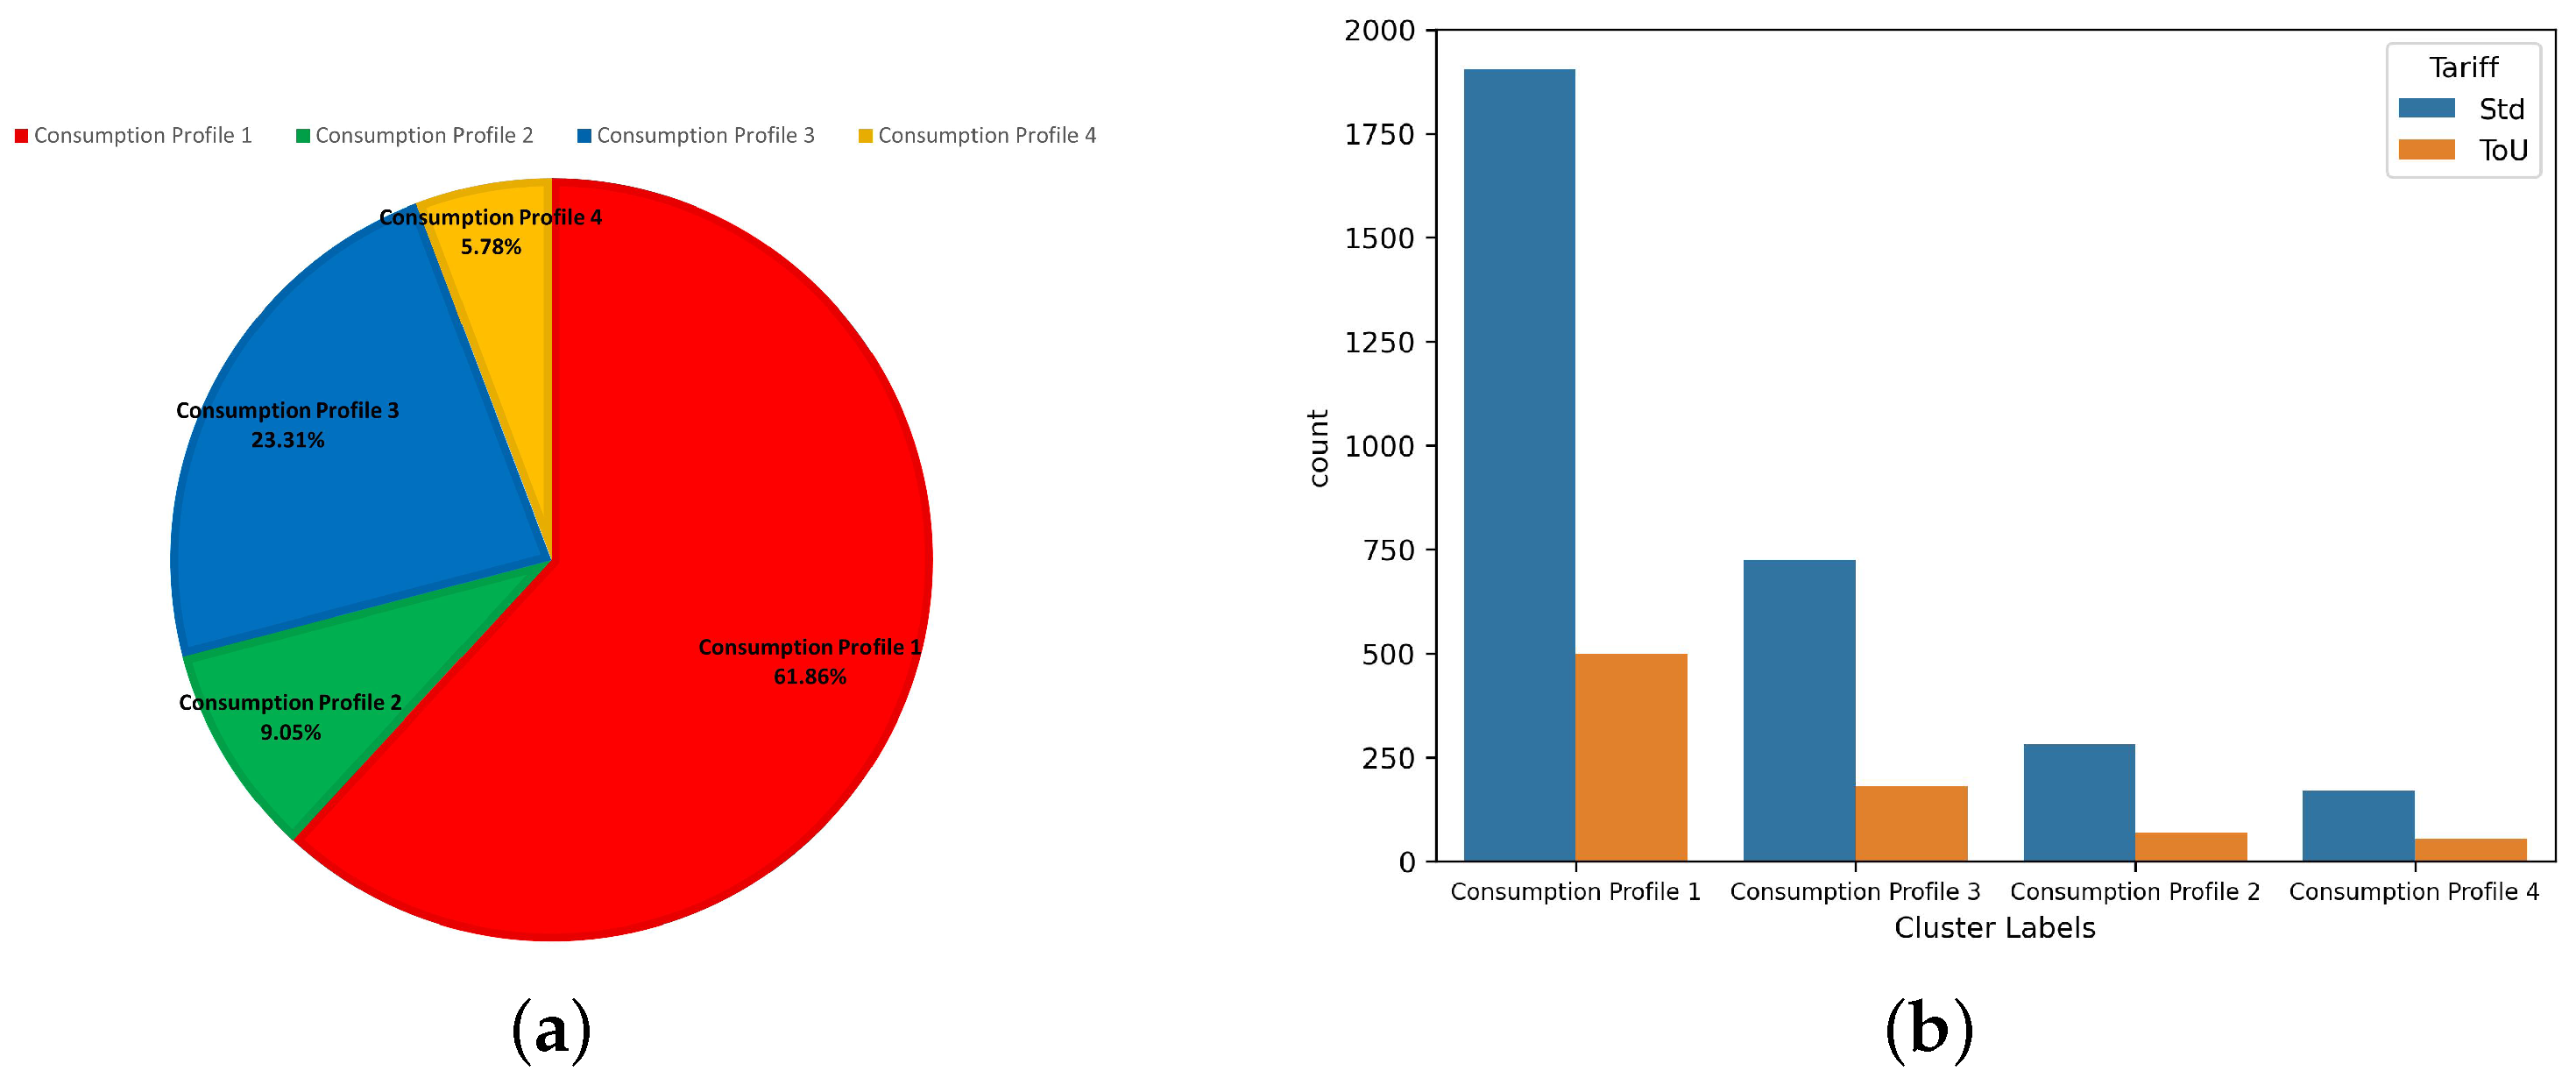
| Consumption Profile | Overnight RAP | Breakfast RAP | Daytime RAP | Evening RAP | Mean STD | Seasonal Score | WD-WE Diff. Score |
|---|---|---|---|---|---|---|---|
| 1 | 0.686 | 0.937 | 1.041 | 1.344 | 0.810 | 0.883 | 0.458 |
| 2 | 0.664 | 1.050 | 0.956 | 1.411 | 1.127 | 1.025 | 1.557 |
| 3 | 0.672 | 0.959 | 1.011 | 1.381 | 0.974 | 2.062 | 0.553 |
| 4 | 0.860 | 0.981 | 0.916 | 1.249 | 1.169 | 4.445 | 0.591 |
Disclaimer/Publisher’s Note: The statements, opinions and data contained in all publications are solely those of the individual author(s) and contributor(s) and not of MDPI and/or the editor(s). MDPI and/or the editor(s) disclaim responsibility for any injury to people or property resulting from any ideas, methods, instructions or products referred to in the content. |
© 2023 by the authors. Licensee MDPI, Basel, Switzerland. This article is an open access article distributed under the terms and conditions of the Creative Commons Attribution (CC BY) license (https://creativecommons.org/licenses/by/4.0/).
Share and Cite
Al-Bazzaz, H.; Azam, M.; Amayri, M.; Bouguila, N. Unsupervised Mixture Models on the Edge for Smart Energy Consumption Segmentation with Feature Saliency. Sensors 2023, 23, 8296. https://doi.org/10.3390/s23198296
Al-Bazzaz H, Azam M, Amayri M, Bouguila N. Unsupervised Mixture Models on the Edge for Smart Energy Consumption Segmentation with Feature Saliency. Sensors. 2023; 23(19):8296. https://doi.org/10.3390/s23198296
Chicago/Turabian StyleAl-Bazzaz, Hussein, Muhammad Azam, Manar Amayri, and Nizar Bouguila. 2023. "Unsupervised Mixture Models on the Edge for Smart Energy Consumption Segmentation with Feature Saliency" Sensors 23, no. 19: 8296. https://doi.org/10.3390/s23198296
APA StyleAl-Bazzaz, H., Azam, M., Amayri, M., & Bouguila, N. (2023). Unsupervised Mixture Models on the Edge for Smart Energy Consumption Segmentation with Feature Saliency. Sensors, 23(19), 8296. https://doi.org/10.3390/s23198296