You are currently viewing a new version of our website. To view the old version click .
Sensors
  • Article
  • Open Access

28 September 2023

FoGGAN: Generating Realistic Parkinson’s Disease Freezing of Gait Data Using GANs

,
,
,
,
and
1
Institute of Communication and Computer Systems, National Technical University of Athens, 15773 Athens, Greece
2
Department of Agricultural Economics and Rural Development, Agricultural University of Athens, 11855 Athens, Greece
*
Author to whom correspondence should be addressed.
This article belongs to the Special Issue eHealth Platforms and Sensors for Health and Human Activity Monitoring

Abstract

Data scarcity in the healthcare domain is a major drawback for most state-of-the-art technologies engaging artificial intelligence. The unavailability of quality data due to both the difficulty to gather and label them as well as due to their sensitive nature create a breeding ground for data augmentation solutions. Parkinson’s Disease (PD) which can have a wide range of symptoms including motor impairments consists of a very challenging case for quality data acquisition. Generative Adversarial Networks (GANs) can help alleviate such data availability issues. In this light, this study focuses on a data augmentation solution engaging Generative Adversarial Networks (GANs) using a freezing of gait (FoG) symptom dataset as input. The data generated by the so-called FoGGAN architecture presented in this study are almost identical to the original as concluded by a variety of similarity metrics. This highlights the significance of such solutions as they can provide credible synthetically generated data which can be utilized as training dataset inputs to AI applications. Additionally, a DNN classifier’s performance is evaluated using three different evaluation datasets and the accuracy results were quite encouraging, highlighting that the FOGGAN solution could lead to the alleviation of the data shortage matter.

1. Introduction

PD according to the World Health Organization is a degenerative condition of the brain, associated with motor symptoms (e.g., tremor, imbalance, slow movement, and FoG) as well as non-motor symptoms (e.g., insomnia, cognitive impairment, pain, and sensory disturbances) [1]. The symptoms usually emerge slowly, and as the disease worsens, non-motor symptoms become more apparent [2]. Early symptoms are tremors, rigidity, slowness of movement, and walking difficulties [3]. Issues during the disease progression include cognition, mood, sleep disorders (also as prodromal signs), and various sensory systems deficits [4]. FoG is a unique and higher gait disorder in advanced PD patients defined as a “brief episodic absence or marked reduction of forwarding progression of the feet despite the intention to walk” [5]. The symptom lasts a couple of seconds or more and poses many difficulties to clinicians in understanding its exact mechanisms and finding a proper treatment [6,7]. About half of the people with PD exhibit freezing of gait episodes, where the most common and initial symptoms are trembling in place with no motion, shuffling, or hastening, and total akinesia with tremor and hastening. FoG occurs during the gait initiation and turning but manifests in constraints like walking through a narrow path, doorways, dual tasking, etc., which are different for each individual.
The number of PD cases has been increasing in recent decades, at a faster pace as compared to other neurological diseases. In the United States, nearly 90,000 people are diagnosed with PD every year and according to the Parkinson’s Foundation, there will be 1.2 million people with PD in the US by 2030 [8] whilst worldwide it is calculated that there are around 10 million people having this condition [9]. This raises concerns among epidemiologists and has attracted the interest of the academic, research and health communities. The reasons why PD cases increase year by year include increased stress, lack of physical exercise, aging population as well as better medical treatment which leads to prolonged life duration of people as well as of PD patients. The patients can continue their life without any serious effects when early detection can lead to the right treatment and timely interventions. Thus, it is of utmost importance to gather data for developing techniques and tools that detect and fight the PD early.
FoG is recognized as one of the most critical debilitating motor symptoms of advanced PD, presents a higher rate of occurrence in aged people while, as elaborated previously, its episodes are random in time and subjective to each person at that occasion, and under those circumstances it manifests. Thus, the inherent difficulties and the random nature of FoG manifestation, in tandem with the need for an experienced clinician’s presence (while data acquisition occurs) to verify and annotate the data (time point of occurrence), exhibit the limitations in collecting large volumes of FoG-related data. It is apparent that data augmentation via synthetic data creation for prediction/classification purposes is more than critical towards robust and generic model development. Such tools, given the technological evolution, can be provided by computer science, i.e., AI methods. The main hindrance to such technologies is the limited availability of data in order to be sufficiently robust and efficient.
The availability of data in the healthcare domain is crucial and, in many cases, due to many reasons such as privacy legislation, there is difficulty in data gathering, with data being scarce, unstructured or of low quality. Especially in PD, another limitation concerns the patients who cannot provide daily or periodically unbiased and exact data in a systematic way due to motor impairment and other symptoms coupled with the frequency the patients visit and report to their doctors. Also, the wide spectrum of data that can be collected for PD patients imposes another difficulty for computer scientists to develop tools to detect PD in early stages. The heterogeneity and the scarcity of PD data are a major concern for state-of-the-art technologies as they can hinder such “smart” solutions due to inefficient training. This leads to the necessity of alternative ways for data augmentation by engaging state-of-the-art technology such as GANs.
Ian Goodfellow et al. [10], back in 2014, proposed the term and a framework called Generative Adversarial Network (GAN). GANs have the ability to generate almost identical data records as those provided as input to the generator merged with random noise. Also, they consist of an alternative technique for developing generative models and architectures. GANs have proved quite effective and useful for applications that require data augmentation as is the case for the one examined in this study. In this light, this very study aims to present the usefulness of GANs to the data augmentation of FoG data samples for PD patients. In the methodology presented, there is a thorough description of the parameterization as well as the architecture of different GAN implementations in order to evaluate and compare the synthetically generated data. Through various indicators, the quality of the data generated is assessed in order to conclude the similarity of them with the original provided data. This solution aims to lift the limitations imposed by lack of data or unstructured and low-quality data in the domain of the PD. Researchers and academics having available such solutions in their quiver can make significant progress in terms of AI solutions in domains where data availability is a major issue.
The shortage of data in the health domain, due to the sensitive and private nature of healthcare data which is accompanied with strict ethical and legal regulations governing their acquisition and usage is, in general, a well-known bottleneck for efficient model training, because it is hard to acquire. This can result in limited sample sizes, restricting dataset diversity and representativeness. The lack of quality data significantly impacts the development of AI technologies in multiple ways: (i) affecting the model’s performance, (ii) introducing biases leading to inaccurate and unfair predictions, (iii) raising ethical concerns regarding patient privacy, (iv) causing delays in AI model development, and (v) impacting validation compliance, as adequate data are vital for model efficacy. Thus, the motivation and the contribution of this work is the development of a novel yet efficient methodology for synthetic data creation. In this work, we present a novel approach for realistic synthetic data creation with the exact characteristic properties of the data fed in the FoGGAN model, that its application can lead to data augmentation and mitigation of bias and unbalances by creating data using the under-represented origin of the original data. This highlights the potential of GANs in mitigating data scarcity issues by generating data that preserve essential and similar-looking statistical and structural characteristics of the limited original input dataset.
The remainder of the paper is organized as follows: Section 2 presents related works, focusing on the domain of PD and healthcare data augmentation. Section 3 describes the dataset used and the methodology designed and developed, whilst Section 4 elaborates on the produced results. Finally, Section 5 concludes the paper.

3. Data Feature Selection and Generation Using GANs

3.1. Dataset

The ‘data_daphnet_combined’ dataset [56] was based on the Daphnet Freezing of Gait dataset [57] which was devised to benchmark automatic methods to recognize gait freeze from wearable acceleration sensors placed on the legs and hip. The dataset can be used in research and the evaluation of machine learning models for PD detection. It provides a realistic and representative sample of sensory records of PD patients, making it a valuable resource for researchers and practitioners in the field of health. The ‘data_daphnet_combined’ dataset had twelve columns which contained nine different attributes as well as a time, an annotation, and a filename column. The Daphnet Freezing of Gait dataset captures were collected in the lab with emphasis on generating many freeze events. Users performed their kinds of tasks: straight line walking, walking with numerous turns, and finally a more realistic activity of daily living (ADL) task, where users went into different rooms while fetching coffee, opening doors, etc.
The dataset contained a total of 1.92 million records. Each record contains a value (real number) for each of the nine attributes collected. Also, for each record, there is the annotation column which can have a 0, 1, or 2 value. These annotations mean the following:
  • 0: not part of the experiment. For instance, the sensors were installed on the user or the user was performing activities unrelated to the experimental protocol, such as debriefing;
  • 1: experiment, no freeze (can be any of stand, walk, or turn);
  • 2: freeze.
To refine the dataset and optimize the generation processes, we executed targeted preprocessing procedures. First, we excluded data instances categorized under class 0. To simplify the classification task, that will be detailed in Section 4, we redeclared class 2, originally denoted as “freeze” events, as class 0. Meanwhile, class 1 remained unprocessed throughout this process.
Thus, each data record in the dataset included detailed information about time, the values from the sensors placed to ankles, upper legs and the trunks as well as the annotation and the data file containing the record. Table 1 presents the data type of each of the 12 features included in the initial dataset used.
Table 1. Initial dataset features and their data types.

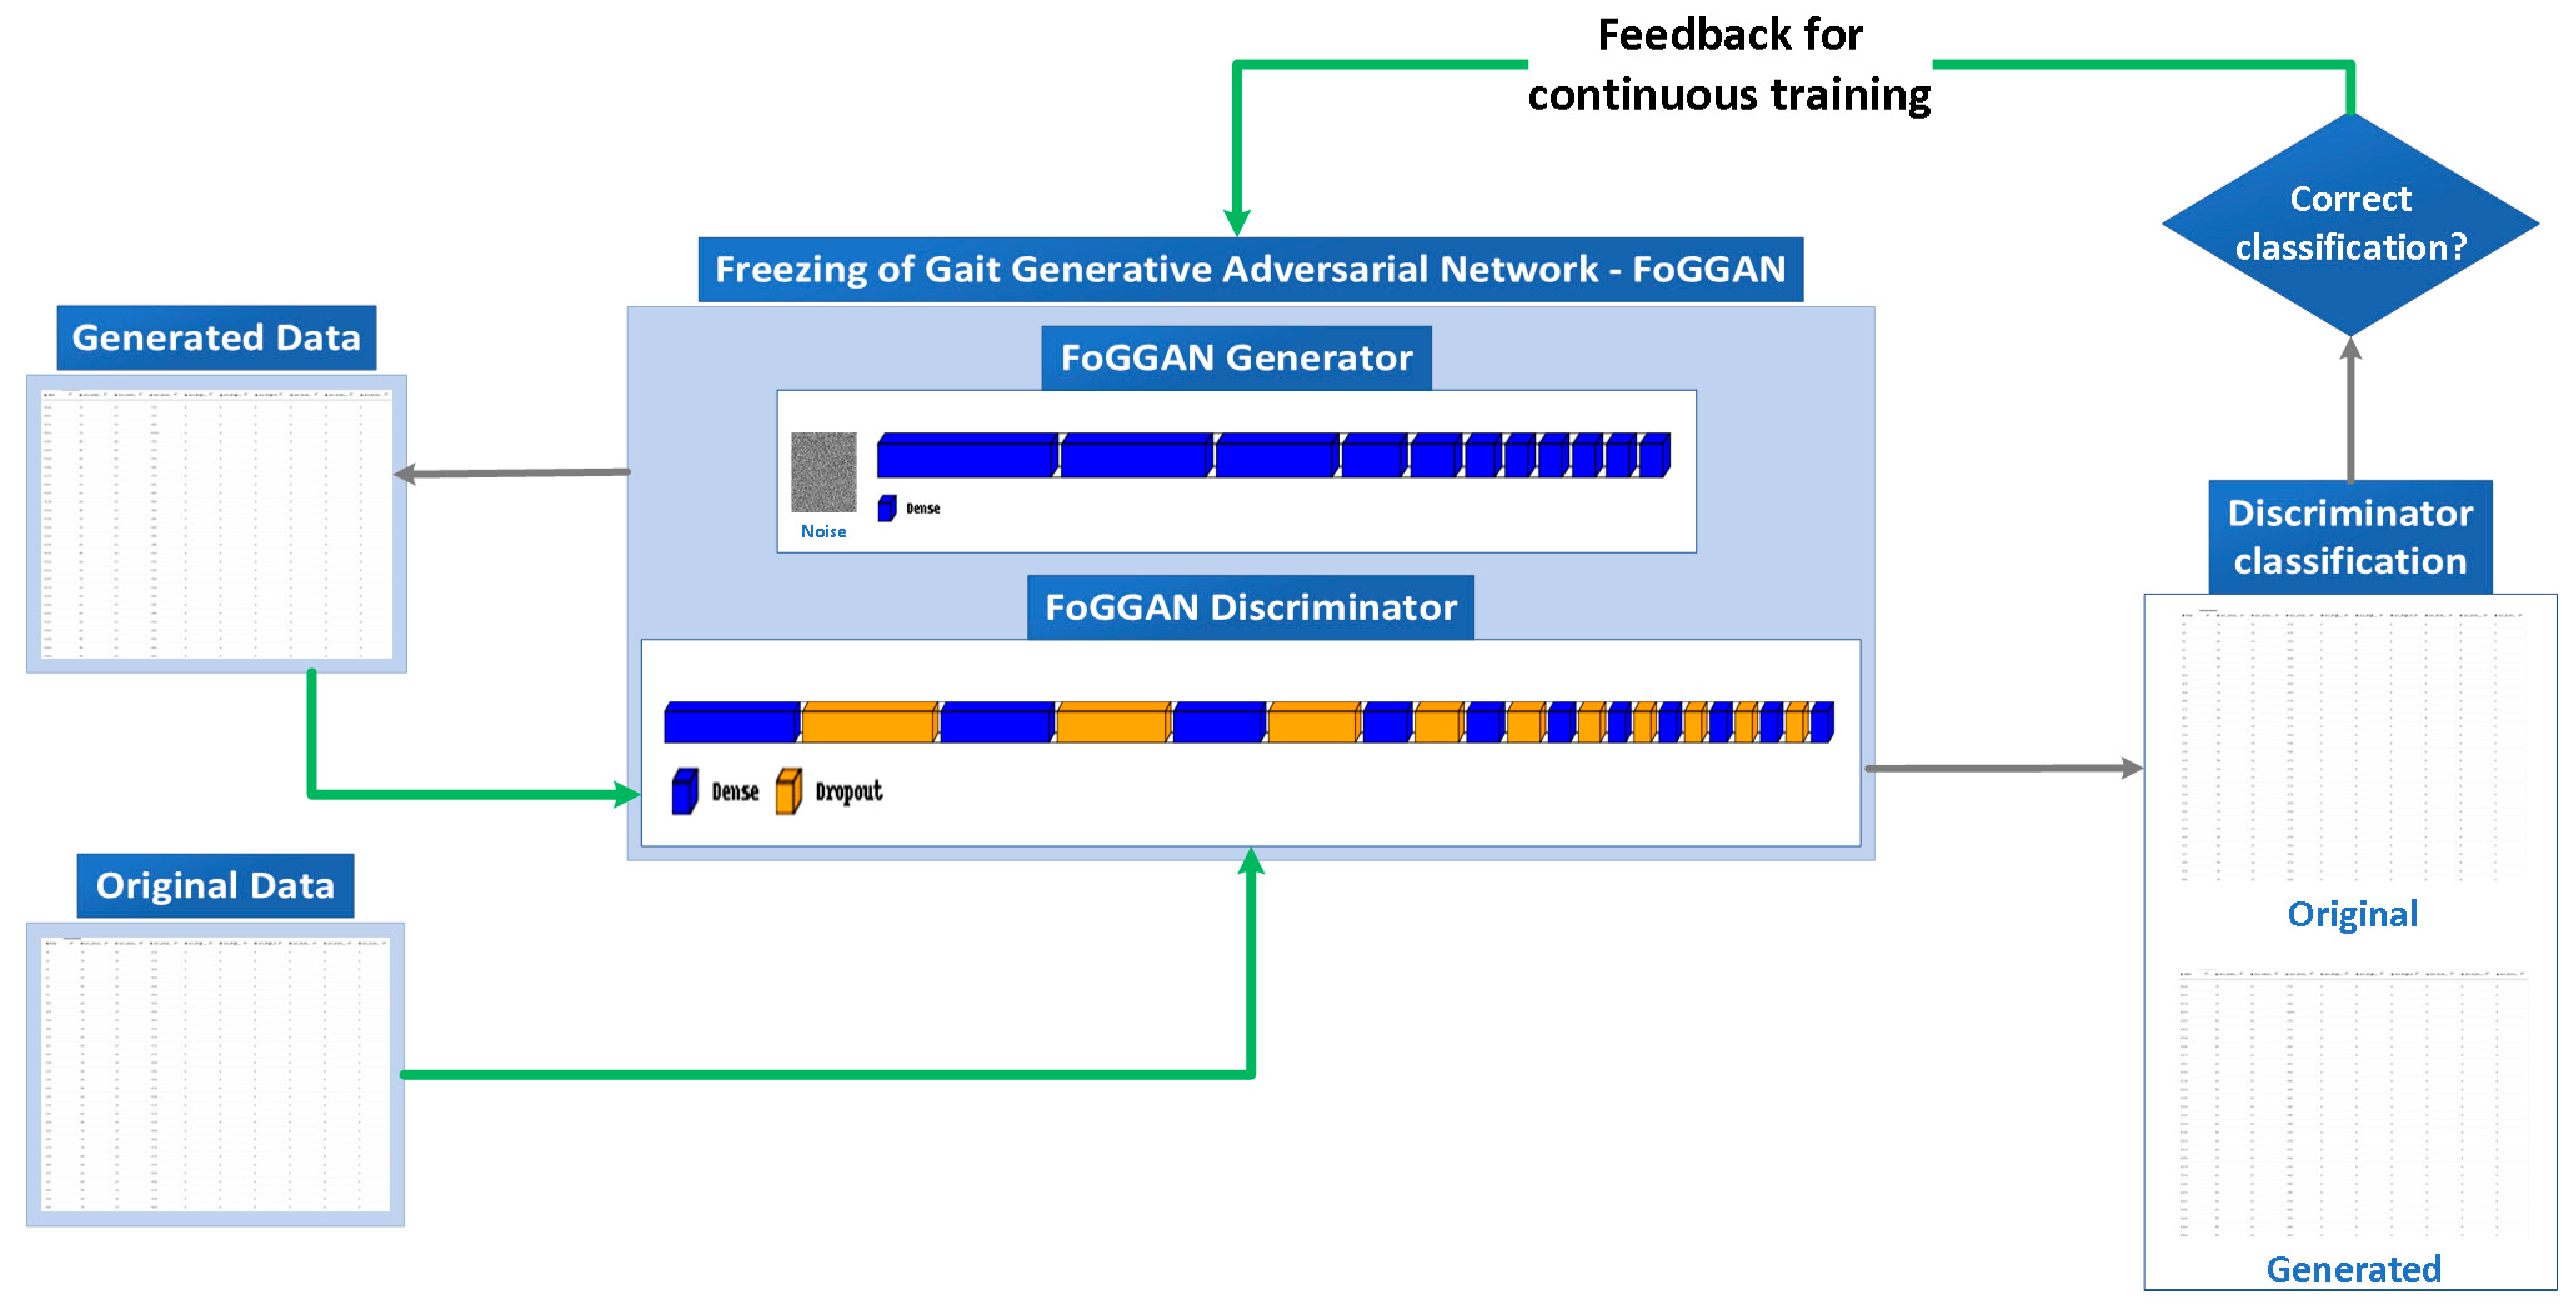
3.2. FoGGAN Architecture

Generative Adversarial Networks (GANs) are a category of algorithms, which encompass a dual neural network framework characterized by adversarial competition, hence the term “adversarial”. This architectural solution comprises two distinct neural networks, specifically referred to as the generator and the discriminator, collaborating to generate synthetic data. In 2014, Ian Goodfellow and his colleagues introduced [10] advanced deep learning techniques aimed at generating diverse types of synthetic datasets, encompassing images, tabular data, text, videos, and music compositions, giving a strong emphasis on achieving a high degree of similarity to the original datasets.
The primary objective of the generator is the creation of top-tier synthetic data, with the specific intent of deceiving the discriminator. It takes a random noise vector as input in order to produce high-quality, similar-looking data resembling the provided content.
In contrast, the discriminator is tasked with distinguishing between real and synthetic data. The model is implemented as a sequential deep neural network, comprising dense and dropout layers, with the task of classifying input data samples as either real (original) or fake (generated). Its effectiveness in distinguishing real from fake data samples is, then, utilized to optimize and enhance the overall performance of the GAN, encompassing both the generator and the discriminator. Figure 1 illustrates the adversarial competition between the generator and the discriminator as well as the overall flow of processes in this architecture. Once the data samples are appropriately classified as either real or fake by the discriminator, it returns the corresponding feedback to the generator to readjust and improve its weights accordingly so as to continue the data-sample-generation process.
Figure 1. FoGGAN implementation and data flow.
Calculating generator and discriminator losses is of paramount importance during the training processes of Generative Adversarial Networks (GANs). These loss functions serve as pivotal metrics to optimize the performance of both networks. They facilitate the adversarial learning process by quantifying the generator’s ability to deceive the discriminator and the discriminator’s capability to distinguish between real and generated data samples. As previously mentioned, and demonstrated in Figure 1, the losses establish a critical feedback loop, driving iterative improvements in both the generator and discriminator. Furthermore, they are instrumental in achieving GAN convergence, where the generator generates realistic data and the discriminator performs at chance level, ensuring the production of high-quality and comparable synthetic data in appearance.
The pivotal aspect of the GANs’ evolvement lies in the utilization of loss functions, a collection of mathematical Equations (1)–(3) guiding each network’s improvement after every training epoch. These equations are provided later in the text. The discriminator and generator possess their respective loss values. Across successive epochs, these networks learn by striving to minimize their respective loss functions.
More specifically, the generator and discriminator losses are computed independently and then integrated through a min-max game as described below by Equation (1) [10]. In this equation, G represents the generator, D represents the discriminator, and V(D, G) represents the value function of the min-max game. In greater detail, the process begins by establishing the generator’s data distribution, denoted as pg(x), which operates under the assumption that the input noise variables, pz(z) have been already defined. Once these noise variables are defined, a mapping to the data space is articulated as G(z; θg), where G represents a differentiable function instantiated as a multilayer perceptron, characterized by parameters θg. Simultaneously, a second multilayer perceptron, denoted as D(x; θd), is introduced. This perceptron returns an output of a singular scalar value. Specifically, D(x) quantifies the probability that the data point x originates from the actual data distribution rather than being generated by pg. Consequently, the training procedure involves dual objectives: Firstly, the discriminator is trained to maximize the likelihood of correctly classifying both original and generated samples. Secondly, the generator is trained to minimize the negative logarithm of (1 − D(G(z))).
Additionally, the losses for both the generator and the discriminator can be computed independently using Equations (2) and (3). Both generator and discriminator losses will ultimately converge to a stable state as they undergo an adequate number of training epochs.
m i n G m a x D V ( D , G ) = E x p g ( x ) [ log D ( x ) ] + E z p z ( z ) [ log ( 1 D ( G ( z ) ) ) ]
m i n G V ( G ) = θ g 1 m i = 1 m log ( 1 D ( G ( z ( i ) ) ) )
m a x D V ( D ) = θ d 1 m i = 1 m [ log D ( x ( i ) + log ( 1 D ( G ( z ( i ) ) ) ) ]
In this study, we implemented the so-called Freeze of Gait GAN (FoGGAN) model architecture, designed specifically for generating one-dimensional (1D) synthetic data from the dataset previously described in Section 3.1. The implementation was carried out using TensorFlow 2.0 [58], leveraging the high-level Keras API. For the visual representation of the generator model’s architecture, please refer to Table 2. We employed the sequential API to construct a sequence object, effectively stacking the various layers of the proposed deep neural network. The generator component within the FoGGAN architecture comprised an input layer, accepting appropriately scaled random noise, followed by nine hidden layers, all activated using the ‘ReLU’ function, and culminating in an output layer. This output layer was activated by the ‘linear’ function and matched the dimension of the preprocessed dataset. Subsequently, Table 3 provided a comprehensive definition of the discriminator model, which was also structured as a straightforward sequential model featuring eleven dense layers, The first ten layers utilized the ‘ReLU’ activation function, while the output layer employed ‘sigmoid’ activation, serving to distinguish input samples as either real or fake. Furthermore, a dropout rate of 20% was applied to both the input (the visible one) layer and the two hidden layers of the discriminator model. The FoGGAN model underwent training for 500 epochs with a batch size of 50. Additionally, the learning rate for the discriminator was set to 0.001, while for the generator, it was 0.01.
Table 2. Generator model output.
Table 3. Discriminator model output.

4. Results

4.1. Comparison Results between Original and FoGGAN-Generated Data

Diagrams prove to be an efficacious tool for comparing and visualizing similarity scores between real and synthetic datasets generated by a GAN (FoGGAN in our study) model. These scores offer crucial insights into the quality and precision of the synthetic dataset, aiding researchers in pinpointing areas where improvements to the GAN model are needed to produce more similar-looking synthetic data. The choice of diagram type depends on the data’s inherent characteristics as well as on the specific objectives of the research.
In the context of the current study, we employed the developed FoGGAN architecture (as previously mentioned in Section 3.2) to replicate synthetic data from a genuine input dataset, specifically the ‘data_daphnet_combined’ dataset, detailed in Section 3.1. The generated dataset was meticulously compared to the real one to extract the corresponding similarity scores across the encompassed features (variables).
For this purpose, five distinct types of diagrams, outlined below, served as effective means to represent these similarity scores. Each figure presented in the subsequent section incorporated the following elements:
  • Heatmaps depicting correlation matrices offer a valuable solution in terms of visualizing clusters and detecting dissimilarities between the real and generated datasets. These heatmaps prove especially beneficial for pinpointing patterns of similarity scores linked to distinct data features.
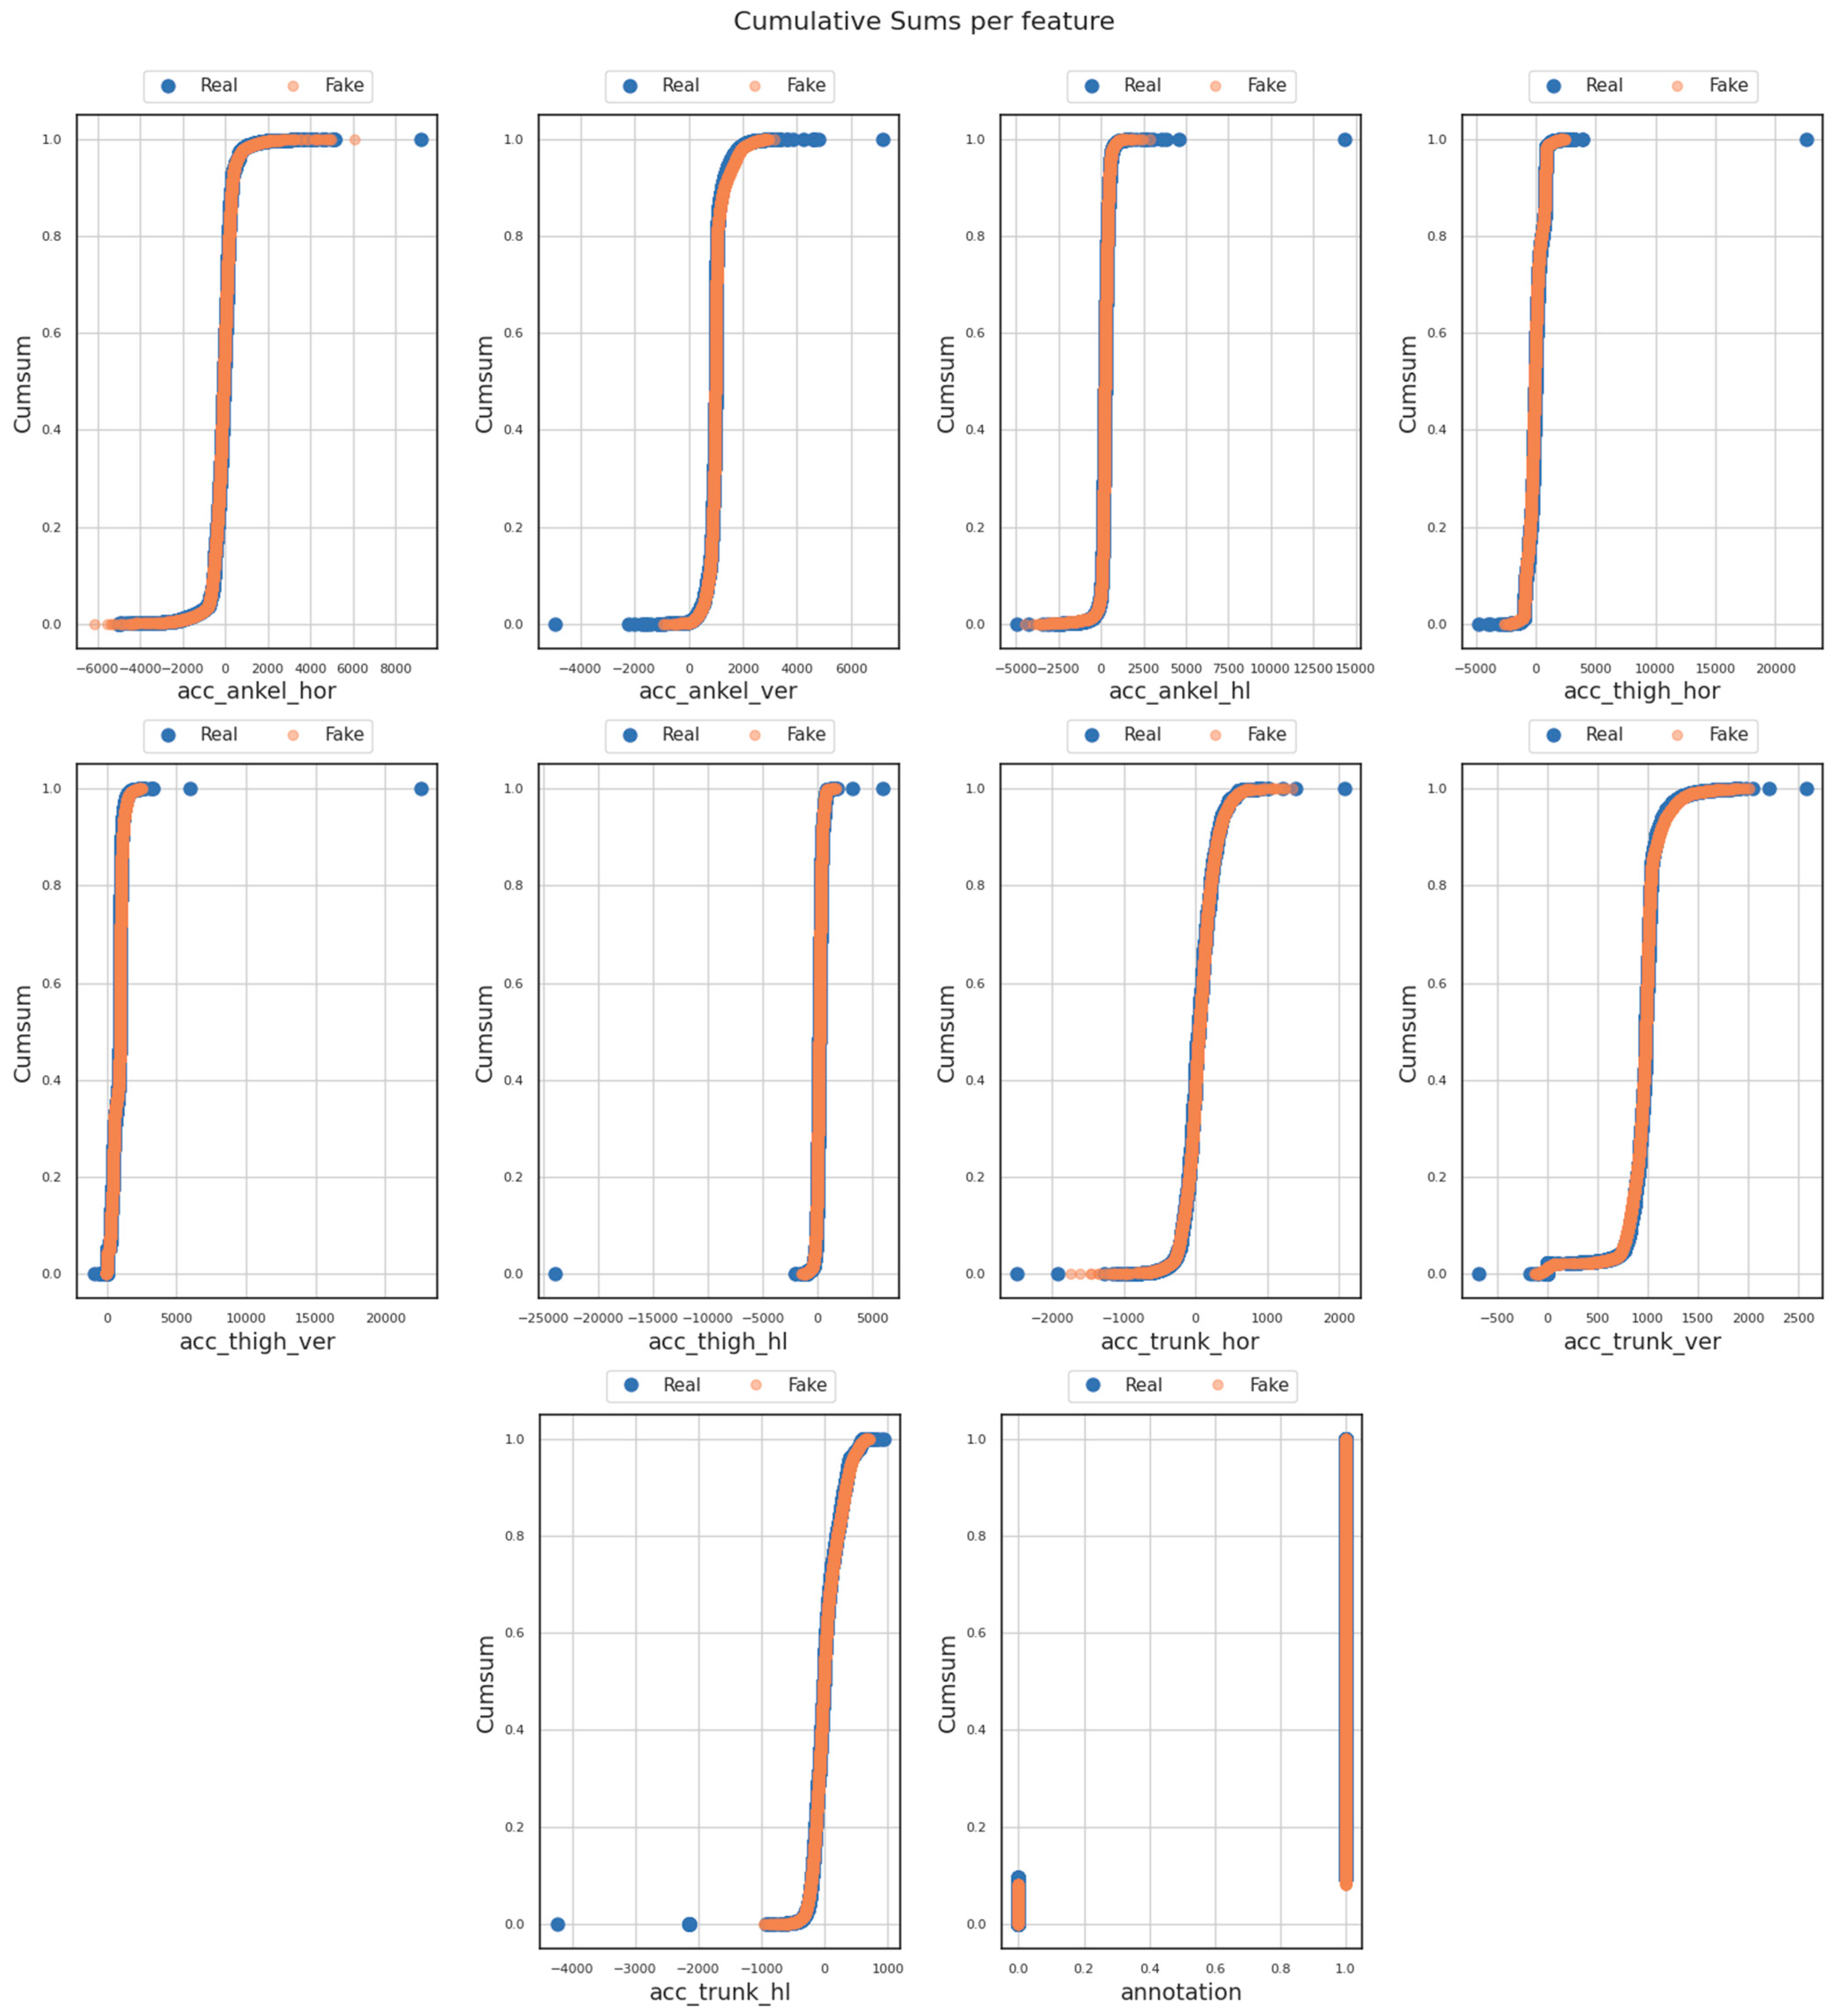
  • Cumulative sum (or cumsum) diagrams provide a visual representation of the cumulative sum for both the real and generated datasets. In the context of assessing similarity scores and comparing datasets using the FoGGAN model, the cumsum diagram offered an effective way to visualize the accumulation of the similarity scores computed between the original and generated datasets gradually.
  • Logarithmic (Log) mean and standard deviation (STD) diagrams usually serve as tools for comparing similarity scores between the original dataset and the one generated by a GAN (the ‘FoGGAN’ in our study). A Log mean diagram provided a visual representation of the average or mean similarity score between the original and generated dataset(s) for each training epoch. This depiction enabled an assessment of how the similarity score evolves over time, revealing whether the generated dataset’s similarity to the real dataset is increasing or decreasing during the training process. Conversely, a standard deviation diagram (STD) illustrated the variability in similarity scores between the real and generated datasets for each training epoch. This visualization assessed the consistency of the similarity score and identifies significant fluctuations in similarity between epochs.
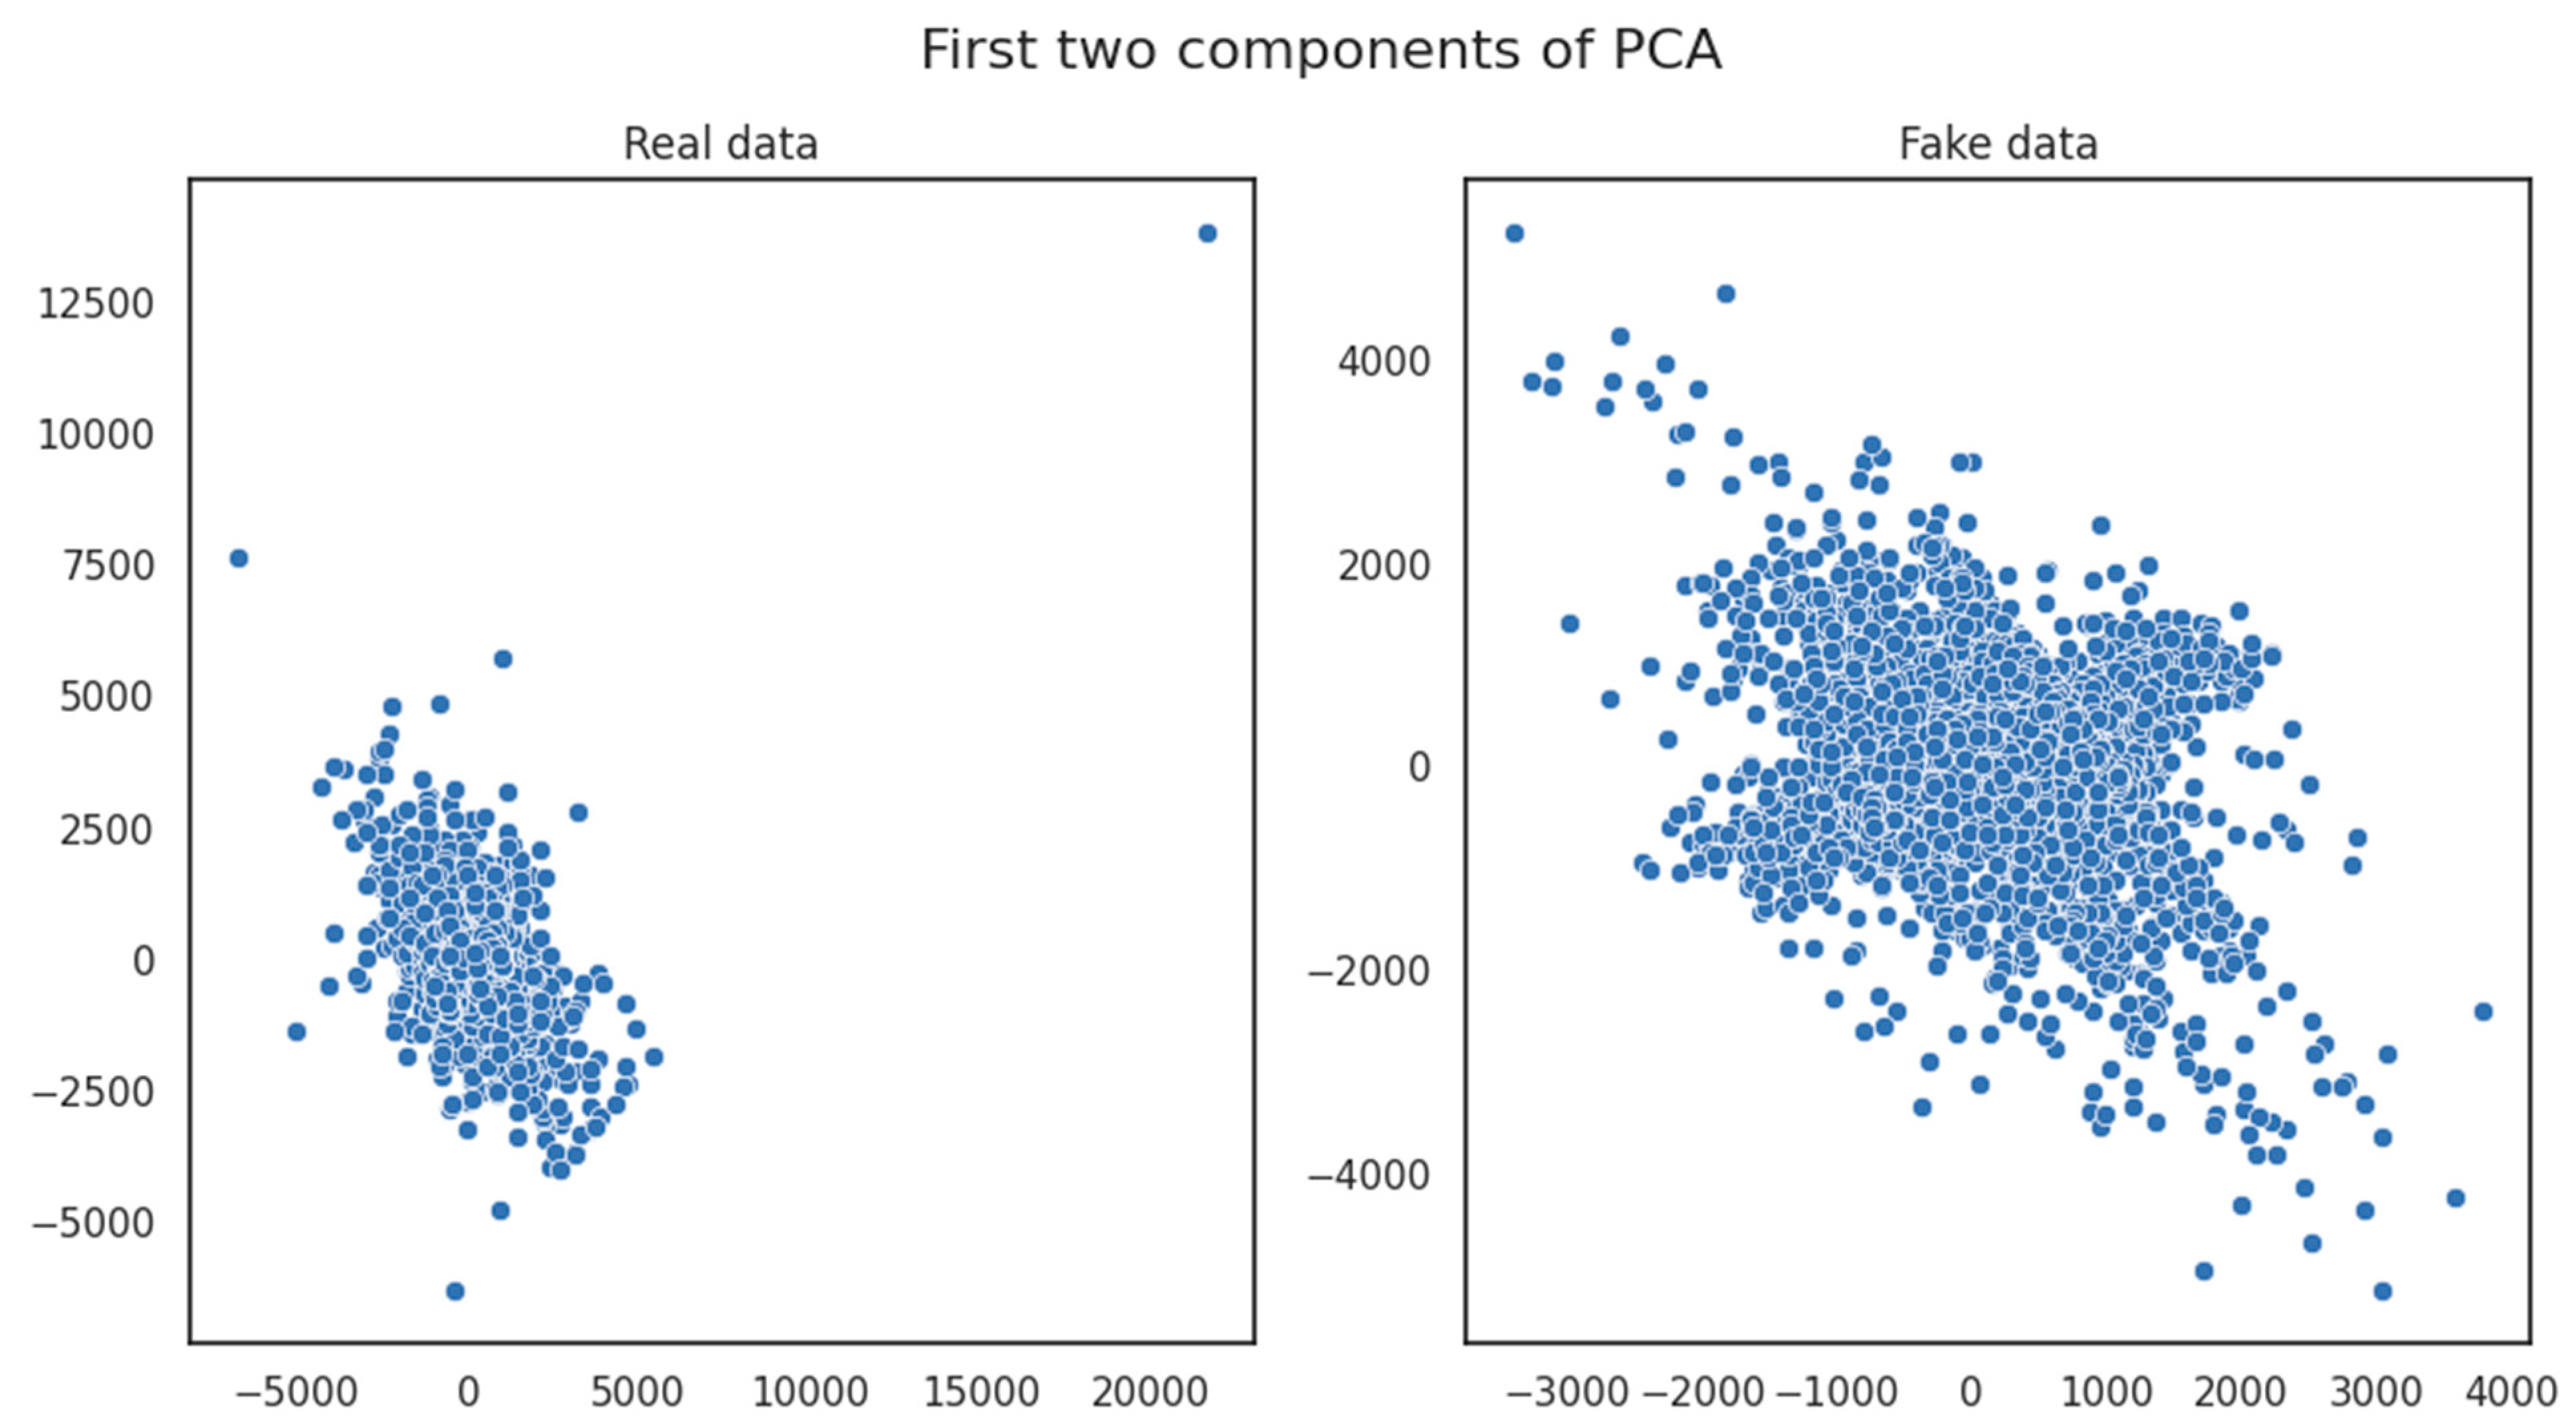
  • Principal Component Analysis (PCA) diagrams are employed as a valuable tool in comparing similarity scores between the original and generated datasets. These diagrams offer a graphical representation of how the under-examination dataset’s dimensions align and diverge. By visualizing the distribution of similarity scores through PCA, it was possible to distinguish patterns and trends in the relationship between the compared datasets, illuminating the evolution of their similarity as the GAN model underwent training.
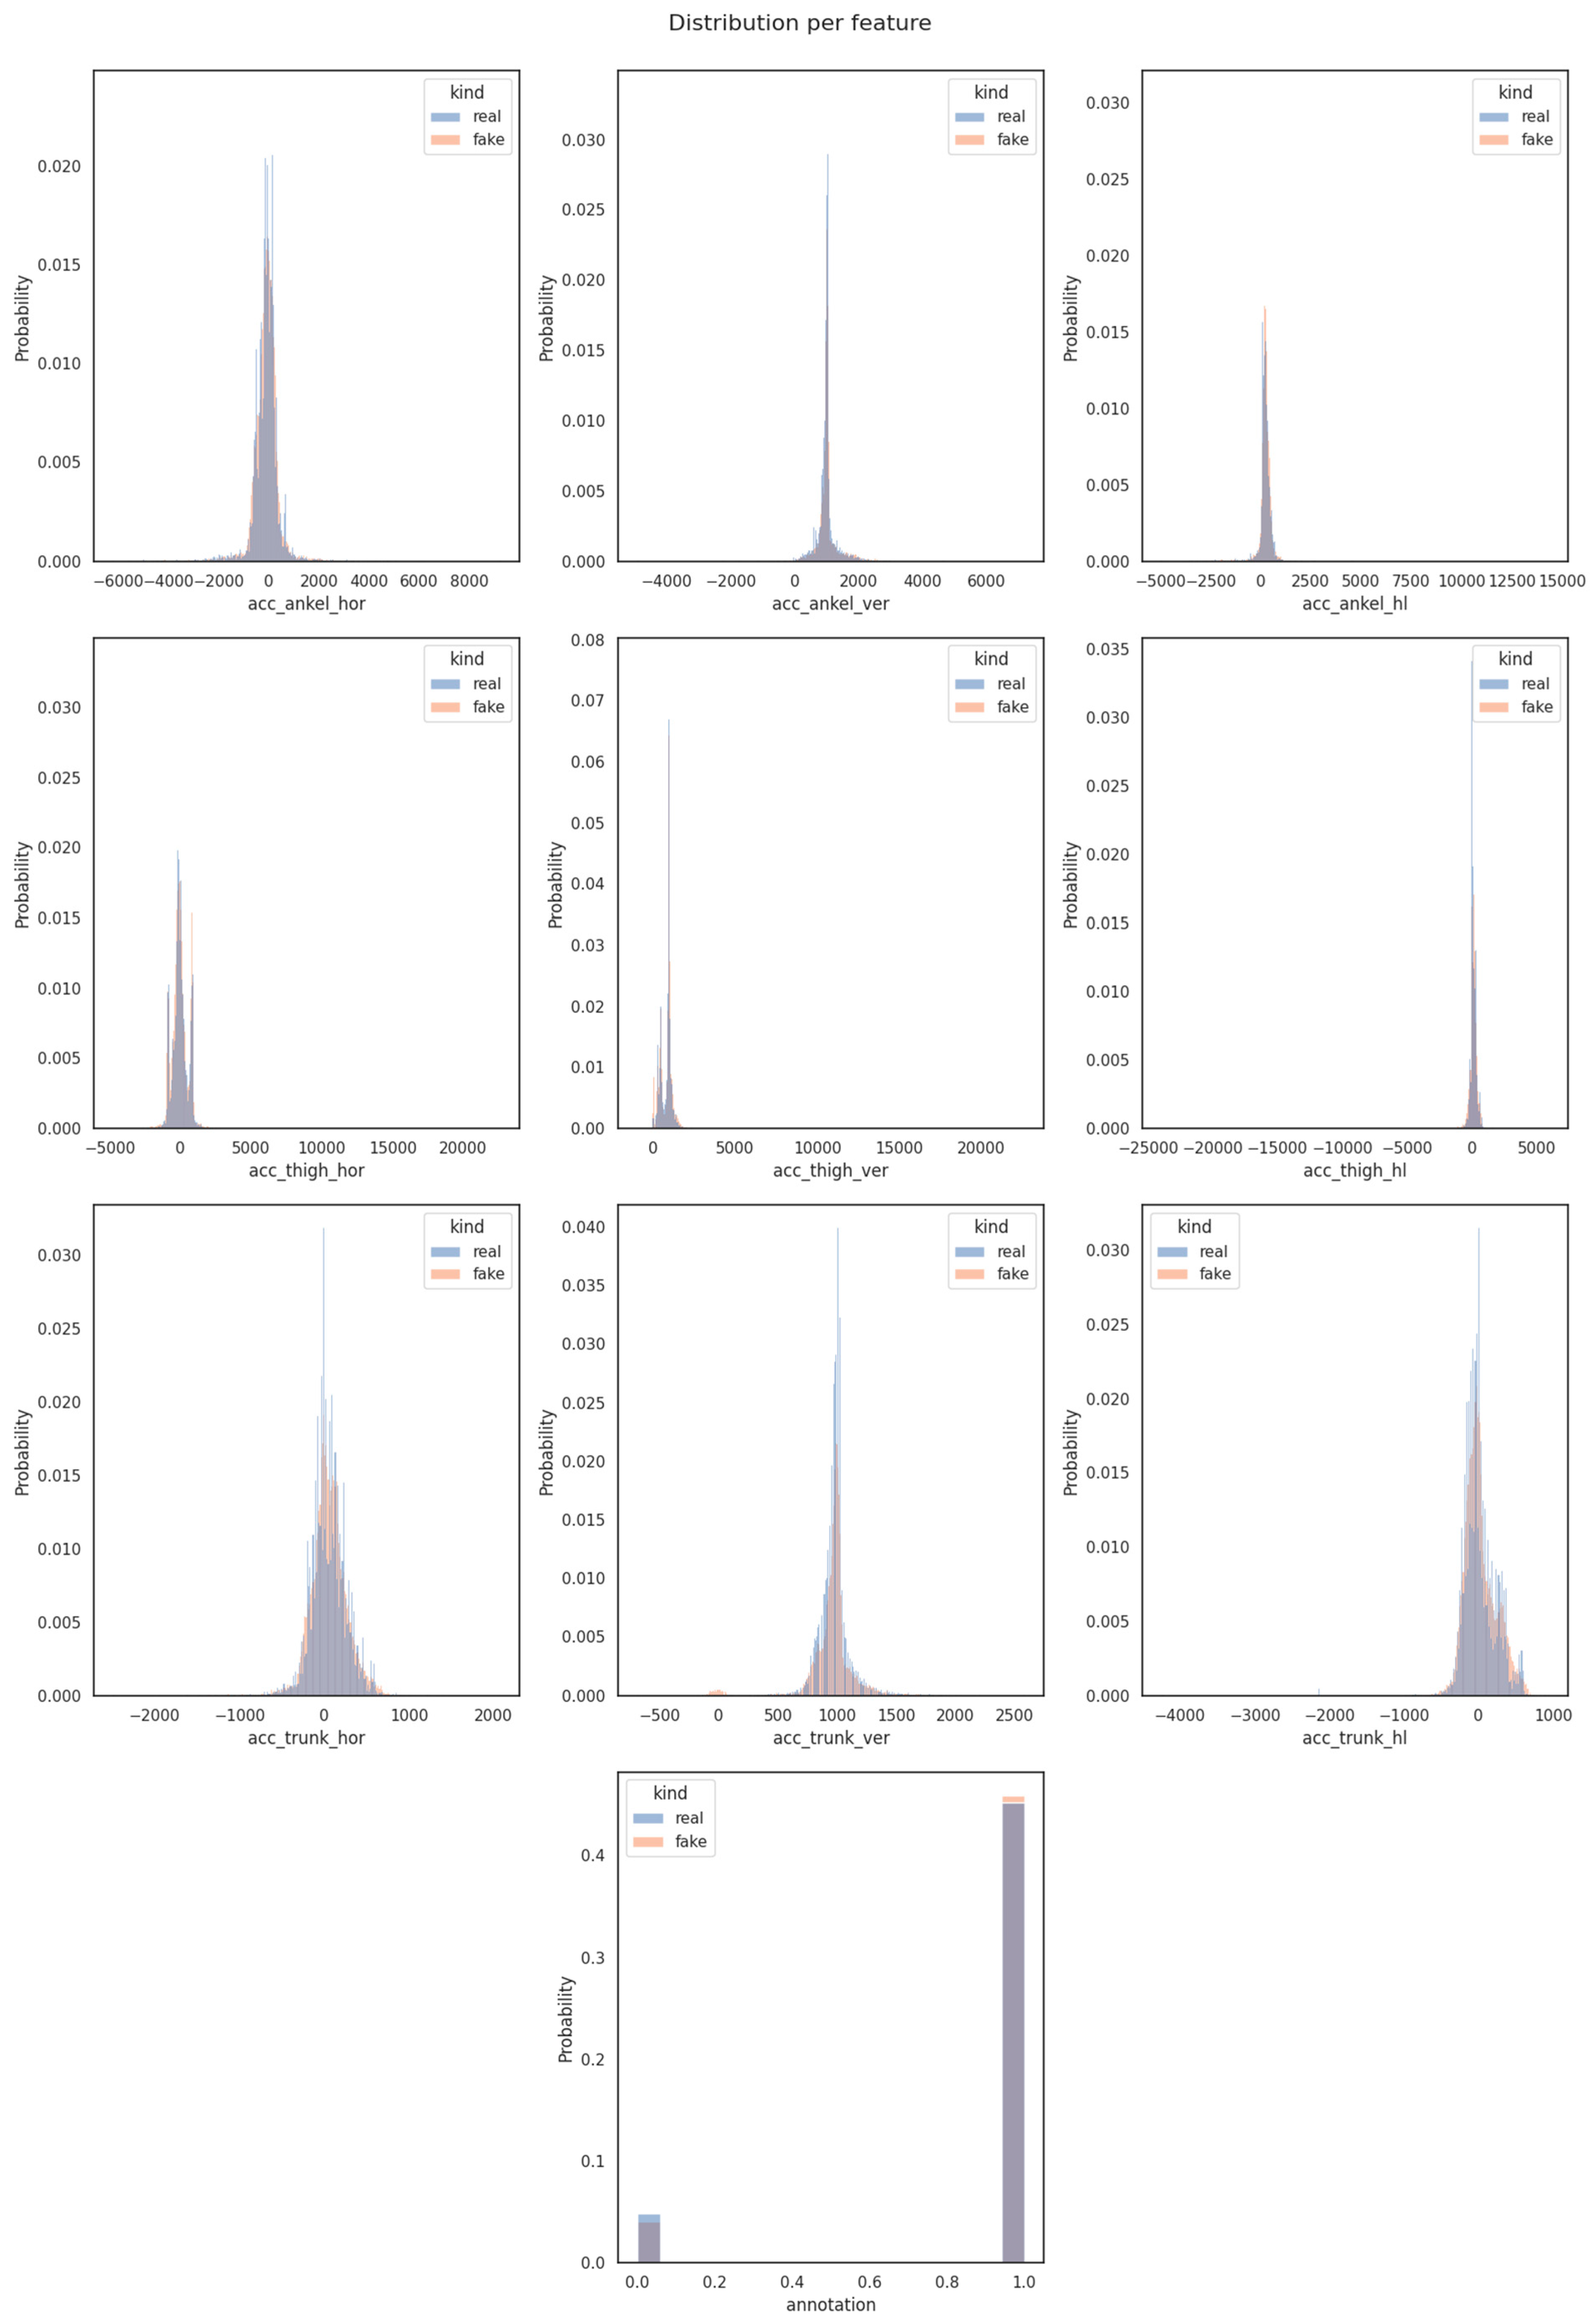
  • Distribution diagrams for individual features are instrumental in comparing similarity scores between the original and generated datasets, on a feature-specific level. These diagrams provided a focused view of how each feature’s distribution evolved over time during the FoGGAN model’s training procedure. By analyzing these distributions separately, we gained insights into the similarity fluctuations for each feature, aiding in a more detailed assessment of the synthetic data generation process.
Through the examination of these diagrams that illustrated and compared both the real and synthetic datasets, it became feasible to gauge the FoGGAN model’s effectiveness in producing synthetic data that closely mirror the attributes, in terms of quality, of the authentic data.
The visual representation of Figure 2 employed correlation matrices with heatmaps that illustrated the differences between various pairs of values between the original (on the left side) and the generated dataset (in the middle), alongside the actual dissimilarities of them (on the right side). After the examination of the correlation matrix, it was revealed that correlation coefficients with magnitudes between 0.16 and 0.3 indicated highly significant correlations between data variables. Conversely, coefficients with magnitudes ranging from 0.1 to 0.15 suggested high correlations, while those falling between 0.01 and 0.1 signified moderate correlations. The analysis presented in Figure 2′s Correlation Matrices highlighted an ordinary high similarity among all potential pairs of compared dataset features.
Figure 2. Correlation matrix for original and generated dataset.
Subsequently, examining the results presented in the (sub)figures included in Figure 3, there was no significant deviation noted between the synthetic and the original dataset for each of the nine (9) features. These findings yielded valuable insights, indicating a consistent and notable level of resemblance regarding trends, patterns, and thresholds during the training process, both within the original and generated data features.
Figure 3. Cumulative sums per feature.
The insights depicted in Figure 4 suggested that data values closely clustered around both the mean and the standard deviation (STD). The proximity of each data point to these statistical reference points appeared minimal. Consequently, the mean absolute and STD distributions showcased in the original and generated datasets (Figure 4) exposed a significant overlap. The detected overlap strongly implied a comparable data spread for each corresponding dataset, further indicating the existence of a high possibility of statistical similarity between the compared datasets.
Figure 4. Absolute log mean and standard deviation.
The insights drawn from Figure 5 emphasized the noteworthy correlation observed within the depicted Principal Component Analysis (PCA) dimensions between variables in the original and generated datasets. This substantial correlation suggested that a limited number of uncorrelated variables were present. This alignment underscored an essential degree of similarity and feature correlation between the two datasets, further reinforcing their close likeness.
Figure 5. Principal Component Analysis for original and generated data.
In Figure 6, we concentrated on the evaluation of pair-wise variable similarity through the application of Distribution Metrics techniques, as previously described. The outcome of this search uncovered a noteworthy observation: the probability distributions for pair-wise variables in both the synthetic and original datasets exhibited a remarkable consistency, occupying the same range. This pronounced convergence underscored a substantial alignment between the synthetic and the original dataset, emphatically reaffirming the fact of the existence of their significant similarity.
Figure 6. Distribution per feature.

4.2. FoG Incidents Classification Using a DNN Classifiier

The primary focus of this study lies in the evaluation of the data generated by the FoGGAN model in the ‘Daphnet’ dataset context, both detailed in Section 3. We gave strong emphasis on assessing how faithfully, in terms of quality, these synthetic data samples replicated the essence of the original dataset.
To further evaluate the effectiveness of the generated samples, we employed a complementary Deep Neural Network (DNN), a commonly used Deep Learning (DL) architecture in the realm of classification, as the additional arbitrator of the data authenticity. The evaluation processes on this task involved the examination of the generated data using the DNN model. The DNN classifier was initially trained with the original dataset, as detailed in Section 3.2. For evaluation purposes, we employed three different scenarios: firstly, the DNN classifier was used to evaluate the accuracy of an unseen (data) sample from the original dataset, subsequently with a mixed dataset containing both original and generated, unseen data samples and finally with the synthetic data generated from the FoGGAN.
It is noteworthy that the DNN model utilized for this study was not optimized in terms of accuracy and loss, as the primary focus lay in assessing the quality of data generated by GANs rather than the performance of the deep learning model itself. Table 4 provides an overview of the parameters employed for the DNN classifier used in this study. The DNN classifier was composed of multiple dense and dropout layers for regularization. It had a total of 3402 trainable parameters and its final output layer consisted of 2 units/classes, making it suitable for binary classification tasks. The parameters finally used for training the DNN model were determined through a systematic tuning process. The selected hyperparameters included a learning rate of 0.001, a batch size of 64, and an epoch value of around 250. These choices aimed to strike a balance between model training speed and stability. It is important to note that in this study, the primary focus was on generating similar-looking datasets using FoGGAN, rather than fine-tuning hyperparameters for the DNN predictive model.
Table 4. DNN classifier parameters.
Table 5 provides a summary of the training and evaluation sample sizes for three distinct datasets employed in this study.
Table 5. Training, evaluation, and total samples of original, generated and mixed dataset.
Table 6 illustrates valuable insights into the model’s performance by demonstrating the accuracy metrics for each of the different datasets (original, mixed, and generated) provided to the DNN during the evaluation phase. This metric provided a comprehensive view of the model’s accuracy during the classification processes with the data instances included within each of the evaluated datasets.
Table 6. Accuracy results.
The extracted results of the freeze of gait (FoG) classification using the Deep Neural Network (DNN) classifier underscored some interesting trends, particularly in addressing data limitations in sensitive medical domains such as Parkinson’s Disease (PD) datasets. Specifically, when evaluating the model’s accuracy across different datasets, it was evident that the classifier achieved a high accuracy rate across the board. First, when evaluated with an unseen sample of data instances from the original dataset, the model achieved an accuracy of 90.29%. This demonstrated the classifier’s ability to effectively generalize to familiar data. Remarkably, when applied to a dataset generated using the FoGGAN, the model’s accuracy further improved to 92.09%. This highlighted the potential of GAN models in enhancing the dataset’s diversity and aiding the classifier in making more accurate predictions on unseen data. Furthermore, evaluating the model with a mixed dataset containing (unseen) data instances from both the original and the generated datasets yielded an accuracy of 90.66%. This result showcased the utility of the FoGGAN in augmenting the original dataset, thereby contributing to the classifier’s overall performance and robustness. The higher accuracy achieved when evaluated on the generated dataset alone highlights that the synthetic data created by the FoGGAN contributed essentially to the classifier’s performance. This is particularly valuable in scenarios where acquiring a large and diverse dataset can be challenging. In summary, the DNN classifier exhibits strong classification performance (even not optimized since the optimal classifier is out of the scope herein), with the highest accuracy achieved when evaluated on the generated dataset. Moreover, the extracted findings underscored the significance of data augmentation techniques like GANs architectures in enhancing the classifier’s accuracy and its potential in real-world applications, such as FoG classification.

4.3. Discussion on the Results

Access to healthcare data is often restricted in order to protect the patient’s privacy, thus hindering the reproducibility of existing results and limiting new research. In order to surpass this problem for robust and efficient AI model development, synthetically generated healthcare data have become one of the major tools [59]. This way, privacy is preserved, and researchers and policymakers are enabled to make decisions and use methods based on realistic data. Further, health data often include information on protected attributes like age, gender, race, etc. For various reasons (i.e., the COVID-19 pandemic has exacerbated health inequities, with certain subgroups experiencing poorer outcomes and less access to healthcare), imbalanced and/or biased data are the issues that need to be handled appropriately. Synthetic data generation is again a means to overcome those issues that otherwise lead to biased, untrusted, and irresponsible AI. Taking under consideration all the above, the FoGGAN architecture presented and the supporting evaluation results on the basis of the synthetic generated data both in terms of their similarity to the real data and on the performance of a classifier we are able to support our claim that the proposed data generation approach is appropriate and suitable for use in order to surpass the aforementioned health data limitations, and privacy and ethical issues.
The current research focuses on leveraging Generative Adversarial Models (GANs), specifically FOGGAN as introduced, to address data scarcity challenges in the healthcare domain, including the freezing of gait (FoG) dataset related to Parkinson’s Disease (PD), offering promising insights. Nonetheless, it is essential to acknowledge several limitations inherent to our study:
  • Data Source Availability: The availability of high-quality, annotated FoG datasets remains a challenge. Gathering and labeling datasets, especially for rare medical conditions like FoG, is time-consuming and resource-intensive. This limitation hinders the scalability and widespread applicability of our approach.
  • Clinical Validation: While promising, the high-accuracy results obtained using the FoGGAN-generated data for classification purposes need further clinical validation. Real-world clinical trials and expert assessments are necessary to validate the clinical utility of the synthetic data.
  • Data Generalization: The effectiveness of the FoGGAN architecture in generating synthetic data relies on the quality and representativeness of the input dataset. If the initial dataset has limitations or biases, these may also be reflected in the generated data. Careful curation of the input dataset is necessary to mitigate this issue.
The current study acknowledges these limitations as part of our commitment to transparency and responsible research. Addressing these challenges is crucial for the continued development and deployment of GAN-based data augmentation solutions into the healthcare domain, ultimately contributing to optimized and improved patient care and medical research.

5. Conclusions

The main goal of this study was to present a GAN architecture for generating almost identical medical data for PD and specifically for FoG cases. The data which were used as input for the GAN deployed in this study were from the ‘data_daphnet_combined’ dataset. Based on this kind of data input, specifically in the tabular data format, the FoGGAN architecture has been shown to be able to generate almost identical data to the real dataset as indicated by the metrics presented in Section 4.1.
To assess the added value of the proposed data generation process using the FoGGAN model, we trained a Deep Neural Network (DNN) classifier using the original dataset as detailed in Section 3.1 and evaluated it, using various testing (evaluation) inputs. The outcomes, encompassing the accuracy metric, revealed that the DNN classifier’s performance consistently maintained its high accuracy in evaluating the provided, generated data, despite the diverse datasets provided (both the mixed and the evaluated). This is another crucial supportive indication that the generated synthetic data hold the same properties as the real ones. As observed, the analysis detailed in Section 4 revealed intriguing insights following the performance of the DNN classifier when evaluated with different datasets. The model showcased praiseworthy accuracy when tested with the original dataset. Furthermore, the evaluation of the model on the mixed dataset resulted in a strong accuracy rate as well, whereas a slight boost in accuracy was observed when the generated dataset was applied and evaluated. These findings are of practical significance, particularly in scenarios where acquiring extensive and diverse datasets poses challenges. Leveraging GAN architectures for data augmentation emerges as a promising strategy to address data limitations and enhance model performance in real-world applications.
The FoGGAN architecture presented in this work can be used as a very useful tool for data augmentation in the context of PD in many ways apart from the type of data showcased, i.e., FoG-related. It can be used in PD research but not only there, since the issue of data shortage is apparent in most neurodegenerative diseases (e.g., multiple sclerosis, and dementia), where FoGGAN can play a significant and multifaced role in terms of data augmentation. The most obvious one is the creation of additional data with the same statistical properties, inherent information, and predictive power as the data fed into the FoGGAN as we already presented. Another perspective is focused data augmentation for data that are underrepresented in the original/real dataset. For example, considering a bias in data due to the participants’ age, where the age group of 40–45 years old is small compared to older people, one can create additional data for that age group (same for sex, economic status, race, etc.). Thus, FoGGAN can also be considered a bias mitigation method. Further, in the same way, unbalanced datasets can be balanced, boosting the robustness and generalization of the classification or prediction model to be developed.
The future direction that this study aims to follow is to explore and evaluate different GAN architectures in order to conclude if the quality of the generated data is sufficient. The different GAN architectures that are planned to be studied in the future are the hybrid models which engage autoencoders and GANs. Moreover, future studies can also examine the impact of hyperparameters of a GAN model on the generated data. Another future prospect of the current study is to expand the data input to also include other medical data such as data from different symptoms or different diseases or even different data formats like images or videos. In this way, there will be a generalization of the capabilities of the presented GAN architectures in different health applications or other domains as well as of the data formats that will be used as inputs. Following the paradigm of the constant learning and data expansion, and based on the GAN solution proposed in this study, future research can also include lifelong learning techniques. In this way, there will be a continuous update process of the generated datasets leading to an adaptable and expandable solution about the data scarcity issue that is present in many domains including medical science domains.

Author Contributions

Conceptualization, N.P., P.T., E.D. and E.A.; methodology, N.P., T.A. and E.D.; software, N.P.; validation, N.P., P.T., E.D., T.A., E.A. and K.D.; formal analysis, N.P., E.D., T.A. and N.P.; investigation, N.P., P.T., E.D. and T.A.; resources, P.T., E.D., T.A. and N.P.; data curation, N.P., P.T. and T.A.; writing—original draft preparation, E.D., T.A., N.P. and E.A.; writing—review and editing, E.D., E.A., T.A., N.P. and K.D.; visualization, N.P., E.D. and T.A.; supervision, P.T., E.A. and K.D. All authors have read and agreed to the published version of the manuscript.

Funding

This research was funded by the European Union through the Horizon 2020 Research and Innovation Programme, in the context of the ALAMEDA (Bridging the Early Diagnosis and Treatment Gap of Brain Diseases via Smart, Connected, Proactive and Evidence-based Technological Interventions) project under grant agreement No. GA 101017558.

Institutional Review Board Statement

Not applicable.

Data Availability Statement

The data presented in this study are available on request from the corresponding author.

Conflicts of Interest

The authors declare no conflict of interest.

References

  1. World Health Organization (WHO). Parkinson Disease. Available online: https://www.who.int/news-room/fact-sheets/detail/parkinson-disease (accessed on 16 May 2023).
  2. Kalia, L.V.; Lang, A.E. Parkinson’s Disease. Lancet 2015, 386, 896–912. [Google Scholar] [CrossRef]
  3. NINDS. Parkinson’s Disease Information Page. Available online: https://www.ninds.nih.gov/health-information/disorders/parkinsons-disease (accessed on 1 September 2023).
  4. Sveinbjornsdottir, S. The Clinical Symptoms of Parkinson’s Disease. J. Neurochem. 2016, 139, 318–324. [Google Scholar] [CrossRef]
  5. Giladi, N.; Kao, R.; Fahn, S. Freezing phenomenon in patients with parkinsonian syndromes. Mov. Disord. 1997, 12, 302–305. [Google Scholar] [CrossRef]
  6. Gao, C.; Liu, J.; Tan, Y.; Chen, S. Freezing of gait in Parkinson’s disease: Pathophysiology, risk factors and treatments. Transl. Neurodegener. 2020, 9, 12. [Google Scholar] [CrossRef]
  7. Schaafsma, J.D.; Balash, Y.; Gurevich, T.; Bartels, A.L.; Hausdorff, J.M.; Giladi, N. Characterization of freezing of gait subtypes and the response of each to levodopa in Parkinson’s disease. Eur. J. Neurol. 2003, 10, 391–398. [Google Scholar] [CrossRef]
  8. Parkinson’s Foundation Prevalence & Incidence. Available online: https://www.parkinson.org/understanding-parkinsons/statistics/prevalence-incidence (accessed on 16 May 2023).
  9. Parkinson’s Europe about Parkinson’s. Available online: https://www.parkinsonseurope.org/about-parkinsons/what-is-parkinsons/ (accessed on 19 May 2023).
  10. Goodfellow, I.J.; Pouget-Abadie, J.; Mirza, M.; Xu, B.; Warde-Farley, D.; Ozair, S.; Courville, A.; Bengio, Y. Generative Adversarial Networks. arXiv 2014, arXiv:1406.2661. [Google Scholar] [CrossRef]
  11. Hargreaves, C.; Eunice, H. Simulation of Synthetic Diabetes Tabular Data Using Generative Adversarial Networks. Clin. Med. J. 2021, 7, 49–59. [Google Scholar]
  12. Choi, E.; Biswal, S.; Malin, B.; Duke, J.; Stewart, W.; Sun, J. Generating Multi-Label Discrete Patient Records Using Generative Adversarial Networks. arXiv 2017, arXiv:1703.06490. [Google Scholar]
  13. Baowaly, M.K.; Lin, C.-C.; Liu, C.-L.; Chen, K.-T. Synthesizing Electronic Health Records Using Improved Generative Adversarial Networks. J. Am. Med. Inform. Assoc. 2019, 26, 228–241. [Google Scholar] [CrossRef]
  14. Gulrajani, I.; Ahmed, F.; Arjovsky, M.; Dumoulin, V.; Courville, A. Improved Training of Wasserstein GANs. In Proceedings of the 31st International Conference on Neural Information Processing Systems, Long Beach, CA, USA, 4–9 December 2017; Curran Associates Inc.: Red Hook, NY, USA, 2017; pp. 5769–5779. [Google Scholar]
  15. Hjelm, R.D.; Jacob, A.P.; Che, T.; Trischler, A.; Cho, K.; Bengio, Y. Boundary-Seeking Generative Adversarial Networks. arXiv 2018, arXiv:1702.08431. [Google Scholar]
  16. Johnson, A.E.W.; Pollard, T.J.; Shen, L.; Lehman, L.H.; Feng, M.; Ghassemi, M.; Moody, B.; Szolovits, P.; Anthony Celi, L.; Mark, R.G. MIMIC-III, a Freely Accessible Critical Care Database. Sci. Data 2016, 3, 160035. [Google Scholar] [CrossRef]
  17. Bureau of National Health Insurance. Department of Health National Health Insurance Research Database. Available online: http://nhird.nhri.org.tw/en/index.htm (accessed on 1 September 2023).
  18. Yang, F.; Yu, Z.; Liang, Y.; Gan, X.; Lin, K.; Zou, Q.; Zeng, Y. Grouped Correlational Generative Adversarial Networks for Discrete Electronic Health Records. In Proceedings of the 2019 IEEE International Conference on Bioinformatics and Biomedicine (BIBM), San Diego, CA, USA, 18–21 November 2019; pp. 906–913. [Google Scholar]
  19. Arjovsky, M.; Chintala, S.; Bottou, L. Wasserstein Generative Adversarial Networks. In Proceedings of the 34th International Conference on Machine Learning, PMLR, Sydney, Australia, 6–11 August 2017; pp. 214–223. [Google Scholar]
  20. Che, Z.; Cheng, Y.; Zhai, S.; Sun, Z.; Liu, Y. Boosting Deep Learning Risk Prediction with Generative Adversarial Networks for Electronic Health Records. In Proceedings of the 2017 IEEE International Conference on Data Mining (ICDM), New Orleans, LA, USA, 18–21 November 2017; pp. 787–792. [Google Scholar]
  21. Patel, S.; Kakadiya, A.; Mehta, M.; Derasari, R.; Patel, R.; Gandhi, R. Correlated Discrete Data Generation Using Adversarial Training 2018. arXiv 2018, arXiv:1804.00925. [Google Scholar]
  22. Yoon, J.; Drumright, L.N.; van der Schaar, M. Anonymization Through Data Synthesis Using Generative Adversarial Networks (ADS-GAN). IEEE J. Biomed. Health Inform. 2020, 24, 2378–2388. [Google Scholar] [CrossRef] [PubMed]
  23. Jordon, J.; Yoon, J.; Schaar, M.v.d. PATE-GAN: Generating Synthetic Data with Differential Privacy Guarantees. In Proceedings of the Seventh International Conference on Learning Representations, New Orleans, LA, USA, 6–9 May 2019. [Google Scholar]
  24. Xie, L.; Lin, K.; Wang, S.; Wang, F.; Zhou, J. Differentially Private Generative Adversarial Network. arXiv 2018, arXiv:1802.06739. [Google Scholar]
  25. Wang, L.; Zhang, W.; He, X. Continuous Patient-Centric Sequence Generation via Sequentially Coupled Adversarial Learning. In Proceedings of the Database Systems for Advanced Applications: 24th International Conference, DASFAA 2019, Chiang Mai, Thailand, 22–25 April 2019; Proceedings, Part II. Springer: Berlin/Heidelberg, Germany, 2019; pp. 36–52. [Google Scholar]
  26. Yu, L.; Zhang, W.; Wang, J.; Yu, Y. SeqGAN: Sequence Generative Adversarial Nets with Policy Gradient. In Proceedings of the AAAI Conference on Artificial Intelligence, San Francisco, CA, USA, 4–9 February 2017; Volume 31. [Google Scholar] [CrossRef]
  27. Mogren, O. C-RNN-GAN: Continuous Recurrent Neural Networks with Adversarial Training 2016. arXiv 2016, arXiv:1611.09904. [Google Scholar]
  28. Beaulieu-Jones, B.K.; Wu, Z.S.; Williams, C.; Lee, R.; Bhavnani, S.P.; Byrd, J.B.; Greene, C.S. Privacy-Preserving Generative Deep Neural Networks Support Clinical Data Sharing. Circ. Cardiovasc. Qual. Outcomes 2019, 12, e005122. [Google Scholar] [CrossRef] [PubMed]
  29. Esteban, C.; Hyland, S.; Rätsch, G. Real-Valued (Medical) Time Series Generation with Recurrent Conditional GANs. arXiv 2017, arXiv:1706.08633. [Google Scholar]
  30. Kiyasseh, D.; Tadesse, G.A.; Nhan, L.N.T.; Van Tan, L.; Thwaites, L.; Zhu, T.; Clifton, D. PlethAugment: GAN-Based PPG Augmentation for Medical Diagnosis in Low-Resource Settings. IEEE J. Biomed. Health Inform. 2020, 24, 3226–3235. [Google Scholar] [CrossRef]
  31. DeVries, T.; Romero, A.; Pineda, L.; Taylor, G.W.; Drozdzal, M. On the Evaluation of Conditional GANs. arXiv 2019, arXiv:1907.08175. [Google Scholar]
  32. Brophy, E. Synthesis of Dependent Multichannel ECG Using Generative Adversarial Networks. In Proceedings of the 29th ACM International Conference on Information & Knowledge Management, Virtual Event, 19–23 October 2020; Association for Computing Machinery: New York, NY, USA, 2020; pp. 3229–3232. [Google Scholar]
  33. Hazra, D.; Byun, Y.-C. SynSigGAN: Generative Adversarial Networks for Synthetic Biomedical Signal Generation. Biology 2020, 9, 441. [Google Scholar] [CrossRef]
  34. Chen, H.; Liu, H.; Chu, X.; Liu, Q.; Xue, D. Anomaly Detection and Critical SCADA Parameters Identification for Wind Turbines Based on LSTM-AE Neural Network. Renew. Energy 2021, 172, 829–840. [Google Scholar] [CrossRef]
  35. Nguyen, T.-S.; Nguyen, L.-M.; Tojo, S.; Satoh, K.; Shimazu, A. Recurrent Neural Network-Based Models for Recognizing Requisite and Effectuation Parts in Legal Texts. Artif. Intell. Law 2018, 26, 169–199. [Google Scholar] [CrossRef]
  36. Zhu, F.; Ye, F.; Fu, Y.; Liu, Q.; Shen, B. Electrocardiogram Generation with a Bidirectional LSTM-CNN Generative Adversarial Network. Sci. Rep. 2019, 9, 6734. [Google Scholar] [CrossRef] [PubMed]
  37. Torfi, A.; Fox, E.A.; Reddy, C.K. Differentially Private Synthetic Medical Data Generation Using Convolutional GANs. Inf. Sci. 2022, 586, 485–500. [Google Scholar] [CrossRef]
  38. Park, N.; Mohammadi, M.; Gorde, K.; Jajodia, S.; Park, H.; Kim, Y. Data Synthesis Based on Generative Adversarial Networks. Proc. VLDB Endow. 2018, 11, 1071–1083. [Google Scholar] [CrossRef]
  39. Chin-Cheong, K.; Sutter, T.; Vogt, J.E. Generation of Heterogeneous Synthetic Electronic Health Records Using GANs. In Proceedings of the 33rd Conference on Neural Information Processing Systems (NeurIPS 2019), Vancouver, BC, Canada, 8–14 December 2019. [Google Scholar] [CrossRef]
  40. Kaur, S.; Aggarwal, H.; Rani, R. Data Augmentation Using GAN for Parkinson’s Disease Prediction. In Proceedings of the Recent Innovations in Computing; Singh, P.K., Singh, Y., Kolekar, M.H., Kar, A.K., Chhabra, J.K., Sen, A., Eds.; Springer: Singapore, 2021; pp. 589–597. [Google Scholar]
  41. Xu, Z.-J.; Wang, R.-F.; Wang, J.; Yu, D.-H. Parkinson’s Disease Detection Based on Spectrogram-Deep Convolutional Generative Adversarial Network Sample Augmentation. IEEE Access 2020, 8, 206888–206900. [Google Scholar] [CrossRef]
  42. He, K.; Zhang, X.; Ren, S.; Sun, J. Deep Residual Learning for Image Recognition. arXiv 2015, arXiv:1512.03385. [Google Scholar]
  43. Noella, R.S.N.; Priyadarshini, J. Diagnosis of Alzheimer’s, Parkinson’s Disease and Frontotemporal Dementia Using a Generative Adversarial Deep Convolutional Neural Network. Neural Comput. Appl. 2023, 35, 2845–2854. [Google Scholar] [CrossRef]
  44. Anicet Zanini, R.; Luna Colombini, E. Parkinson’s Disease EMG Data Augmentation and Simulation with DCGANs and Style Transfer. Sensors 2020, 20, 2605. [Google Scholar] [CrossRef]
  45. Kaur, S.; Aggarwal, H.; Rani, R. Diagnosis of Parkinson’s Disease Using Deep CNN with Transfer Learning and Data Augmentation. Multimed. Tools Appl. 2021, 80, 10113–10139. [Google Scholar] [CrossRef]
  46. Thomas, M.; Lenka, A.; Kumar Pal, P. Handwriting Analysis in Parkinson’s Disease: Current Status and Future Directions. Mov. Disord. Clin. Pract. 2017, 4, 806–818. [Google Scholar] [CrossRef]
  47. Dzotsenidze, E.; Valla, E.; Nõmm, S.; Medijainen, K.; Taba, P.; Toomela, A. Generative Adversarial Networks as a Data Augmentation Tool for CNN-Based Parkinson’s Disease Diagnostics. IFAC-PapersOnLine 2022, 55, 108–113. [Google Scholar] [CrossRef]
  48. Sauer, A.; Chitta, K.; Müller, J.; Geiger, A. Projected GANs Converge Faster. In Proceedings of the Advances in Neural Information Processing Systems; Ranzato, M., Beygelzimer, A., Dauphin, Y., Liang, P.S., Vaughan, J.W., Eds.; Curran Associates, Inc.: Red Hook, NY, USA, 2021; Volume 34, pp. 17480–17492. [Google Scholar]
  49. Wang, W. Evolution of StyleGAN3. In Proceedings of the 2022 International Conference on Electronics and Devices, Computational Science (ICEDCS), Marseille, France, 20–22 September 2022; pp. 5–13. [Google Scholar]
  50. Woodland, M.; Wood, J.; Anderson, B.M.; Kundu, S.; Lin, E.; Koay, E.; Odisio, B.; Chung, C.; Kang, H.C.; Venkatesan, A.M.; et al. Evaluating the Performance of StyleGAN2-ADA on Medical Images. In Proceedings of the Simulation and Synthesis in Medical Imaging; Zhao, C., Svoboda, D., Wolterink, J.M., Escobar, M., Eds.; Springer International Publishing: Cham, Switzerland, 2022; pp. 142–153. [Google Scholar]
  51. Tseng, H.-Y.; Jiang, L.; Liu, C.; Yang, M.-H.; Yang, W. Regularizing Generative Adversarial Networks under Limited Data. arXiv 2021, arXiv:2104.03310. [Google Scholar]
  52. Ramesh, V.; Bilal, E. Detecting Motor Symptom Fluctuations in Parkinson’s Disease with Generative Adversarial Networks. npj Digit. Med. 2022, 5, 138. [Google Scholar] [CrossRef] [PubMed]
  53. Bhidayasiri, R.; Tarsy, D. Movement Disorders: A Video Atlas; Humana Press: Totowa, NJ, USA, 2012; pp. 4–5. ISBN 978-1-60327-425-8. [Google Scholar]
  54. Yu, S.; Chai, Y.; Samtani, S.; Liu, H. Motion Sensor-Based Fall Prevention for Senior Care: A Hidden Markov Model with Generative Adversarial Network (HMM-GAN) Approach. Inf. Syst. Res. 2023, 1203. [Google Scholar] [CrossRef]
  55. Rabiner, L.; Juang, B. An Introduction to Hidden Markov Models. IEEE ASSP Mag. 1986, 3, 4–16. [Google Scholar] [CrossRef]
  56. Gupta, V. Data_Daphnet_Combined. Available online: https://www.kaggle.com/datasets/vguptanitj/data-daphnet-combined?resource=download (accessed on 15 May 2023).
  57. Bächlin, M.; Plotnik, M.; Roggen, D.; Maidan, I.; Hausdorff, J.M.; Giladi, N.; Tröster, G. Wearable Assistant for Parkinson’s Disease Patients with the Freezing of Gait Symptom. Trans. Info. Technol. Biomed. 2010, 14, 436–446. [Google Scholar] [CrossRef]
  58. Abadi, M.; Agarwal, A.; Barham, P.; Brevdo, E.; Chen, Z.; Citro, C.; Corrado, G.S.; Davis, A.; Dean, J.; Devin, M.; et al. TensorFlow: Large-Scale Machine Learning on Heterogeneous Systems. arXiv 2015, arXiv:1603.04467. [Google Scholar]
  59. Bhanot, K.; Qi, M.; Erickson, J.S.; Guyon, I.; Bennett, K.P. The Problem of Fairness in Synthetic Healthcare Data. Entropy 2021, 23, 1165. [Google Scholar] [CrossRef]
Disclaimer/Publisher’s Note: The statements, opinions and data contained in all publications are solely those of the individual author(s) and contributor(s) and not of MDPI and/or the editor(s). MDPI and/or the editor(s) disclaim responsibility for any injury to people or property resulting from any ideas, methods, instructions or products referred to in the content.

Article Metrics

Citations

Article Access Statistics

Multiple requests from the same IP address are counted as one view.