
Best Practices for Body Temperature Measurement with Infrared Thermography: External Factors Affecting Accuracy


Abstract
:1. Introduction
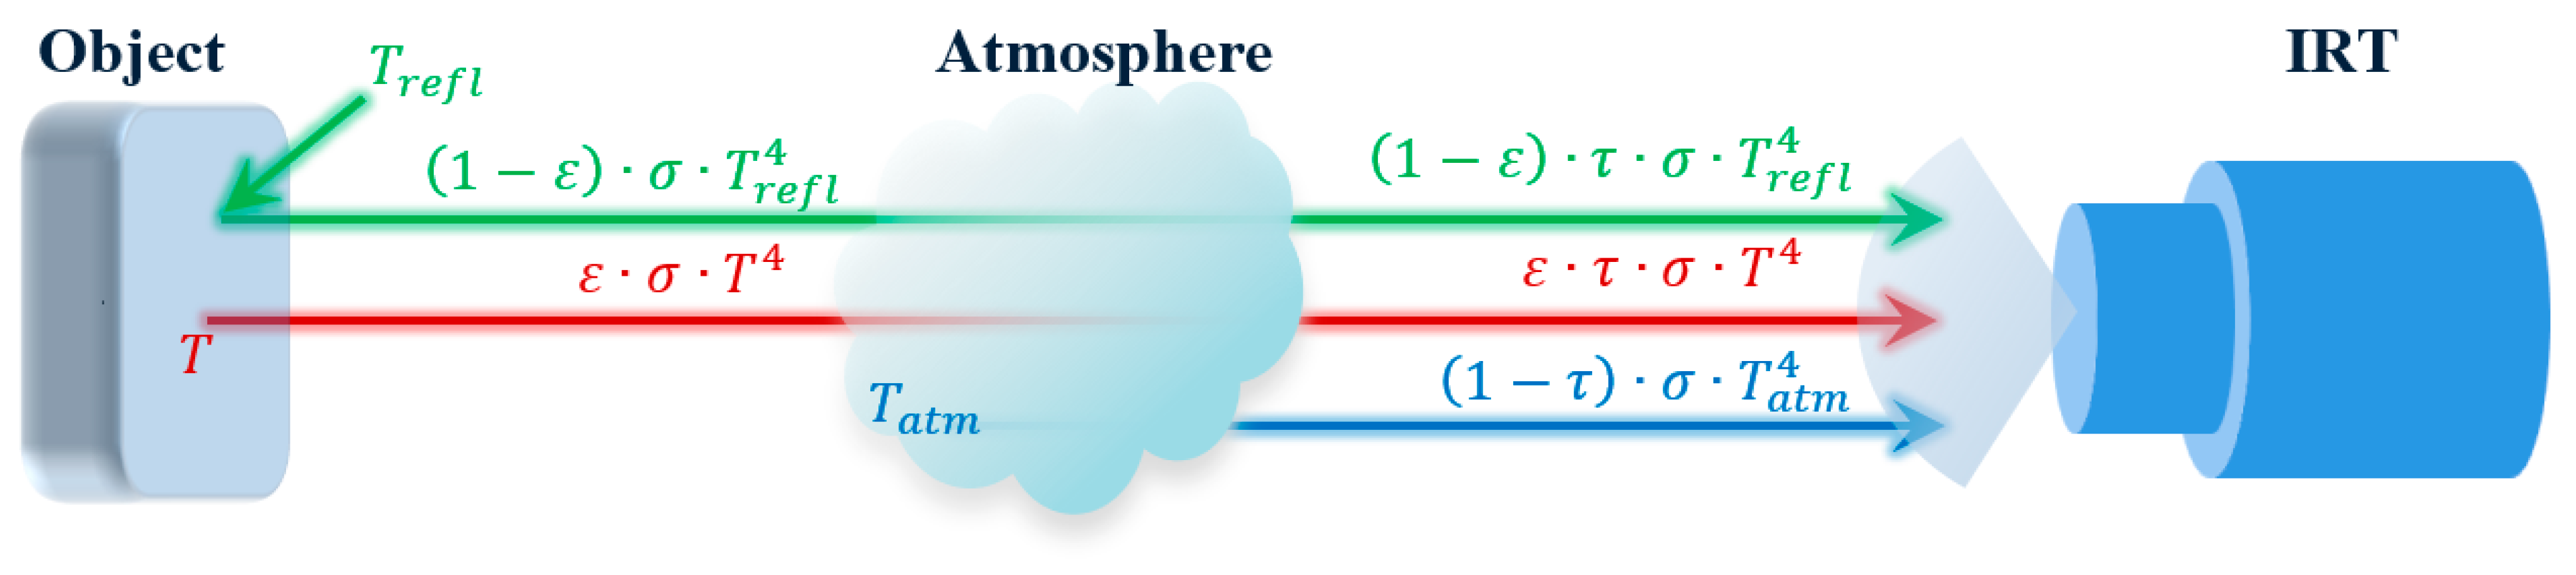
2. IRT Theory
3. Methodology
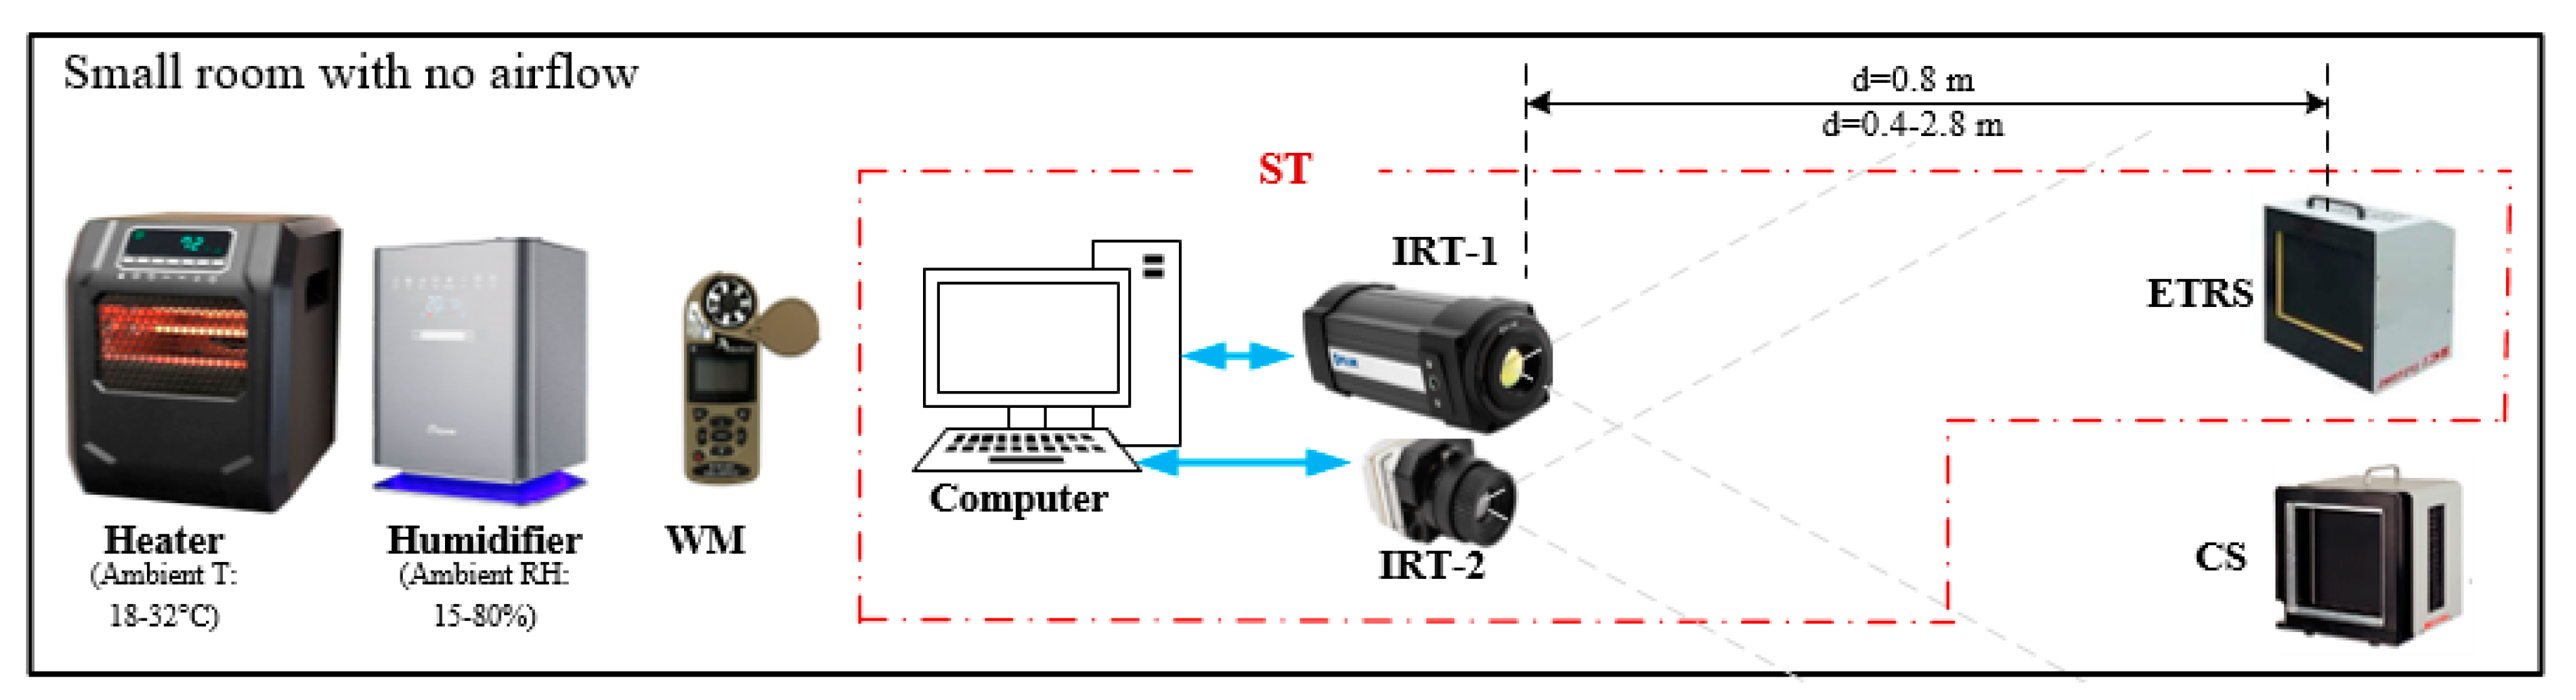
3.1. Experimental Setup and Test Method
3.2. Effect of ETRS Set Temperature
3.3. Effect of Viewing Angle
3.4. Effect of Environmental Factors (Ambient Temperature, RH) and Working Distance
3.5. Computer Simulations
4. Results
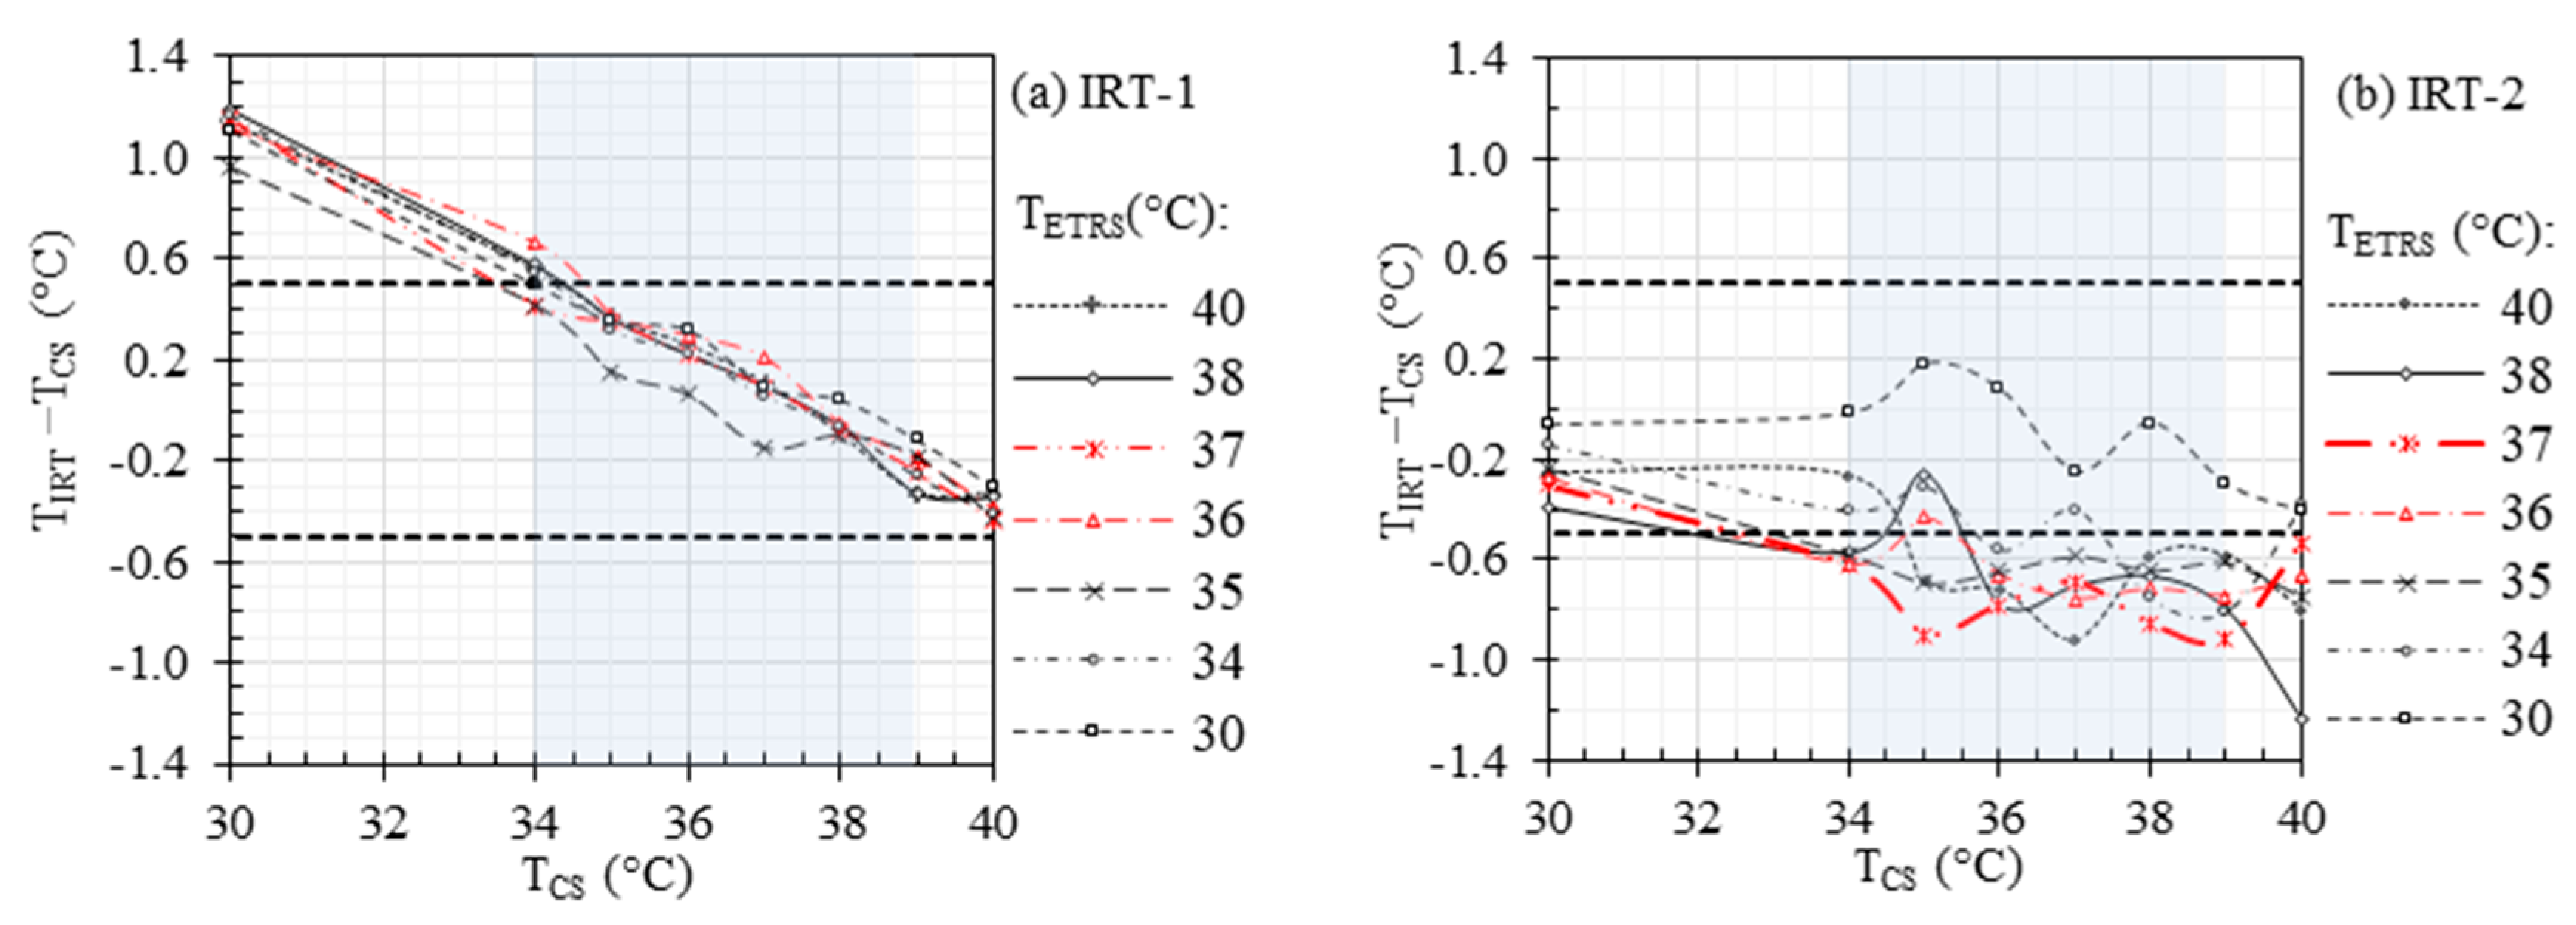
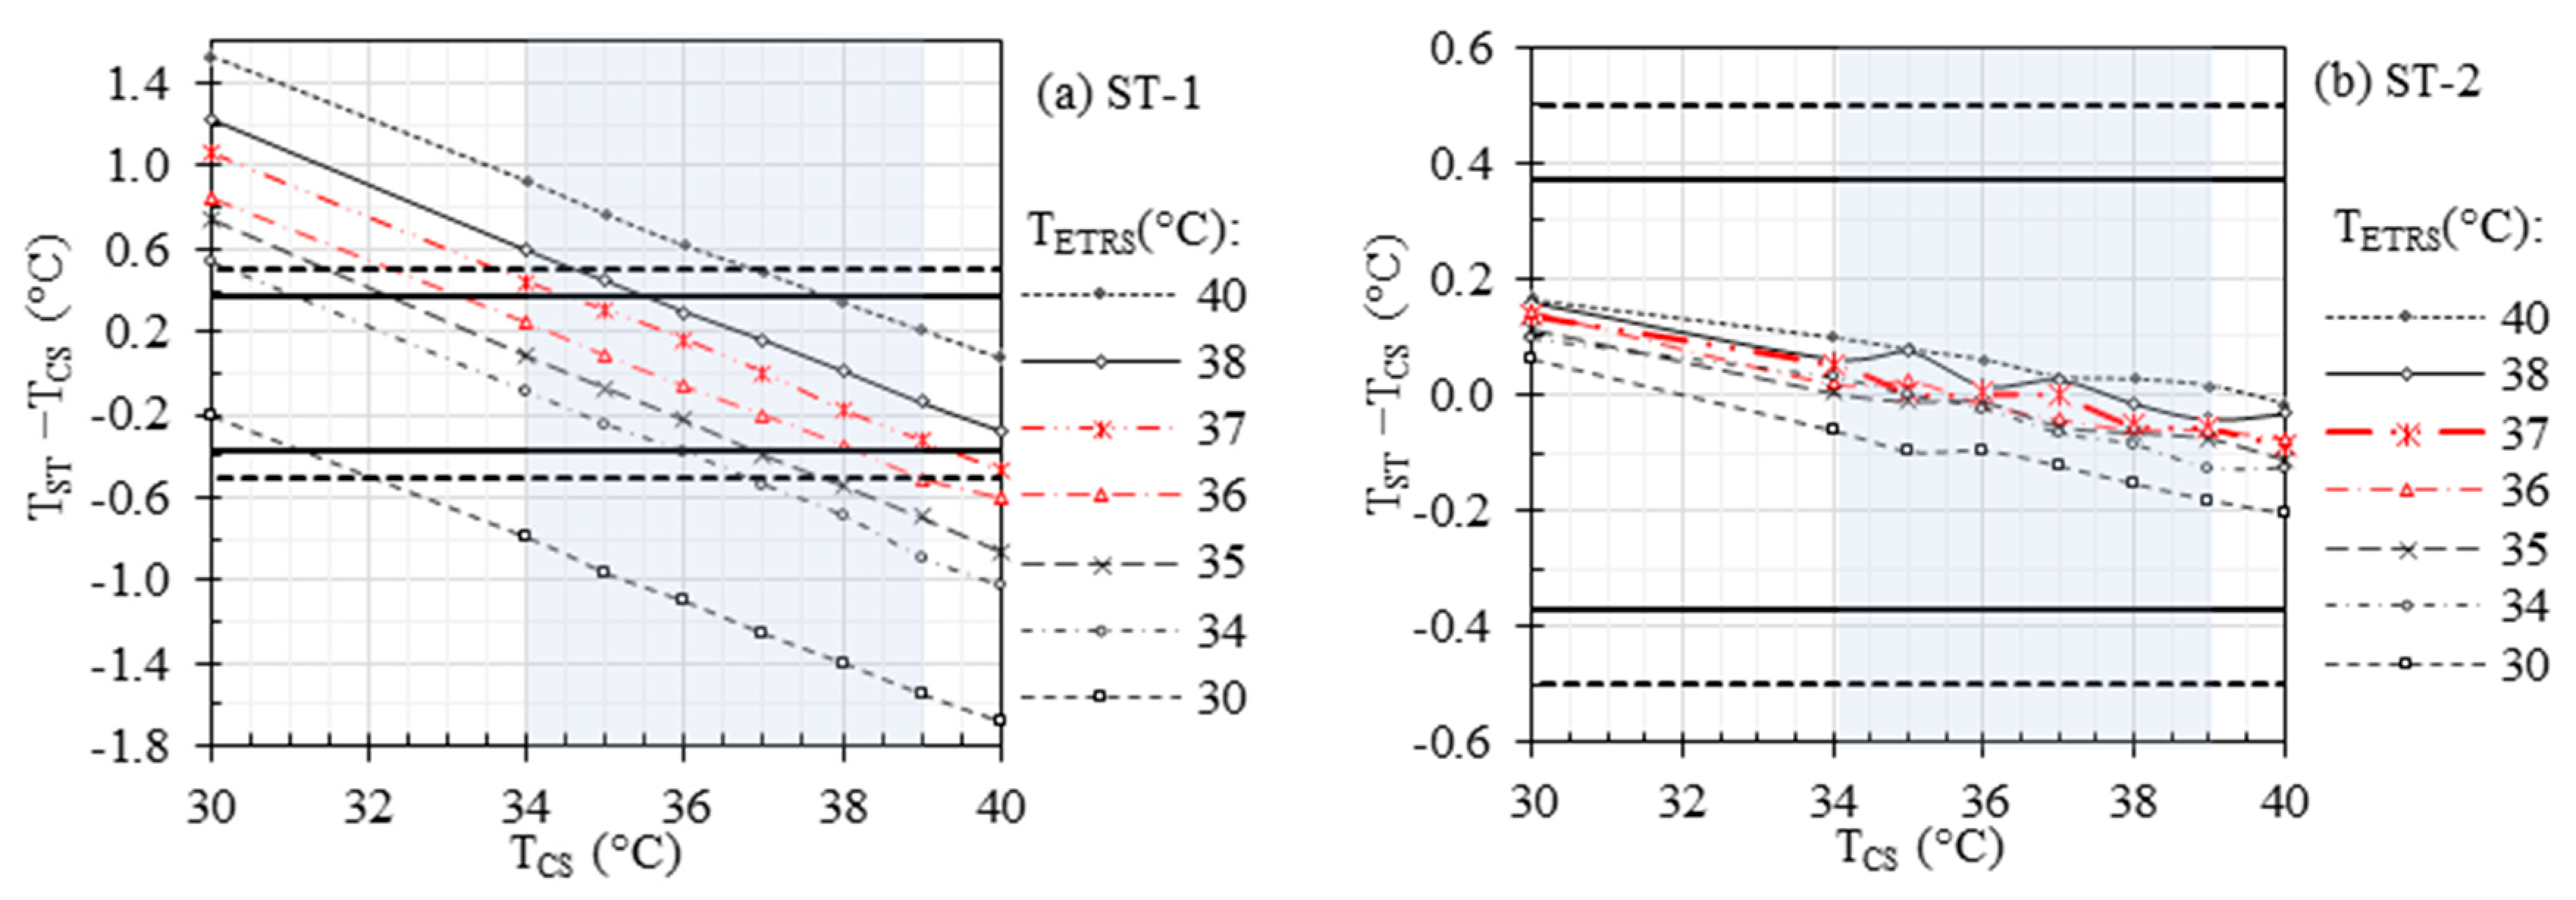
4.1. Effect of ETRS Set Temperature
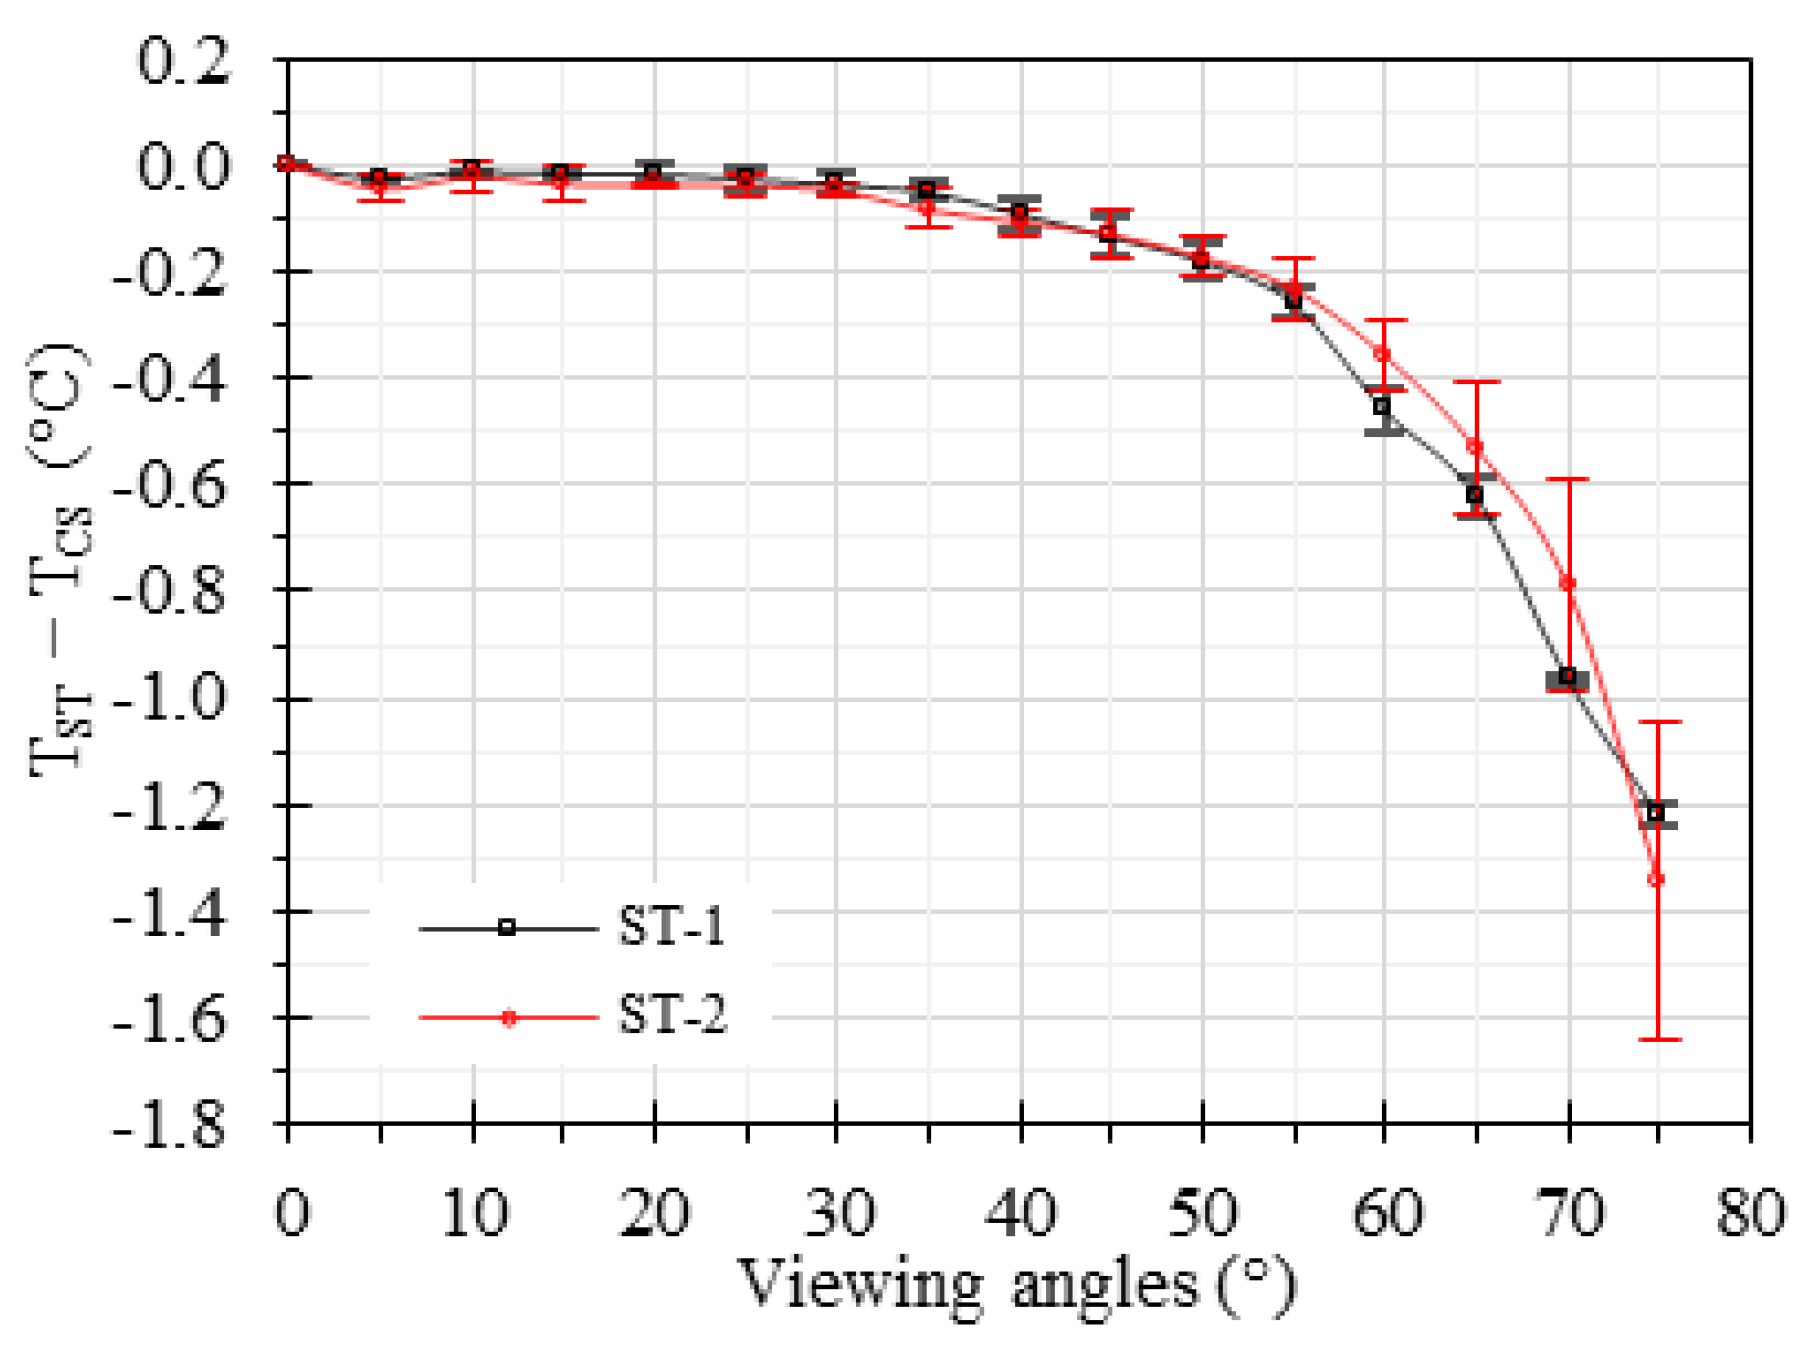
4.2. Effect of Viewing Angle
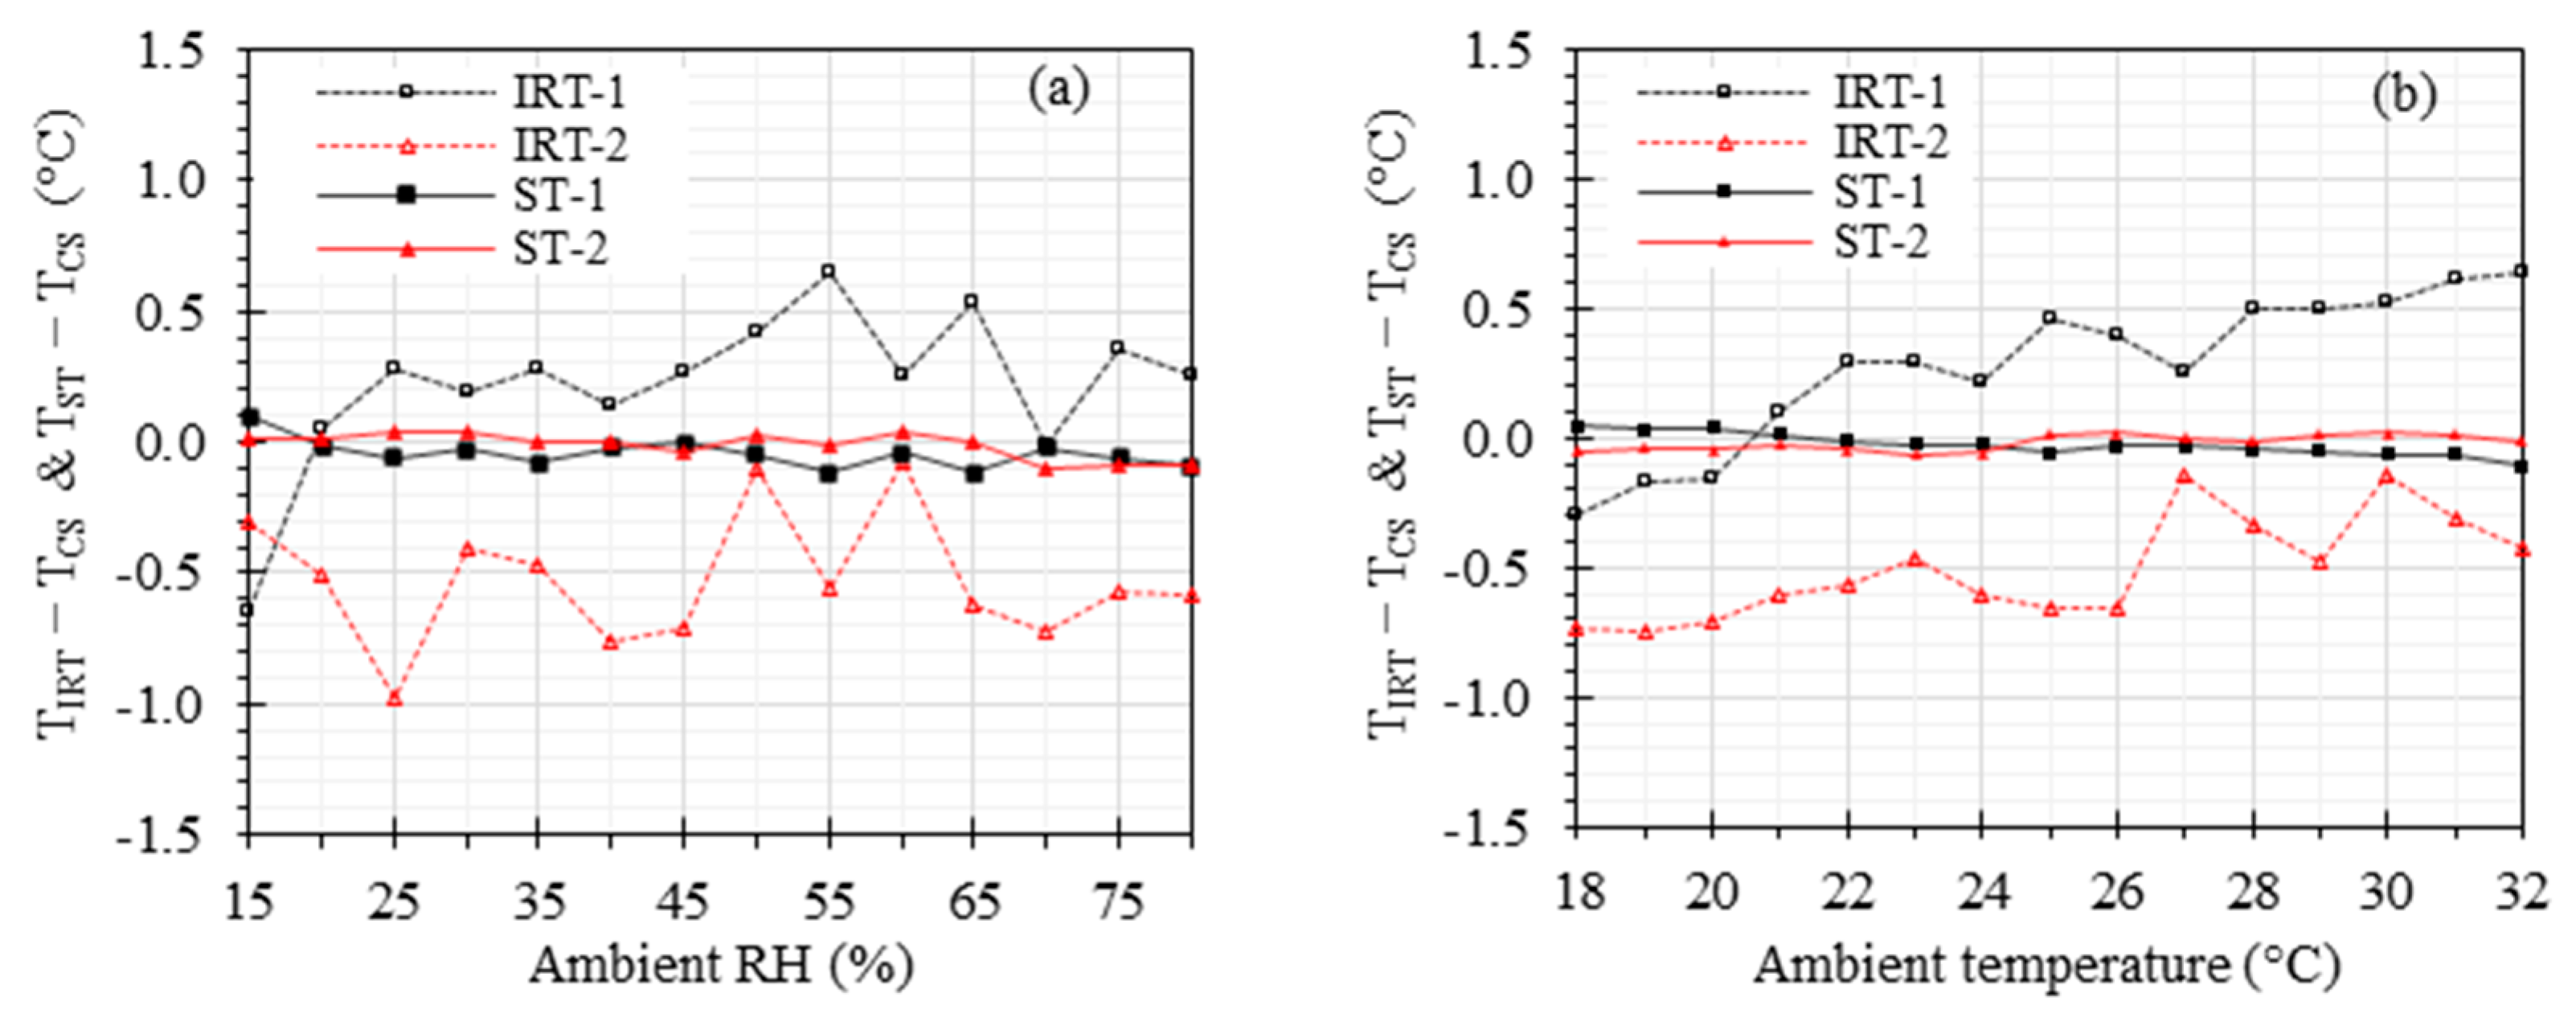
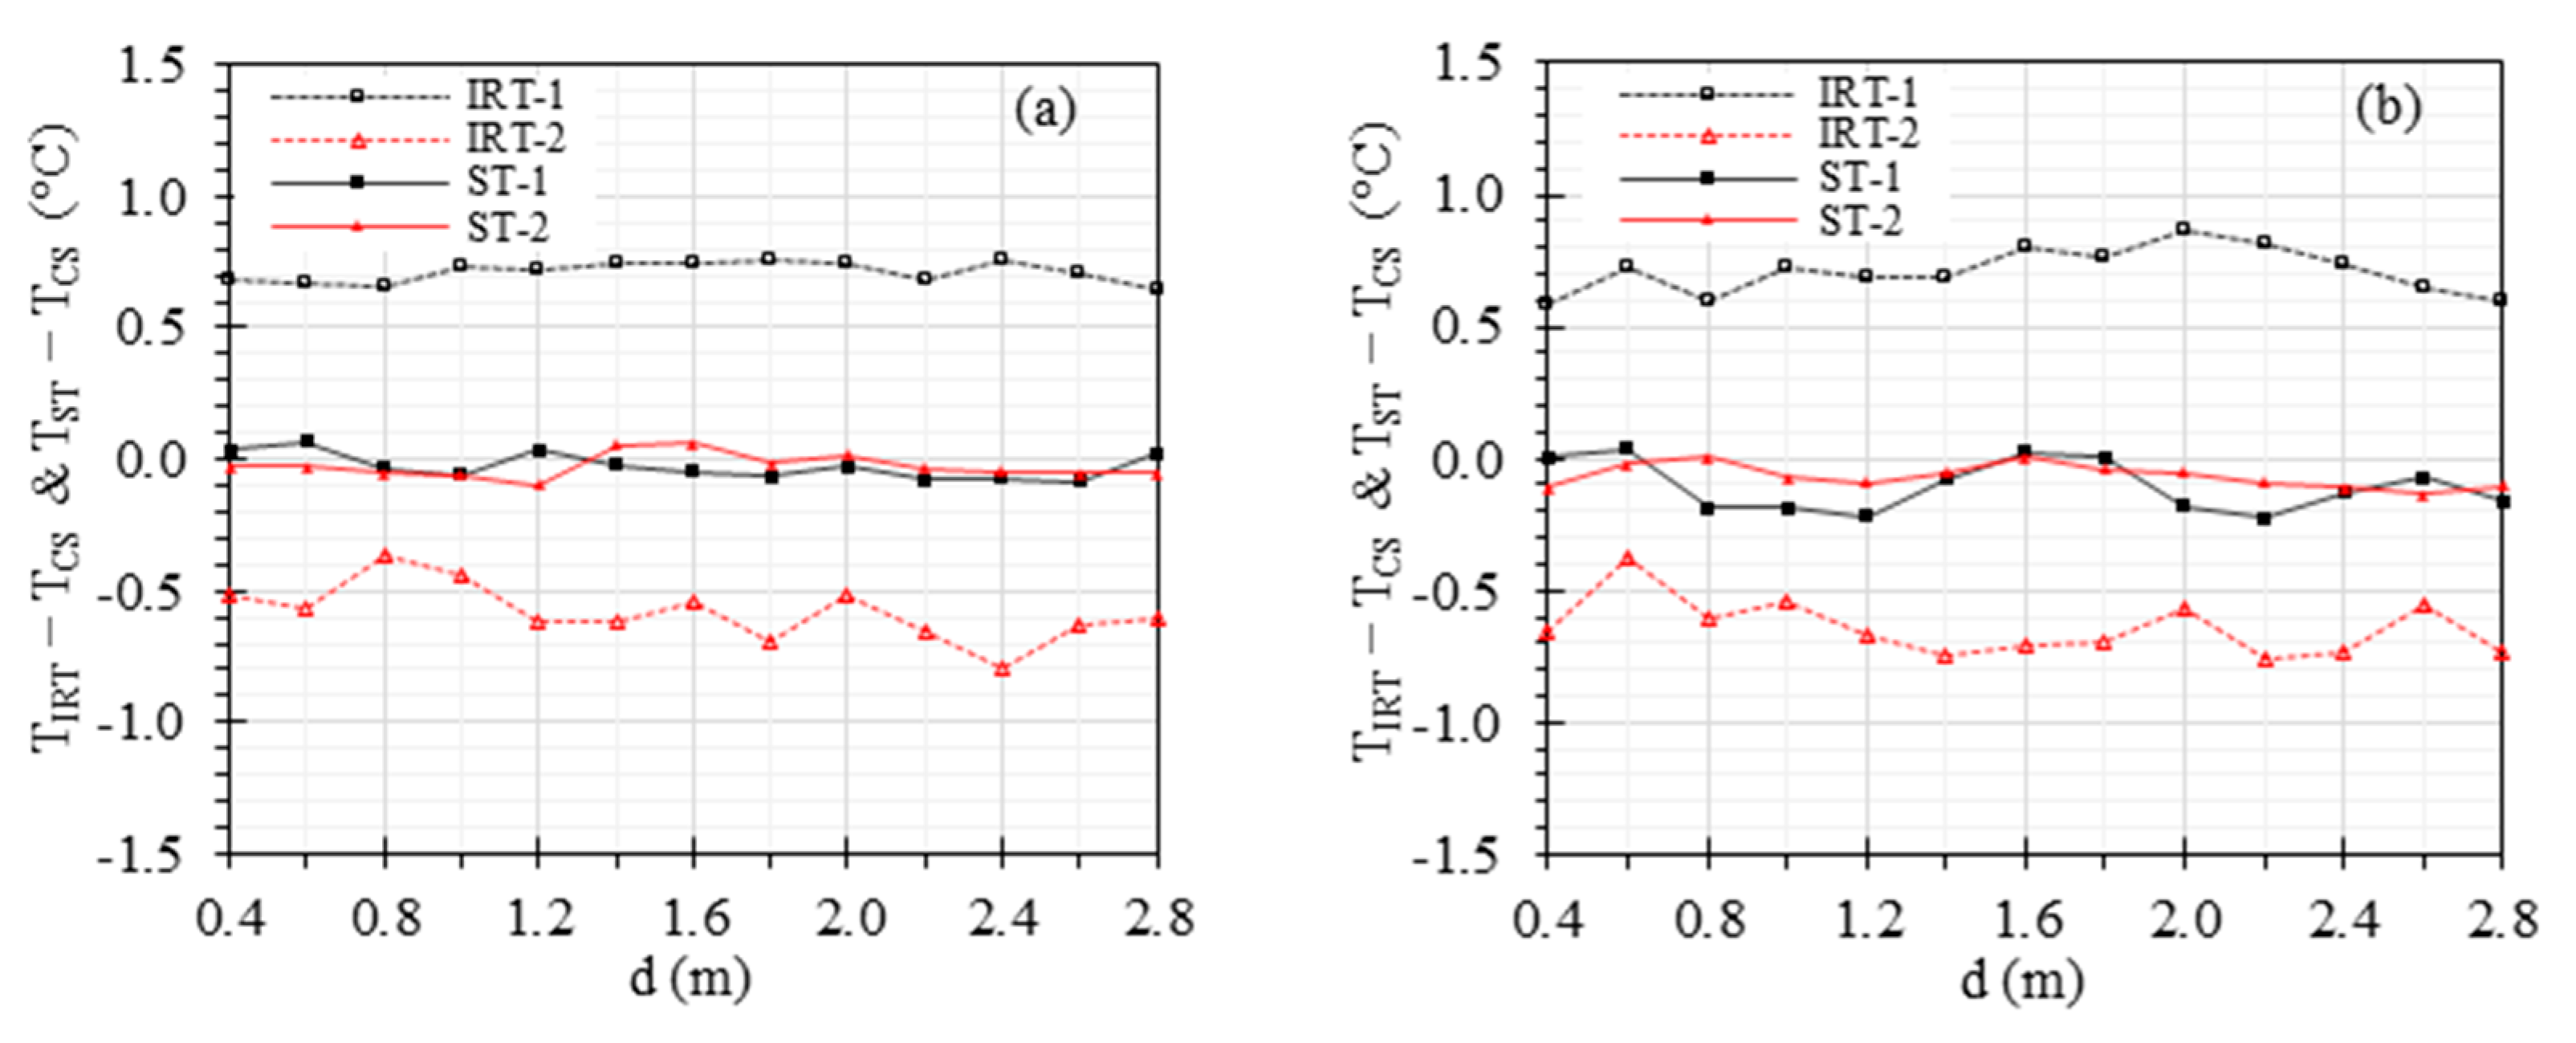
4.3. Effects of Ambient Temperature, RH, and Working Distance
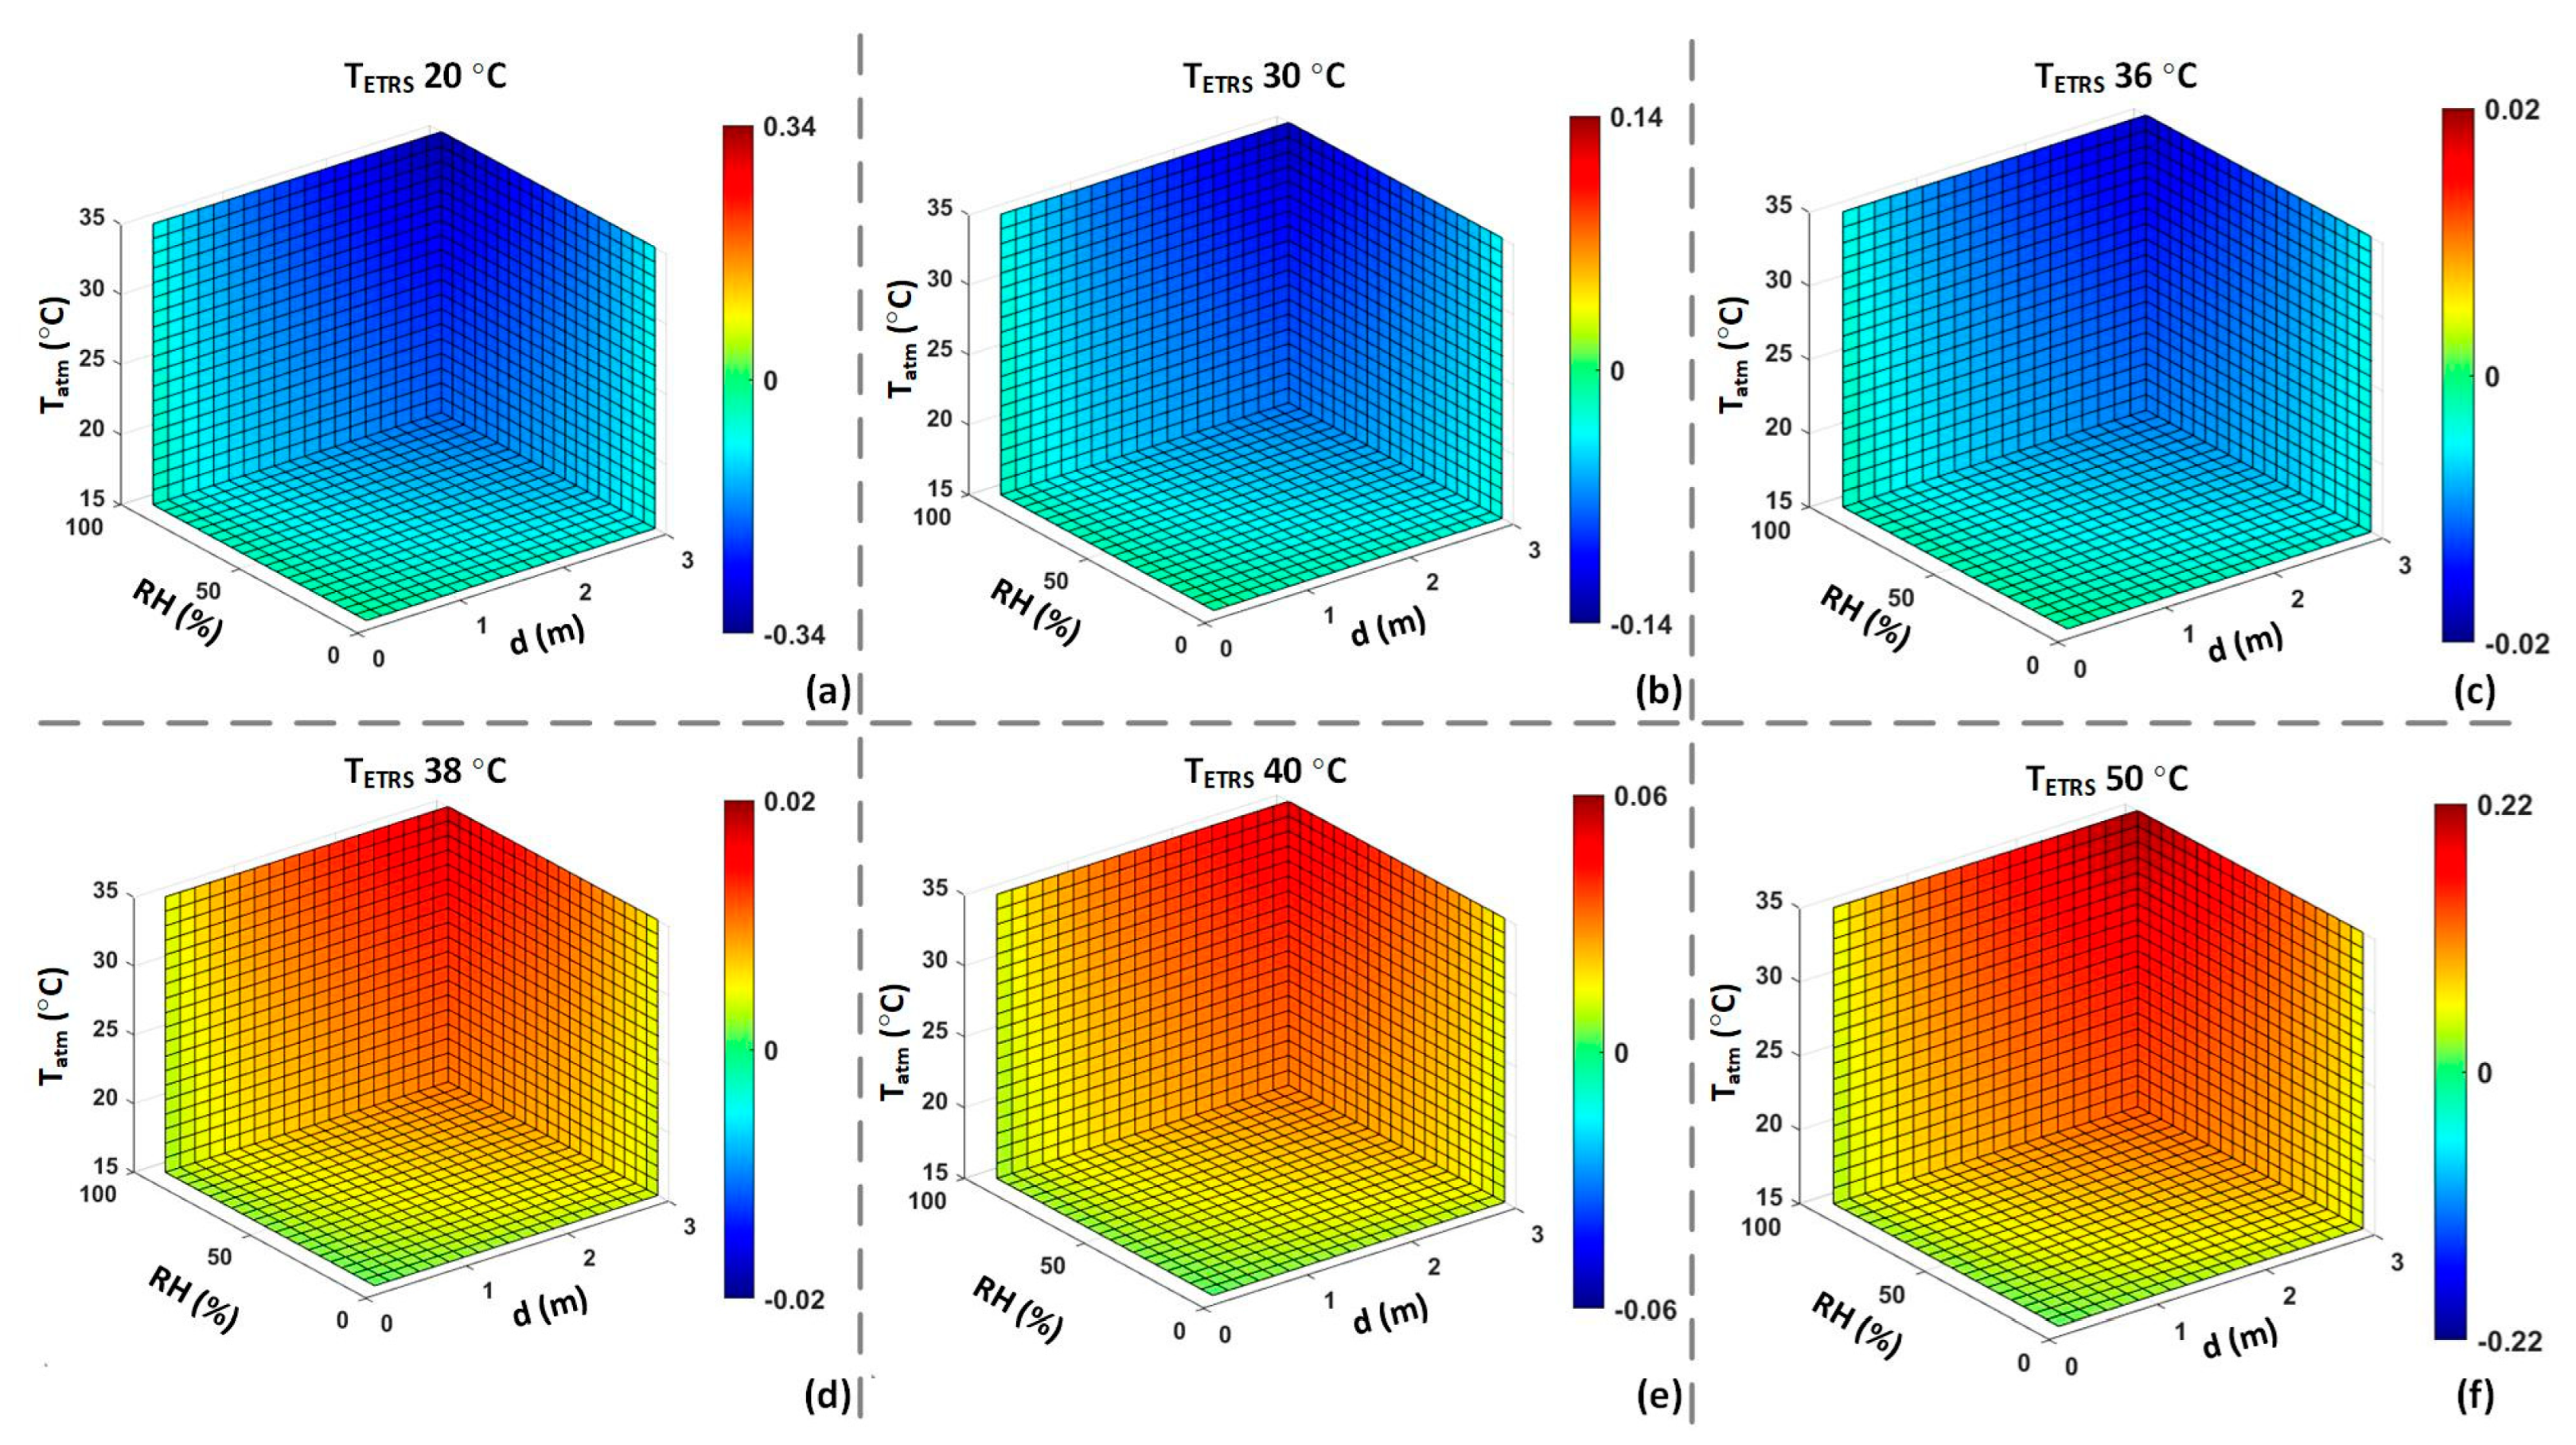
4.4. Computer Simulations to Investigate Effects of Ambient Temperature, RH, and Working Distance
5. Discussion
5.1. Effect of ETRS Set Temperature
5.2. Effect of Viewing Angle
5.3. Effects of Ambient Temperature, RH, and Working Distance
5.4. Computer Simulations to Investigate Effects of Ambient Temperature, RH, and Working Distance
5.5. Study Limitations
6. Conclusions
Author Contributions
Funding
Institutional Review Board Statement
Informed Consent Statement
Data Availability Statement
Acknowledgments
Conflicts of Interest
Appendix A. Additional Equations

References
- Huang, C.; Wang, Y.; Li, X.; Ren, L.; Zhao, J.; Hu, Y.; Zhang, L.; Fan, G.; Xu, J.; Gu, X. Clinical features of patients infected with 2019 novel coronavirus in Wuhan, China. Lancet 2020, 395, 497–506. [Google Scholar] [CrossRef] [PubMed]
- Goeijenbier, M.; Van Kampen, J.; Reusken, C.; Koopmans, M.; Van Gorp, E. Ebola virus disease: A review on epidemiology, symptoms, treatment and pathogenesis. Neth. J. Med. 2014, 72, 442–448. [Google Scholar] [PubMed]
- Nishiura, H.; Kamiya, K. Fever screening during the influenza (H1N1-2009) pandemic at Narita International Airport, Japan. BMC Infect. Dis. 2011, 11, 111. [Google Scholar] [CrossRef] [PubMed]
- Chiu, W.; Lin, P.; Chiou, H.; Lee, W.; Lee, C.; Yang, Y.; Lee, H.; Hsieh, M.; Hu, C.; Ho, Y. Infrared thermography to mass-screen suspected SARS patients with fever. Asia-Pac. J. Public Health 2005, 17, 26–28. [Google Scholar] [CrossRef]
- Mohamed, R.A.E.H.; Aleanizy, F.S.; Alqahtani, F.Y.; Alanazi, M.S.; Mohamed, N. Common Co-morbidities Are Challenging in the Diagnosis of Middle East Respiratory Syndrome (MERS-CoV) in Saudi Arabia. Pak. J. Biol. Sci. 2020, 23, 119–125. [Google Scholar] [CrossRef]
- Mouchtouri, V.A.; Christoforidou, E.P.; Menel Lemos, C.; Fanos, M.; Rexroth, U.; Grote, U.; Belfroid, E.; Swaan, C.; Hadjichristodoulou, C. Exit and entry screening practices for infectious diseases among travelers at points of entry: Looking for evidence on public health impact. Int. J. Environ. Res. Public Health 2019, 16, 4638. [Google Scholar] [CrossRef]
- Kumar, N.; Acharya, A.; Gendelman, H.E.; Byrareddy, S.N. The 2022 outbreak and the pathobiology of the monkeypox virus. J. Autoimmun. 2022, 131, 102855. [Google Scholar] [CrossRef]
- Ng, E.Y.K.; Acharya, R.U. Remote-sensing infrared thermography. IEEE Eng. Med. Biol. Mag. 2009, 28, 76–83. [Google Scholar] [CrossRef]
- Centers for Disease Control and Prevention. Enhanced Ebola Screening to Start at Five U.S. Airports and New Tracking Program for All People Entering U.S. from Ebola-Affected Countries. 2014. Available online: https://www.dhs.gov/news/2014/10/08/enhanced-ebola-screening-start-five-us-airports-all-people-entering-us-ebola (accessed on 14 September 2023).
- Zhou, Y.; Ghassemi, P.; Chen, M.; McBride, D.; Casamento, J.P.; Pfefer, T.J.; Wang, Q. Clinical evaluation of fever-screening thermography: Impact of consensus guidelines and facial measurement location. J. Biomed. Opt. 2020, 25, 097002. [Google Scholar] [CrossRef]
- Makino Antunes, A.C.; Aldred, A.; Tirado Moreno, G.P.; de Souza Ribeiro, J.A.; Brandão, P.E.; Barone, G.T.; Conselheiro, J.d.A.; Goulart, A.C.; Desuó, I.C.; Gomes, G. Potential of using facial thermal imaging in patient triage of flu-like syndrome during the COVID-19 pandemic crisis. PLoS ONE 2023, 18, e0279930. [Google Scholar] [CrossRef]
- Selent, M.U.; Molinari, N.M.; Baxter, A.; Nguyen, A.V.; Siegelson, H.; Brown, C.M.; Plummer, A.; Higgins, A.; Podolsky, S.; Spandorfer, P.; et al. Mass screening for fever in children: A comparison of 3 infrared thermal detection systems. Pediatr. Emerg. Care 2013, 29, 305–313. [Google Scholar] [CrossRef] [PubMed]
- Tay, M.; Low, Y.; Zhao, X.; Cook, A.; Lee, V. Comparison of Infrared Thermal Detection Systems for mass fever screening in a tropical healthcare setting. Public Health 2015, 129, 1471–1478. [Google Scholar] [CrossRef] [PubMed]
- Wang, Q.; Zhou, Y.; Ghassemi, P.; McBride, D.; Casamento, J.P.; Pfefer, T.J. Infrared Thermography for Measuring Elevated Body Temperature: Clinical Accuracy, Calibration, and Evaluation. Sensors 2022, 22, 215. [Google Scholar] [CrossRef] [PubMed]
- Lahiri, B.B.; Bagavathiappan, S.; Jayakumar, T.; Philip, J. Medical applications of infrared thermography: A review. Infrared Phys. Technol. 2012, 55, 221–235. [Google Scholar] [CrossRef]
- Mambou, S.J.; Maresova, P.; Krejcar, O.; Selamat, A.; Kuca, K. Breast cancer detection using infrared thermal imaging and a deep learning model. Sensors 2018, 18, 2799. [Google Scholar] [CrossRef]
- Moreira, D.G.; Costello, J.T.; Brito, C.J.; Adamczyk, J.G.; Ammer, K.; Bach, A.J.; Costa, C.M.; Eglin, C.; Fernandes, A.A.; Fernández-Cuevas, I. Thermographic imaging in sports and exercise medicine: A Delphi study and consensus statement on the measurement of human skin temperature. J. Therm. Biol. 2017, 69, 155–162. [Google Scholar] [CrossRef]
- Serantoni, V.; Jourdan, F.; Louche, H.; Sultan, A. Proposal for a protocol using an infrared microbolometer camera and wavelet analysis to study foot thermoregulation. Quant. InfraRed Thermogr. J. 2021, 18, 73–91. [Google Scholar] [CrossRef]
- Singh, J.; Arora, A.S. Effectiveness of active dynamic and passive thermography in the detection of maxillary sinusitis. Quant. InfraRed Thermogr. J. 2021, 18, 213–225. [Google Scholar] [CrossRef]
- Bardhan, S.; Nath, S.; Debnath, T.; Bhattacharjee, D.; Bhowmik, M.K. Designing of an inflammatory knee joint thermogram dataset for arthritis classification using deep convolution neural network. Quant. InfraRed Thermogr. J. 2022, 19, 145–171. [Google Scholar] [CrossRef]
- Ervural, S.; Ceylan, M. Thermogram classification using deep siamese network for neonatal disease detection with limited data. Quant. InfraRed Thermogr. J. 2022, 19, 312–330. [Google Scholar] [CrossRef]
- Ornek, A.H.; Ceylan, M. CodCAM: A new ensemble visual explanation for classification of medical thermal images. Quant. InfraRed Thermogr. J. 2023, 1–25. [Google Scholar] [CrossRef]
- Pérez-Buitrago, S.; Tobón-Pareja, S.; Gómez-Gaviria, Y.; Guerrero-Peña, A.; Díaz-Londoño, G. Methodology to evaluate temperature changes in multiple sclerosis patients by calculating texture features from infrared thermography images. Quant. InfraRed Thermogr. J. 2022, 19, 1–11. [Google Scholar] [CrossRef]
- Ilo, A.; Romsi, P.; Mäkelä, J. Infrared thermography and vascular disorders in diabetic feet. J. Diabetes Sci. Technol. 2020, 14, 28–36. [Google Scholar] [CrossRef]
- Vergilio, M.M.; Gomes, G.; Aiello, L.M.; Fontana, M.; Aldred, A.; Ribeiro, J.A.d.S.; Gabbi, T.V.B.; Leonardi, G.R. Evaluation of skin using infrared thermal imaging for dermatology and aesthetic applications. J. Cosmet. Dermatol. 2022, 21, 895–904. [Google Scholar] [CrossRef] [PubMed]
- Fokam, D.; Lehmann, C. Clinical assessment of arthritic knee pain by infrared thermography. J. Basic Clin. Physiol. Pharmacol. 2018, 30, 20170218. [Google Scholar] [CrossRef] [PubMed]
- Komoriyama, M.; Nomoto, R.; Tanaka, R.; Hosoya, N.; Gomi, K.; Iino, F.; Yashima, A.; Takayama, Y.; Tsuruta, M.; Tokiwa, H. Application of Thermography in Dentistry Visualization of Temperature Distribution on Oral Tissues. Dent. Mater. J. 2003, 22, 436–443. [Google Scholar] [CrossRef]
- John, H.E.; Niumsawatt, V.; Rozen, W.M.; Whitaker, I.S. Clinical applications of dynamic infrared thermography in plastic surgery: A systematic review. Gland Surg. 2016, 5, 122. [Google Scholar]
- Zagrodny, B. Standardisation Procedure of Infra-Red Imaging in Biomechanics. In Biomechanics in Medicine, Sport and Biology. BIOMECHANICS 2021; Hadamus, A., Piszczatowski, S., Syczewska, M., Błażkiewicz, M., Eds.; Lecture Notes in Networks and Systems; Springer: Cham, Switzerland, 2022; Volume 328. [Google Scholar] [CrossRef]
- ISO/TR 13154; Medical Electrical Equipment—Deployment, Implementation and Operational Guidelines for Identifying Febrile Humans Using a Screening Thermograph. International Organization for Standardization: Geneva, Switzerland, 2017.
- Pusnik, I.; Saunders, P.; Girard, F.; Knazovicka, L.; Simpson, R.; Machin, G.; Cardenas Garcia, D.; Wang, Q.; Kuelhas, K.; Sadli, M. Best Practice Guide: Use of Thermal Imagers to Perform Traceable Non-Contact Screening of Human Body Temperature. 2021. Available online: https://www.bipm.org/documents/20126/41773843/Best_Practice_Guide_human_body_temp_measurement_thermal_imager_screening.pdf (accessed on 14 September 2023).
- IEC 80601-2-59; Medical Electrical Equipment—Part 2-59: Particular Requirements for the Basic Safety and Essential Performance of Screening Thermographs for Human Febrile Temperature Screening. International Electrotechnical Commission: Geneva, Switzerland, 2017.
- Ghassemi, P.; Pfefer, T.J.; Casamento, J.P.; Simpson, R.; Wang, Q. Best practices for standardized performance testing of infrared thermographs intended for fever screening. PLoS ONE 2018, 13, e0203302. [Google Scholar] [CrossRef]
- Wang, Q. Infrared Thermographs—Methods for Evaluating Laboratory Performance; U.S. Food and Drug Administration, Ed.; European Organization for Nuclear Research (CERN): Geneva, Switzerland, 2023. [Google Scholar] [CrossRef]
- Wang, Q.; Zhou, Y.; Ghassemi, P.; Chenna, D.; Chen, M.; Casamento, J.; Pfefer, J.; McBride, D. Facial and Oral Temperature Data from a Large Set of Human Subject Volunteers; Version 1.0.0; PhysioNet, 2023; Available online: https://physionet.org/content/face-oral-temp-data/1.0.0/ (accessed on 14 September 2023).
- Cheng, T.-Y.; Deng, D.; Herman, C. Curvature effect quantification for in-vivo IR thermography. Int. Mech. Eng. Congr. Expo. 2012, 2, 127–133. [Google Scholar] [CrossRef]
- Dozier, J.; Warren, S.G. Effect of viewing angle on the infrared brightness temperature of snow. Water Resour. Res. 1982, 18, 1424–1434. [Google Scholar] [CrossRef]
- Tomita, K.; Chew, M.Y.L. A Review of infrared thermography for delamination detection on infrastructures and buildings. Sensors 2022, 22, 423. [Google Scholar] [CrossRef] [PubMed]
- Li, Z.-L.; Tang, B.-H.; Wu, H.; Ren, H.; Yan, G.; Wan, Z.; Trigo, I.F.; Sobrino, J.A. Satellite-derived land surface temperature: Current status and perspectives. Remote Sens. Environ. 2013, 131, 14–37. [Google Scholar] [CrossRef]
- Ortiz-Sanz, J.; Gil-Docampo, M.; Arza-García, M.; Cañas-Guerrero, I. IR thermography from UAVs to monitor thermal anomalies in the envelopes of traditional wine cellars: Field test. Remote Sens. 2019, 11, 1424. [Google Scholar] [CrossRef]
- Hori, M.; Aoki, T.; Tanikawa, T.; Hachikubo, A.; Sugiura, K.; Kuchiki, K.; Niwano, M. Modeling angular-dependent spectral emissivity of snow and ice in the thermal infrared atmospheric window. Appl. Opt. 2013, 52, 7243–7255. [Google Scholar] [CrossRef] [PubMed]
- ASTM E1965-98; Standard Specification for Infrared Thermometers for Intermittent Determination of Patient Temperature. ASTM Committee E20 on Temperature Measurement: West Conshohocken, PA, USA, 2016.
- Hanna, E.G.; Tait, P.W. Limitations to thermoregulation and acclimatization challenge human adaptation to global warming. Int. J. Environ. Res. Public Health 2015, 12, 8034–8074. [Google Scholar] [CrossRef] [PubMed]
- Bernard, V.; Staffa, E.; Mornstein, V.; Bourek, A. Infrared camera assessment of skin surface temperature–effect of emissivity. Phys. Med. 2013, 29, 583–591. [Google Scholar] [CrossRef] [PubMed]
- Spindel, J.F.; Pokrywa, S.; Elder, N.; Smith, C. The environment has effects on infrared temperature screening for COVID-19 infection. Am. J. Infect. Control 2021, 49, 1445–1447. [Google Scholar] [CrossRef]
- Minkina, W.; Klecha, D. Atmospheric transmission coefficient modelling in the infrared for thermovision measurements. J. Sens. Sens. Syst. 2016, 5, 17–23. [Google Scholar] [CrossRef]
- Patnaik, S. Separate Effects Tests for Studying Thermal Gradient Driven Cracking in UO2 Pellets Undergoing Resistive Heating; University of South Carolina: Columbia, SC, USA, 2021. [Google Scholar]
- FLIR System. Toolkit IC2 Dig 16: Developers Guide 1.01 for Agema 550/570, ThermaCAM PM 5 × 5 and the ThermoVision Family (FLIR Publication Number: 557344 Version B); FLIR System: Wilsonville, OR, USA, 2001. [Google Scholar]
- Mazdeyasna, S.; Ghassemi, P.; Wang, Q. External factors affecting performance of infrared thermographs for screening elevated body temperature (Conference Presentation). In Proceedings of the Optical Diagnostics and Sensing XXIII: Toward Point-of-Care Diagnostics, San Francisco, CA, USA, 28 January–3 February 2023; p. PC1238706. [Google Scholar] [CrossRef]
- Planck, M.; Masius, M. The Theory of Heat Radiation; P. Blakiston’s Son & Co.: Philadelphia, PA, USA, 1914. [Google Scholar]
- Minkina, W. Theoretical basics of radiant heat transfer–practical examples of calculation for the infrared (IR) used in infrared thermography measurements. Quant. InfraRed Thermogr. J. 2021, 18, 269–282. [Google Scholar] [CrossRef]
- Bityukov, V.; Khudak, Y.I.; Gusein-Zade, N. Analytical derivation of the Stefan–Boltzmann law for integral radiance from Planck’s law for spectral radiance. Bull. Lebedev Phys. Inst. 2018, 45, 46–50. [Google Scholar] [CrossRef]
- Wang, K.; Wan, Z.; Wang, P.; Sparrow, M.; Liu, J.; Zhou, X.; Haginoya, S. Estimation of surface long wave radiation and broadband emissivity using Moderate Resolution Imaging Spectroradiometer (MODIS) land surface temperature/emissivity products. J. Geophys. Res. Atmos. 2005, 110, D11109. [Google Scholar] [CrossRef]
- Kingston, R.H. Blackbody Radiation, Image Plane Intensity, and Units. In Optical Sources, Detectors, and Systems: Fundamentals and Applications; Acedemic Press: Cambridge, MA, USA, 1995; pp. 1–32. [Google Scholar]
- Usamentiaga, R.; Venegas, P.; Guerediaga, J.; Vega, L.; Molleda, J.; Bulnes, F.G. Infrared thermography for temperature measurement and non-destructive testing. Sensors 2014, 14, 12305–12348. [Google Scholar] [CrossRef] [PubMed]
- ASTM E1862-14. Standard Practice for Measuring and Compensating for Reflected Temperature Using Infrared Imaging Radiometers. ASTM Committee E-7 on Nondestructive Testing: West Conshohocken, PA, USA, 2014.
- Tran, Q.H.; Han, D.; Kang, C.; Haldar, A.; Huh, J. Effects of ambient temperature and relative humidity on subsurface defect detection in concrete structures by active thermal imaging. Sensors 2017, 17, 1718. [Google Scholar] [CrossRef]
- Steketee, J. Spectral emissivity of skin and pericardium. Phys. Med. Biol. 1973, 18, 686. [Google Scholar] [CrossRef] [PubMed]
- FLIR. THERMACAM® PM 595—High Performance Handheld Infrared Camera. FLIR Systems. 1999. Available online: https://www.atecorp.com/atecorp/media/pdfs/data-sheets/flir-pm595_datasheet.pdf (accessed on 14 September 2023).
- Ghassemi, P.; Pfefer, J.; Casamento, J.; Wang, Q. Standardized Assessment of Infrared Thermographic Fever Screening System Performance. Proc. SPIE 2017, 10056, 100560. [Google Scholar] [CrossRef]
- The American Society of Heating, Refrigerating and Air-Conditioning Engineers. ANSI/ASHRAE Standard 55-2020: Thermal Environmental Conditions for Human Occupancy; ASHRAE: Peachtree Corners, GA, USA, 2020; Available online: https://www.ashrae.org/technical-resources/bookstore/standard-55-thermal-environmental-conditions-for-human-occupancy (accessed on 14 September 2023).
- Martinez-Jimenez, M.A.; Loza-Gonzalez, V.M.; Kolosovas-Machuca, E.S.; Yanes-Lane, M.E.; Ramirez-GarciaLuna, A.S.; Ramirez-GarciaLuna, J.L. Diagnostic accuracy of infrared thermal imaging for detecting COVID-19 infection in minimally symptomatic patients. Eur. J. Clin. Investig. 2021, 51, e13474. [Google Scholar] [CrossRef]
- Ng, E.Y.K.; Kaw, G.J.L.; Chang, W.M. Analysis of IR thermal imager for mass blind fever screening. Microvasc. Res. 2004, 68, 104–109. [Google Scholar] [CrossRef]
- Charlton, M.; Stanley, S.A.; Whitman, Z.; Wenn, V.; Coats, T.J.; Sims, M.; Thompson, J.P. The effect of constitutive pigmentation on the measured emissivity of human skin. PLoS ONE 2020, 15, e0241843. [Google Scholar] [CrossRef]
- Ring, E.F.J.; Jung, A.; Kalicki, B.; Zuber, J.; Rustecka, A.; Vardasca, R. New standards for fever screening with thermal imaging systems. J. Mech. Med. Biol. 2013, 13, 1350045. [Google Scholar] [CrossRef]
- Healy, C.; Segal, Z.; Hinnerichs, C.; Ace, E.; Ward, D.; Honovich, J. Globally deployed COVID-19 fever screening devices using infrared thermographs consistently normalize high readings to afebrile range. J. Biomed. Opt. 2021, 26, 043009. [Google Scholar] [CrossRef]
- Tkáčová, M.; Hudák, R.; Foffová, P.; Živčák, J. An importance of camera–subject distance and angle in musculoskeletal applications of medical thermography. Acta Electrotech. Et Inform. 2010, 10, 57–60. [Google Scholar]
- Muniz, P.R.; Cani, S.P.; Magalhaes, R.d.S. Influence of field of view of thermal imagers and angle of view on temperature measurements by infrared thermovision. IEEE Sens. J. 2013, 14, 729–733. [Google Scholar] [CrossRef]
- Scott, M.; Luttig, H.; Strydom, M.; Gonelli, M.; Kruger, D.; Rankine, R.; Broodryk, T. Passive infrared thermography as a diagnostic tool in civil engineering structural material health monitoring. In Proceedings of the Concrete Repair, Rehabilitation and Retrofitting III: 3rd International Conference on Concrete Repair, Rehabilitation and Retrofitting, Cape Town, South Africa, 3–5 September 2012; pp. 3–5. [Google Scholar]
- Samartharam, H.; Vasudeva, N.; Ila, S.S. The Role of Humidity in the Management of Premature Neonates in a Rural Incubator. Cureus 2021, 13, e14411. [Google Scholar] [CrossRef]
- ISO 7730; Ergonomics of the Thermal Environment—Analytical Determination and Interpretation of Thermal Comfort Using Calculation of the PMV and PPD Indices and Local Thermal Comfort Criteria. International Organization for Standardization: Geneva, Switzerland, 2005.
- Brück, K.; Parmelee, A.H., Jr.; Brück, M. Neutral temperature range and range of “thermal comfort” in premature infants. Neonatology 1962, 4, 32–51. [Google Scholar] [CrossRef]
- Ahmed, K.S. Comfort in urban spaces: Defining the boundaries of outdoor thermal comfort for the tropical urban environments. Energy Build. 2003, 35, 103–110. [Google Scholar] [CrossRef]
- Jing, S.; Li, B.; Tan, M.; Liu, H. Impact of relative humidity on thermal comfort in a warm environment. Indoor Built Environ. 2013, 22, 598–607. [Google Scholar] [CrossRef]
- Fountain, M.; Arens, E.A.; Xu, T.; Bauman, F.; Oguru, M. An investigation of thermal comfort at high humidities. ASHRAE Trans. 1999, 105, 4282. [Google Scholar]
- Djamila, H.; Chu, C.-M.; Kumaresan, S. Effect of humidity on thermal comfort in the humid tropics. J. Build. Constr. Plan. Res. 2014, 2, 109. [Google Scholar] [CrossRef]
- Dafico, L.C.M.; Barreira, E.; Almeida, R.; Carasek, H. Comparison of Infrared Thermography and Other Traditional Techniques to Assess Moisture Content of Wall Specimens. Sensors 2022, 22, 3182. [Google Scholar] [CrossRef]
- Bae, J.S.; Lee, J.B.; Matsumoto, T.; Othman, T.; Min, Y.K.; Yang, H.M. Prolonged residence of temperate natives in the tropics produces a suppression of sweating. Pflug. Arch. 2006, 453, 67–72. [Google Scholar] [CrossRef]
- Taylor, N.A.; Cotter, J.D. Heat adaptation: Guidelines for the optimisation of human performance. Int. Sport. J. 2006, 7, 33–57. [Google Scholar]
- Bullard, R.W. Continuous recording of sweating rate by resistance hygrometry. J. Appl. Physiol. 1962, 17, 735–737. [Google Scholar] [CrossRef] [PubMed]
- TORII, M. Maximal sweating rate in humans. J. Hum. Ergol. 1995, 24, 137–152. [Google Scholar]
- Yamtraipat, N.; Khedari, J.; Hirunlabh, J. Thermal comfort standards for air conditioned buildings in hot and humid Thailand considering additional factors of acclimatization and education level. Sol. Energy 2005, 78, 504–517. [Google Scholar] [CrossRef]
- Lai, D.; Guo, D.; Hou, Y.; Lin, C.; Chen, Q. Studies of outdoor thermal comfort in northern China. Build. Environ. 2014, 77, 110–118. [Google Scholar] [CrossRef]
- Reis, H.H.T.; Brito, C.J.; Sillero-Quintana, M.; da Silva, A.G.; Fernández-Cuevas, I.; Cerqueira, M.S.; Werneck, F.Z.; Marins, J.C.B. Can the body mass index influence the skin temperature of adolescents assessed by infrared thermography? J. Therm. Biol. 2023, 111, 103424. [Google Scholar] [CrossRef]
- Costa, C.M.A.; Sillero-Quintana, M.; Cano, S.P.; Moreira, D.; Brito, C.; Fernandes, A.; Pussieldi, G.; Marins, J. Daily oscillations of skin temperature in military personnel using thermography. BMJ Mil. Health 2016, 162, 335–342. [Google Scholar] [CrossRef]
- Marins, J.C.B.; Formenti, D.; Costa, C.M.A.; de Andrade Fernandes, A.; Sillero-Quintana, M. Circadian and gender differences in skin temperature in militaries by thermography. Infrared Phys. Technol. 2015, 71, 322–328. [Google Scholar] [CrossRef]
- Chudecka, M.; Lubkowska, A. Temperature changes of selected body’s surfaces of handball players in the course of training estimated by thermovision, and the study of the impact of physiological and morphological factors on the skin temperature. J. Therm. Biol. 2010, 35, 379–385. [Google Scholar] [CrossRef]
- Gómez-Carmona, P.; Fernández-Cuevas, I.; Sillero-Quintana, M.; Arnaiz-Lastras, J.; Navandar, A. Infrared thermography protocol on reducing the incidence of soccer injuries. J. Sport Rehabil. 2020, 29, 1222–1227. [Google Scholar] [CrossRef]
- Shvartz, E.; Magazanik, A.; Glick, Z. Thermal responses during training in a temperate climate. J. Appl. Physiol. 1974, 36, 572–576. [Google Scholar] [CrossRef] [PubMed]
- Machado, Á.S.; Cañada-Soriano, M.; Jimenez-Perez, I.; Gil-Calvo, M.; Carpes, F.P.; Perez-Soriano, P.; Priego-Quesada, J.I. Distance and camera features measurements affect the detection of temperature asymmetries using infrared thermography. Quant. InfraRed Thermogr. J. 2022, 1–13. [Google Scholar] [CrossRef]
- Gunapala, S.; Rafol, S.; Ting, D.; Soibel, A.; Hill, C.; Khoshakhlagh, A.; Liu, J.; Mumolo, J.; Keo, S.; Höglund, L. Modulation transfer function of infrared focal plane arrays. In Proceedings of the SPIE Optical Engineering + Applications, San Diego, CA, USA, 9–13 August 2015; Infrared Remote Sensing and Instrumentation XXIII. p. 960811. [Google Scholar] [CrossRef]
- Yoon, S.; Park, J.; Cho, Y. An experimental study on the evaluation of temperature uniformity on the surface of a blackbody using infrared cameras. Quant. InfraRed Thermogr. J. 2022, 19, 172–186. [Google Scholar] [CrossRef]
- Lin, J.-W.; Lu, M.-H.; Lin, Y.-H. A Thermal Camera Based Continuous Body Temperature Measurement System. In Proceedings of the IEEE/CVF International Conference on Computer Vision Workshops, Seoul, Republic of Korea, 27–28 October 2019; pp. 1681–1687. Available online: https://openaccess.thecvf.com/content_ICCVW_2019/papers/CVPM/Lin_A_Thermal_Camera_Based_Continuous_Body_Temperature_Measurement_System_ICCVW_2019_paper.pdf (accessed on 14 September 2023).


| Device Names | Models and Manufacturers | Abbreviation | Functions and Specifications [33] |
|---|---|---|---|
| Infrared thermographs (IRTs) | A325sc, FLIR Systems Inc., Nashua, NH, USA | IRT-1 | Measure test target temperature. Part of an ST, 320 × 240 pixels, spectral range of 7.5–13 µm, Field of view (FOV) 17° and 14° [horizontal and vertical]. |
| 8640 P-series, Infrared Cameras Inc., Beaumont, TX, USA | IRT-2 | Measure test target temperature. Part of an ST, 640 × 512 pixels, spectral range of 7–14 µm, FOV 30° and 25° [horizontal and vertical]. | |
| Extended area blackbodies | SR-33N-4, CI Systems Inc., Simi Valley, CA, USA | ETRS | Work as an external temperature reference source for offset compensation. Part of an ST. |
| SR-800R-4D, CI Systems Inc., CA | CS | Serve as a calibration source or test target. | |
| Humidifier | EE-6913, Crane-USA, Itasca, IL, USA | - | Control RH in the range of 15–80%. |
| Heater | HT1188, Supply Chain Sources LLC, Brea, CA, USA | - | Control in the range of 18–32 °C. |
| Weather meter | Kestrel 4500NV, Weather Republic LLC, Downingtown, PA, USA | WM | Measure and RH, which can be used to assess τ. |
| 0.006569 | 0.01262 | −0.002276 | −0.00667 | 1.5587 | 6.939 × 10⁻² | −2.7816 × 10⁻⁴ | 6.8455 × 10⁻⁷ | 1.9 |
| Ambient Temperature (°C) | Ambient RH (%) | Working Distance (m) | |
|---|---|---|---|
| ISO/TR 13154 [30] | 20–24 | 10–50 | NA |
| IEC 80601-2-59 [32] (Clause 201.7.9.3.1) | <24 | <50 | NA |
| Zhou et al. [10] | 20–24 | 10–62 | 0.6–0.8 |
| Wang et al. [14] | 20–29 | 10–62 | 0.6–0.8 |
| Martinez-Jimenez et al. [62] | 23 | 40 | 0.3 |
| Ng et al. [63] | 20–25 | 40–75 | NA |
| Charlton et al. [64] | 28–30 | 19–30 | NA |
| Ring et al. [65] | 20–21 | NA | <1 |
| Healy et al. [66] | 19.8–22.6 | 53–70 | 0.5–0.8 |
| Current Benchtop | 18–32 | 15–80 | 0.4–2.8 |
| Current Simulations | 15–35 | 5–95 | 0.2–3.0 |
Disclaimer/Publisher’s Note: The statements, opinions and data contained in all publications are solely those of the individual author(s) and contributor(s) and not of MDPI and/or the editor(s). MDPI and/or the editor(s) disclaim responsibility for any injury to people or property resulting from any ideas, methods, instructions or products referred to in the content. |
© 2023 by the authors. Licensee MDPI, Basel, Switzerland. This article is an open access article distributed under the terms and conditions of the Creative Commons Attribution (CC BY) license (https://creativecommons.org/licenses/by/4.0/).
Share and Cite
Mazdeyasna, S.; Ghassemi, P.; Wang, Q. Best Practices for Body Temperature Measurement with Infrared Thermography: External Factors Affecting Accuracy. Sensors 2023, 23, 8011. https://doi.org/10.3390/s23188011
Mazdeyasna S, Ghassemi P, Wang Q. Best Practices for Body Temperature Measurement with Infrared Thermography: External Factors Affecting Accuracy. Sensors. 2023; 23(18):8011. https://doi.org/10.3390/s23188011
Chicago/Turabian StyleMazdeyasna, Siavash, Pejman Ghassemi, and Quanzeng Wang. 2023. "Best Practices for Body Temperature Measurement with Infrared Thermography: External Factors Affecting Accuracy" Sensors 23, no. 18: 8011. https://doi.org/10.3390/s23188011
APA StyleMazdeyasna, S., Ghassemi, P., & Wang, Q. (2023). Best Practices for Body Temperature Measurement with Infrared Thermography: External Factors Affecting Accuracy. Sensors, 23(18), 8011. https://doi.org/10.3390/s23188011