1. Introduction
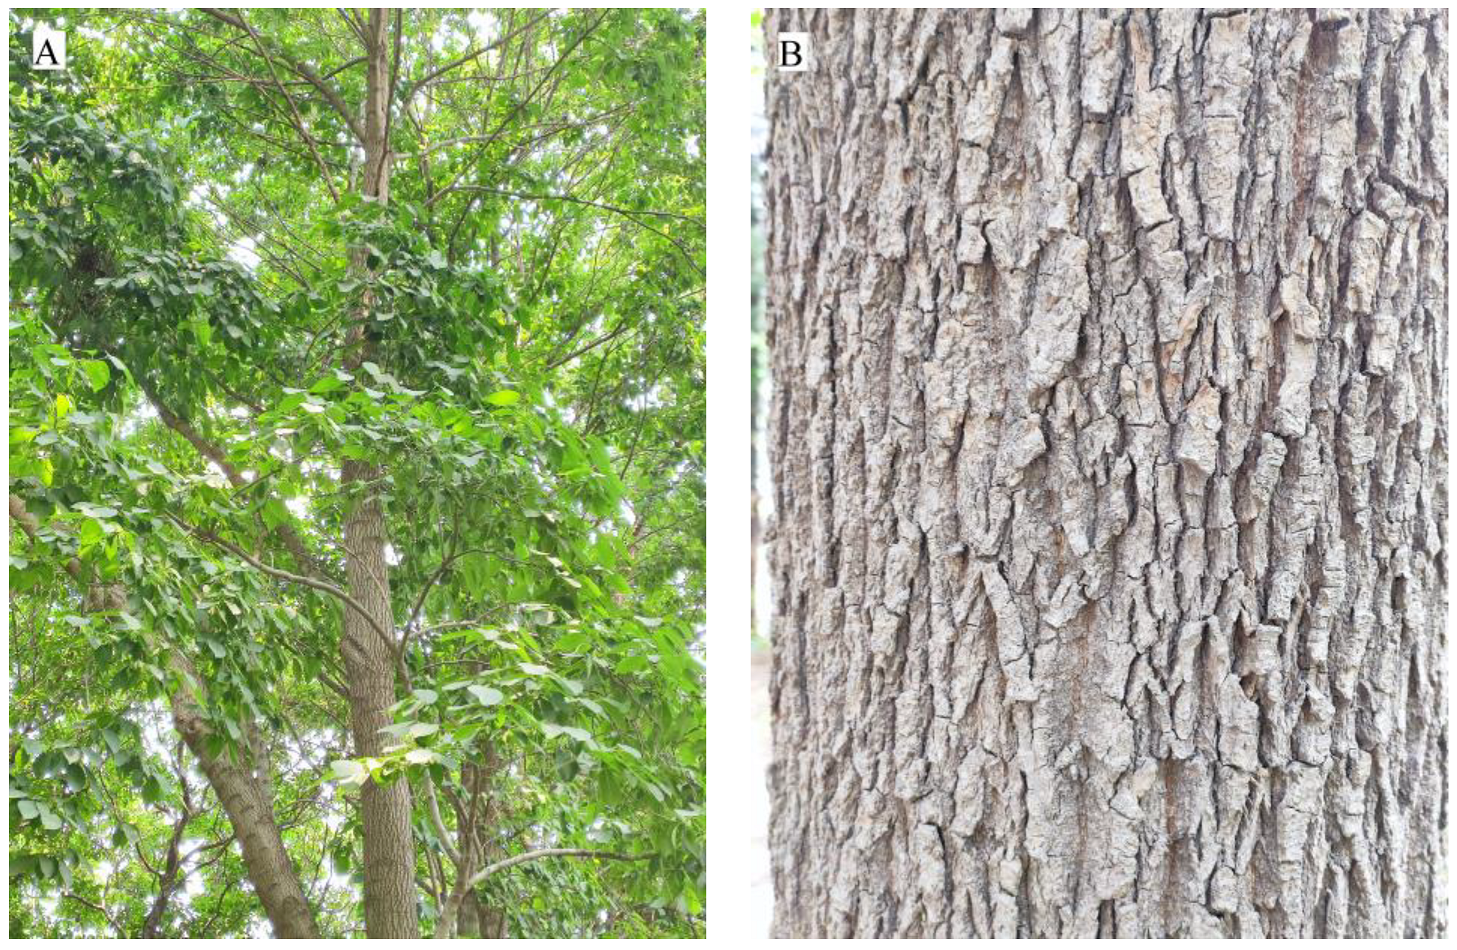
People are becoming increasingly interested in medicinal plants as they become more health conscious. Eucommiae Cortex is the dried bark of
E. ulmoides (
Figure 1), a genus of Eucommia, a popular herb and health product in China, Japan, and Korea. Modern pharmacological studies have shown that
E. ulmoides has been widely used to treat hypertension, osteoporosis, Alzheimer’s disease, diabetes, and sexual dysfunction. In addition,
E. ulmoides is an endemic tree species that belongs to the second category of protected rare and endangered tree species in China [
1], which is a high-quality natural rubber resource with great development potential in the world to solve the scarcity of rubber resources and an important tree species in maintaining ecological security and increasing carbon sinks. Ruyang County has a long history of
E. ulmoides cultivation and is one of the main production zones of
E. ulmoides. In December 2017, “Ruyang
E. ulmoides” was approved by the Chinese Ministry of Agriculture and Rural Development as the title of the species under the “Geographical Indication of Agricultural Products”. Therefore, it is important to study the method of real-time monitoring of large zones of
E. ulmoides, the assessment of carbon sequestration capacity, and its ecological suitability zone prediction.
In this context, remote sensing plays a key role in monitoring the range of medicinal plants. Currently, scholars have conducted studies related to the information extraction of medicinal plant growing zones using remote sensing satellite data [
2,
3,
4,
5]. However, these studies used limited band information, while the red edge, as a vegetation-sensitive band, is more effective in reflecting the spectral characteristics of
E. ulmoides [
6,
7]. Therefore, the extraction of medicinal plants based on the red-edge band of satellite images is an important research direction. The Chinese GF-6 Wide Field of View camera (GF-6 WFV) has a spatial resolution of 16 m and a revisit period of 4 days. Compared to the earlier Chinese GF-1 satellite, the GF-6 satellite adds a purple band, a yellow band, and two red-edge bands, making it sensitive to unique biochemical or structural features of crop types [
8]. In particular, previous studies have assessed the importance of red-edge bands of the GF-6 data in crop-type mapping [
9]. Therefore, studying the method of identifying the distribution area of
E. ulmoides using the GF-6 red-edge band and its derived red-edge vegetation index is the basis for its carbon sequestration capacity assessment and ecological suitability area prediction.
Net primary production (NPP) is the amount of biomass or carbon produced by primary producers per unit area and time, obtained by subtracting plant respiratory costs (Rp) from gross primary productivity (GPP) or total photosynthesis. It is the material basis for the survival and reproduction of other food chain members in the ecosystem, an important indicator of the carbon sequestration capacity of plants, and a major factor in determining the carbon sink of terrestrial ecosystems [
10,
11,
12]. Direct in situ measurements are time-consuming and laborious, so simulation models are generally used to analyze NPP [
13]. The Carnegie Ames Stanford Approach (CASA) to the light energy utilization model is an effective process-based model for assessing carbon uptake via regional ecosystems based on the acquisition of regional NDVI data, vegetation type maps, and monthly weather data (total solar radiation, temperature, and precipitation) using a combination of remote sensing and GIS techniques to describe carbon exchange between the terrestrial biosphere and atmospheric processes; it has been widely used to model regional or continental NPP in a large number of published studies [
14,
15].
The potential distribution zone of
E. ulmoides is predicted, which is conducive to the rational layout, the scientific introduction of
E. ulmoides resources, and the enhancement of ecological benefits. The niche model can be used to assess and predict the effect of climate change on plants. Currently, several models, such as bioclimatic modeling (BIOCLIM), global geographic information system for a medicinal plant (GMPGIS), climate change experiment (CLIMEX), genetic algorithm for rule-set production (GARP), and maximum entropy (MaxEnt) have been used to predict the potential distribution of species [
16,
17,
18,
19,
20]. Among these, the MaxEnt-based model is a frequently used tool. The theory of maximum entropy was first proposed in 1957 [
21]. The Java MaxEnt model, which was developed from this theory, has become the most commonly used species distribution model (SDM) [
21]. It can assess the potential distribution of diseases and insect pests and reasonably predict zones where disease symptoms may occur under climate change conditions [
22]. The MaxEnt model has been used in research on natural reserve design, endangered species survey, alien species risk assessment, and climate change impact [
23,
24,
25].
In summary, the main objective of this study was to assess the potential variables of GF-6 data and construct different models to determine the distribution area of E. ulmoides based on reliable field survey data. On this basis, the carbon sequestration capacity of E. ulmoides was assessed, and its ecological suitability zoning was predicted to provide data support for its sustainable utilization and rational layout. First, optical features, especially the red-edge spectral bands and their normalized vegetation indices (NDVI), were extracted from the GF-6 multi-temporal images and used as input features for the classification of E. ulmoides. By comparing the results of the random forest algorithm with different feature combinations to obtain the best feature combination for E. ulmoides type discrimination. The random forest classifier is applied to the best set of features to generate a map of E. ulmoides distributions. Second, the CASA model was used for the estimation of the NPP of E. ulmoides for its carbon sequestration capacity. Third, the MaxEnt model was used to predict the distribution probability maps of the ecological suitability of E. ulmoides under current and future climatic conditions. This study aims to answer the following questions: (1) Can the inclusion of red-edge spectral bands and their normalized vegetation indices improve the accuracy of E. ulmoides identification? Which spectral bands can be more effective for E. ulmoides identification? (2) What is the carbon sequestration capacity of E. ulmoides? Does it have high ecological benefits? (3) If the artificial cultivation of E. ulmoides is developed, how are its ecological suitability zones distributed? How should planting planning be carried out?
2. Materials and Methods
2.1. Study Area
Ruyang County is located in the western part of Henan Province, at longitude 112°8′~112°38′ E and latitude 33°49′~34°21′ N. The total area is 1325 km
2, of which more than 900 km
2 is mountainous, accounting for 70.2% of the total area [
11]. The topography of the study area is complex, with continuous mountainous ranges in the south and plains and hills in the north. The ambiguous temperate continental monsoon climate makes the study area well-lit, with a mild climate and four distinct seasons. The average annual sunshine hours are 2177.3 h, the sunshine percentage reaches 49%, the average annual temperature is 14 °C, the average annual rainfall is 690 mm, and the annual frost-free period is 213 days. The location of the study area and GF-6 images are shown in
Figure 2.
2.2. Data
2.2.1. In Situ Reference Data
Ground samples of four land cover types (cropland, other forests, urban area, and waterbody) were visually identified from Google Earth high-resolution images in terms of polygons. These sample polygons were resampled to generate randomly placed points for each cover type (
Table 1). The individual fields of
E. ulmoides were collected in a field campaign in July 2020.
E. ulmoides sample points were randomly extracted from each field under the condition that the minimum distance between any two points must be no less than 20 m. The number of sample points for the five land cover types is shown in
Table 1. These samples are divided into training and testing sets in the ratio of 3:1.
2.2.2. Satellite Data Preprocessing and Feature Extraction
This study used satellite image data from the China Centre for Resources Satellite Data and Application (
https://data.cresda.cn/ (accessed on 6 July 2023)) Gao Fen-6 (GF-6) and the Wide Field of View (WFV) satellite images, with a width of 800 km. In addition to the common blue, green, red, and near-infrared bands, the red-edge band, which can effectively reflect the unique spectral characteristics of crops, was added for the first time (
Table 2), which can provide more detailed spectral information for vegetation studies. Nine images were acquired using the WFV sensor of the GF-6 satellite on 9 May, 28 June, and 9 September 2021.
Similarly, the 20 monthly GF-6 satellite images covering the study area from January to December 2022 were obtained to estimate NPP. These images were all selected when the cloud cover was less than 10% and covered the whole territory of Ruyang County.
The dates of the selected remote sensing image were mainly based on the following consideration: the trees in the forest grow slowly in two years. The difference between the acquisition time of the sample plot data and the remote sensing data was less than two years, which had little effect on the results.
The acquired GF-6 WFV images were preprocessed with radiometric calibration, atmospheric correction, and ortho-correction. The specific process was as follows:
First, the band DN values of the data were converted to radiance values based on the calibration coefficients provided by the China Centre for Resources Satellite Data and Application (CRESDA), which are given using the following formula:
where
is the cell value as radiance;
is the gain value for a specific band;
is the cell value digital number;
is the bias value for a specific band.
Second, atmospheric correction was performed using the FLAASH (Fast Line-of-sight Atmospheric Analysis of Spectral Hypercubus) module, which is designed to remove atmospheric effects.
Third, with the support of the Global Multi-resolution Terrain Elevation Data 2010 (GMTED2010), the ortho-correction was performed, and the error was required to be within 1 pixel.
Apart from the eight bands of the GF-6 WFV, the normalized difference vegetation index (NDVI) and red-edge indices (
Table 3) were generated for each GF-6 image.
2.2.3. Vegetation Type Data, Meteorological Data, and MOD17A3HGF Product Dataset
Vegetation-type data were obtained from the National Cryosphere Desert Data Center. The monthly mean temperature and monthly total precipitation were obtained from the National Oceanic and Atmospheric Administration (NOAA) and the National Centers for Environmental Information (NCEI). Monthly total solar radiation data were obtained from NASA Goddard Earth Sciences (GES) Data and Information Services Center (DISC); the MOD17A3HGF product dataset was obtained from the Land Processes Distributed Active Archive Center (LP DAAC) [
26].
2.2.4. Nineteen Bioclimatic Variables Data
Nineteen bioclimatic variables were selected from the WorldClim data website (
http://www.worldclim.org/ (accessed on 6 July 2023)) for the ecological suitability area study (
Table 4). The near-current climate simulation data were selected for the period 1970–2000 at a resolution of 30 arc seconds. Future climate data were selected from the ssp245 climate scenario (2041–2060) of the BCC-CSM2-MR dataset product at a resolution of 30 arc seconds.
2.3. Methods
The workflow used in this research is provided in
Figure 3.
In the first step, the optimal time window selection study used the images of the different growing seasons of Ruyang E. ulmoides, including the satellite remote sensing images in May, June, and September, and selected the optimal time phase of Ruyang E. ulmoides based on different combinations of wave bands and vegetation indexes with the judgment of J–M distance.
The second step was optimal feature selection and classification. The classification method of random forest is used for classification, and by comparing the classification results of different models, the model with the highest precision is selected to extract the regional distribution information of Ruyang County E. ulmoides.
The third step was to assess the carbon sequestration capacity of E. ulmoides. The CASA model was used to estimate the NPP of Ruyang County, and the results were compared with the MODIS NPP products for verification. Based on the remote sensing extraction results of E. ulmoides and the NPP estimation results of Ruyang County, the NPP value of E. ulmoides was obtained, which was used as an index to evaluate the carbon sequestration capacity of E. ulmoides.
The fourth step was determining an ecologically suitable area for E. ulmoides in Ruyang. We combined the results of the remote sensing classification of E. ulmoides distribution and E. ulmoides survey sample points using the climate variable factors. Based on the MaxEnt model, the study of an ecologically suitable area for E. ulmoides in Ruyang County for the contemporary and future years of 2041–2060 was carried out, and the trend of E. ulmoides distribution in Ruyang County was predicted to change in the future under the influence of climate. The distribution trend of Ruyang E. ulmoides under the influence of future climate was predicted.
Finally, based on the above results, we assessed the carbon sequestration capacity of E. ulmoides in Ruyang County and its ecological suitability zoning based on the satellite images of GF-6.
2.3.1. Remote Sensing Identification of E. ulmoides Distribution Area
The Jeffries–Matusita (J–M) distance is defined as the ratio of inter-class spectral variability to intra-class spectral variability [
27]. Inter-class variability and intra-class variability are used to measure whether the feature set can distinguish different land use types effectively, and the feature set that produces the most internally consistent class and the biggest difference between the different classes is the optimal feature set [
28]. In this study, the J–M distance was chosen to determine the spectral separability between feature classes. J–M distance was an important parameter to judge the separability between samples. Using J–M distance analysis, the identification ability of
E. ulmoides in red-edge band data can be preliminarily judged [
29]. The formula to determine the J–M distance is as follows:
In the formula, is the J–M distance between category and category ; B denotes the baroclinic distance of a certain feature dimension; and denote the sample means of category and on a certain feature, respectively; and denote the standard deviation of category and on a certain feature, respectively. takes a value between 0 and 2, and the larger the value is, the higher the separability of the sample data set in the spectral space and the better the classification result. When the value of is between 1.8 and 2.0, it means that the separability of the sample data set in the spectral space is optimal, and the larger the value, the higher the accuracy of feature classification.
Random forest (RF) [
30] is a classifier that trains and predicts samples via an integrated learning approach [
31]. This algorithm integrates multiple decision trees and is a highly flexible machine learning algorithm. RF has been widely used for remote sensing classification, as it runs efficiently on large databases and performs well with high-dimensional features. In this study, we used the RF classifier for classification. The RF classifier mainly includes two important parameters: (1) the number of decision trees and (2) the maximum number of features in each tree. Theoretically, the more trees, the better the classification result, but at the same time the classification time increases. Therefore, we need to find a reasonable number of trees. Studies have shown that when the number of trees exceeds 400, the OOB (out-of-bag) error for each classification case tends to stabilize [
32]. To ensure the accuracy of classification and minimize the computation time, we set the number of trees to 500. In general, we took the square root of the total number of input features as its value.
The process of using RF for E. ulmoides plantation area extraction was as follows: first, sample datasets of different feature types (urban areas, waterbody, cropland, E. ulmoides, and other forests) were selected in the remote sensing images of the study area based on the ground interpretation marker point data collected in the field; second, based on the selected sample datasets, the training set was randomly selected, and the decision tree was generated by randomly selected features; finally, RF was used to automatically classify the remote sensing datasets of the study area.
A confusion matrix is a concept from machine learning, which contains information about actual and predicted classifications via a classification system. A confusion matrix has two dimensions; one dimension is indexed by the actual class of an object, and the other is indexed by the class that the classifier predicts.
Figure 4 presents the basic form of the confusion matrix for a multi-class classification task, with the classes A
1, A
2, and A
n [
33].
The accuracy verification of the
E. ulmoides distribution extraction results is to use the field investigation
E. ulmoides distribution points as the verification dataset and use the confusion matrix method [
34] to select the overall accuracy (OA), Kappa coefficient, user accuracy (UA also referred to as precision), and producer’s accuracy (PA also referred to as recall) as evaluation indexes to evaluate the accuracy of the
E. ulmoides classification results in Ruyang County. The overall accuracy was calculated as follows:
where
is the total number of segments,
is the number of classes,
is 1 if the reference label for segment
is
and 0, and
is 1 if the map label for segment
is
. The true classification of segment
is indicated as
= 1, where the reference and map classes for segment
are equal. For area-based metrics,
is the area of segment
. For count-based metrics,
is 1.
The producers’ accuracy (recall) indicates the probability that an object belonging to class
is correctly classified as follows:
The users’ accuracy (precision) indicates the probability that an object mapped as belonging to class
does actually belong to that class as follows:
The F1 score is a more valuable measure than OA in the case of an unequal distribution of categories, as it is a weighted average of precision and recall. The F1 score for each class is calculated as follows:
2.3.2. Assessment of E. ulmoides Carbon Sequestration Capacity
CASA is a light energy utilization model driven by a combination of remote sensing, meteorological, vegetation, and soil type data [
35,
36]. NPP is mainly determined using two variables absorbed via vegetation: Absorbed Photosynthesis Active Radiation (APAR) and light energy utilization (ε). Therefore, NPP can be expressed as the following equation [
37,
38]:
In the formula, APAR and ε are calculated using the following formula:
where SOL
represents the total solar radiation at the pixel
of
month (MJ·m
−2 month
−1).
In the formula, SOL
represents the total solar radiation (MJ·m
−2 month
−1) at the pixel
of
month; FRAR
represents the absorption ratio of the photosynthetic active radiation of the sun incident by the vegetation layer; 0.5 refers to the proportion of the solar effective radiation used by the vegetation in the total radiation;
is the efficiency with which plants convert absorbed photosynthetically active radiation into organic carbon;
is the extent to which the net primary productivity of plants is reduced due to the restriction of photosynthesis caused by the physiological effects of plants at low and high temperatures;
showed a decreasing trend of energy utilization when the optimum growth temperature changed to high and low temperature;
is the limit degree of water state on light energy use efficiency;
is the maximum light energy utilization under ideal conditions [
39].
In this study, we used the NPP estimation program developed by Zhu Wenquan et al. [
39] based on the CASA model, which was installed in the ENVI (The Environment for Visualizing Images) software. The NPP estimation program has input boxes such as static parameter files, vegetation type maps, NDVI time series, monthly mean temperature, monthly total precipitation, and monthly total solar radiation, as well as output paths. The static parameter files are the maximum and minimum values of NDVI, the maximum and minimum values of SRVI, and the maximum light energy utilization corresponding to each vegetation type, which can be obtained by searching for the relevant regional literature or automatically configured via the NPP software based on the NDVI time series corresponding to each vegetation type, and the method chosen in this study is the automatic configuration. The pixel size and projection of the vegetation type data should be the same as that of the NDVI data. The NDVI was obtained by preprocessing the downloaded 12-month remote sensing images with ENVI and then using the NDVI calculation function. Meteorological data were processed by downloading the 12 month monthly mean temperature, monthly total precipitation, and monthly total solar radiation data from the weather stations, interpolating the meteorological data into kriging space using ArcGIS to form spatially continuous month-by-month climate change data, and obtaining the raster image of the meteorological data that was also identical to the pixel sizes and projections of the NDVI data. Finally, these data were input into the CASA model to estimate the NPP of the study area.
The validation of NPP can be carried out using two methods: the measured value validation method and the relative validation method. Due to the lack of measured data, this study used the indirect validation method to compare the CASA model NPP-inversion results with MOD17A3HGF NPP data. The MOD17A3NPP product dataset was obtained by Running et al. [
40] using the BIOME-BGC model (biome biogeochemical model) and light energy utilization model simulation. Currently, this product can estimate the spatial and temporal changes in NPP in global ecosystems and has been validated and widely used in the evaluation of different vegetation growth conditions, environmental monitoring, and carbon cycle studies. Therefore, in this study, 30 points were randomly generated in the study area, and the MOD17A3HGF NPP values and the NPP results estimated using the CASA model were extracted from these 30 points to validate the model’s estimation of Ruyang County’s NPP. The root mean square error (RMSE) and coefficient of determination (R
2) were used in this study to measure the accuracy of the CASA model [
41].
where
is the MOD17A3 NPP value for the Nth
E. ulmoides study site, and
is the NPP value estimated using the CASA model for the Nth
E. ulmoides study site.
2.3.3. E. ulmoides Ecologically Suitable Area in Ruyang
Species distribution models (SDMs) are used extensively in the field of landscape ecology and conservation biology since their origin in the late 1980s. But, there is still a void in the field, i.e., a universal modeling approach for SDMs. MaxEnt is a widely expected algorithm due to its robust and nonlinear modeling techniques [
42]. MaxEnt models can satisfy all known variables without any subjective assumptions, which is not present in earlier SDM models (such as Bioclim/DOMAIN) [
43]. A study attempted to establish the relation between species occurrence data and their respective environmental predictor variables. The yearly trend of each parameter was analyzed to observe the variations throughout the year, and a pixel-wise mean value was calculated to be used in the SDM. Machine learning algorithms, namely MaxEnt, boosted regression trees (BRT), RF, and generalized linear model (GLM), were implemented to establish the relationship between predictor variables. The AUC-based performance evaluation metric was generated, and it was found that MaxEnt performs better than others. The model is more tolerant of small samples, irregular samples, and site bias data and is preferred for predicting the potential distribution zone of rare species [
44,
45].
The geographic distribution points and environmental variables of E. ulmoides were imported into the MaxEnt 3.4.1 software for modeling operations. In total, 75% of the distribution data were randomly selected as the training set and 25% as the test set. The maximum number of iterations was set to 1000, and Bootstrap was selected to create different sets of test and validation numbers for each iteration. The calculation was repeated 10 times, and the jack-knife method was turned on to calculate the effects of the environmental variables on the distribution of E. ulmoides, and the response curves of each environmental variable were plotted. The results were output in logistic form, the raster values were survival probabilities (p-values), and the output file was in .asc format.
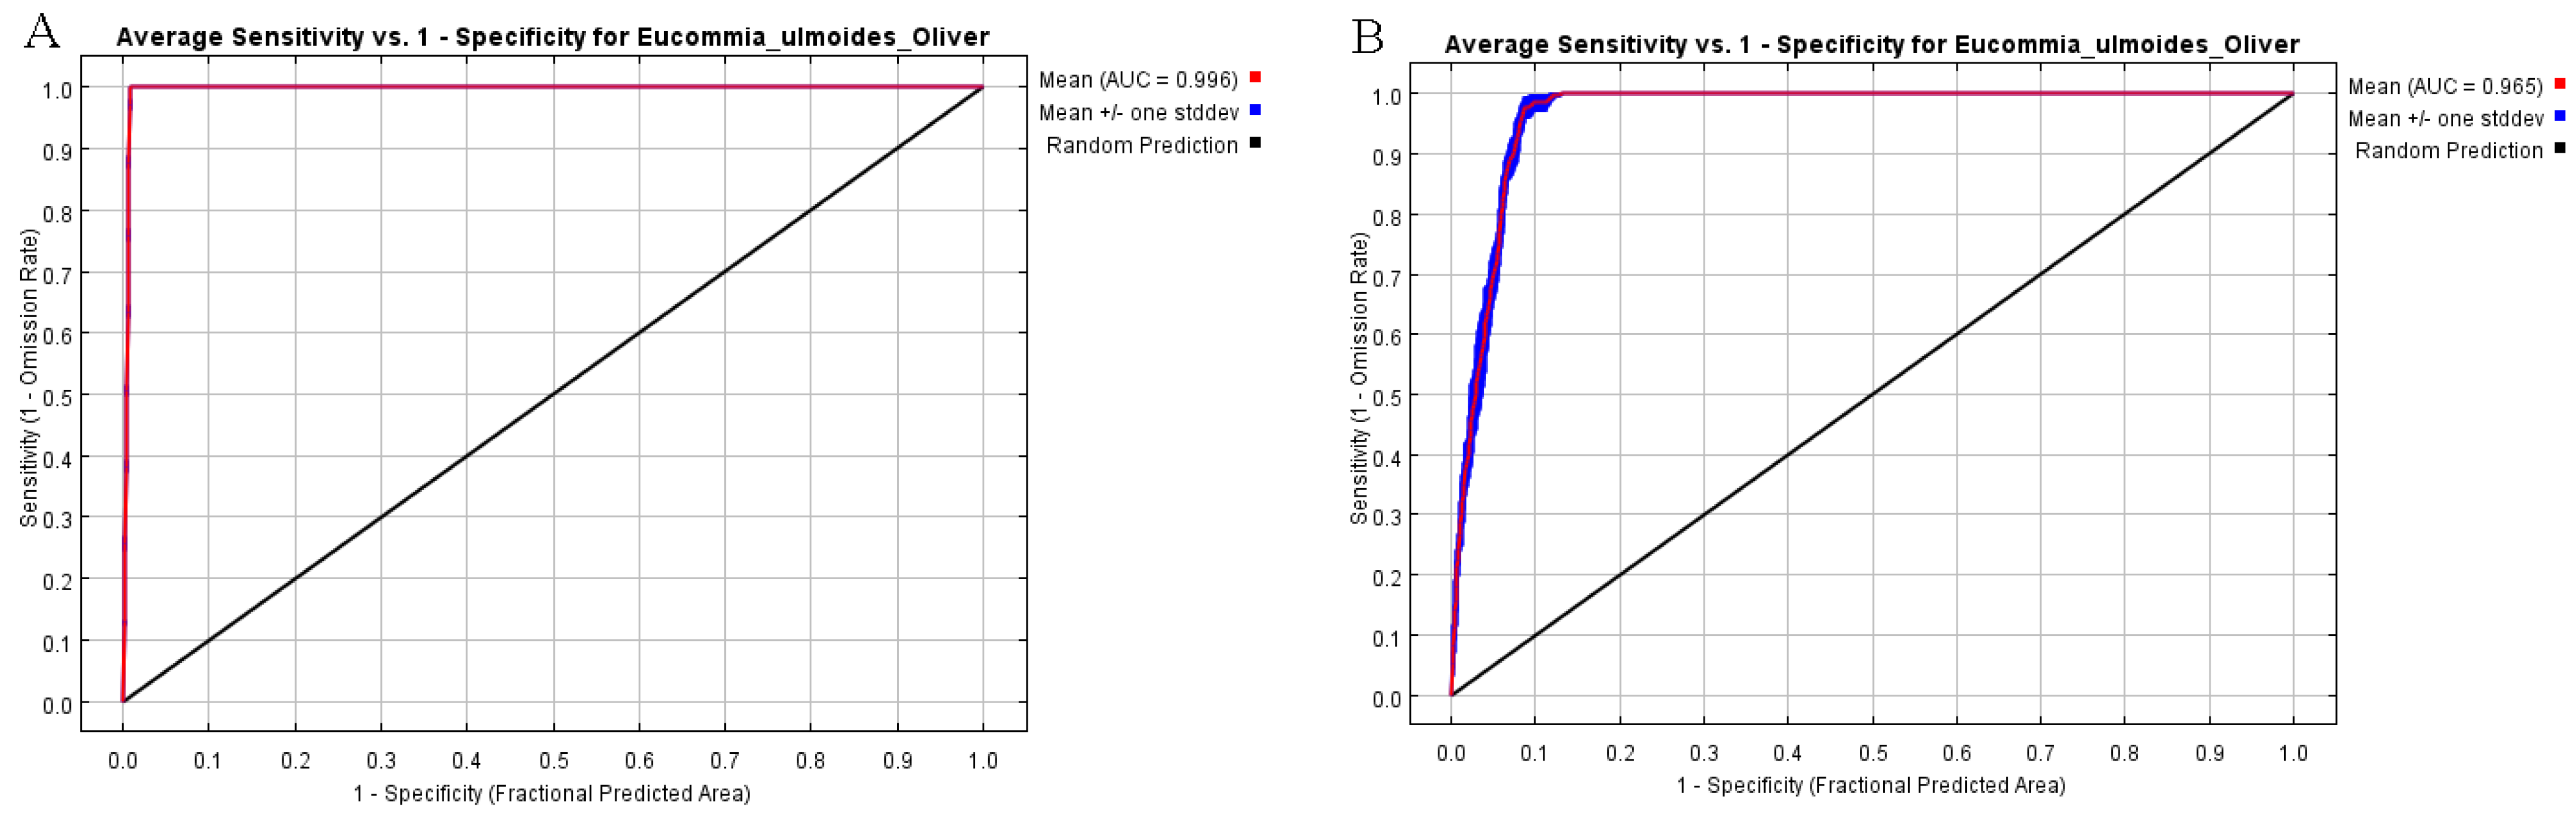
The prediction results of the model were evaluated using the range of area under curve (AUC) values. The AUC value was the area under the receiver operating characteristic (ROC) curve plotted with specificity as the horizontal coordinate and sensitivity as the vertical coordinate. The value of AUC ranged from 0 to 1. A larger value indicated that the farther away it is from the random distribution, the better the prediction.
4. Discussion
The main objective of this study was to assess the potential variables of GF-6 data and construct different models to determine the distribution area of E. ulmoides based on reliable field survey data. On this basis, the carbon sequestration capacity of E. ulmoides was assessed and its ecological suitability zoning was predicted to provide data support for its sustainable utilization and rational layout. It is particularly important to use remote sensing imagery to establish an identification model of E. ulmoides to estimate and map the distribution area of E. ulmoides. One of the reasons for this is that E. ulmoides is not only a valuable traditional Chinese medicine but also a source of rubber; not only can it be used as a medicinal resource, but it can also be used as an industrial raw material. It is also an important part of China’s forestry industry. Based on this study, we can effectively utilize the GF-6 remote sensing data and RF classification algorithm to spatially map the distribution area of E. ulmoides. In addition, the assessment of the carbon sequestration capacity of E. ulmoides reveals that E. ulmoides has the advantages of a large carbon sink, low cost, and high ecological added value, which makes us realize the great potential of E. ulmoides in ecological conservation. Therefore, the key to increasing the storage capacity and carbon sink of E. ulmoides lies in vigorously developing the artificial cultivation of E. ulmoides, and the study of E. ulmoides ecologically suitable zoning can clarify the suitable zones of E. ulmoides in the present and future climatic conditions and provide data support for the selection of artificial cultivation areas of E. ulmoides.
Based on the spectral bands and vegetation indices extracted from GF-6 data, this study has shown that the red-edge band was the more important variable when estimating the distribution area of
E. ulmoides using the RF method, which had been confirmed in recent studies concerning red-edge band [
46] and crop species classification [
47]. In the gross primary productivity field (GPP), Lin et al. found that the red-edge band was useful for estimating the GPP and noted that the red-edge reflectance was sensitive to the leaf chlorophyll content [
48]. Therefore, the red-edge band of GF-6 is an important variable in the study of
E. ulmoides identification. Although the methodology used to study the identification of
E. ulmoides planting areas obtained the optimal feature sets of
E. ulmoides and achieved good classification results, some limitations of this study should be noted. First, this study used J–M distances when calculating pairwise separability. Other indicators could be used to quantify the inter-class separability as well. Second, due to the ruggedness of the mountainous terrain and the inaccessibility of some areas, the distribution of the
E. ulmoides sample points from the field survey was uneven, and the sample data were lacking, which made this approach still unable to avoid the modeling bias caused by the uneven distribution of the data values of the sample. Third, the feature set used for classification in this study involves only the spectral features of the image, not the texture features or other index features of the image. Subsequently, a classification model will be constructed based on a variety of feature sets of the image, and comparisons will be made to study the effect of other features, such as texture, on the results of the recognition of
E. ulmoides. Finally, although the RF algorithm has been shown to provide excellent performance, the phenomena of the overestimation of low values and the underestimation of high values always exist. The innovation of the algorithms to address this problem will be a future research direction.
As ecological problems become more and more prominent, people pay more and more attention to the carbon sequestration capacity of vegetation. NPP is an important indicator to reflect the carbon sequestration capacity of vegetation. Due to the limitations, it is usually difficult to realize in situ measurements of NPP at large scales. Among the many models for NPP estimation, the CASA model has been widely used in large-scale studies worldwide because it integrates the effects of different natural factors on vegetation NPP [
49]. In this study, the 16 m GF-6 WFV image was utilized for the estimation of NPP in Ruyang County instead of the MODIS image (1 km) that is commonly used in the literature, and the results were compared with the MOD17A3HGF product data. The distribution of NPP in Ruyang County shows that it is basically consistent with the distribution of land cover types in Ruyang County. The NPP values of the land cover types were ranked as other forests >
E. ulmoides > cropland > waterbody ≈ urban areas. In addition, a high correlation can be seen based on the comparison of MOD17A3HGF data with CASA estimates under randomized sample points. Therefore, the results of this study are worthy of being trusted, which, in turn, proves that the CASA model can be used with high-resolution data to calculate the NPP for the county and smaller scales of the study area. However, it is very unfortunate that the actual NPP was not measured, so it was not possible to compare it with the model estimates of NPP. In the follow-up study, we will collect the measured data to compare whether the estimation of NPP with different resolutions using the CASA model in small-scale space will affect the estimation results and how reasonable is the spatial resolution and other extensible issues to provide a reference for the optimization of the CASA model.
In this study, the MaxEnt model predicts the results of the suitable distribution area of E. ulmoides, which is mainly affected by the points of the E. ulmoides subsample, and the bias of the sample may result in the bias of the results.
Using the E. ulmoides classification results to clarify the E. ulmoides distribution information has the following advantages for the ecological study of E. ulmoides: 1. It is not limited to the E. ulmoides distribution point information in the current database. It can be targeted to research a certain region. 2. Good data include timeliness, satellite remote sensing image data availability, and timely data that can also provide timely information on the distribution of E. ulmoides. This study can provide a new way of conducting ecological research on a larger scale of E. ulmoides in the future.
5. Conclusions
In all three time phases, the J–M distances between E. ulmoides and the remaining four features increased correspondingly with the involvement of the red-edge band compared to the no-red-edge band, and the separability was enhanced. The J–M distance between E. ulmoides and the other four surface features was the largest, and the separability was the strongest when the red band and vegetation index were involved together. When the red edge band and vegetation index were involved together, it was found from the relative ratio of three times that on 9 September, E. ulmoides and other features had the greatest separability. Therefore, 9 September is the best time for E. ulmoides extraction. In terms of classification accuracy, the OA, Kappa coefficient, and E. ulmoides UA were the lowest when no red-edge band and vegetation index were involved in the classification. When the red-edge band 6 and its derived red-edge vegetation index NDVI750 participated in the classification, the OA, Kappa coefficient and E. ulmoides PA were the highest, which were 96.62%, 0.953, and 92.00%, respectively, indicating that the red-edge band information could make the image more accurately distinguish E. ulmoides and other features.
The comparison of E. ulmoides NPP results with MODIS NPP product values shows that the CASA model is not only suitable for NPP estimation in Ruyang County but also has high accuracy. Based on the distribution of suitable planting zones for E. ulmoides in the north and south of Ruyang County and the current and future distribution, it is suggested that relevant departments should gradually focus on the planting area of E. ulmoides in the central and southern parts of Ruyang County, where climatic factors such as precipitation in the driest season, seasonal changes in temperature, iso-temperature and average monthly temperature are more suitable, which is conducive to increasing E. ulmoides yield. Moreover, it is more conducive to a more effective combination of agricultural production zones and plant carbon sequestration in the future climate and provides a reference for relevant agricultural management departments to optimize the industrial layout and guide the development of advantageous industries in townships.

 ,
, 


