
Analytical Performance of the Factory-Calibrated Flash Glucose Monitoring System FreeStyle Libre2TM in Healthy Women
 , ,
, ,  , , and
Abstract
:1. Introduction
2. Methods
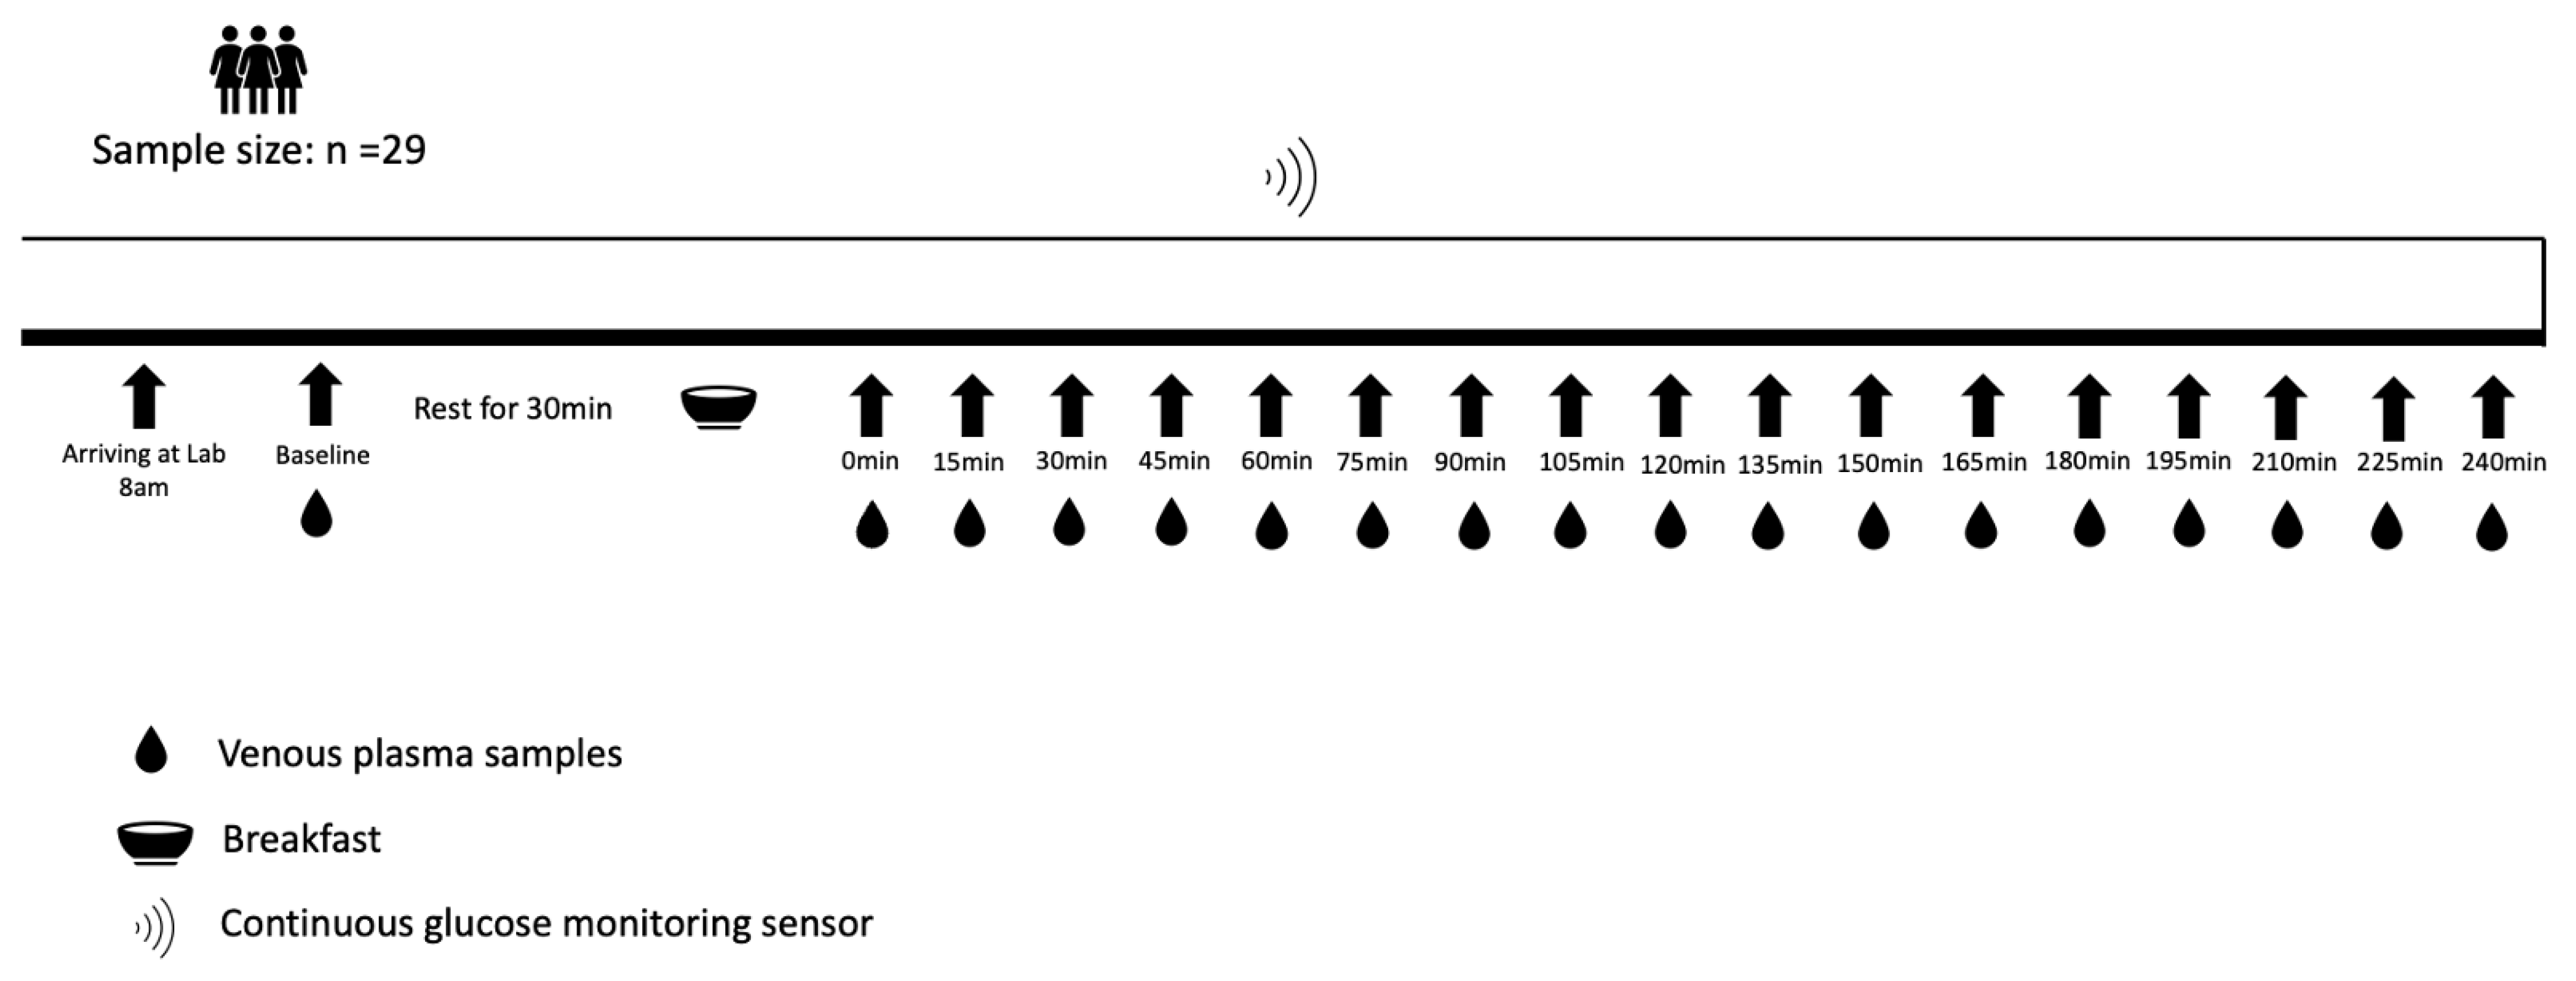
2.1. Participants
2.2. Study Design
2.3. FreeStyle Libre2TM CGM Sensor
2.4. Blood Samples
2.5. Statistical Analyses
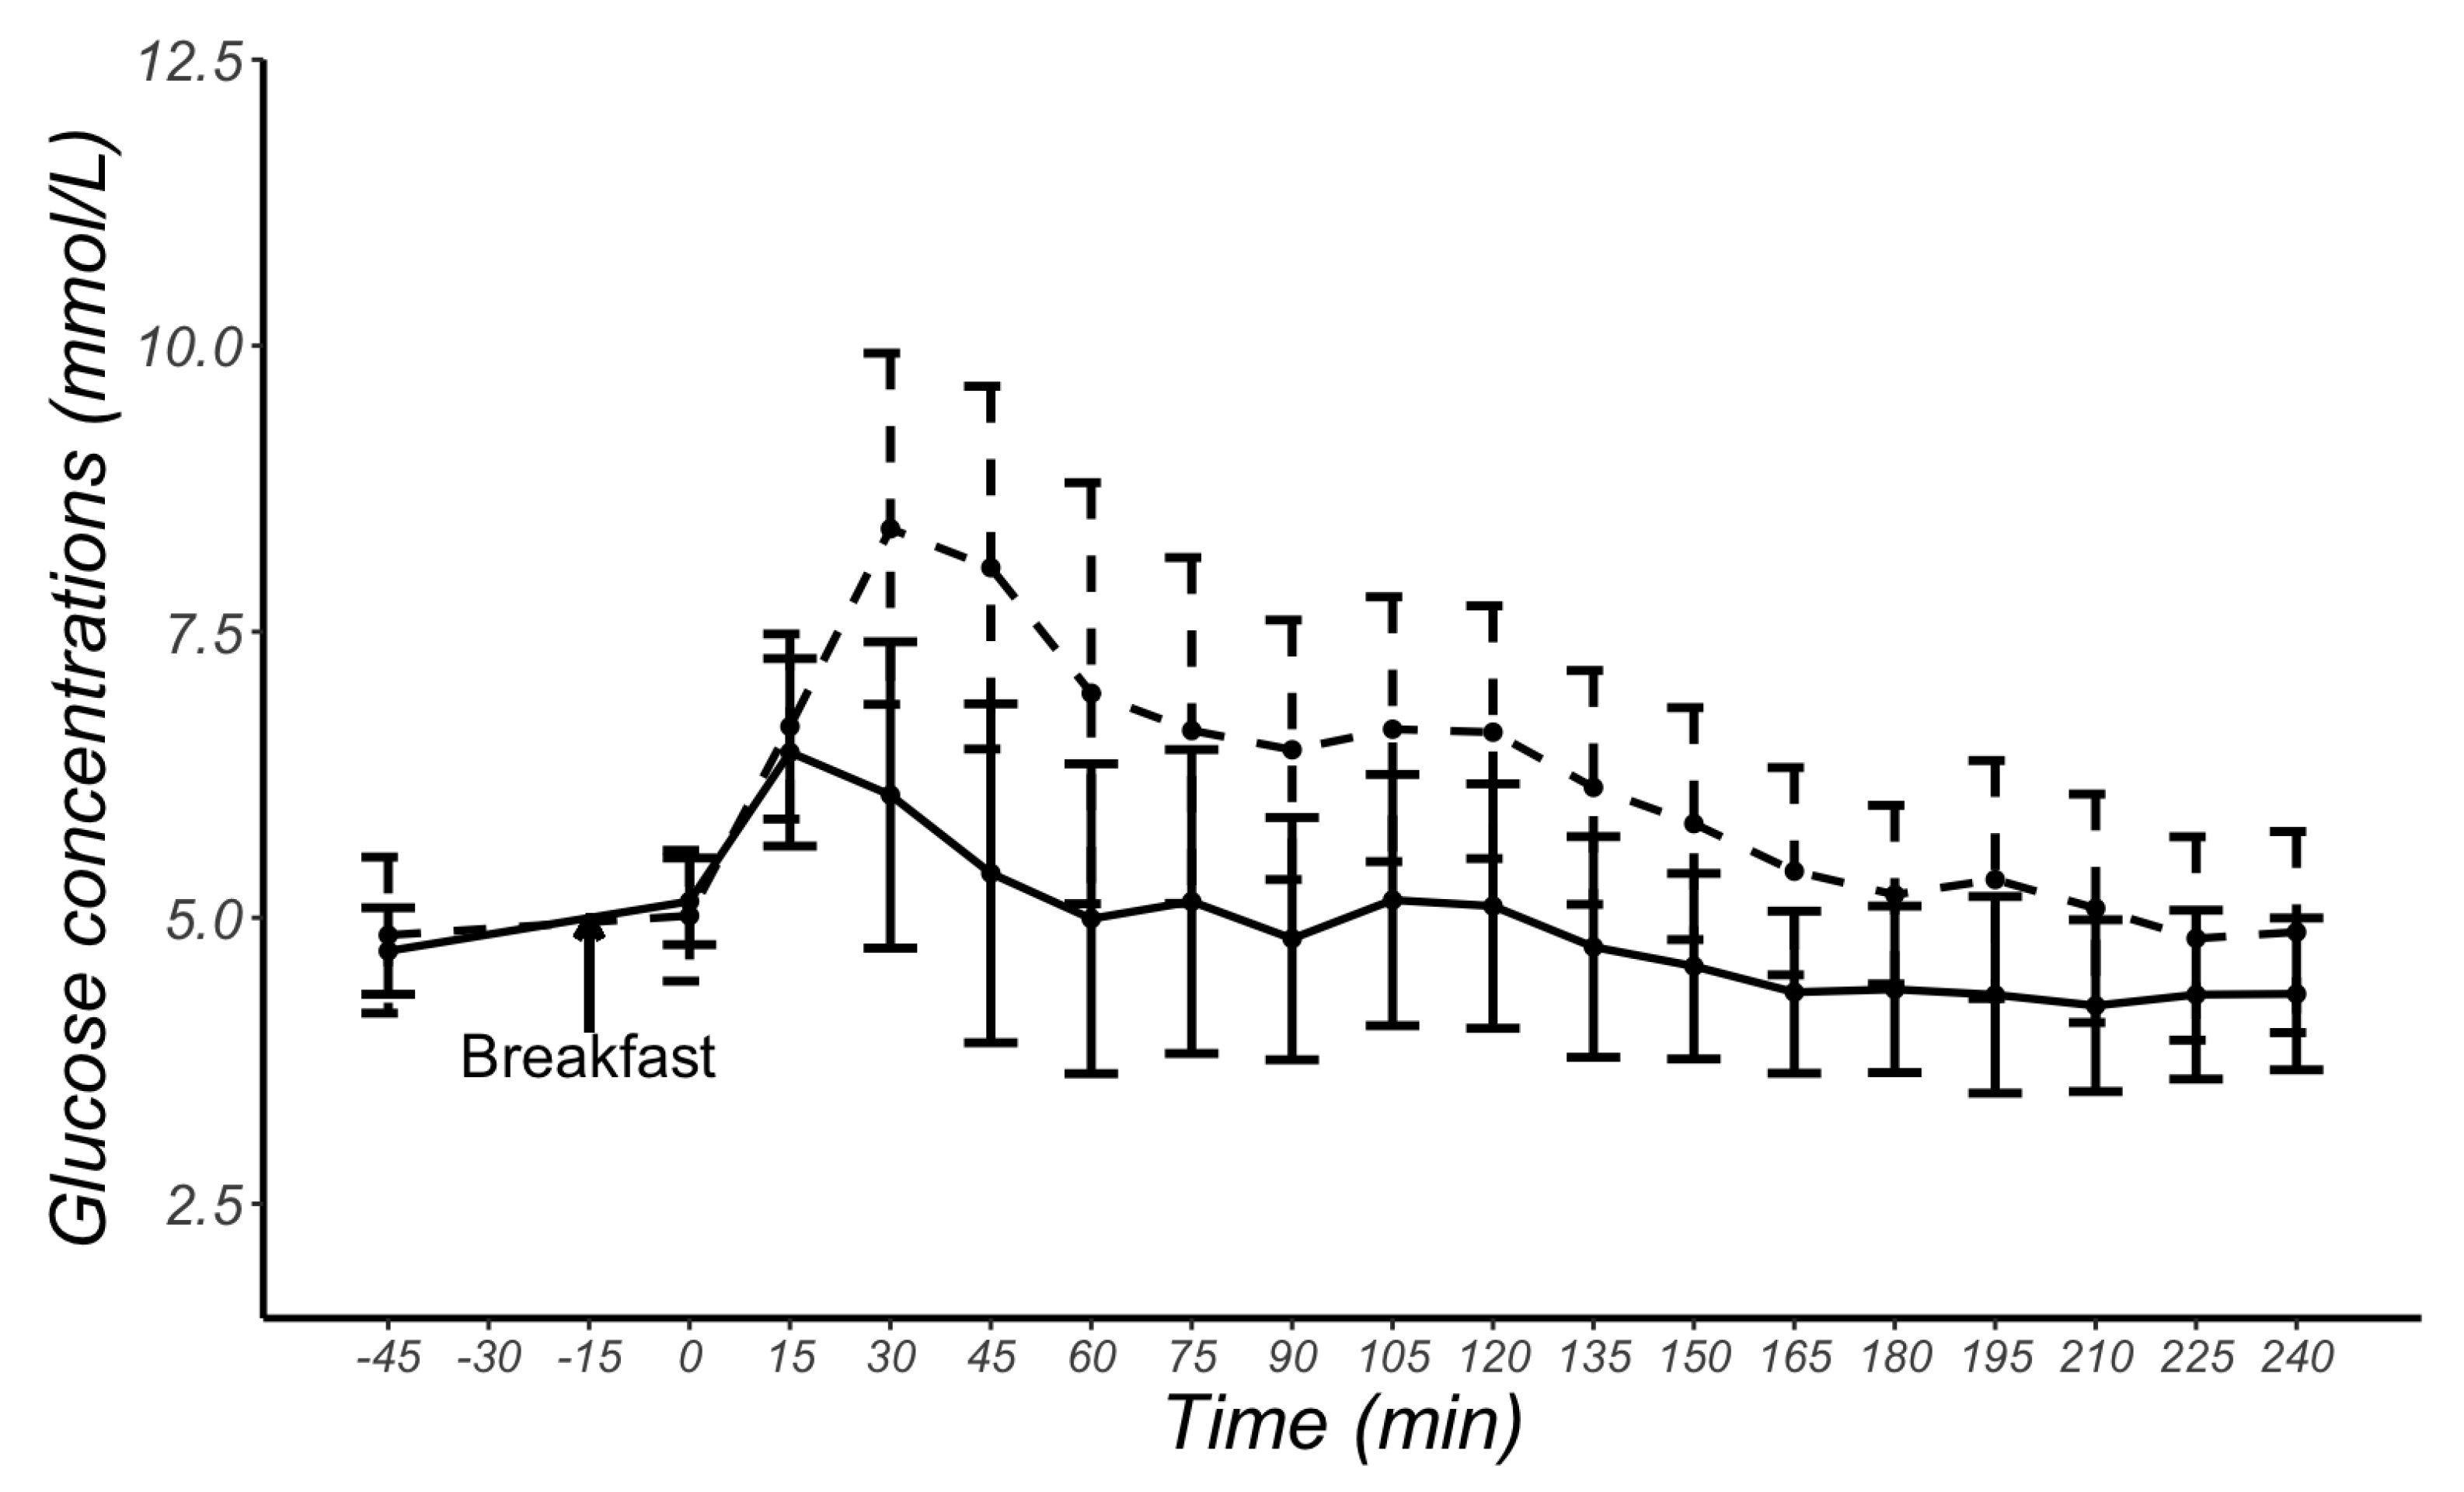
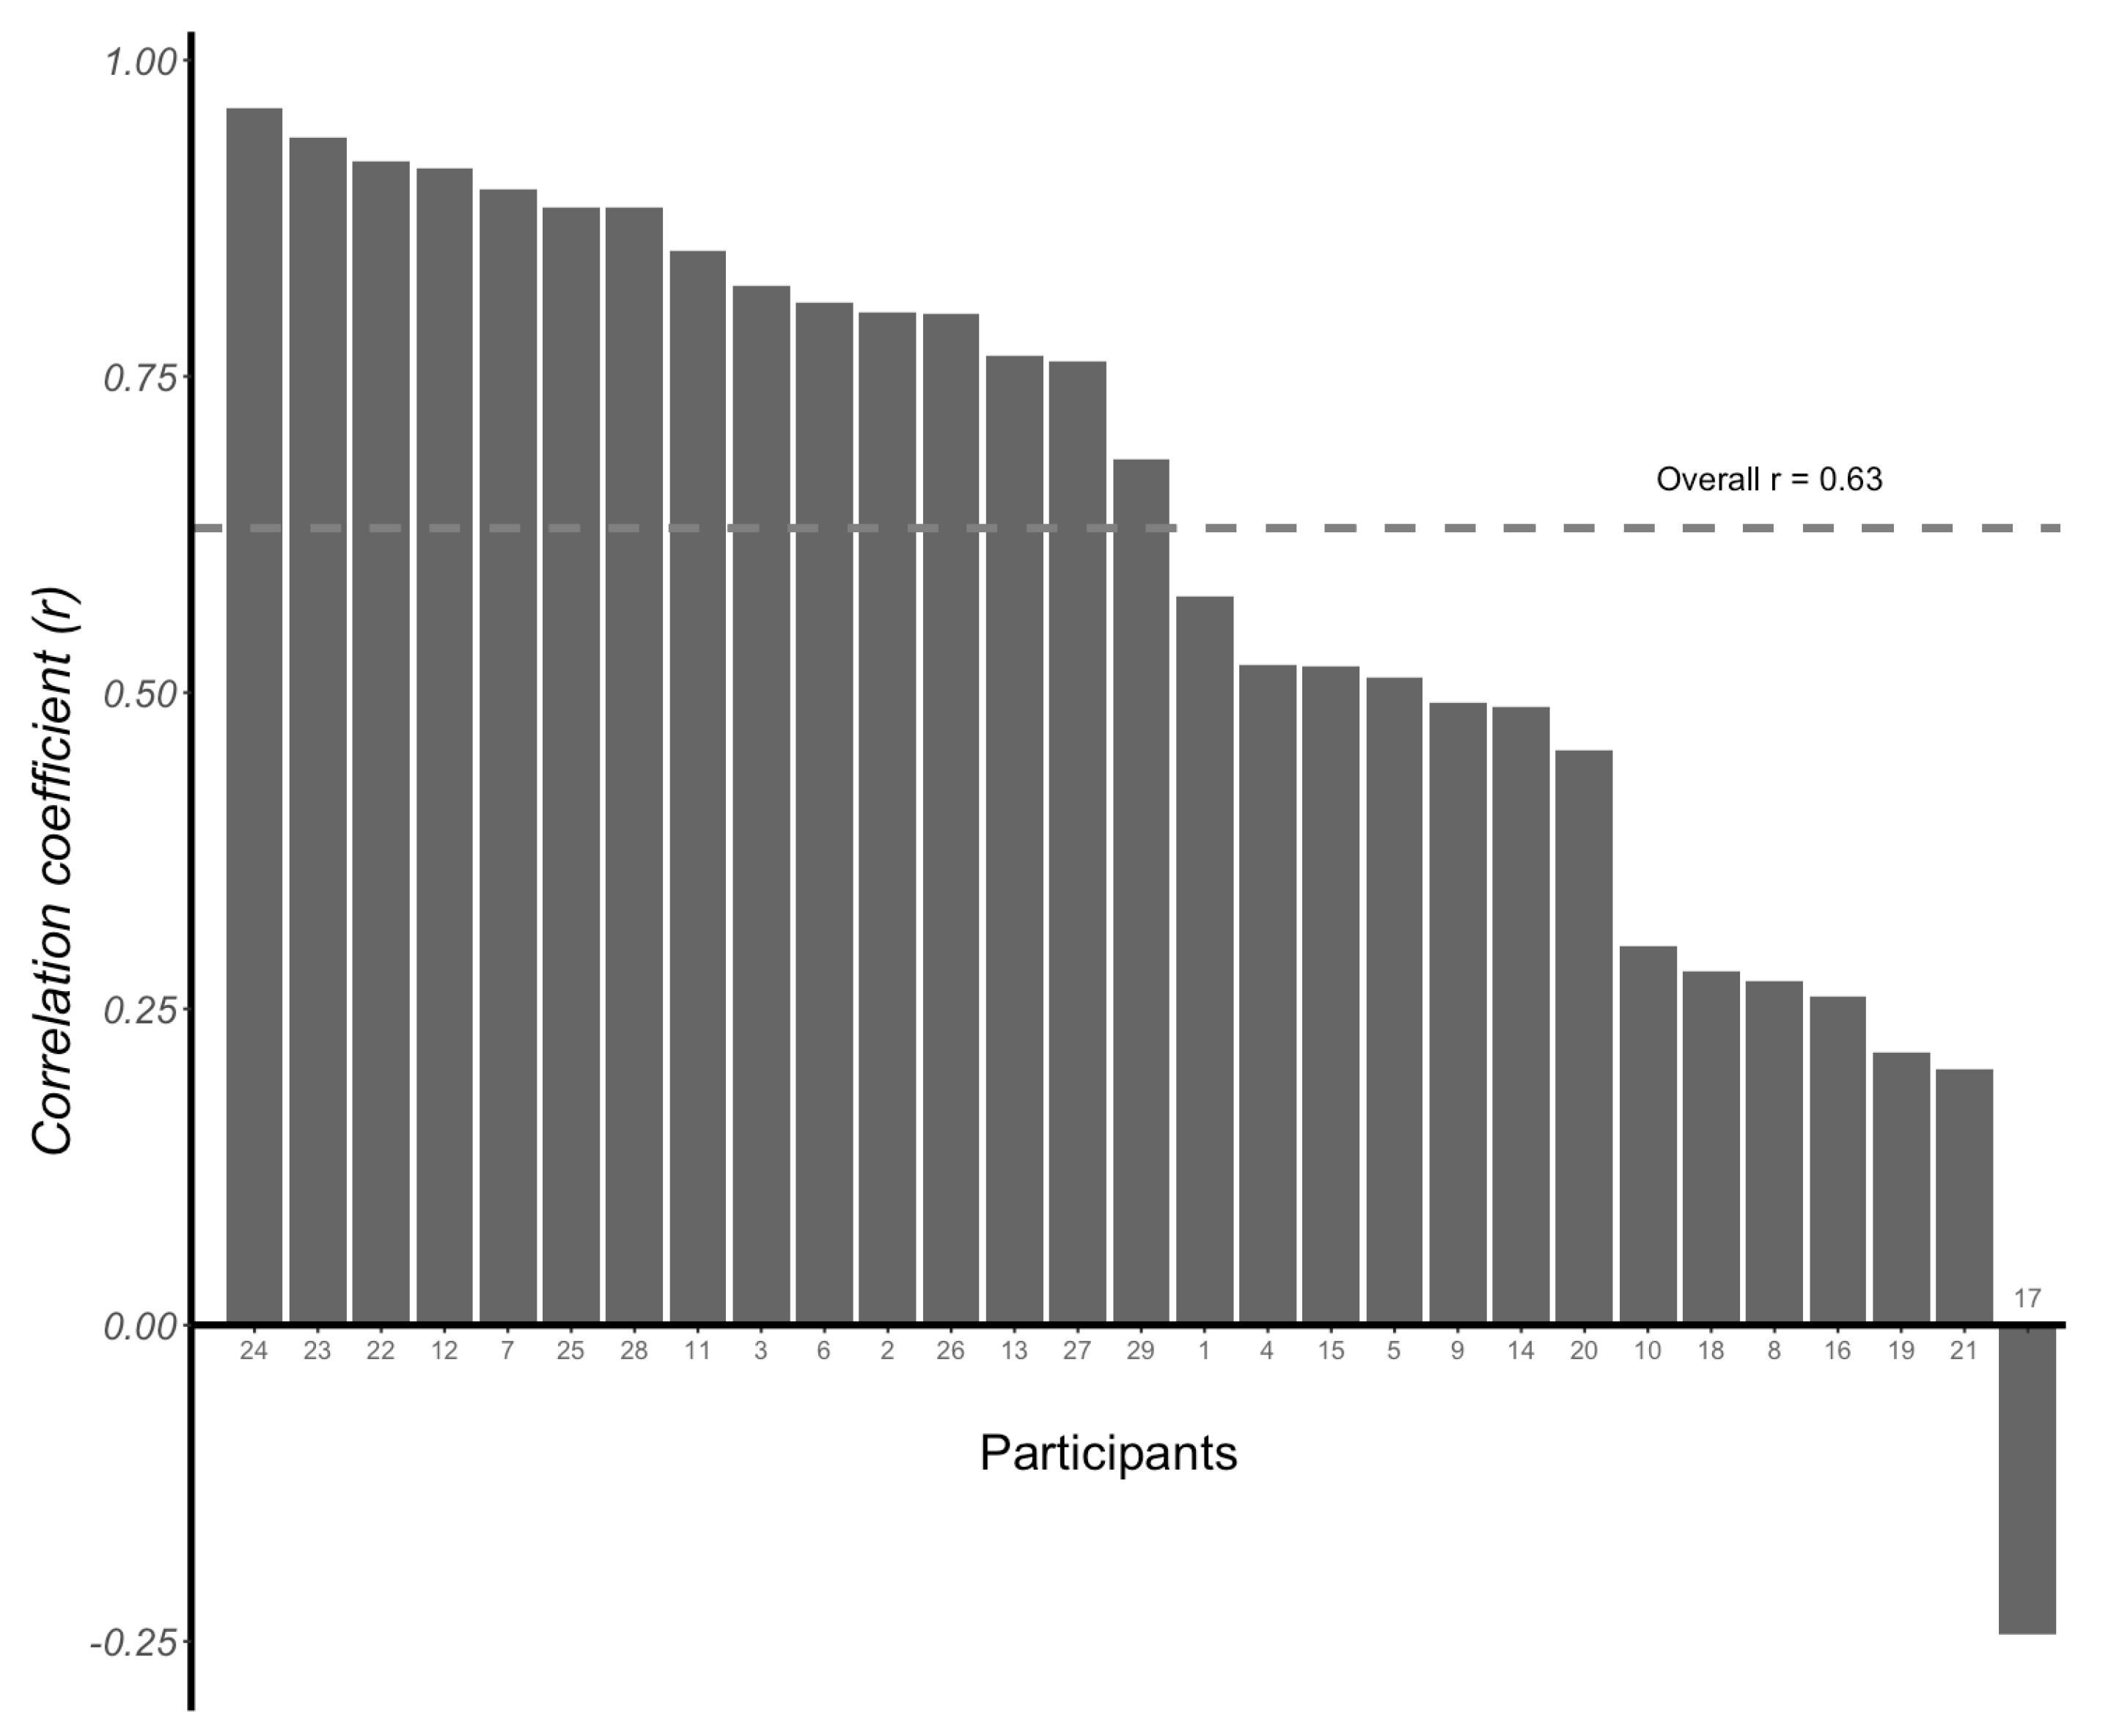
3. Results
4. Discussion
5. Conclusions
Author Contributions
Funding
Institutional Review Board Statement
Informed Consent Statement
Data Availability Statement
Acknowledgments
Conflicts of Interest
Abbreviations
| CGM | Continuous Glucose Monitoring |
| VPG | Venous Plasma Glucose |
| EGA | Error Grid Analysis |
| MARD | Mean Absolute Relative Difference |
| ISO | International Organization for Standardization |
References
- Ji, L.; Guo, L.; Zhang, J.; Li, Y.; Chen, Z. Multicenter Evaluation Study Comparing a New Factory-Calibrated Real-Time Continuous Glucose Monitoring System to Existing Flash Glucose Monitoring System. J. Diabetes Sci. Technol. 2021, 17, 208–213. [Google Scholar] [CrossRef] [PubMed]
- Moser, O.; Mader, J.K.; Tschakert, G.; Mueller, A.; Groeschl, W.; Pieber, T.R.; Koehler, G.; Messerschmidt, J.; Hofmann, P. Accuracy of continuous glucose monitoring (CGM) during continuous and high-intensity interval exercise in patients with type 1 diabetes mellitus. Nutrients 2016, 8, 489. [Google Scholar] [CrossRef]
- Beck, S.E.; Kelly, C.; Price, D.A.; Aronoff, S.; Bao, S.; Bhargava, A.; Biggs, W.; Billings, L.; Blevins, T.; Bode, B.W.; et al. Non-adjunctive continuous glucose monitoring for control of hypoglycaemia (COACH): Results of a post-approval observational study. Diabet. Med. 2022, 39, e14739. [Google Scholar] [CrossRef] [PubMed]
- Elbalshy, M.; Haszard, J.; Smith, H.; Kuroko, S.; Galland, B.; Oliver, N.; Shah, V.; de Bock, M.I.; Wheeler, B.J. Effect of divergent continuous glucose monitoring technologies on glycaemic control in type 1 diabetes mellitus: A systematic review and meta-analysis of randomised controlled trials. Diabet. Med. 2022, 39, e14854. [Google Scholar] [CrossRef] [PubMed]
- Forlenza, G.P.; Argento, N.B.; Laffel, L.M. Practical considerations on the use of continuous glucose monitoring in pediatrics and older adults and nonadjunctive use. Diabet. Technol. Ther. 2017, 19, S-13–S-20. [Google Scholar] [CrossRef] [PubMed]
- Kanamori, K.; Ihana-Sugiyama, N.; Yamamoto-Honda, R.; Nakamura, T.; Sobe, C.; Kamiya, S.; Kishimoto, M.; Kajio, H.; Kawano, K.; Noda, M. Postprandial glucose surges after extremely low carbohydrate diet in healthy adults. Tohoku J. Exp. Med. 2017, 243, 35–39. [Google Scholar] [CrossRef] [PubMed]
- Kim, J.; Lam, W.; Wang, Q.; Parikh, L.; Elshafie, A.; Sanchez-Rangel, E.; Schmidt, C.; Li, F.; Hwang, J.; Belfort-DeAguiar, R. In a Free-Living Setting, Obesity Is Associated with Greater Food Intake in Response to a Similar Premeal Glucose Nadir. J. Clin. Endocr. 2019, 104, 3911–3919. [Google Scholar] [CrossRef]
- Wyatt, P.; Berry, S.E.; Finlayson, G.; O’driscoll, R.; Hadjigeorgiou, G.; Drew, D.A.; Al Khatib, H.; Nguyen, L.H.; Linenberg, I.; Chan, A.T.; et al. Postprandial glycaemic dips predict appetite and energy intake in healthy individuals. Nat. Metab. 2021, 3, 523–529. [Google Scholar] [CrossRef]
- Camps, S.G.; Kaur, B.; Lim, J.; Loo, Y.T.; Pang, E.; Ng, T.; Henry, C.J. Improved Glycemic Control and Variability: Application of Healthy Ingredients in Asian Staples. Nutrients 2021, 13, 3102. [Google Scholar] [CrossRef]
- Lagerpusch, M.; Enderle, J.; Later, W.; Eggeling, B.; Pape, D.; Müller, M.J.; Bosy-Westphal, A. Impact of glycaemic index and dietary fibre on insulin sensitivity during the refeeding phase of a weight cycle in young healthy men. Br. J. Nutr. 2013, 109, 1606–1616. [Google Scholar] [CrossRef]
- Akintola, A.A.; Noordam, R.; Jansen, S.W.; de Craen, A.J.; Ballieux, B.E.; Cobbaert, C.M.; Mooijaart, S.P.; Pijl, H.; Westendorp, R.G.; van Heemst, D. Accuracy of continuous glucose monitoring measurements in normo-glycemic individuals. PLoS ONE 2015, 10, e0139973. [Google Scholar] [CrossRef] [PubMed]
- Schierbauer, J.R.; Günther, S.; Haupt, S.; Zimmer, R.T.; Zunner, B.E.M.; Zimmermann, P.; Wachsmuth, N.B.; Eckstein, M.L.; Aberer, F.; Sourij, H.; et al. Accuracy of Real Time Continuous Glucose Monitoring during Different Liquid Solution Challenges in Healthy Adults: A Randomized Controlled Cross-Over Trial. Sensors 2022, 22, 3104. [Google Scholar] [CrossRef] [PubMed]
- Heinemann, L.; Schoemaker, M.; Schmelzeisen-Redecker, G.; Hinzmann, R.; Kassab, A.; Freckmann, G.; Reiterer, F.; Del Re, L. Benefits and limitations of MARD as a performance parameter for continuous glucose monitoring in the interstitial space. J. Diabetes Sci. Technol. 2020, 14, 135–150. [Google Scholar] [CrossRef] [PubMed]
- Price, C.; Ditton, G.; Russell, G.B.; Aloi, J. Reliability of inpatient CGM: Comparison to standard of care. J. Diabetes Sci. Technol. 2023, 17, 329–335. [Google Scholar] [CrossRef]
- Moser, O.; Sternad, C.; Eckstein, M.L.; Szadkowska, A.; Michalak, A.; Mader, J.K.; Ziko, H.; Elsayed, H.; Aberer, F.; Sola-Gazagnes, A.; et al. Performance of intermittently scanned continuous glucose monitoring systems in people with type 1 diabetes: A pooled analysis. Diabetes Obes. Metab. 2022, 24, 522–529. [Google Scholar] [CrossRef]
- Tsereteli, N.; Vallat, R.; Fernandez-Tajes, J.; Delahanty, L.M.; Ordovas, J.M.; Drew, D.A.; Valdes, A.M.; Segata, N.; Chan, A.T.; Wolf, J.; et al. Impact of insufficient sleep on dysregulated blood glucose control under standardised meal conditions. Diabetologia 2022, 65, 356–365. [Google Scholar] [CrossRef]
- Alva, S.; Bailey, T.; Brazg, R.; Budiman, E.S.; Castorino, K.; Christiansen, M.P.; Forlenza, G.; Kipnes, M.; Liljenquist, D.R.; Liu, H. Accuracy of a 14-day factory calibrated continuous glucose monitoring system with advanced algorithm in pediatric and adult population with diabetes. J. Diabetes Sci. Technol. 2022, 16, 70–77. [Google Scholar] [CrossRef]
- Hanefeld, M.; Sulk, S.; Helbig, M.; Thomas, A.; Köhler, C. Differences in glycemic variability between normoglycemic and prediabetic subjects. J. Diabetes Sci. Technol. 2014, 8, 286–290. [Google Scholar] [CrossRef]
- Kudva, Y.C.; Ahmann, A.J.; Bergenstal, R.M.; Gavin, J.R.; Kruger, D.F.; Midyett, L.K.; Miller, E.; Harris, D.R. Approach to using trend arrows in the FreeStyle Libre flash glucose monitoring systems in adults. J. Endocr. Soc. 2018, 2, 1320–1337. [Google Scholar] [CrossRef]
- Brysbaert, M.; Stevens, M. Power analysis and effect size in mixed effects models: A tutorial. J. Cogn. 2018, 1, 9. [Google Scholar] [CrossRef]
- Bland, J.M.; Altman, D.G. Statistical methods for assessing agreement between two methods of clinical measurement. Lancet 1986, 327, 307–310. [Google Scholar] [CrossRef]
- Jendrike, N.; Baumstark, A.; Kamecke, U.; Haug, C.; Freckmann, G. ISO 15197: 2013 Evaluation of a Blood Glucose Monitoring System’s Measurement Accuracy. J. Diabetes Sci. Technol. 2017, 11, 1275–1276. [Google Scholar] [CrossRef] [PubMed]
- Frier, B.M. Defining hypoglycaemia: What level has clinical relevance? Diabetologia 2009, 52, 31–34. [Google Scholar] [CrossRef]
- Obermaier, K.; Schmelzeisen-Redeker, G.; Schoemaker, M.; Klötzer, H.-M.; Kirchsteiger, H.; Eikmeier, H.; del Re, L. Performance evaluations of continuous glucose monitoring systems: Precision absolute relative deviation is part of the assessment. J. Diabetes Sci. Technol. 2013, 7, 824–832. [Google Scholar] [CrossRef]
- Pleus, S.; Schoemaker, M.; Morgenstern, K.; Schmelzeisen-Redeker, G.; Haug, C.; Link, M.; Zschornack, E.; Freckmann, G. Rate-of-change dependence of the performance of two CGM systems during induced glucose swings. J. Diabetes Sci. Technol. 2015, 9, 801–807. [Google Scholar] [CrossRef] [PubMed]
- Nevill, A.M.; Atkinson, G. Assessing agreement between measurements recorded on a ratio scale in sports medicine and sports science. Br. J. Sports Med. 1997, 31, 314–318. [Google Scholar] [CrossRef] [PubMed]
- Cengiz, E.; Tamborlane, W.V. A tale of two compartments: Interstitial versus blood glucose monitoring. Diabetes Technol. Ther. 2009, 11, S-11–S-16. [Google Scholar] [CrossRef]
- Sato, T.; Oshima, H.; Nakata, K.; Kimura, Y.; Yano, T.; Furuhashi, M.; Tannno, M.; Miki, T.; Miura, T. Accuracy of flash glucose monitoring in insulin-treated patients with type 2 diabetes. J. Diabetes Investig. 2019, 10, 846–850. [Google Scholar] [CrossRef]
- Færch, K.; Amadid, H.; Bruhn, L.; Clemmensen, K.K.B.; Hulman, A.; Ried-Larsen, M.; Blond, M.B.; Jørgensen, M.E.; Vistisen, D. Discordance between Glucose Levels Measured in Interstitial Fluid vs in Venous Plasma after Oral Glucose Administration: A Post-Hoc Analysis from the Randomised Controlled PRED Trial. Front. Endocrinol. 2021, 12, 1–8. [Google Scholar] [CrossRef]
- Dye, L.; Mansfield, M.; Lasikiewicz, N.; Mahawish, L.; Schnell, R.; Talbot, D.; Chauhan, H.; Croden, F.; Lawton, C. Correspondence of continuous interstitial glucose measurement against arterialised and capillary glucose following an oral glucose tolerance test in healthy volunteers. Br. J. Nutr. 2010, 103, 134–140. [Google Scholar] [CrossRef]
- Clarke, W.L.; Kovatchev, B. Continuous glucose sensors: Continuing questions about clinical accuracy. J. Diabetes Sci. Technol. 2007, 1, 669–675. [Google Scholar] [CrossRef] [PubMed]
- Wernerman, J.; Desaive, T.; Finfer, S.; Foubert, L.; Furnary, A.; Holzinger, U.; Hovorka, R.; Joseph, J.; Kosiborod, M.; Krinsley, J.; et al. Continuous glucose control in the ICU: Report of a 2013 round table meeting. Crit. Care 2014, 18, 226. [Google Scholar] [CrossRef] [PubMed]
- Szadkowska, A.; Michalak, A.; Łosiewicz, A.; Kuśmierczyk, H.; Krawczyk-Rusiecka, K.; Chrzanowski, J.; Gawrecki, A.; Zozulińska-Ziółkiewicz, D.; Fendler, W. Impact of factory-calibrated Freestyle Libre System with new glucose algorithm measurement accuracy and clinical performance in children with type 1 diabetes during summer camp. Pediatr. Diabetes 2021, 22, 261–270. [Google Scholar] [CrossRef]
- Tramunt, B.; Smati, S.; Grandgeorge, N.; Lenfant, F.; Arnal, J.F.; Montagner, A.; Gourdy, P. Sex differences in metabolic regulation and diabetes susceptibility. Diabetologia 2020, 63, 453–461. [Google Scholar] [CrossRef] [PubMed]
- Mauvais-Jarvis, F. Gender differences in glucose homeostasis and diabetes. Physiol. Behav. 2018, 187, 20–23. [Google Scholar] [CrossRef]
- Klueh, U. Analysis: On the path to overcoming glucose-sensor-induced foreign body reactions. J. Diabetes Sci. Technol. 2013, 7, 452–454. [Google Scholar] [CrossRef]


| Mean ± SD | |
|---|---|
| Age (years) | 26 ± 4 |
| Height (m) | 1.66 ± 0.07 |
| Body mass (kg) | 60.0 ± 7.2 |
| Body mass index (kg/m2) | 21.5 ± 2.0 |
| Waist circumference (cm) | 69.9 ± 5.3 |
| Hip circumference (cm) | 95.7 ± 4.1 |
| Ethnicity | |
| Asian | 22 |
| White | 4 |
| Arab | 2 |
| Latino | 1 |
| MARD (95% CI) | |
|---|---|
| Overall (n = 429) | 27.5% (20.8, 34.2%) |
| Glycaemic zones | |
| Hypoglycaemia (<3.5 mmol/L; n = 29) | 69.5% (51.4, 82.9%) |
| Euglycaemia (3.5–10.0 mmol/L; n = 400) | 25.9% (19.9, 31.8%) |
| Rate of changes | |
| Rising quickly (>0.111 mmol/L/min; n = 12) | 14.2% (9.6, 18.8%) |
| Rising (0.056–0.111 mmol/L/min; n = 34) | 13.8% (9.9, 17.8%) |
| Changing slowly (<0.056 mmol/L/min; n = 313) | 28.4% (21.2, 35.6%) |
| Falling (0.056–0.111 mmol/L/min; n = 26) | 63.7% (45.7, 81.7%) |
| Falling quickly (>0.111 mmol/L/min; n = 8) | 67.3% (33.9, 100%) |
Disclaimer/Publisher’s Note: The statements, opinions and data contained in all publications are solely those of the individual author(s) and contributor(s) and not of MDPI and/or the editor(s). MDPI and/or the editor(s) disclaim responsibility for any injury to people or property resulting from any ideas, methods, instructions or products referred to in the content. |
© 2023 by the authors. Licensee MDPI, Basel, Switzerland. This article is an open access article distributed under the terms and conditions of the Creative Commons Attribution (CC BY) license (https://creativecommons.org/licenses/by/4.0/).
Share and Cite
Jin, Z.; Thackray, A.E.; King, J.A.; Deighton, K.; Davies, M.J.; Stensel, D.J. Analytical Performance of the Factory-Calibrated Flash Glucose Monitoring System FreeStyle Libre2TM in Healthy Women. Sensors 2023, 23, 7417. https://doi.org/10.3390/s23177417
Jin Z, Thackray AE, King JA, Deighton K, Davies MJ, Stensel DJ. Analytical Performance of the Factory-Calibrated Flash Glucose Monitoring System FreeStyle Libre2TM in Healthy Women. Sensors. 2023; 23(17):7417. https://doi.org/10.3390/s23177417
Chicago/Turabian StyleJin, Zhuoxiu, Alice E. Thackray, James A. King, Kevin Deighton, Melanie J. Davies, and David J. Stensel. 2023. "Analytical Performance of the Factory-Calibrated Flash Glucose Monitoring System FreeStyle Libre2TM in Healthy Women" Sensors 23, no. 17: 7417. https://doi.org/10.3390/s23177417
APA StyleJin, Z., Thackray, A. E., King, J. A., Deighton, K., Davies, M. J., & Stensel, D. J. (2023). Analytical Performance of the Factory-Calibrated Flash Glucose Monitoring System FreeStyle Libre2TM in Healthy Women. Sensors, 23(17), 7417. https://doi.org/10.3390/s23177417