1. Introduction
Zirconium and its compounds have unique physicochemical properties, e.g., amazing corrosion resistance, extremely high melting point, and ultrahigh hardness and strength, accounting for their applications in engineering and science [
1,
2]. As a relatively rare metal material, zirconium sheet plays a significant role in machinery manufacturing, aerospace, nuclear reactor, chemical industry, ceramic industry, and other fields [
3,
4,
5,
6,
7,
8]. However, in various production and processing processes, scratches will appear on the surface of zirconium sheets due to various factors. The surface quality of zirconium sheets will directly affect the performance and quality of final products; therefore, it is necessary to detect the location and shape of scratches. At present, the scratches on the surface of zirconium sheets are usually detected manually. However, manual detection has many shortcomings, such as high false detection rate and low efficiency. Therefore, we urgently need a method for scratch detection of zirconium sheets.
At the same time, with the development of modern industry and science and technology, nondestructive testing (NDT) is widely used in various fields, e.g., aerospace, machinery industry, shipbuilding, automobile, etc. [
9,
10,
11,
12,
13]. NDT technology includes ultrasonic, machine vision, radiographic, eddy current, and other methods. Among them, compared with other methods, machine vision based on image processing technology has great advantages, e.g., automation, high precision, easy operation, etc. Therefore, we choose machine vision to detect scratches on the surface of zirconium sheets [
14].
However, due to the interference of the surface features, which are noise and texture of zirconium sheets, it is difficult to use machine vision methods to detect scratches. In other words, noise will mask the details of images, resulting in breakpoints in the extracted scratch contour. In addition, texture will mistakenly become branches of the contour, destroying the size and shape of the contour [
15,
16,
17]. Therefore, removing noise and suppressing texture before scratch detection are key to obtain the region of scratches. Traditional algorithms typically detect targets based on image features, e.g., gradient, color, and texture. Due to that the detection objects are in the complex texture background, the difference between the results obtained from color-based image segmentation and real value is significant [
18,
19,
20]. Researchers from different countries have proposed the following noncolor methods to solve such problems [
21,
22,
23].
Renuka et al. [
24] presented an objective calculation method of denoising threshold based on dual-tree complex wavelet transform (DTCWT), which has good edge preservation and denoising ability. Liu et al. [
25] presented a nonreference image denoising method based on enhanced DTCWT and bilateral filter. Compared with other algorithms, the results show that the denoising effect of this method is better than other methods. Li et al. [
26] proposed a you only look once (YOLO)-attention based on YOLOv4 for complex defect types and noisy detection environments in wire and arc additive manufacturing (WAAM), achieving fast and accurate defect detection for WAAM. This method achieved an average accuracy of 94.5% in dynamic images. Kelishadrokhi et al. [
27] proposed a new method based on the combination of color and texture features to solve the problem of finding more similar images from a large database. They proposed an extended version of local neighborhood difference pattern (ELNDP) to achieve discriminative features and optimized the color histogram features in the HSV color space to extract color features. This method has better retrieval performance compared to other methods. Xu et al. [
28] proposed a new texture structure extraction system. Experimental results show that the algorithm is effective and does not need a priori condition. Zhou et al. [
29] proposed a method to extract machine tool defects from high-speed milling workpiece surface images, which reduces the influence of workpiece surface background texture. The application example shows that this method can effectively extract machine tool defects. Su et al. [
30] proposed a new edge-preserving texture suppression filter, which uses the joint bilateral filter as a bridge to achieve the dual purposes of texture smoothing and edge-preserving. Isar et al. [
31] proposed a two-stage denoising system structure to separate threshold calculation and noise removal so as to improve the denoising performance. Tian et al. [
32] designed a lighting method combining plane illumination mode with multiangle illumination mode to automatically detect five kinds of defects by different detection methods.
However, most of the above contour extraction methods have the disadvantages of nonadaptive denoising, a large number of datasets, and texture suppression without edge preservation. Therefore, it is necessary to propose a method that takes into account the weaknesses of the above methods. In order to remove noise and suppress texture simultaneously, while preserving as much detail as possible before scratch detection, we propose an adaptive scratch extraction algorithm framework for detecting scratches with a two-stage system, suppressing interference features. This method is able to detect scratches on the surface of zirconium sheets from the interference of background features effectively. The key of this method is to obtain wavelet decomposition level, threshold, and texture size.
The rest of this article is organized as follows. In
Section 2, we first introduce the theoretical part. Then, the experiment and its results are introduced in
Section 3. The conclusion and further work are shown in
Section 4.
2. Methodology
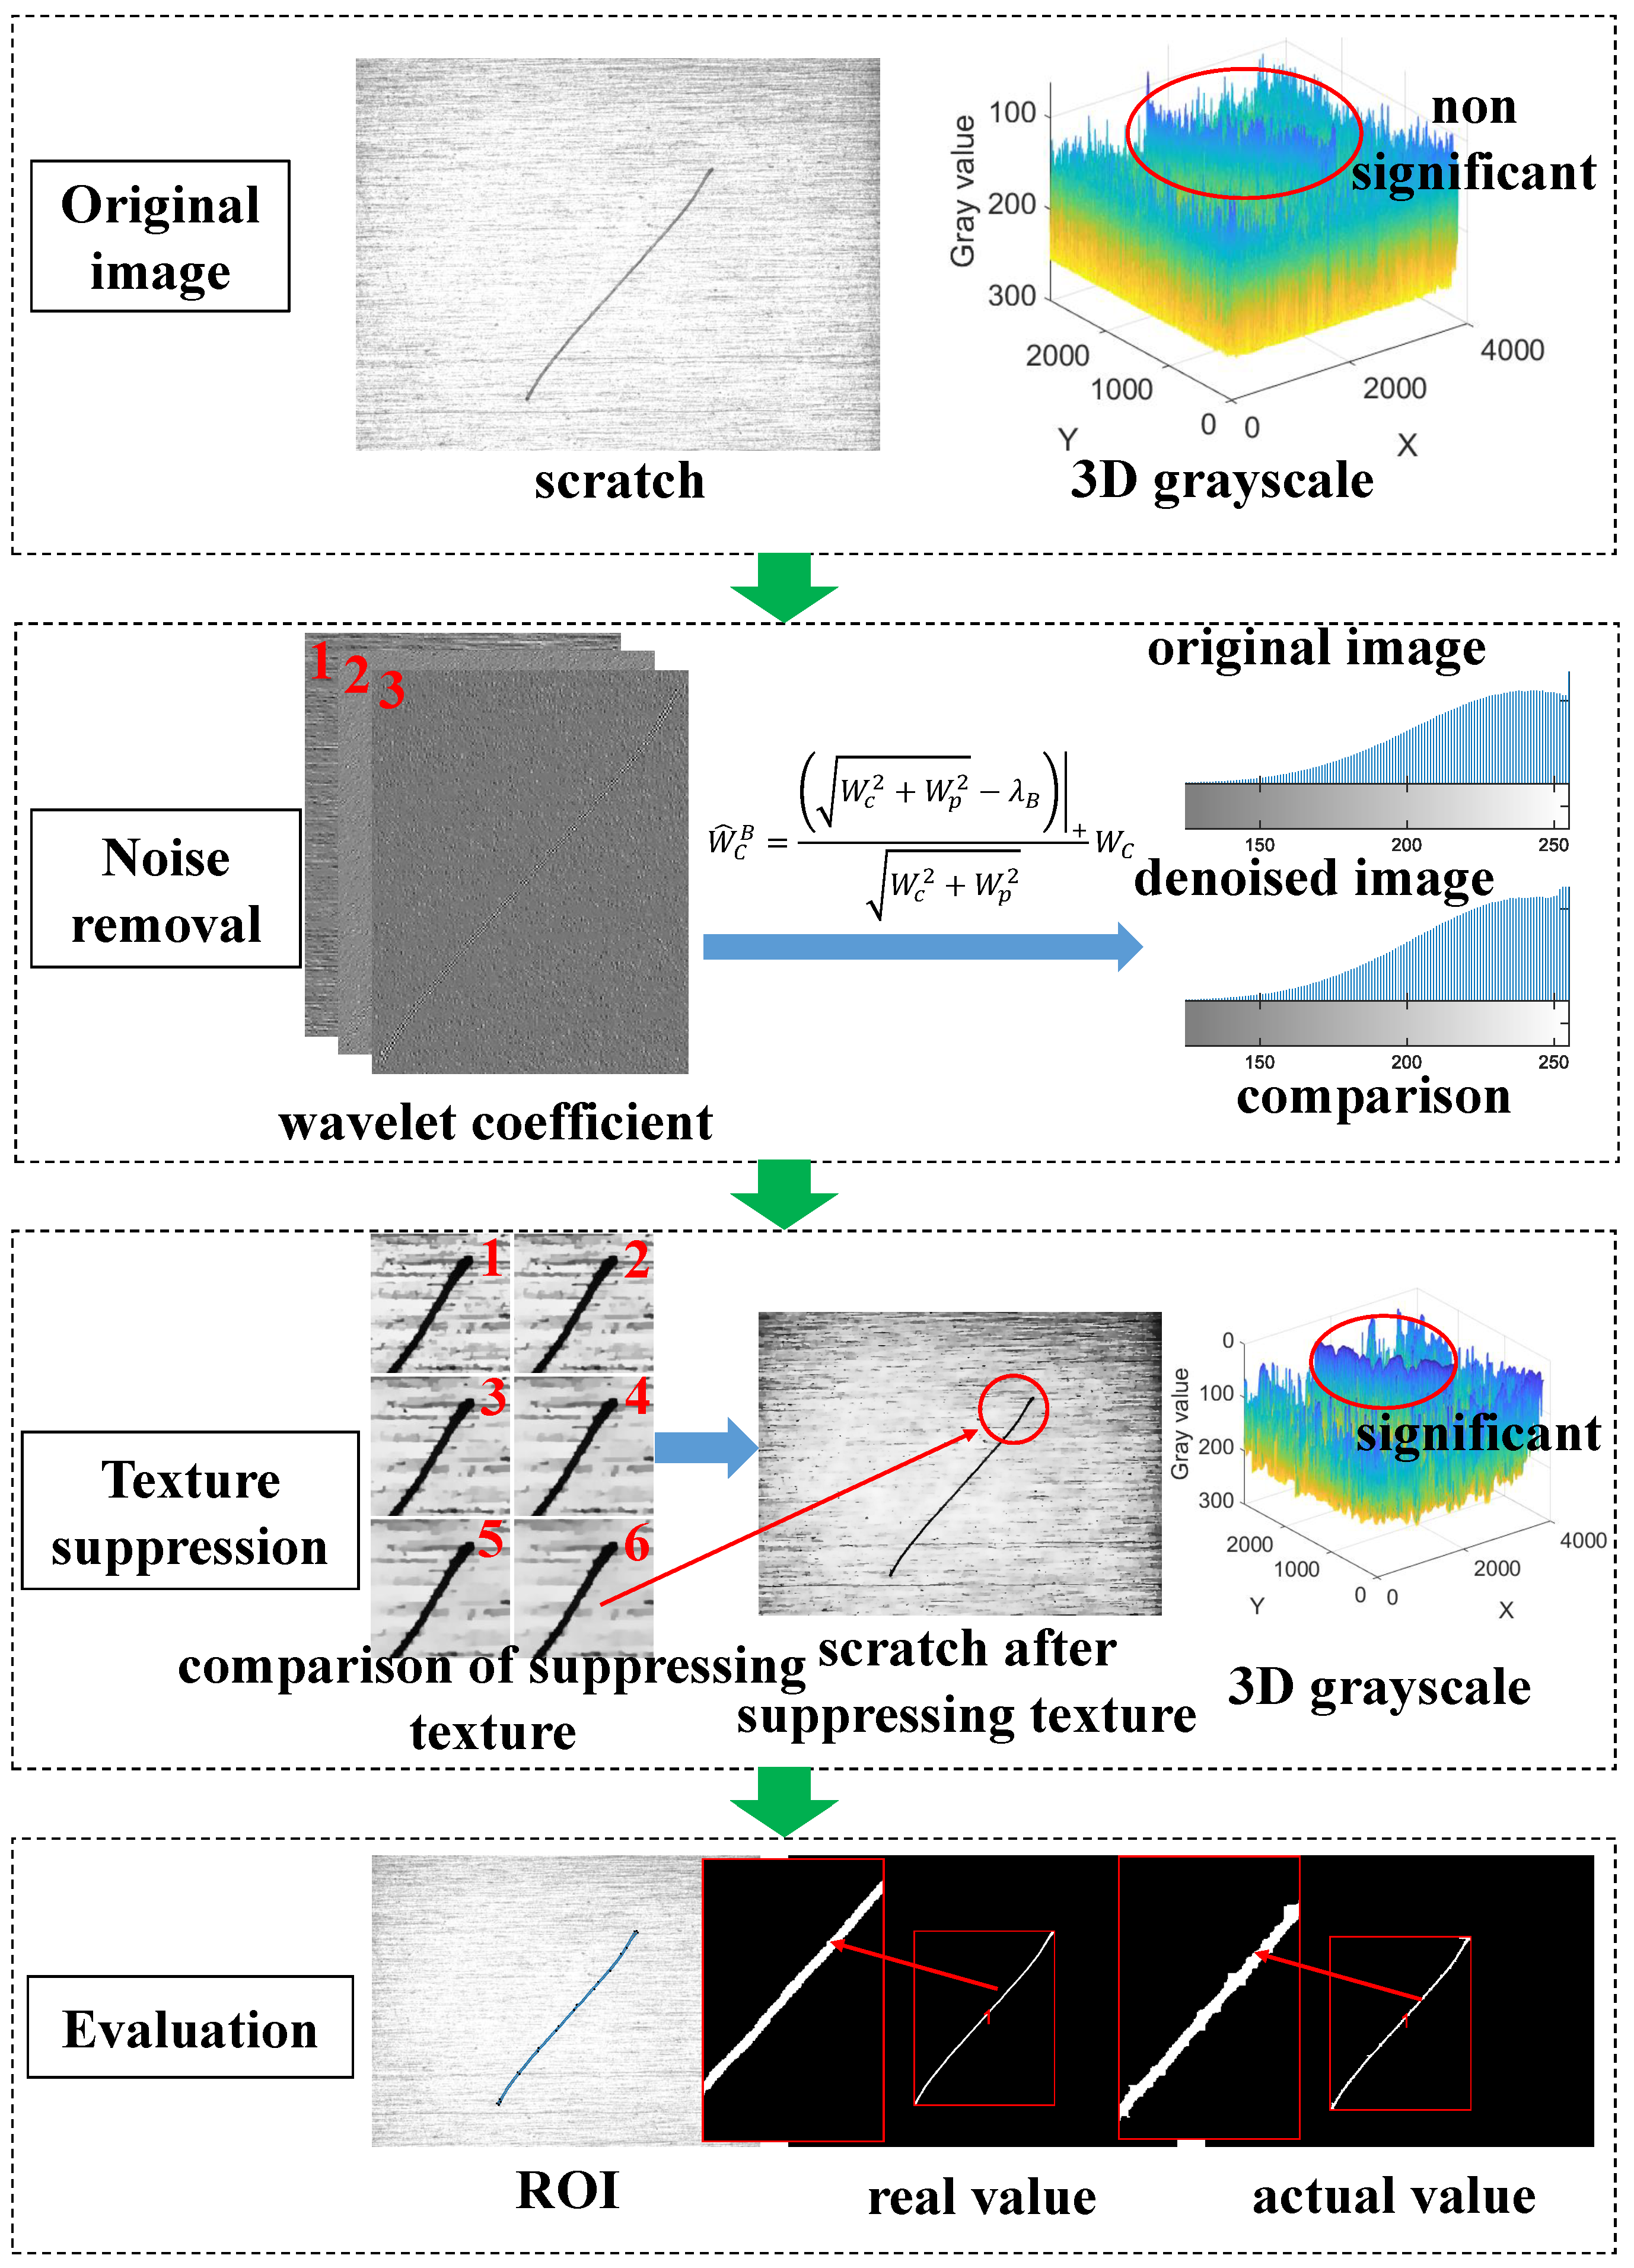
Due to the interference of background features, we propose an adaptive scratch extraction framework for the surface of zirconium sheets to detect scratches. At first, this algorithm uses DTCWT function to decompose images with selected wavelet decomposition level, and then designs the optimized adaptive local threshold to improve the ability of removing noise. Secondly, it selects the texture size and then designs a relative total variation enhancement (RTVE) algorithm to suppress texture. Finally, it detects the scratches and quantitatively analyzes these defects from three aspects, e.g., area, length and position deviation. Therefore, this section provides theories related to noise removal and texture suppression, e.g., the objective function for calculating adaptive threshold, RTVE model, parameter selection formula, the evaluation function, etc. The flow chart of the algorithm is shown in
Figure 1 and Algorithm 1. In Algorithm 1,
represents the decomposition level and
represents the texture size. The first step is to input the original image and view the 3D grayscale image; the second step is to observe the 3D grayscale images of wavelet coefficients at all levels, select appropriate decomposition level, and remove noise; the third step is to test texture size and then suppress texture; the final step is to extract the region of interest (ROI) and compare it with the results to obtain accuracy.
| Algorithm 1 Scratch extraction algorithm framework. |
| Input: f: scratch; region of interest (ROI): real value; and : patameters; |
| Output: : image after noise removal and texture suppression; comparison result |
| |
| if
then |
| |
| |
| |
| |
| end if |
| if
then |
| |
| end if |
| Comparison of results and ROI |
| return and comparison result
|
2.1. Adaptive Noise Removal in Wavelet Domain
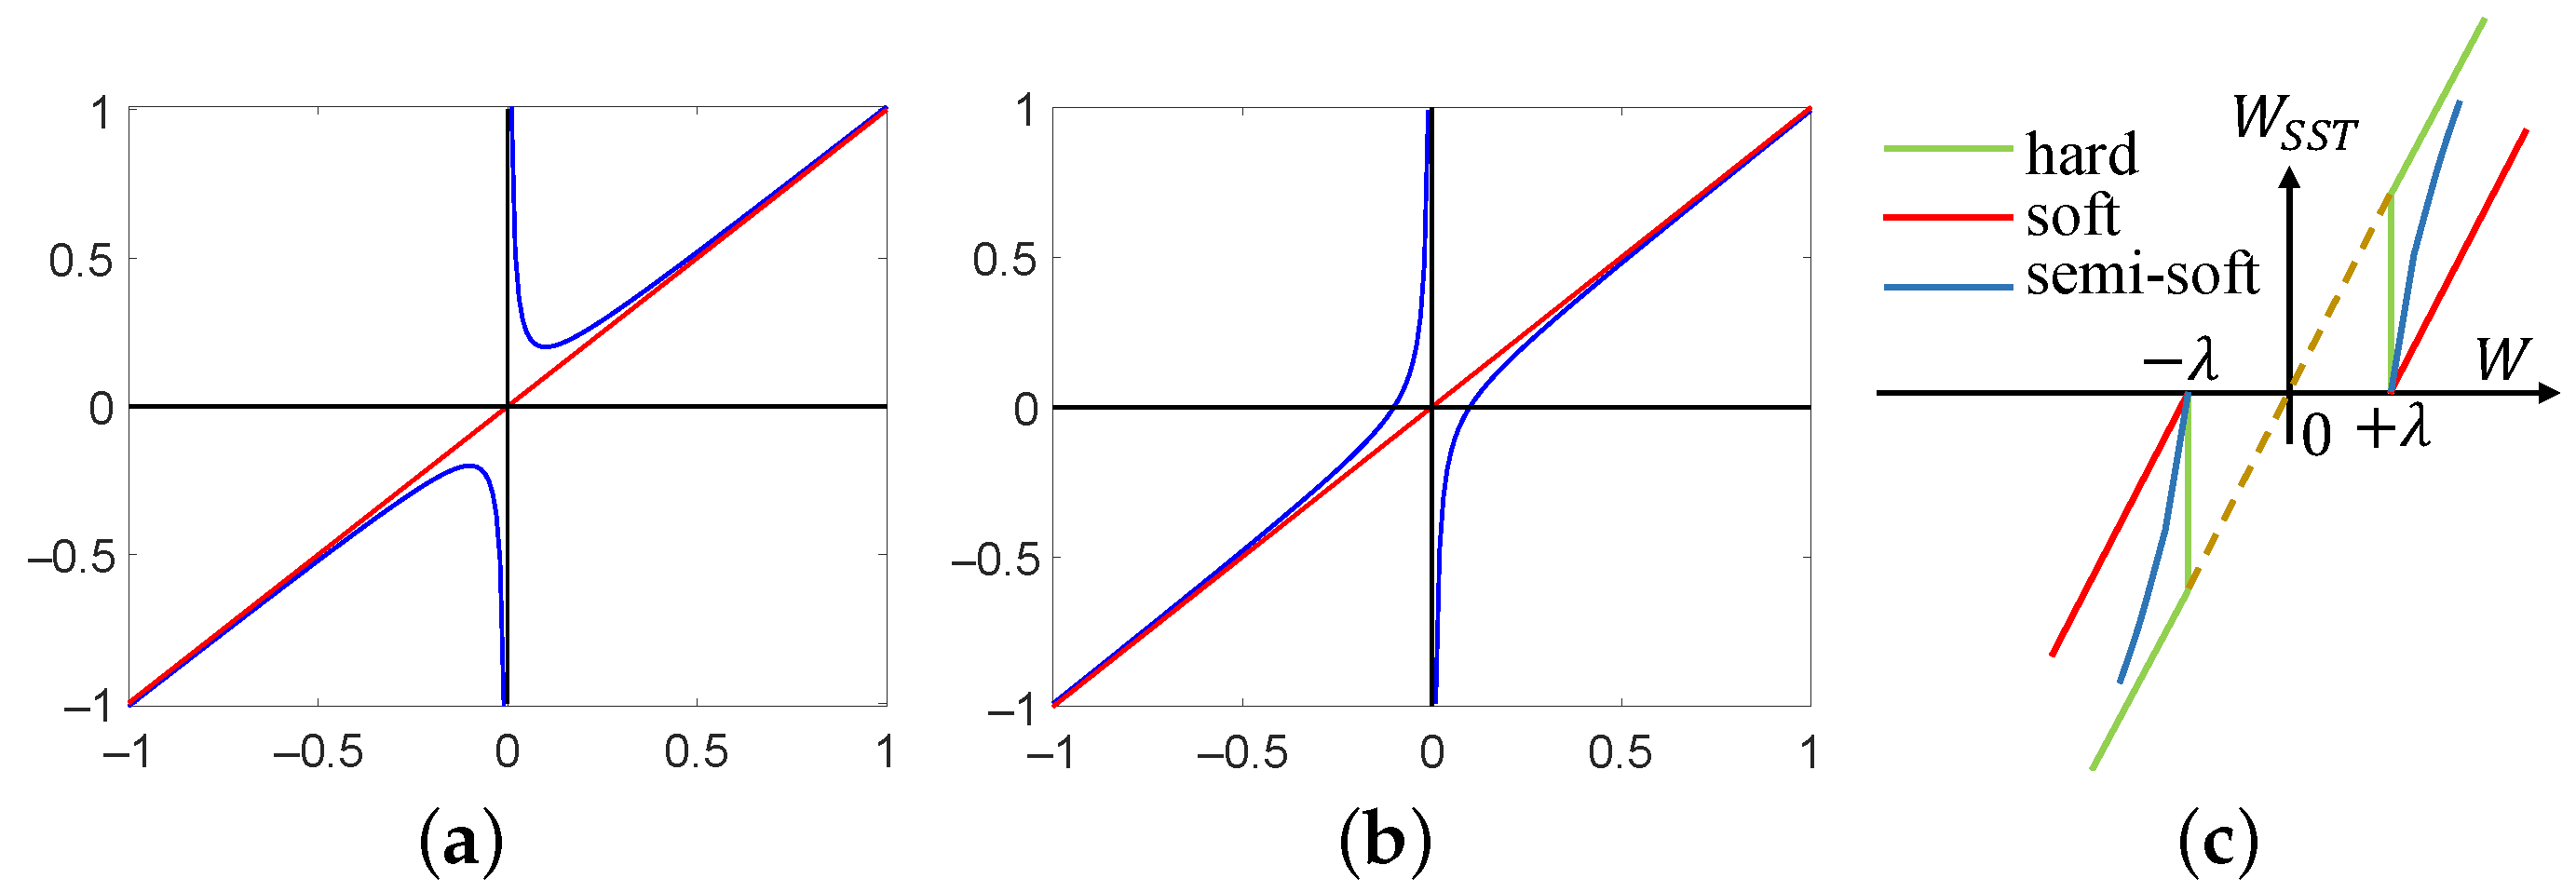
Property 1. The two types of double hook functions are described aswhere a and b are constants; . Normally, .where, normally, . The double hook function has two asymptotes, one vertical asymptote and one oblique asymptote. Equation (1) has an oblique asymptote and has no intersection with the x axis. Equation (2) is different from Equation (1) because it intersects with the x axis. Equations (1) and (2) are shown in Figure 2. Property 2. The hard threshold function and soft threshold function are described as [33,34]where λ is threshold, W is wavelet coefficients, and and are hard threshold function and soft threshold function, respectively. Equations (3) and (4) are shown in Figure 2c. We propose an improved threshold model according to Equation (
2) of Property 1, which takes into account the advantages of both soft and hard threshold functions. The semisoft threshold formula is described as
where
is threshold,
represent step function, and
is the result of filtering. Furthermore,
is described as
where
is estimated variance for the noise component, and
is estimated variance for the noiseless component.
In the first stage of removing noise, the soft threshold function or hard threshold function is usually used to extract noise components of each sub-band. However, from
Figure 2c, the wavelet coefficients processed by the hard threshold function generate jump points at
, do not have the smoothness of the original information, and oscillation occurs after reconstruction. Therefore, this disadvantage can lead to sudden changes in the pixels on the scratch image, i.e., there is a significant difference in the grayscale values of some adjacent pixels. The wavelet coefficients processed by the soft threshold function have a fixed deviation compared to the hard threshold function, i.e., it directly affects the similarity between the reconstructed coefficients and the real coefficients. Therefore, this disadvantage can cause the overall shift of pixel grayscale values on the scratch images, resulting in a blurry effect.
From
Figure 2c, we can intuitively see the shapes and features of the hard threshold function and the soft threshold function. Among them, the red line represents the soft threshold function, the green line represents the hard threshold function, and the blue curve represents the semisoft threshold function. Based on the characteristics of
Figure 2c, the common feature of both functions can be obtained, which is that they are parallel to the line
. Therefore, considering the drawbacks of both functions, we need an asymptotic semisoft threshold function to compensate for the discontinuity of the hard threshold function and the deviation of the soft threshold function, i.e., it can eliminate sudden changes in pixel grayscale values and weaken blurring effects. Since the line
belongs to the oblique asymptote, and Equation (
2) has this feature, we construct the formula shown in Equation (
5).
In order to verify that Equation (
5) converges to a straight line
, we assume two scenarios. When
, i.e.,
W is also greater than 0, according to Equation (
5), the transformed formula can be described as
by applying the limit to Equation (
7), the result can be obtained as
When
, i.e.,
W is also less than 0, according to Equation (
5), the transformed formula can be described as
by applying the limit to Equation (
9), the result can be obtained as
Therefore, based on the above results, we have the following conclusion:
We can see that Equation (
5) has only one oblique asymptote
. As
continues to increase, the value of
gradually decreases and eventually approaches
W, resulting in a gradual decrease in the deviation between the estimated wavelet coefficients and the actual wavelet coefficients, overcoming the shortcomings of the two threshold functions.
It is worth noting that, in the first stage, we use the square directional window to calculate the variance as we need to extract as much noise as possible from images; the square window can meet the requirements. In the second stage, we use elliptical directional windows to calculate the variance to preserve as much detail as possible while denoising. However, elliptical windows have poor directionality and are bulky in volume.
Therefore, in the second stage of removing noise, we use a parameters-adjusted elliptical direction window with smaller size and more monotonic direction for calculating local threshold based on the elliptical window prototype [
35]. The formula is defined as
where
is the principal axis direction; when it is
,
or
, it corresponds to the elliptical window of six high-frequency sub-bands, and
m and
n are coordinates of pixels. Finally, the image of removing noise is obtained by inverse transformation.
2.2. Texture Suppression and Edge Preservation
We propose one
model, which can maintain the defect contour while suppressing texture. Using
to suppress texture of the image
, the result
is defined as
where
enhances the contrast of the image
and is defined as
where
denotes the minimum 1% pixels set as the minimum pixel value and
denotes the maximum 1% pixels set as the maximum pixel value. Furthermore,
is described as
where
is a small positive number, avoiding zero denominator,
and
denote the total variations of the window for pixel
p in the x and y directions, respectively, and
and
are the inherent variations of the window for pixel
p in x and y directions, respectively.
All parameters of Equation (
15) are described, and
is described as
and
is described as
is described as
and
is described as
is described as
is described as
where
i and
j are the abscissa and ordinate of the central pixel, m and n are the abscissa and ordinate of the input pixel,
is the value of the central pixel, and
is the value of the input pixel. In addition,
denotes the product of two weights.
Usually, we use relative total variation
to suppress texture [
28]. Furthermore, the objective function of
is defined as [
28]
where
is the weight of the regular item, and
is defined as
When the RTV method is applied to the surface of metal materials with structural texture, it is difficult for
to completely suppress the texture background while ensuring that the small size defects are not lost, because RTV only considers the weight of spatial distance. Equation (
15) reflects on the calculation of two weights to compensate for the shortcomings of
. Not only is the influence of spatial distance weight considered, but the gray difference between the central pixel and other pixels in the neighborhood is also taken as the basis for calculating another weight.
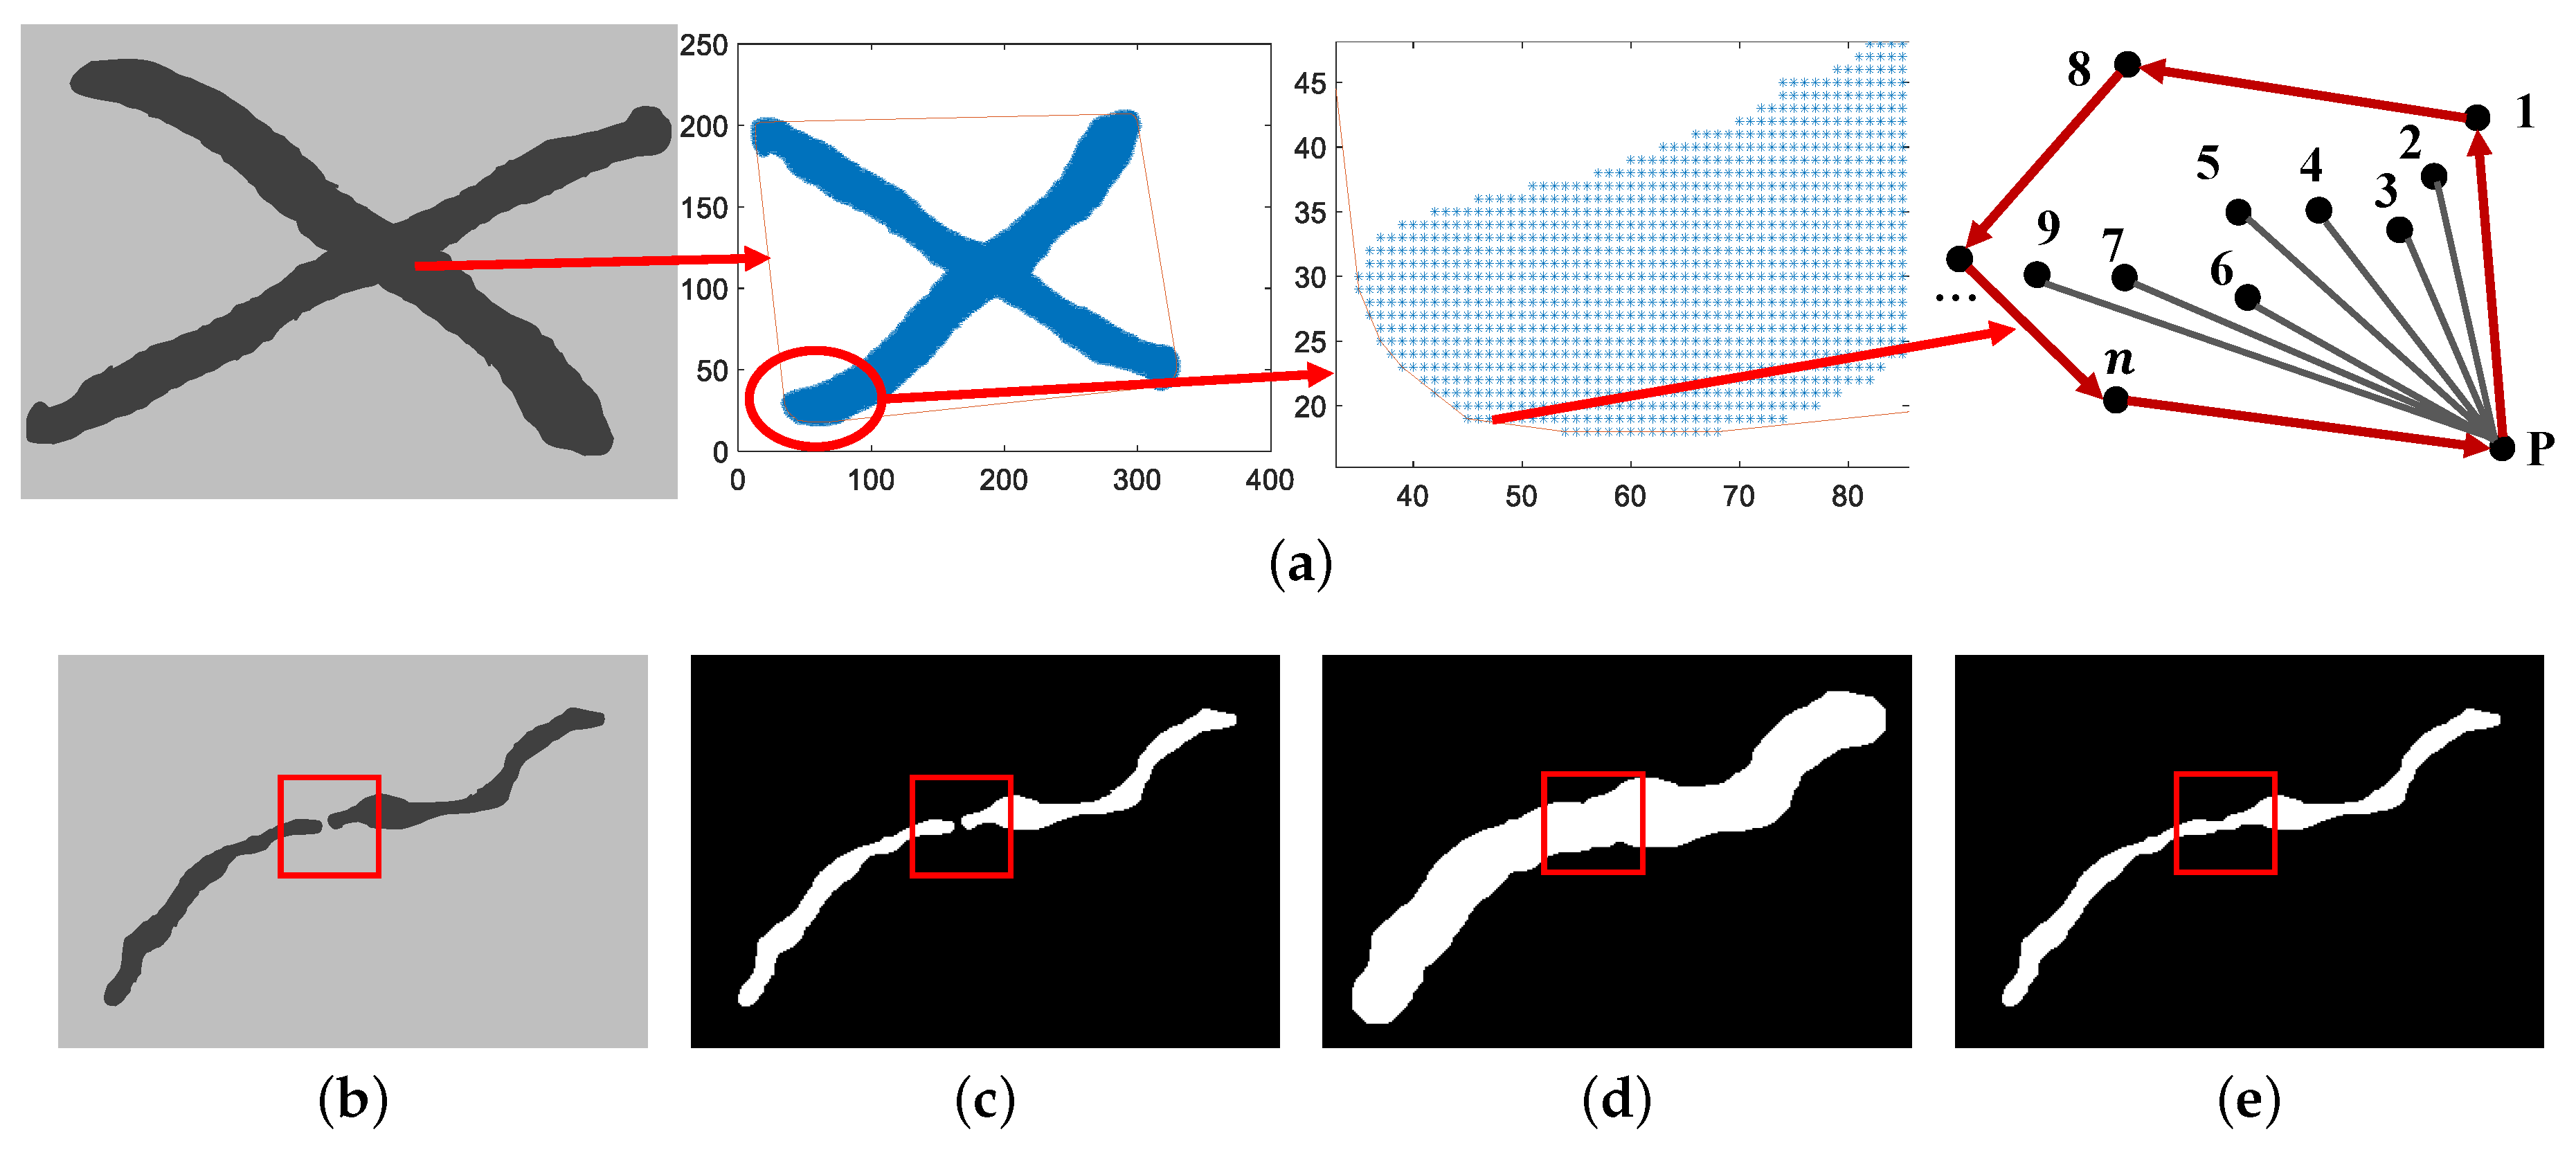
After the end of preprocessing, it is necessary to ensure the integrity of scratches based on the convex hull and close operation to connect the broken part. The principle of convex hull is shown in
Figure 3a. The expansion and corrosion of close operation are shown in
Figure 3b–e.
Compared with the manually extracted ROI, the scratch extraction of the real image is evaluated by area, length, and position deviation. The comprehensive accuracy is the arithmetic mean of the first two accuracy. Furthermore, it is described as
The position deviation is expressed by the Euclidean distance between the centroids,
where
and
represent the centroid of the real value,
and
represent the centroid of the actual value, and
represents the distance difference between the two. As long as the distance difference is less than 100 pixels, we consider this distance to be qualified.
3. Experiments
As shown in
Figure 4, the scratch images used in this paper are collected by the machine vision system, which is composed of a three-dimensional motion device and a pixel resolution of 4024 × 3036 industrial camera, a white light source, a computer, and a test piece. Three-dimensional space movement of the camera and light source is realized through control software to ensure the collection of scratch images.
The surface images of zirconium sheets are shown in
Figure 4b. Among them, aluminum plate is used to replace zirconium sheet. There are four kinds of scratch images in this paper, including single scratch, multiple scratches, cross scratch, and other scratches, as shown in
Figure 5. It is noteworthy that the size of these images is processed later due to the need of wavelet transform. Before collecting images, we use alcohol to wipe the surface of the sample due to interference from other things. In addition, before the experiment, we test the light intensity. Lighting has a significant impact on the imaging quality. Different lighting methods have different effects on the detection object; for example, diffuse light sources can cause the detection surface to emit light, requiring special light sources to solve the problem of reflection. Therefore, choosing the appropriate light source and appropriate lighting intensity is crucial for nondestructive testing technology based on machine vision. By analyzing the surface properties of the sample and investigating the types and application scenarios of light sources, we design a machine vision inspection system with a high-precision camera and a coaxial light source as the core due to the high reflectivity and complex texture on the surface of the detected object. Firstly, we use coaxial light sources to reduce the impact of reflected light due to the inability of ordinary light sources to suppress surface reflection. Secondly, we choose the appropriate lighting intensity through experiments to ensure the integrity of the scratch area while minimizing the texture as much as possible. We use the algorithm proposed in this article to test scratch images obtained from different lighting intensities and compare them with other algorithms. It is a good choice to increase the light intensity as much as possible while ensuring the integrity of scratches according to the data. Therefore, choosing a value within the appropriate range of light intensity is the correct choice.
Before the scratch detection, it is necessary for inputs to remove noise and suppress texture. The first half of
Section 3 introduces the content of noise removal and texture suppression, respectively. From
Figure 6, observing the change trend of wavelet coefficients at 45° from first level to fourth level and their 3D grayscale due to significant characteristics of diagonal coefficients, we can summarize the following conclusions. At first, from
Figure 6a–d, the wavelet coefficients of the first and second levels cannot reflect detailed information. Second, from
Figure 6g–h, the wavelet coefficients of the fourth level will be distorted due to the loss of pixels. Finally, from
Figure 6e,f, the wavelet coefficients of the third level can retain rich scratch information while also reflecting necessary background interference. In the process of decomposing the levels from 1 to n, the details of scratches move from blurry to clear, and then to blurry. In addition, when the decomposition level is 3, the scratch details are most obvious. Therefore, we choose the third decomposition level, i.e.,
is 3.
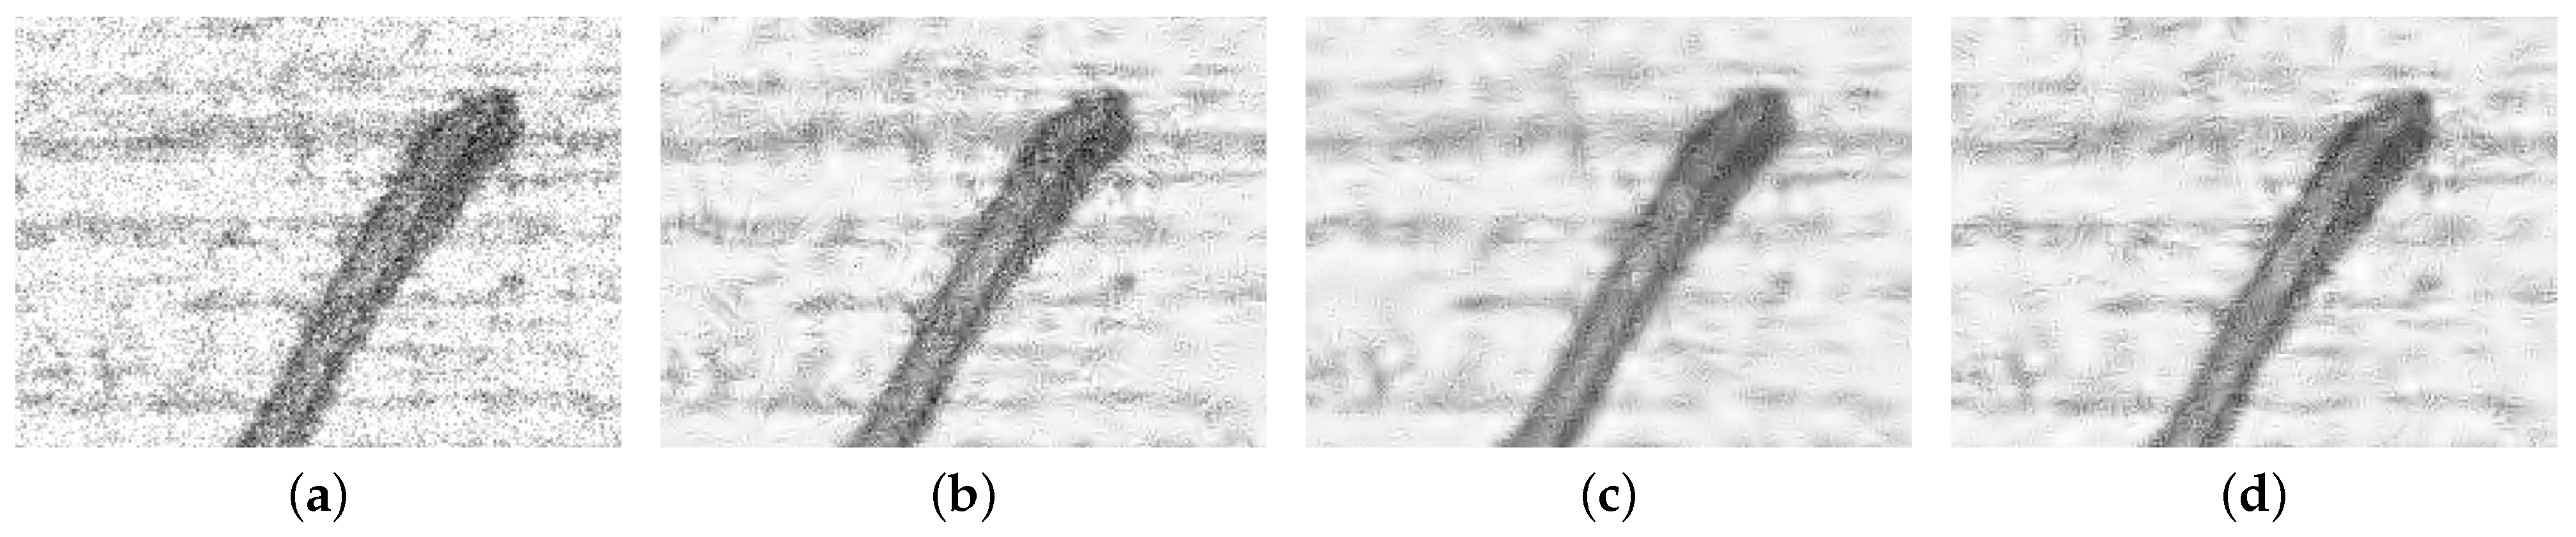
As shown in
Figure 7, the image pixels after hard thresholding appear abrupt, and the pixels after soft thresholding are blurry and smooth, while the pixels after semisoft thresholding are between the two thresholds, which not only weakens the sudden changes in pixel values but also maintains smoothness.
On the basis of removing noise, we need to suppress structural texture. Firstly, the parameter selection method is used to calculate the texture size. The texture size is determined by the height shown in
Figure 8. By analyzing
Figure 8, we estimate the texture size and select the parameter in 0–6. When the autocorrelation coefficient is greater than 0.01, the texture size is roughly between 3 and 6. Furthermore, when the autocorrelation coefficient is less than 0.01, the texture size is roughly between 0 and 3. Therefore, we can obtain
based on texture size.
The height difference between the yellow plane and the blue plane indicates the texture size; thus, it can be seen from
Figure 8 that the autocorrelation coefficients are 0.0238, 0.0150, 0.0170, and 0.0187, respectively. Therefore, the texture size can be roughly determined to be over 3.
Then, the results obtained by using RTVE are compared with those obtained by
.
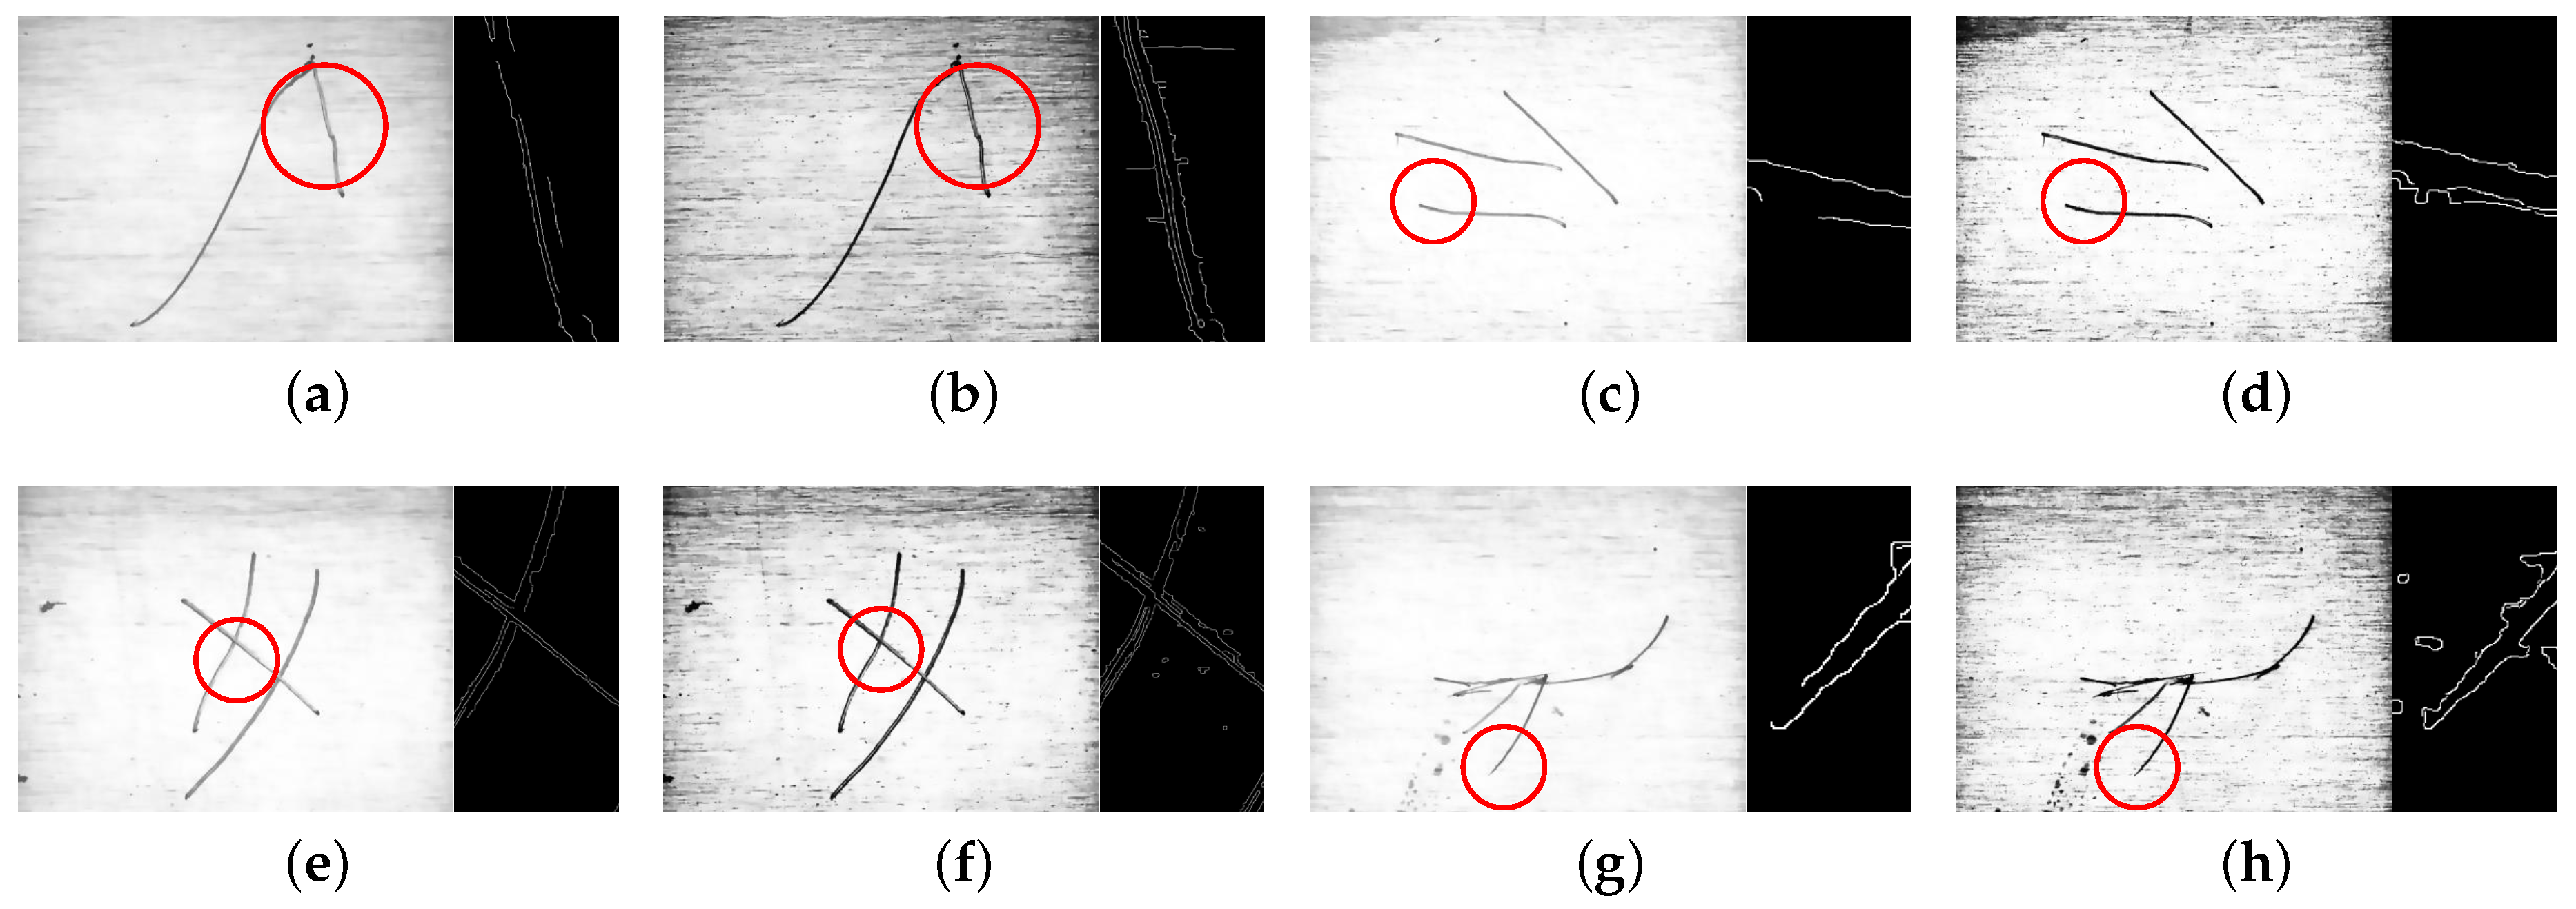
Figure 9 shows the surface of the scratch images after suppressing texture.
Figure 9a,c,e,g are processed by
. Furthermore,
Figure 9b,d,f,h are processed by
. By analyzing
Figure 9, we can see that the integrity of the scratch edge is higher after being processed by the
algorithm. On the contrary, the scratch area processed by
always loses some edges, indicating that the
algorithm proposed in this paper has advantages that
does not have.
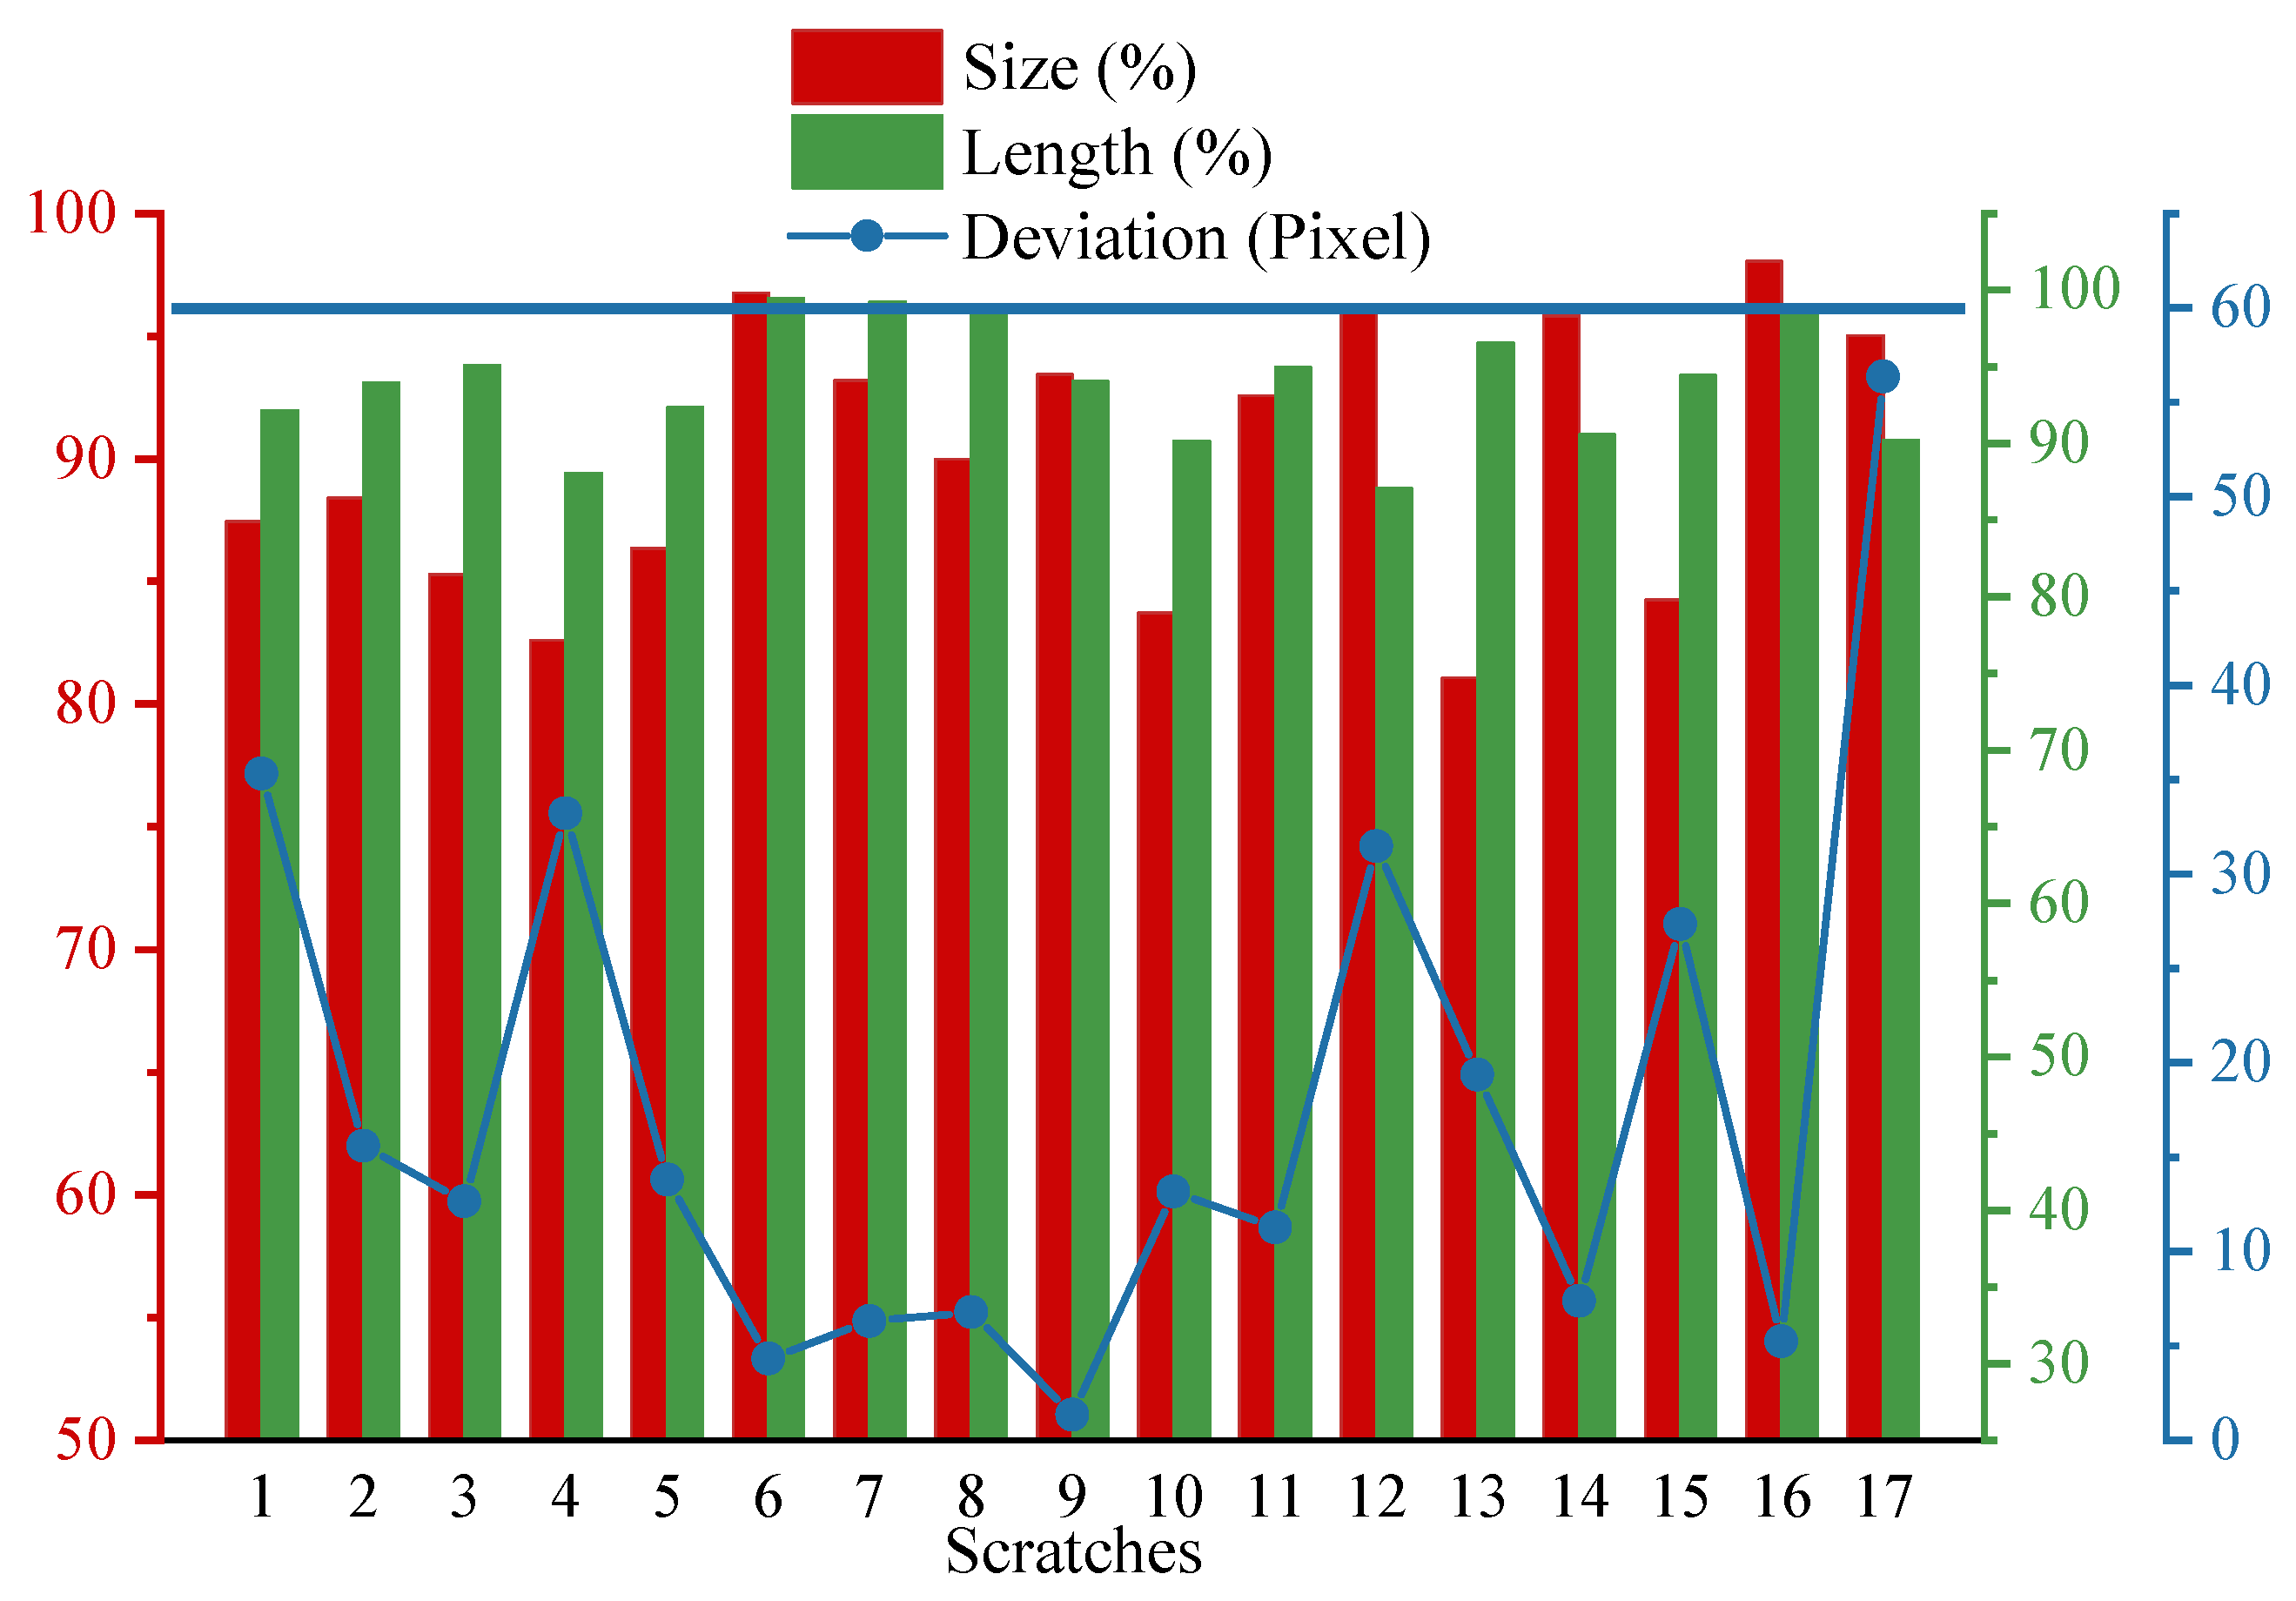
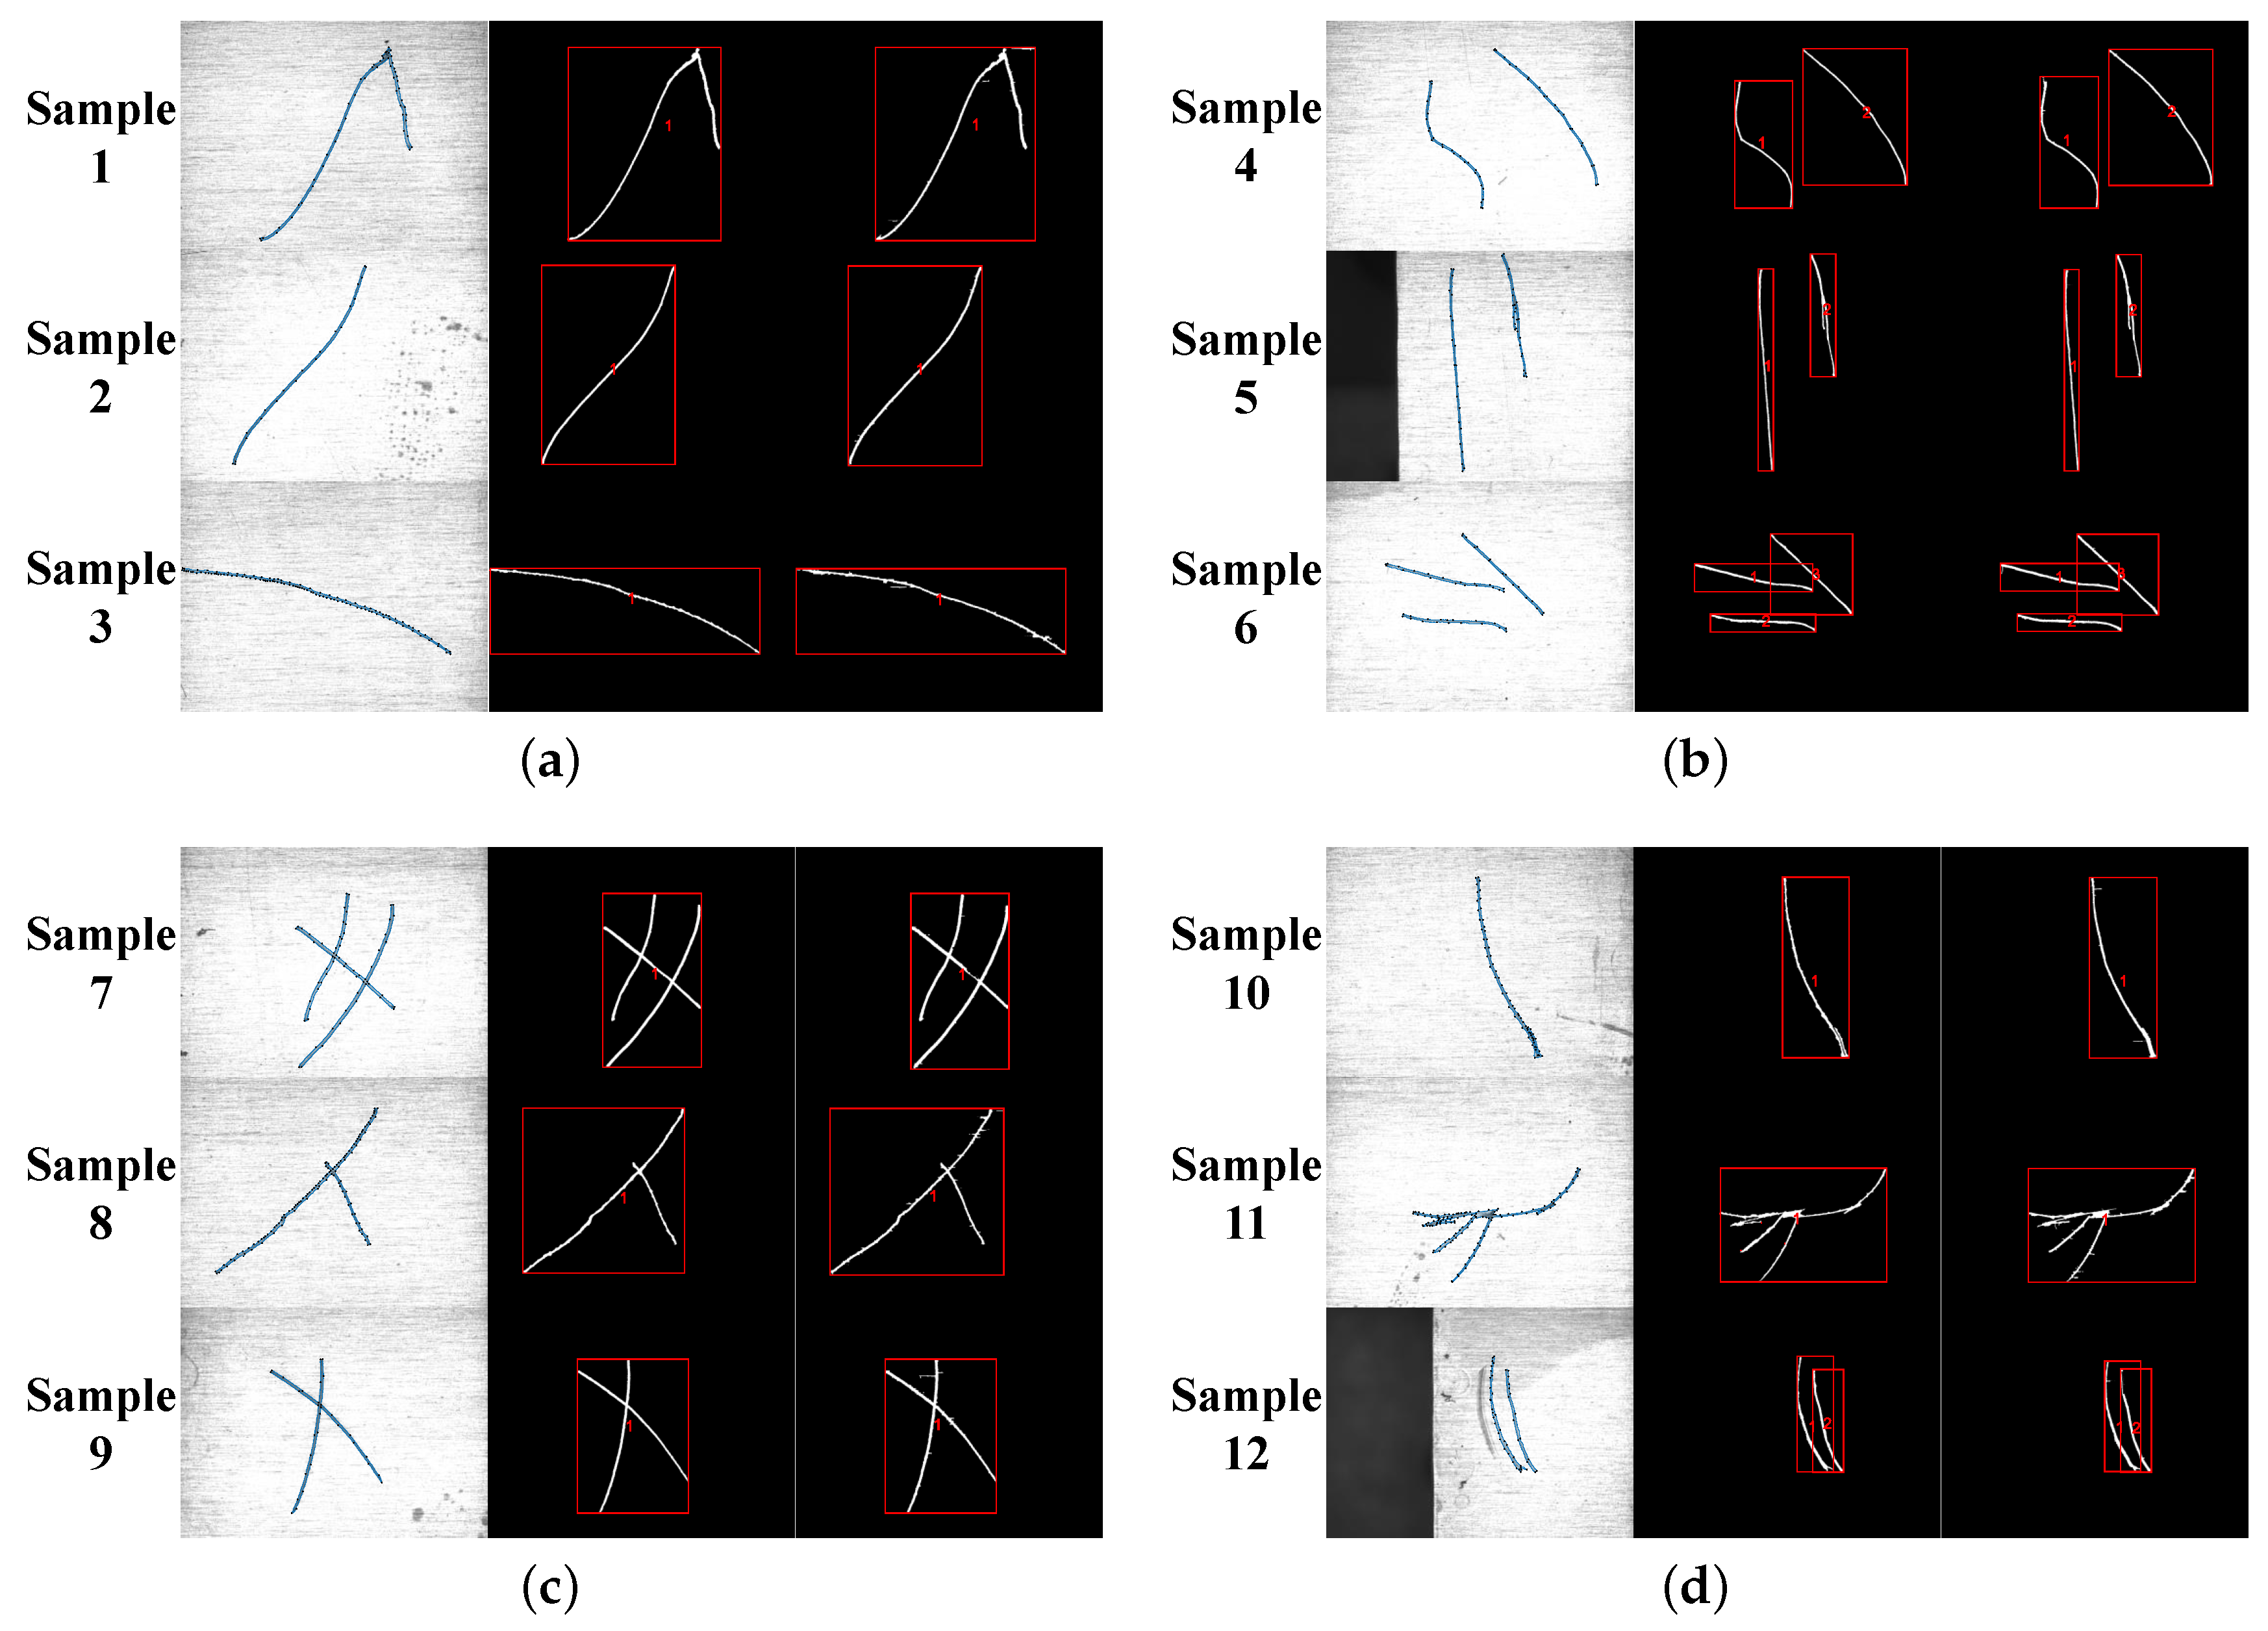
The proposed noise removal and texture suppression methods are used to process the real scratch images. Before detecting scratches, image preprocessing is required. In order to quantitatively evaluate the performance of the algorithm proposed in this paper, the error with the real value is calculated from three aspects of area, length, and position deviation, using the manually extracted region of interest as real value. The results are shown in
Figure 10 and
Table 1. The red boxes of
Figure 11a–d are the area where the scratch is located.
From
Table 1 and
Figure 11, we know that there are four types of scratches, each with three types, totaling 17 scratches. The real value indicates ROI, and scratches are manually extracted from the scratch images. The actual value represents the results obtained by the framework proposed in this paper. By comparative analysis, we can see that the accuracy of this algorithm is greater than 85% and the algorithm has more advantages in terms of accuracy.
The framework proposed in this article is compared with current scratch detection algorithms, and the results are shown in
Table 2. These algorithms are snake based on edge, fuzzy edge, log, K-means, fuzzy c-means, and method of combining superpixels with k-means (the original Canny is not included because using only Canny cannot remove texture) [
36]. The results show that the algorithm proposed in this article has better performance, can obtain more complete scratches, and is superior to other gradient algorithms. Compared with log, the proposed algorithm is more accurate and stable. The edge-based snake algorithm requires masks, and the number of iterations is difficult to determine, resulting in a wide fluctuation range of results. Although the texture is suppressed, the fuzzy edge algorithm will still recognize the residual texture as an edge of scratches, resulting in incorrect results. Compared with image segmentation algorithms, the algorithm proposed in this article can accurately obtain complete scratch contours.
4. Conclusions
This study proposes a scratch detection framework for zirconium sheets with surface interference. As can be seen from the previous text, this framework includes two parts: noise removal and texture suppression. An adaptive threshold algorithm based on DTCWT is proposed for denoising. At the same time, an optimized texture suppression algorithm based on RTVE is proposed for suppressing texture. Finally, an optimized Canny algorithm is used to detect scratch contours, and the result is compared with the real value.
This surface scratch detection solution is able to remove noise and suppress texture, solving the problem of background interference. The experimental results show that the comprehensive accuracy is greater than 85%, and the framework can effectively improve the accuracy of scratch detection. This optimized scratch detection algorithm framework is equivalent to a semiadaptive local threshold method, which is not only suitable for metal parts but also for other materials with similar surface, such as tile scratches. In the future work, complete adaptive scratch detection can be realized through threshold calculation, morphological processing and image enhancement, so that defects of different degrees and types can be detected.


