Training Specificity in Trail Running: A Single-Arm Trial on the Influence of Weighted Vest on Power and Kinematics in Trained Trail Runners

 ,
,  ,
,  ,
,  and
and 
Abstract
1. Introduction
2. Materials and Methods
2.1. Participants
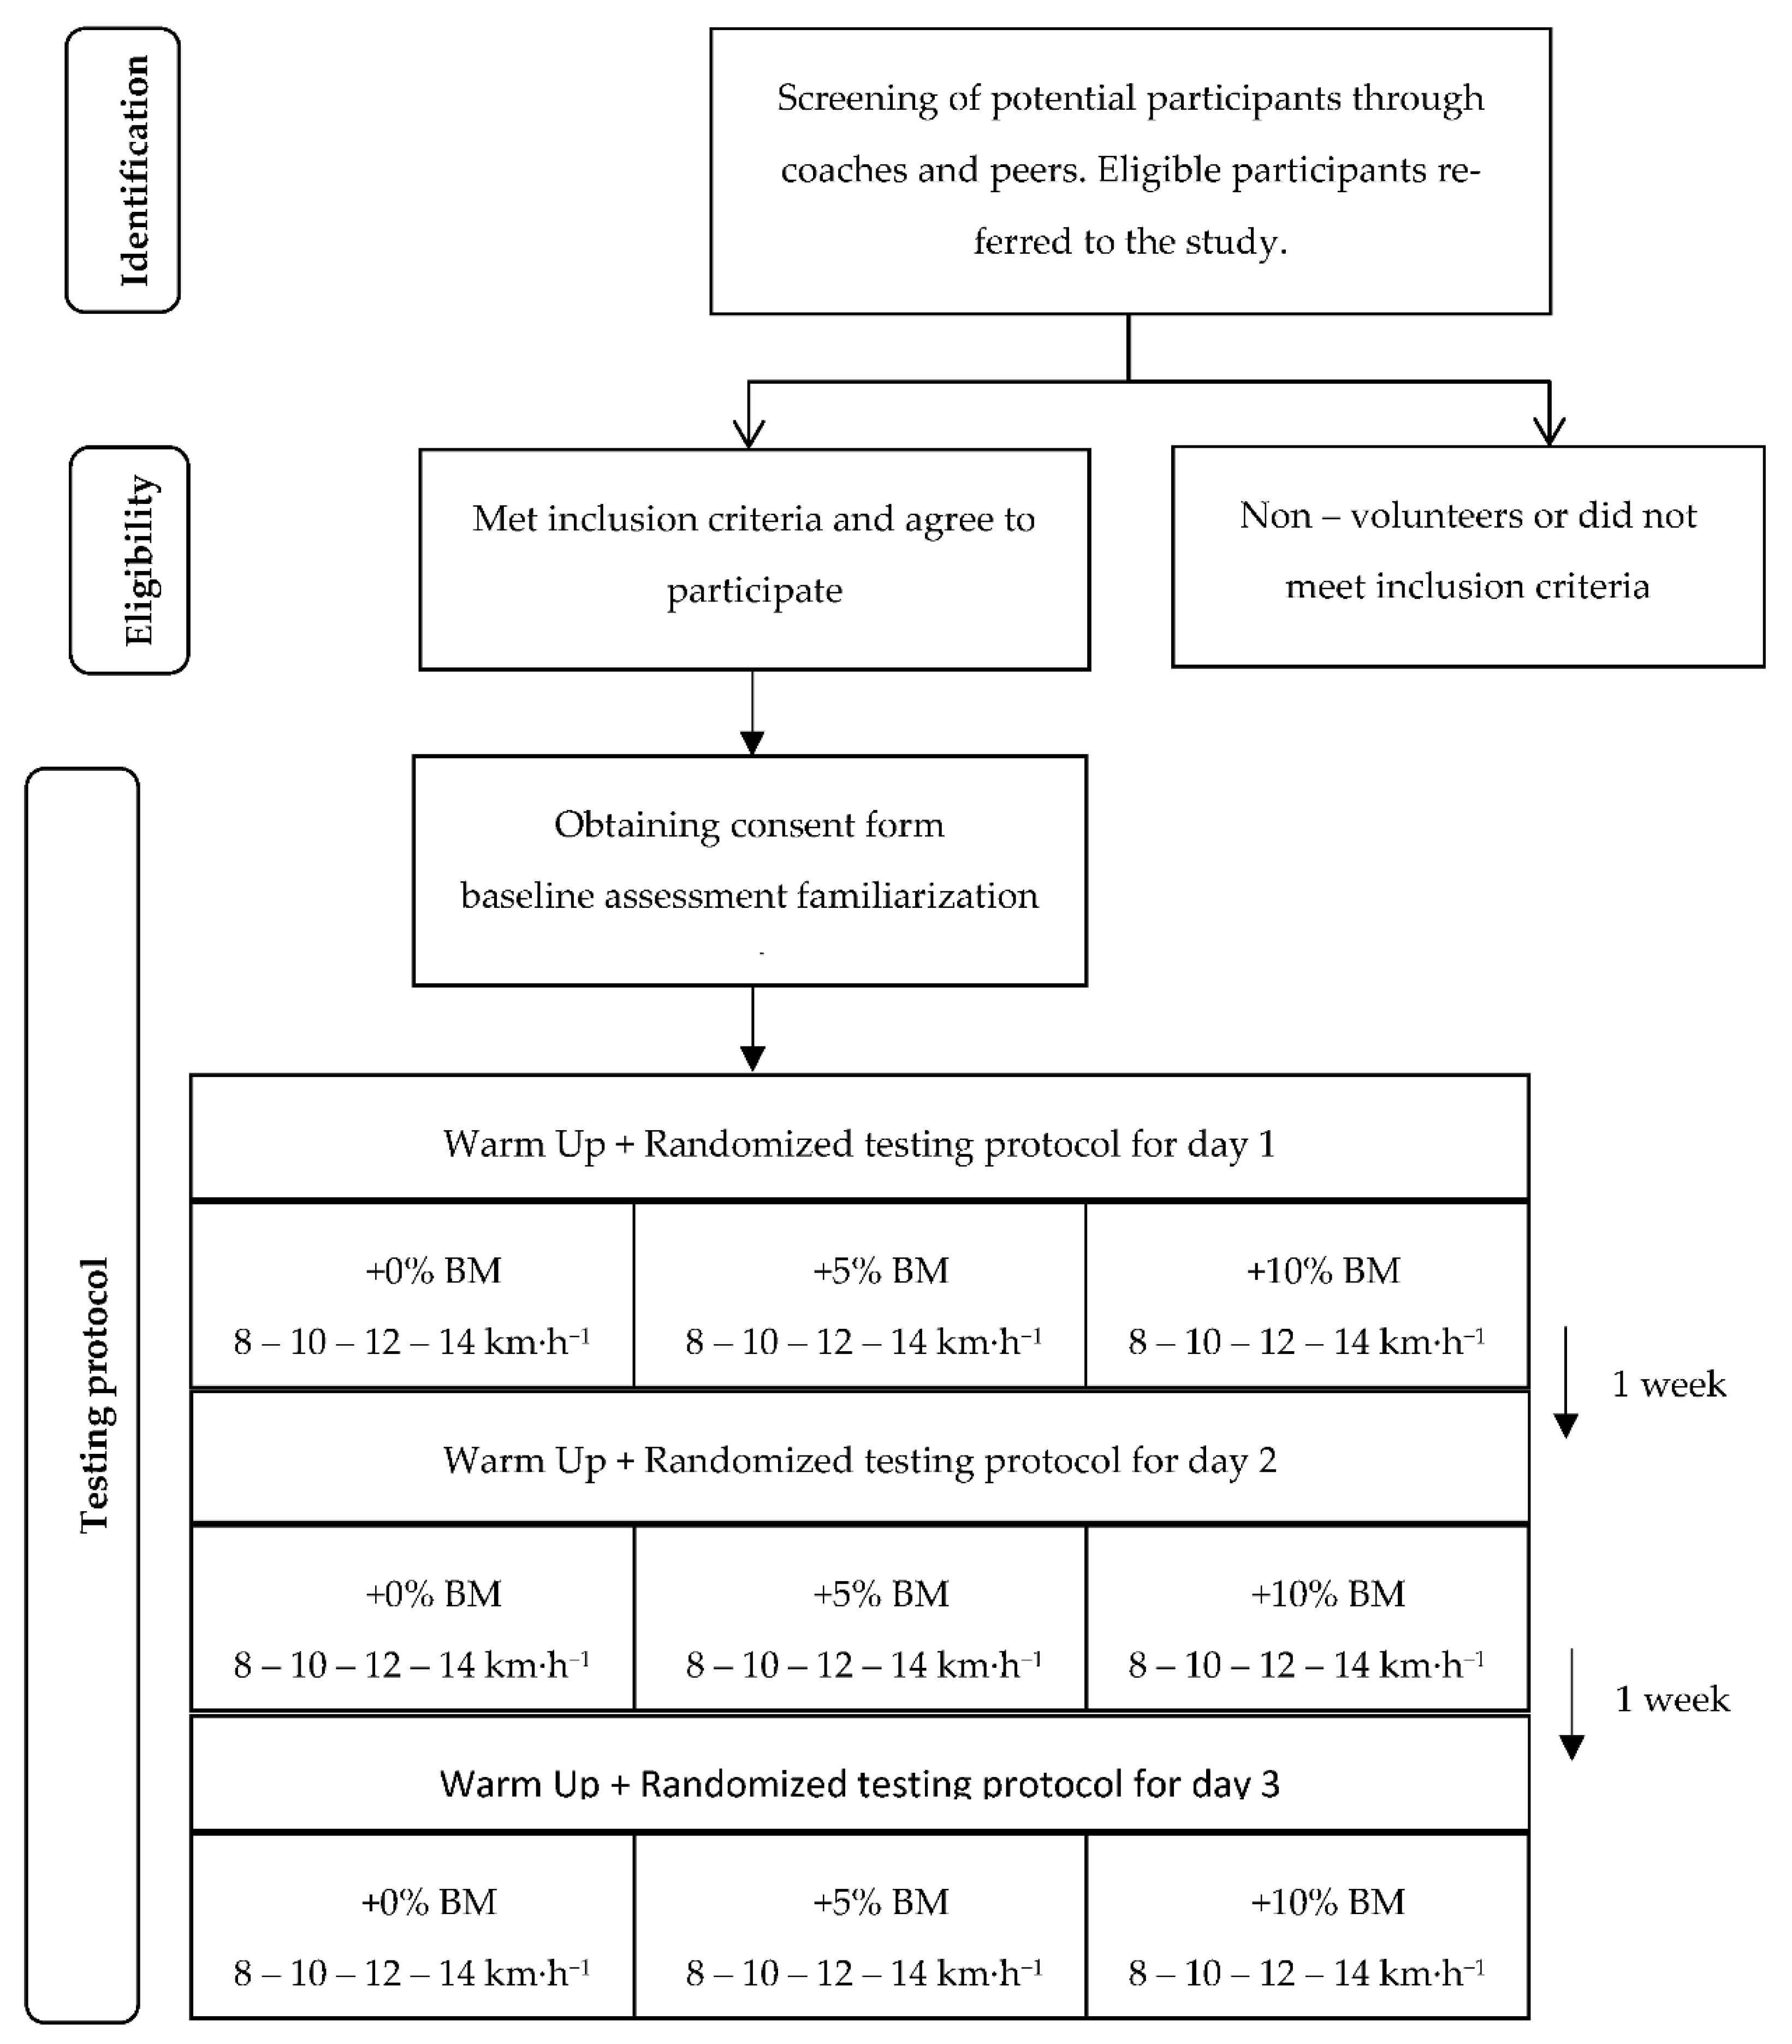
2.2. Procedures
2.3. Materials and Testing
2.4. Statistical Analysis
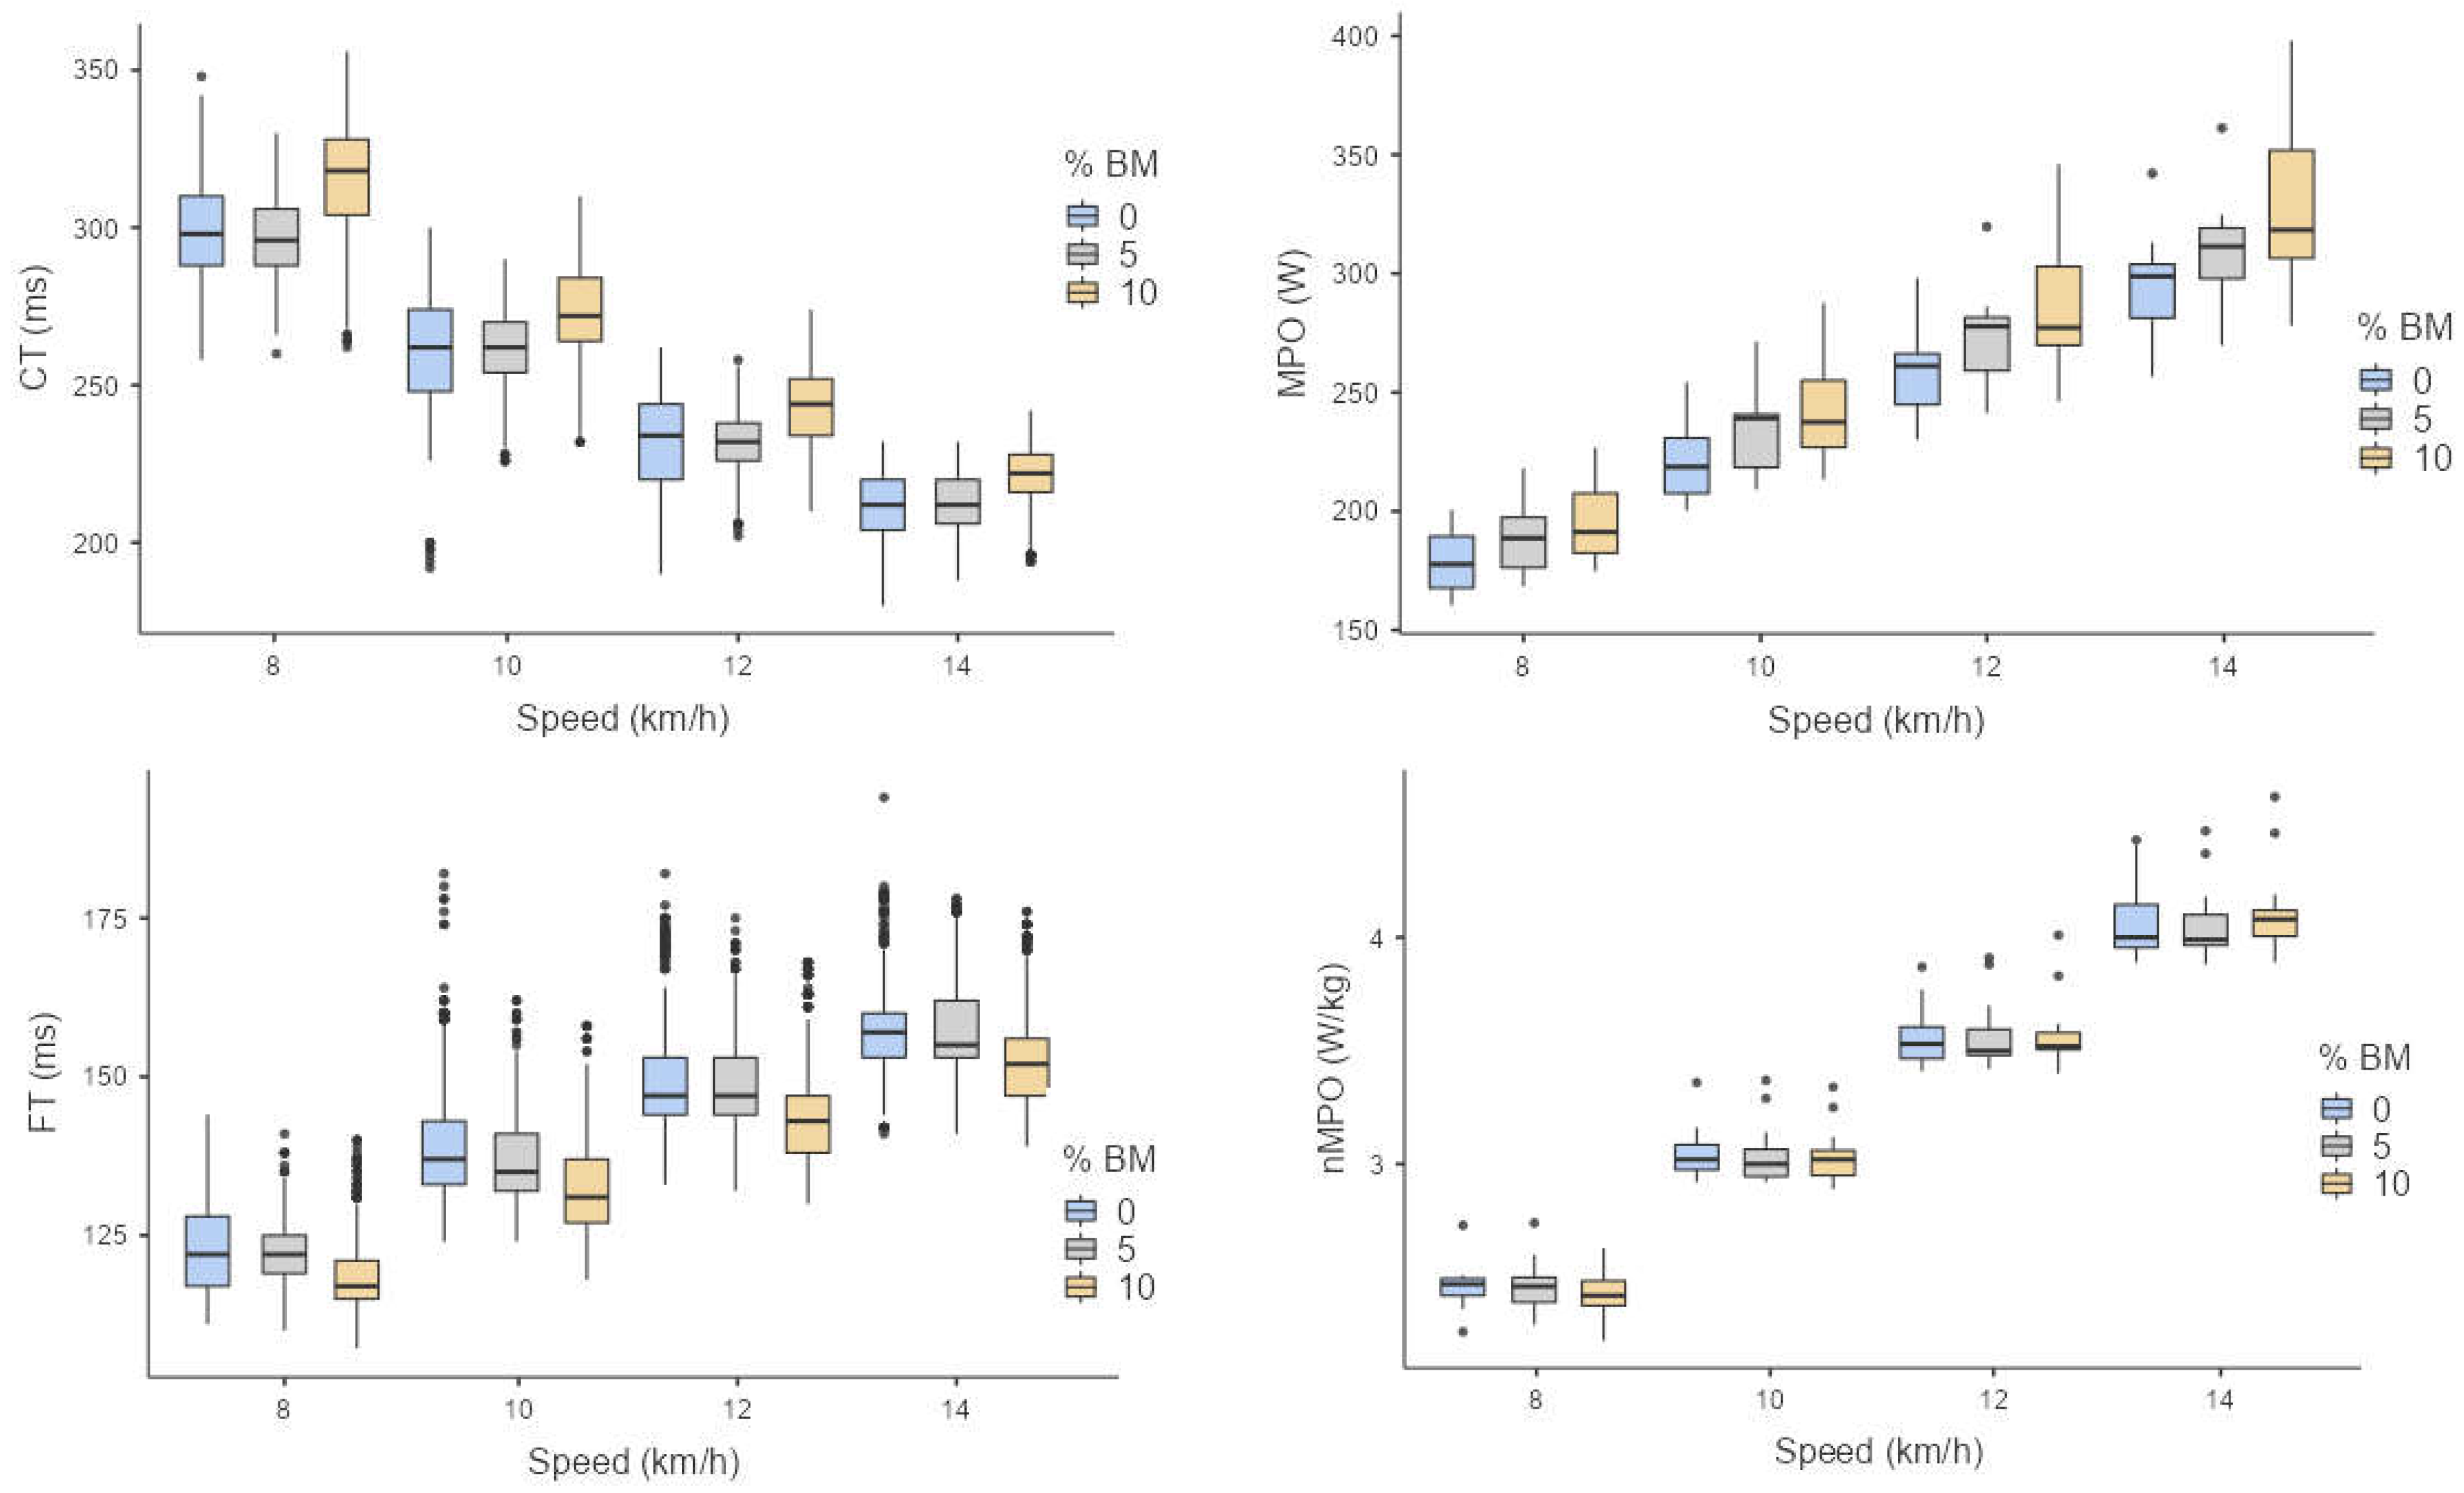
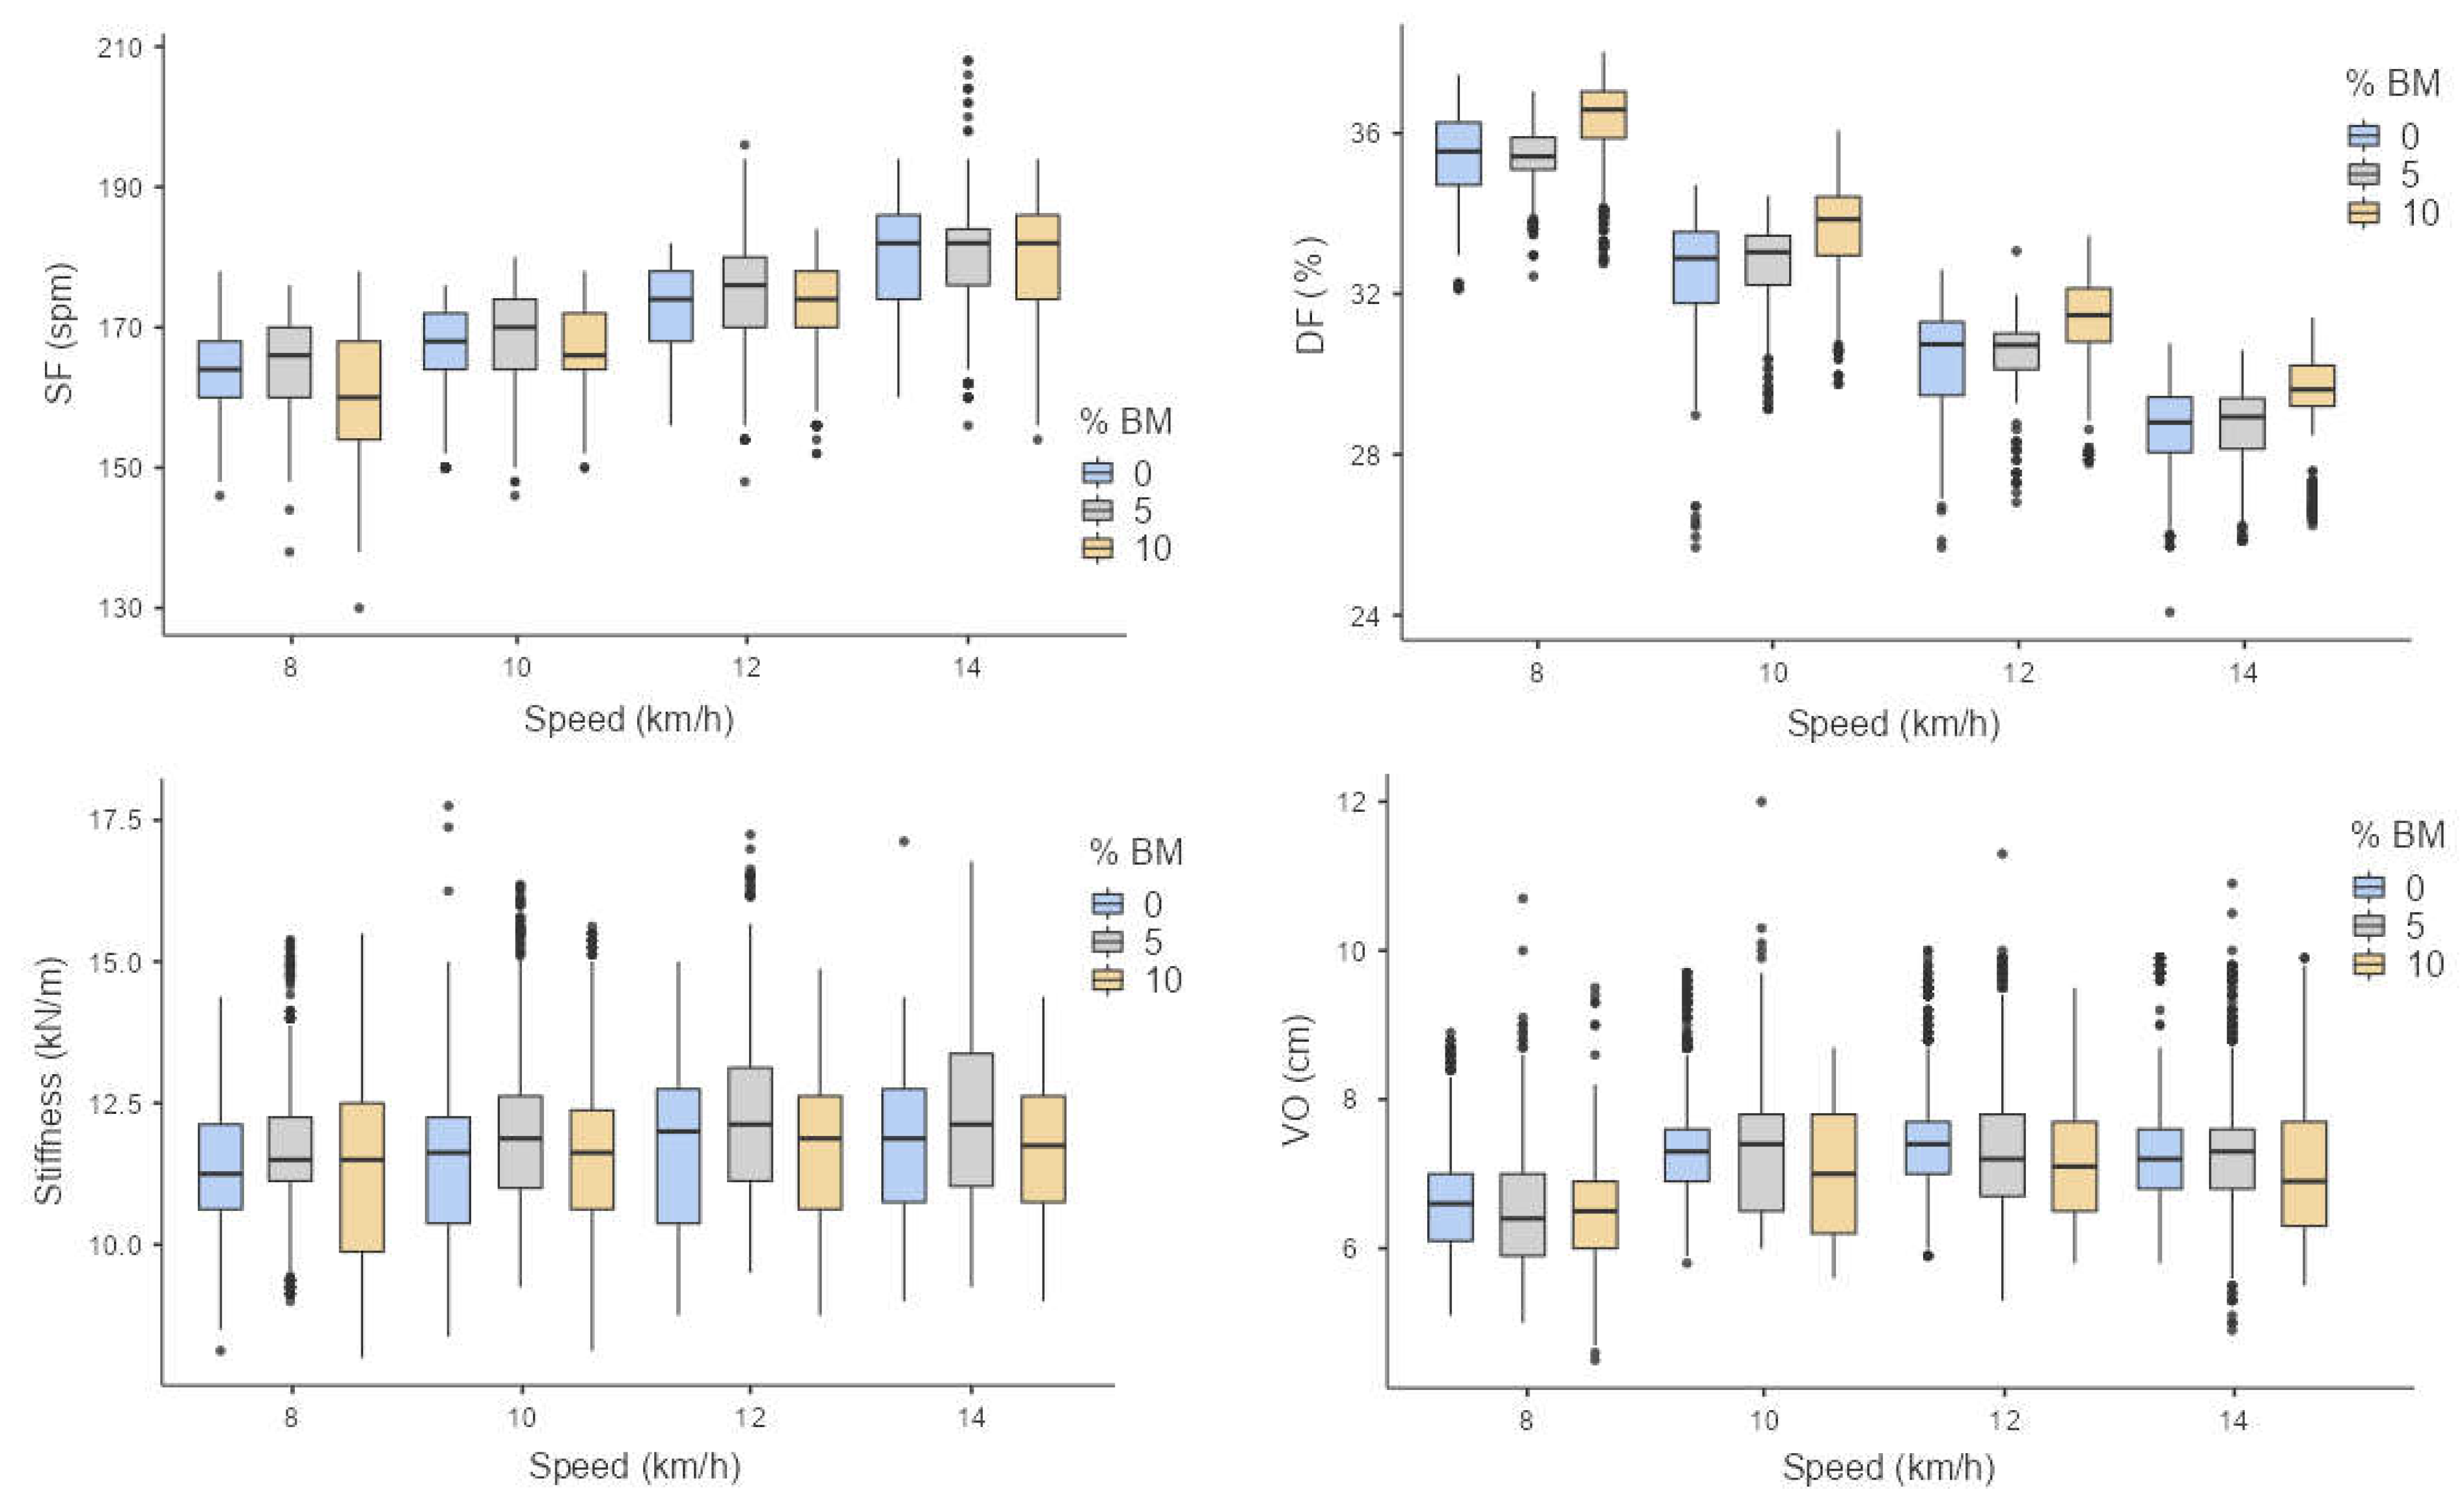
3. Results
4. Discussion
5. Conclusions
Author Contributions
Funding
Institutional Review Board Statement
Informed Consent Statement
Data Availability Statement
Acknowledgments
Conflicts of Interest
References
- Macadam, P.; Cronin, J.B.; Simperingham, K.D. The Effects of Wearable Resistance Training on Metabolic, Kinematic and Kinetic Variables During Walking, Running, Sprint Running and Jumping: A Systematic Review. Sports Med. 2017, 47, 887–906. [Google Scholar] [CrossRef] [PubMed]
- Silder, A.; Besier, T.; Delp, S.L. Running with a load increases leg stiffness. J. Biomech. 2015, 48, 1003–1008. [Google Scholar] [CrossRef] [PubMed]
- Busch, A.; Trounson, K.; Browne, P.; Robertson, S. Effects of lower limb light-weight wearable resistance on running biomechanics. J. Biomech. 2022, 130, 110903. [Google Scholar] [CrossRef]
- Lobb, N.J.; Fain, A.C.; Seymore, K.D.; Brown, T.N. Sex and stride length impact leg stiffness and ground reaction forces when running with body borne load. J. Biomech. 2019, 86, 96–101. [Google Scholar] [CrossRef] [PubMed]
- van Oeveren, B.T.; de Ruiter, C.J.; Beek, P.J.; van Dieën, J.H. The biomechanics of running and running styles: A synthesis. Sports Biomech. 2021. online ahead of print. [Google Scholar] [CrossRef]
- Cerezuela-Espejo, V.; Hernandez-Belmonte, A.; Courel-Ibanez, J.; Conesa-Ros, E.; Mora-Rodriguez, R.; Pallares, J.G. Are we ready to measure running power? Repeatability and concurrent validity of five commercial technologies. Eur. J. Sport Sci. 2021, 21, 341–350. [Google Scholar] [CrossRef]
- Ruiz-Alias, S.A.; Olaya-Cuartero, J.; Ñancupil-Andrade, A.A.; García-Pinillos, F. 9/3-Minute Running Critical Power Test: Mechanical Threshold Location with Respect to Ventilatory Thresholds and Maximum Oxygen Uptake. Int. J. Sports Physiol. Perform. 2022, 17, 1111–1118. [Google Scholar] [CrossRef]
- Jaén-Carrillo, D.; Roche-Seruendo, L.E.; Cartón-Llorente, A.; Ramírez-Campillo, R.; García-Pinillos, F. Mechanical Power in Endurance Running: A Scoping Review on Sensors for Power Output Estimation during Running. Sensors 2020, 20, 6482. [Google Scholar] [CrossRef]
- Sanders, D.; Myers, T.; Akubat, I. Training-Intensity Distribution in Road Cyclists: Objective Versus Subjective Measures. Int. J. Sports Physiol. Perform. 2017, 12, 1232–1237. [Google Scholar] [CrossRef]
- Halvorsen, K.; Eriksson, M.; Gullstrand, L. Acute effects of reducing vertical displacement and step frequency on running economy. J. Strength Cond. Res. 2012, 26, 2065–2070. [Google Scholar] [CrossRef]
- Struzik, A.; Karamanidis, K.; Lorimer, A.; Keogh, J.W.L.; Gajewski, J. Application of Leg, Vertical, and Joint Stiffness in Running Performance: A Literature Overview. Appl. Bionics Biomech. 2021, 2021, 9914278. [Google Scholar] [CrossRef]
- Macadam, P.; Cronin, J.B.; Feser, E.H. Acute and longitudinal effects of weighted vest training on sprint-running performance: A systematic review. Sports Biomech. 2022, 21, 239–254. [Google Scholar] [CrossRef]
- Feser, E.H.; Macadam, P.; Cronin, J.B. The effects of lower limb wearable resistance on sprint running performance: A systematic review. Eur. J. Sport Sci. 2020, 20, 394–406. [Google Scholar] [CrossRef]
- Jones, A.M.; Doust, J.H. A 1% treadmill grade most accurately reflects the energetic cost of outdoor running. J. Sports Sci. 1996, 14, 321–327. [Google Scholar] [CrossRef] [PubMed]
- García-Pinillos, F.; Latorre-Román, P.; Soto-Hermoso, V.M.; Párraga-Montilla, J.A.; Pantoja-Vallejo, A.; Ramírez-Campillo, R.; Roche-Seruendo, L.E. Agreement between the spatiotemporal gait parameters from two different wearable devices and high-speed video analysis. PLoS ONE 2019, 14, e0222872. [Google Scholar] [CrossRef]
- Fritz, C.O.; Morris, P.E.; Richler, J.J. Effect size estimates: Current use, calculations, and interpretation. J. Exp. Psychol. Gen. 2012, 141, 2–18. [Google Scholar] [CrossRef] [PubMed]
- Cross, M.R.; Brughelli, M.E.; Cronin, J.B. Effects of vest loading on sprint kinetics and kinematics. J. Strength Cond. Res. 2014, 28, 1867–1874. [Google Scholar] [CrossRef] [PubMed]
- Cronin, J.; Hansen, K.; Kawamori, N.; McNair, P. Effects of weighted vests and sled towing on sprint kinematics. Sports Biomech. 2008, 7, 160–172. [Google Scholar] [CrossRef] [PubMed]
- Cureton, K.J.; Sparling, P.B.; Evans, B.W.; Johnson, S.M.; Kong, U.D.; Purvis, J.W. Effect of experimental alterations in excess weight on aerobic capacity and distance running performance. Med. Sci. Sports 1978, 10, 194–199. [Google Scholar] [PubMed]
- Konstantinos, Z.; Athanasia, S.; Polyxeni, A.; Georgios, P.; Elias, Z.; Charilaos, T. Acute effects of loading using a weighted vest on running performance. Biol. Exerc. 2014, 10, 53–65. [Google Scholar]
- García-Pinillos, F.; Latorre-Roman, P.A.; Roche-Seruendo, L.E.; García-Ramos, A. Prediction of power output at different running velocities through the two-point method with the Stryd™ power meter. Gait Posture 2019, 68, 238–243. [Google Scholar] [CrossRef] [PubMed]
- Simperingham, K.; Cronin, J. Changes in sprint kinematics and kinetics with upper body loading and lower body loading using exogen exoskeletons: A pilot study. J. Aust. Strength Cond. 2014, 22, 69–72. [Google Scholar]
- Barnes, K.R.; Hopkins, W.G.; McGuigan, M.R.; Kilding, A.E. Warm-up with a weighted vest improves running performance via leg stiffness and running economy. J. Sci. Med. Sport 2015, 18, 103–108. [Google Scholar] [CrossRef] [PubMed]
- Van Hooren, B.; Fuller, J.T.; Buckley, J.D.; Miller, J.R.; Sewell, K.; Rao, G.; Barton, C.; Bishop, C.; Willy, R.W. Is Motorized Treadmill Running Biomechanically Comparable to Overground Running? A Systematic Review and Meta-Analysis of Cross-Over Studies. Sports Med. 2020, 50, 785–813. [Google Scholar] [CrossRef] [PubMed]


| Variable | Mean (SD) |
|---|---|
| Age (years) | 37.4 (5.8) |
| Height (m) | 176.2 (4.5) |
| Weight (kg) | 72.6 (4.9) |
| BMI (m/kg2) | 23.4 (1.9) |
| Body fat % | 11.9 (3.4) |
| Km/week | 49.7 (20.7) |
| Speed | Variable | +0% BM | +5% BM | +10% BM | 0 vs. 5% BM | ES | 0 vs. 10% BM | ES | 5 vs. 10% BM | ES |
|---|---|---|---|---|---|---|---|---|---|---|
| 8 km·h−1 | Power (w) | 179 ± 3 | 187 ± 4 | 195 ± 4 | −9 ± 5 | 2.7 | −16 ± 5 * | 5.3 | −7 ± 5 | 2.0 |
| Power (w/kg) | 2.46 ± 0.03 | 2.47 ± 0.03 | 2.43 ± 0.03 | −0.01 ± 0.03 | 0.3 | 0.02 ± 0.04 | 1.0 | 0.05 ± 0.01 | 1.3 | |
| LSS (kN/m) | 11.36 ± 1.17 | 11.71 ± 1.22 | 11.34 ± 1.52 | −0.35 ± 0.05 * | 0.3 | 0.02 ± 0.06 | 0.0 | 0.37 ± 0.06 | 0.0 | |
| GCT (ms) | 299 ± 17 | 297 ± 12 | 316 ± 19 | 2 ± 1 * | 0.2 | −17 ± 1 * | 0.8 | −20 ± 1 * | 0.9 | |
| FT (ms) | 123 ± 6 | 123 ± 5 | 118 ± 5 | 0.1 ± 0.2 | 0.0 | 4.3 ± 0.2 * | 0.8 | 4.3 ± 0.2 * | 0.9 | |
| DF (%) | 35.4 ± 1.0 | 35.4 ± 0.7 | 36.4 ± 0.9 | 0.1 ± 0.0 | 0.0 | −0.9 ± 0.1 * | 0.9 | −1.0 ± 0.1 * | 1.1 | |
| SF (spm) | 164 ± 5 | 165 ± 6 | 161 ± 7 | −1 ± 0.3 * | 0.2 | 3 ± 0.3 * | 0.5 | 4 ± 0.3 * | 0.7 | |
| SL (cm) | 81 ± 4 | 81 ± 4 | 81 ± 4 | 0 ± 0 | 0.0 | −1 ± 0 * | 0.2 | −1 ± 0 * | 0.2 | |
| VO (cm) | 6.6 ± 0.7 | 6.5 ± 0.7 | 6.4 ± 0.7 | 0.1 ± 0.0 | 0.1 | 0.1 ± 0.0 * | 0.2 | 0.1 ± 0.0 | 0.1 | |
| 10 km·h−1 | Power (w) | 221 ± 4 | 232 ± 4 | 243 ± 5 | −11 ± 7 | 2.7 | −22 ± 7 * | 5.5 | −11 ± 7 | 2.7 |
| Power (w/kg) | 3.04 ± 0.03 | 3.04 ± 0.04 | 3.03 ± 0.03 | 0.00 ± 0.01 | 0.0 | 0.01 ± 0.05 | 0.3 | 0.00 ± 0.05 | 0.3 | |
| LSS (kN/m) | 11.57 ± 1.28 | 11.89 ± 1.48 | 11.65 ± 1.49 | −0.32 ± 0.07 * | 0.2 | −0.08 ± 0.07 | 0.1 | 0.24 ± 0.07 * | 0.2 | |
| GCT (ms) | 259 ± 15 | 262 ± 12 | 271 ± 16 | −3 ± 1 * | 0.2 | −12 ± 1 * | 0.8 | −10 ± 1 * | 0.7 | |
| FT (ms) | 139 ± 8 | 137 ± 6 | 133 ± 8 | 2.1 ± 0.3 * | 0.3 | 5.9 ± 0.4 * | 0.7 | 3.8 ± 0.3 * | 0.5 | |
| DF (%) | 32.5 ± 1.2 | 32.8 ± 0.9 | 33.5 ± 1.2 | −0.3 ± 0.1 * | 0.3 | −1.0 ± 0.1 * | 0.8 | −0.7 ± 0.1 * | 0.7 | |
| SF (spm) | 167 ± 6 | 168 ± 7 | 167 ± 7 | −1 ± 0.3 | 0.1 | 0.4 ± 0.3 | 0.1 | 1 ± 0.3 * | 0.2 | |
| SL (cm) | 100 ± 5 | 100 ± 5 | 100 ± 5 | 0 ± 0 | 0.0 | 1 ± 0 | 0.0 | −1 ± 0 | 0.0 | |
| VO (cm) | 7.4 ± 0.8 | 7.3 ± 0.8 | 7.1 ± 0.9 | 0.1 ± 0.0 * | 0.2 | 0.3 ± 0.0 * | 0.4 | 0.2 ± 0.0 * | 0.2 | |
| 12 km·h−1 | Power (w) | 258 ± 4 | 272 ± 5 | 286 ± 7 | −14 ± 8 | 3.5 | −28 ± 8 * | 7.0 | −14 ± 8 | 2.8 |
| Power (w/kg) | 3.56 ± 0.03 | 3.57 ± 0.04 | 3.57 ± 0.04 | −0.01 ± 0.05 | 0.3 | −0.02 ± 0.05 | 0.3 | 0.01 ± 0.05 | 0.0 | |
| LSS (kN/m) | 11.78 ± 1.38 | 12.25 ± 1.41 | 11.74 ± 1.33 | −0.47 ± 0.07 * | 0.3 | 0.04 ± 0.07 * | 0.1 | 0.51 ± 0.07 * | 0.4 | |
| GCT (ms) | 233 ± 23 | 233 ± 23 | 242 ± 24 | 0 ± 1 | 0.1 | −10 ± 1 * | 0.4 | −10 ± 0.5 * | 0.4 | |
| FT (ms) | 149 ± 9 | 148 ± 6 | 144 ± 8 | 0.9 ± 0.3 * | 0.1 | 5.4 ± 0.4 * | 0.7 | 4.5 ± 0.3 * | 0.7 | |
| DF (%) | 30.4 ± 1.3 | 30.5 ± 0.7 | 31.4 ± 1.1 | −0.1 ± 0.1 | 0.1 | −0.9 ± 0.1 * | 0.8 | −0.8 ± 0.1 * | 1.0 | |
| SF (spm) | 174 ± 6 | 174 ± 8 | 173 ± 7 | −0.8 ± 0.3 * | 0.1 | 0.6 ± 0.3 | 0.0 | 1.4 ± 0.3 * | 0.1 | |
| SL (cm) | 116 ± 5 | 116 ± 6 | 116 ± 5 | −0 ± 0 | 0.0 | −0 ± 0 | 0.1 | −0 ± 0 | 0.1 | |
| VO (cm) | 7.4 ± 0.8 | 7.4 ± 0.9 | 7.2 ± 0.9 | 0.0 ± 0.0 | 0.0 | 0.2 ± 0.0 * | 0.2 | 0.2 ± 0.0 * | 0.2 | |
| 14 km·h−1 | Power (w) | 295 ± 5 | 309 ± 5 | 329 ± 8 | −15 ± 9 | 2.8 | −34 ± 9 * | 6.8 | −19 ± 9 * | 4.0 |
| Power (w/kg) | 4.06 ± 0.04 | 4.06 ± 0.04 | 4.11 ± 0.05 | −0.00 ± 0.06 | 0.0 | −0.05 ± 0.06 | 1.3 | 0.04 ± 0.06 | 1.2 | |
| LSS (kN/m) | 11.78 ± 1.33 | 12.24 ± 1.52 | 11.66 ± 1.27 | −0.47 ± 0.07 * | 0.2 | 0.12 ± 0.07 | 0.1 | 0.59 ± 0.07 * | 0.4 | |
| GCT (ms) | 212 ± 21 | 212 ± 21 | 221 ± 22 | 0 ± 0 | 0.0 | −9 ± 1 * | 0.4 | −9 ± 1 * | 0.4 | |
| FT (ms) | 158 ± 7 | 157 ± 7 | 152 ± 9 | 0.3 ± 0.3 | 0.0 | 5.9 ± 0.4 * | 0.7 | 5.6 ± 0.4 * | 0.7 | |
| DF (%) | 28.7 ± 1.0 | 28.7 ± 0.9 | 29.6 ± 1.1 | −0.0 ± 0.0 | 0.0 | −0.9 ± 0.1 * | 0.9 | −0.9 ± 0.1 * | 0.9 | |
| SF (spm) | 180 ± 7 | 180 ± 8 | 180 ± 9 | −0.3 ± 0.4 | 0.0 | 0.2 ± 0.4 | 0.0 | 0.5 ± 0.4 | 0.1 | |
| SL (cm) | 129 ± 5 | 130 ± 6 | 130 ± 7 | −1 ± 0 | 0.1 | −1 ± 0 | 0.1 | −0 ± 0 | 0.0 | |
| VO (cm) | 7.3 ± 0.8 | 7.3 ± 0.8 | 7.1 ± 1.0 | 0.0 ± 0.0 | 0.0 | 0.2 ± 0.0 * | 0.3 | 0.2 ± 0.0 * | 0.3 |
Disclaimer/Publisher’s Note: The statements, opinions and data contained in all publications are solely those of the individual author(s) and contributor(s) and not of MDPI and/or the editor(s). MDPI and/or the editor(s) disclaim responsibility for any injury to people or property resulting from any ideas, methods, instructions or products referred to in the content. |
© 2023 by the authors. Licensee MDPI, Basel, Switzerland. This article is an open access article distributed under the terms and conditions of the Creative Commons Attribution (CC BY) license (https://creativecommons.org/licenses/by/4.0/).
Share and Cite
Cartón-Llorente, A.; Rubio-Peirotén, A.; Cardiel-Sánchez, S.; Roche-Seruendo, L.E.; Jaén-Carrillo, D. Training Specificity in Trail Running: A Single-Arm Trial on the Influence of Weighted Vest on Power and Kinematics in Trained Trail Runners. Sensors 2023, 23, 6411. https://doi.org/10.3390/s23146411
Cartón-Llorente A, Rubio-Peirotén A, Cardiel-Sánchez S, Roche-Seruendo LE, Jaén-Carrillo D. Training Specificity in Trail Running: A Single-Arm Trial on the Influence of Weighted Vest on Power and Kinematics in Trained Trail Runners. Sensors. 2023; 23(14):6411. https://doi.org/10.3390/s23146411
Chicago/Turabian StyleCartón-Llorente, Antonio, Alberto Rubio-Peirotén, Silvia Cardiel-Sánchez, Luis E. Roche-Seruendo, and Diego Jaén-Carrillo. 2023. "Training Specificity in Trail Running: A Single-Arm Trial on the Influence of Weighted Vest on Power and Kinematics in Trained Trail Runners" Sensors 23, no. 14: 6411. https://doi.org/10.3390/s23146411
APA StyleCartón-Llorente, A., Rubio-Peirotén, A., Cardiel-Sánchez, S., Roche-Seruendo, L. E., & Jaén-Carrillo, D. (2023). Training Specificity in Trail Running: A Single-Arm Trial on the Influence of Weighted Vest on Power and Kinematics in Trained Trail Runners. Sensors, 23(14), 6411. https://doi.org/10.3390/s23146411