


Evaluating Urban Building Damage of 2023 Kahramanmaras, Turkey Earthquake Sequence Using SAR Change Detection

 ,
,
Abstract
1. Introduction
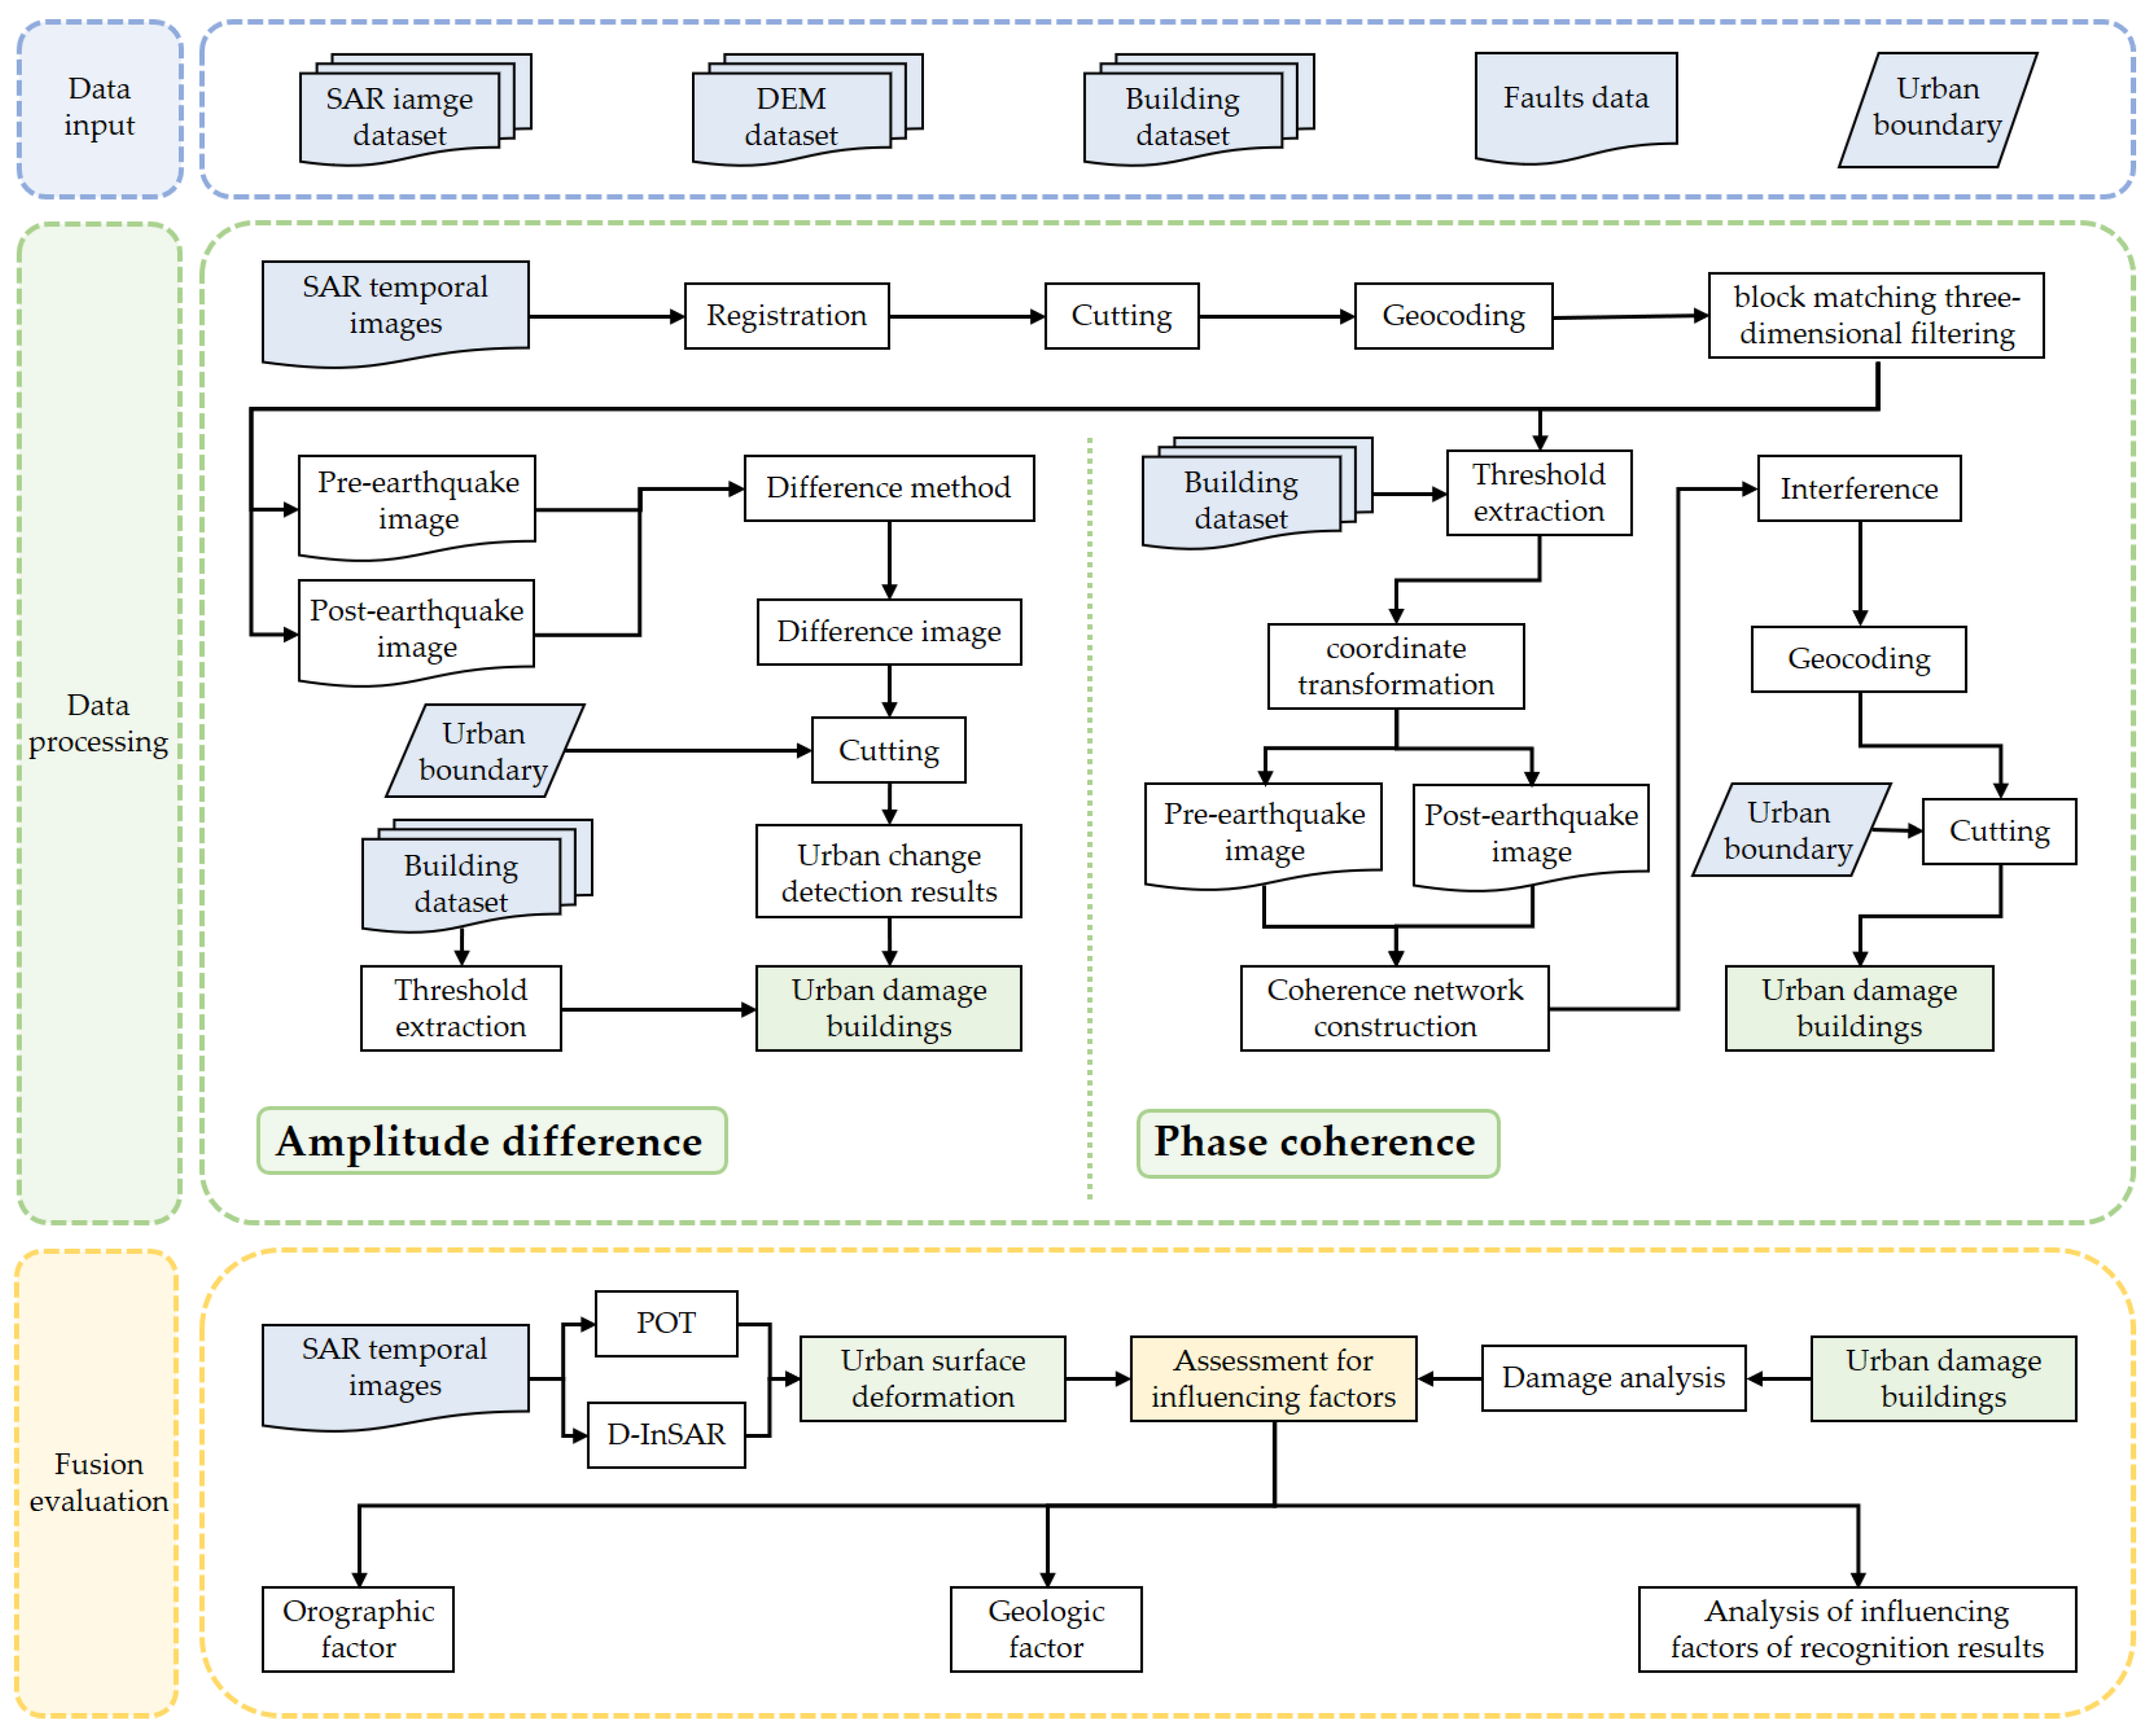
2. Method
2.1. Amplitude Difference Extracts Damaged Buildings in the Affected Urban Area
2.2. Coherence Change Detection Extracts Damaged Buildings in the Affected Urban Area
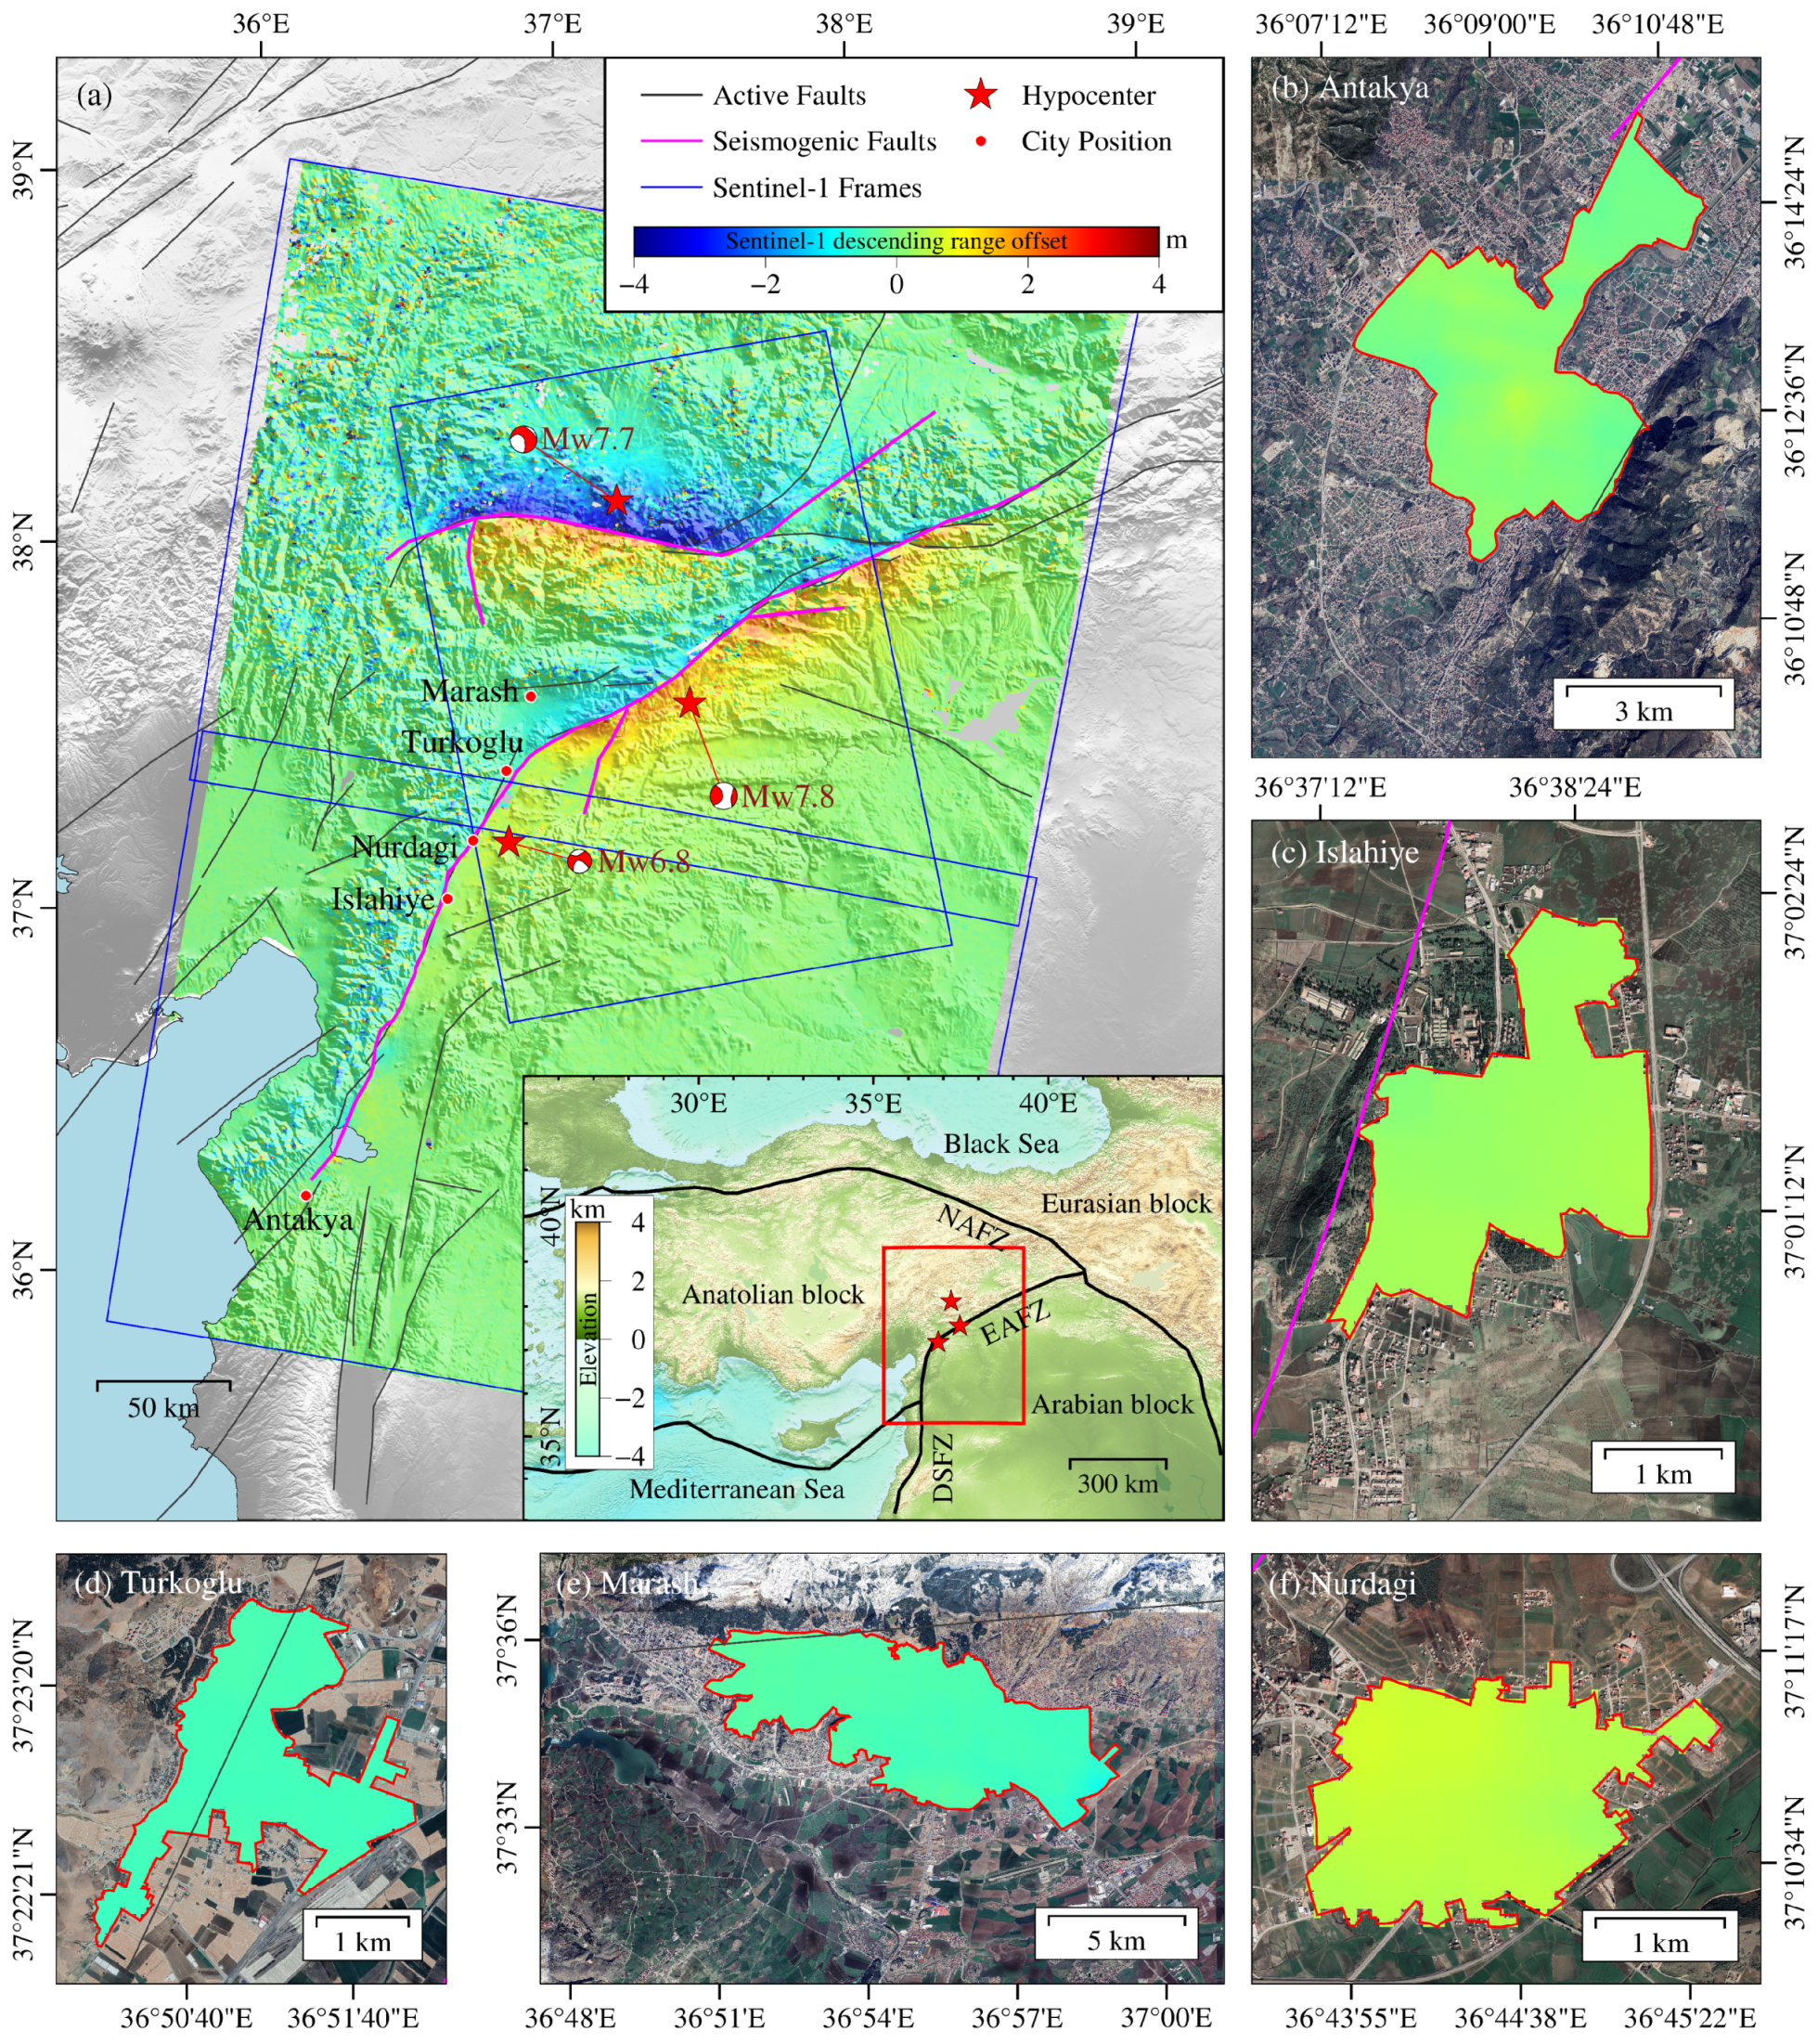
3. Data Processing and Results
3.1. Dataset
3.2. Data Procecssing
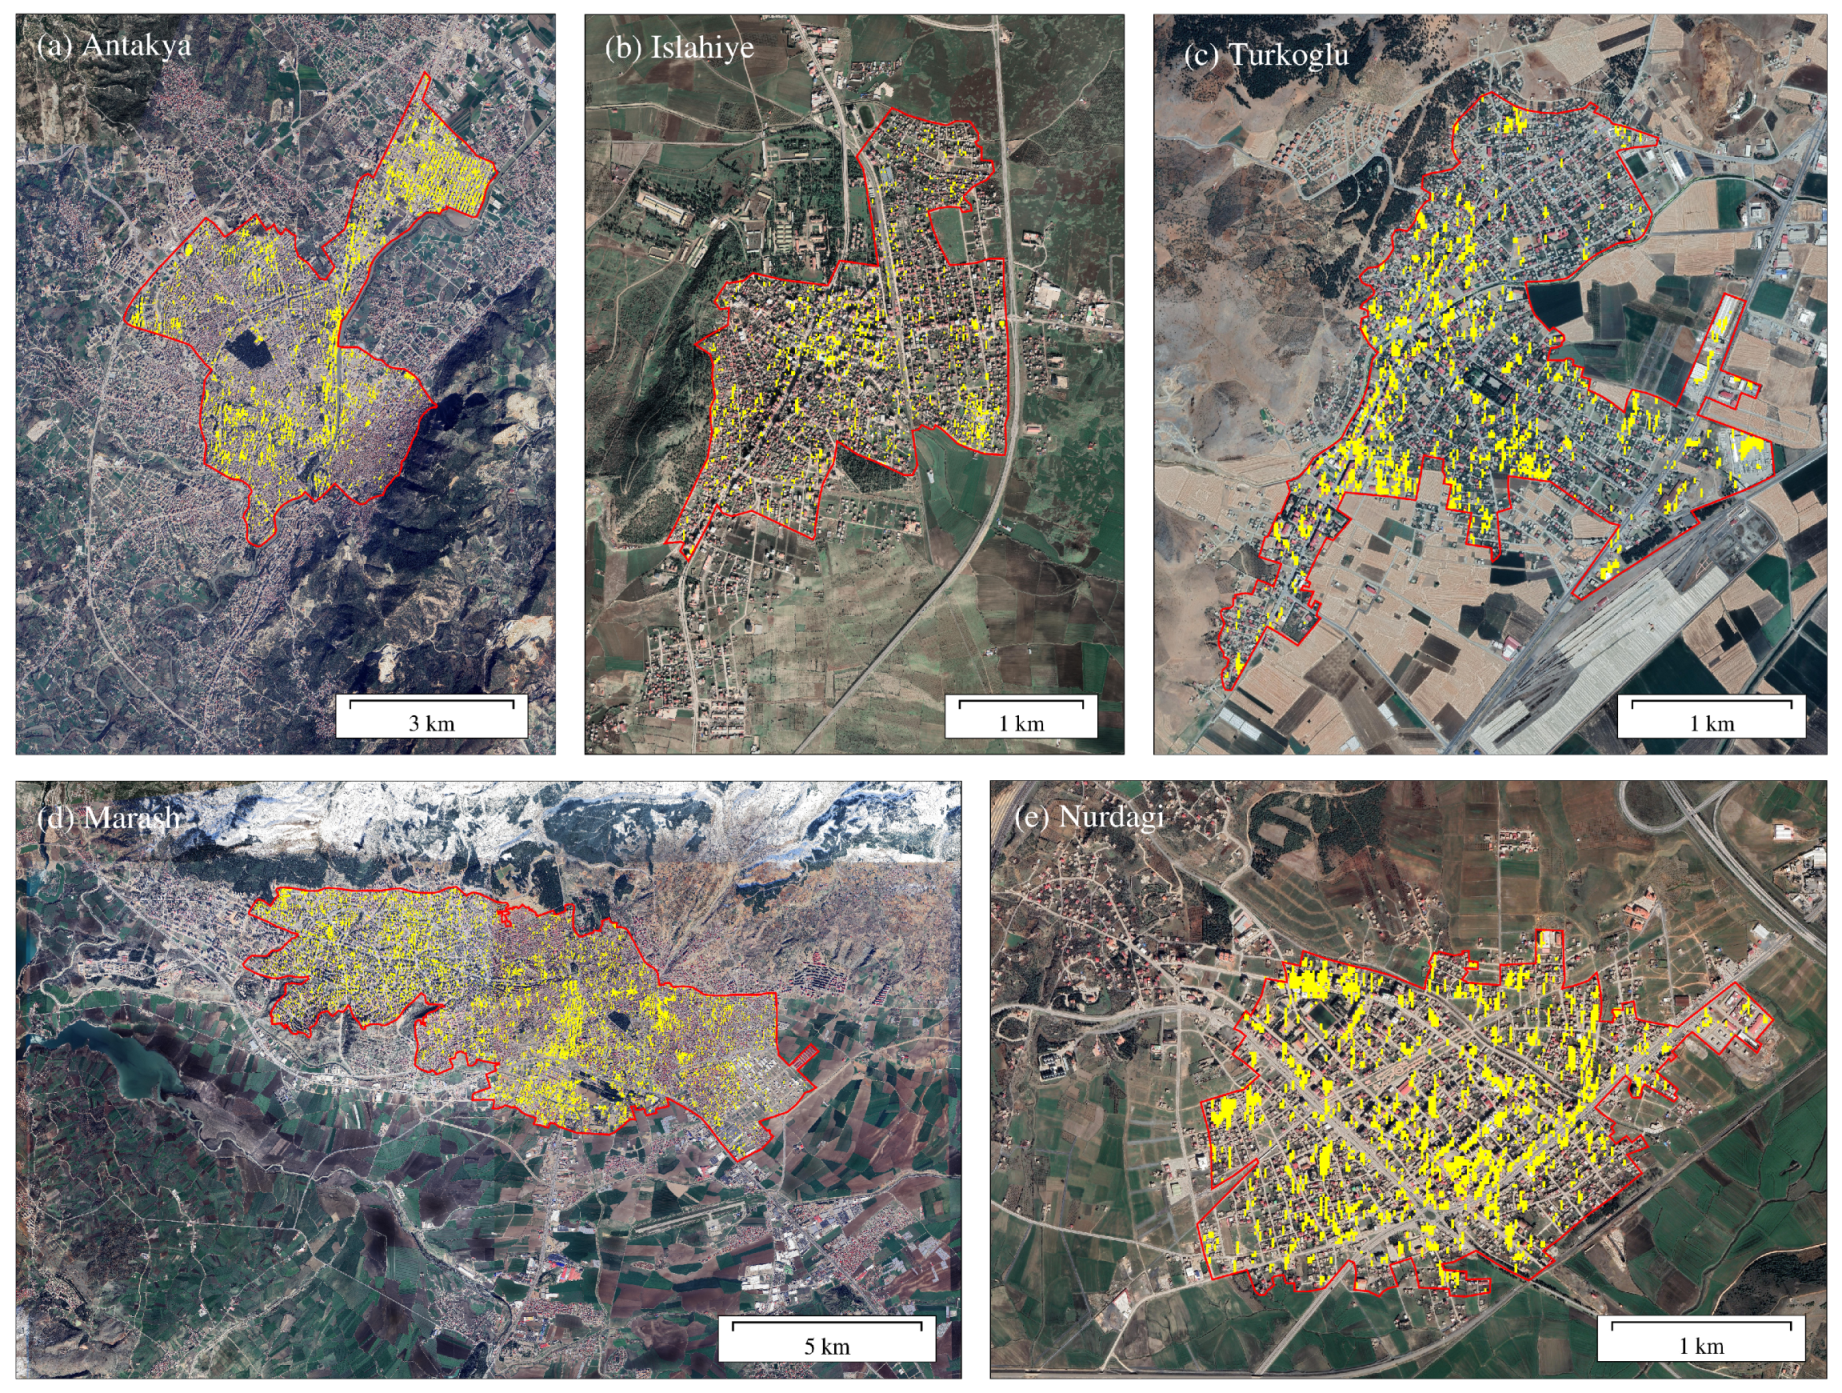
3.3. Results
4. Discussion
4.1. Comparative Study on the Damaged Building Identification Results
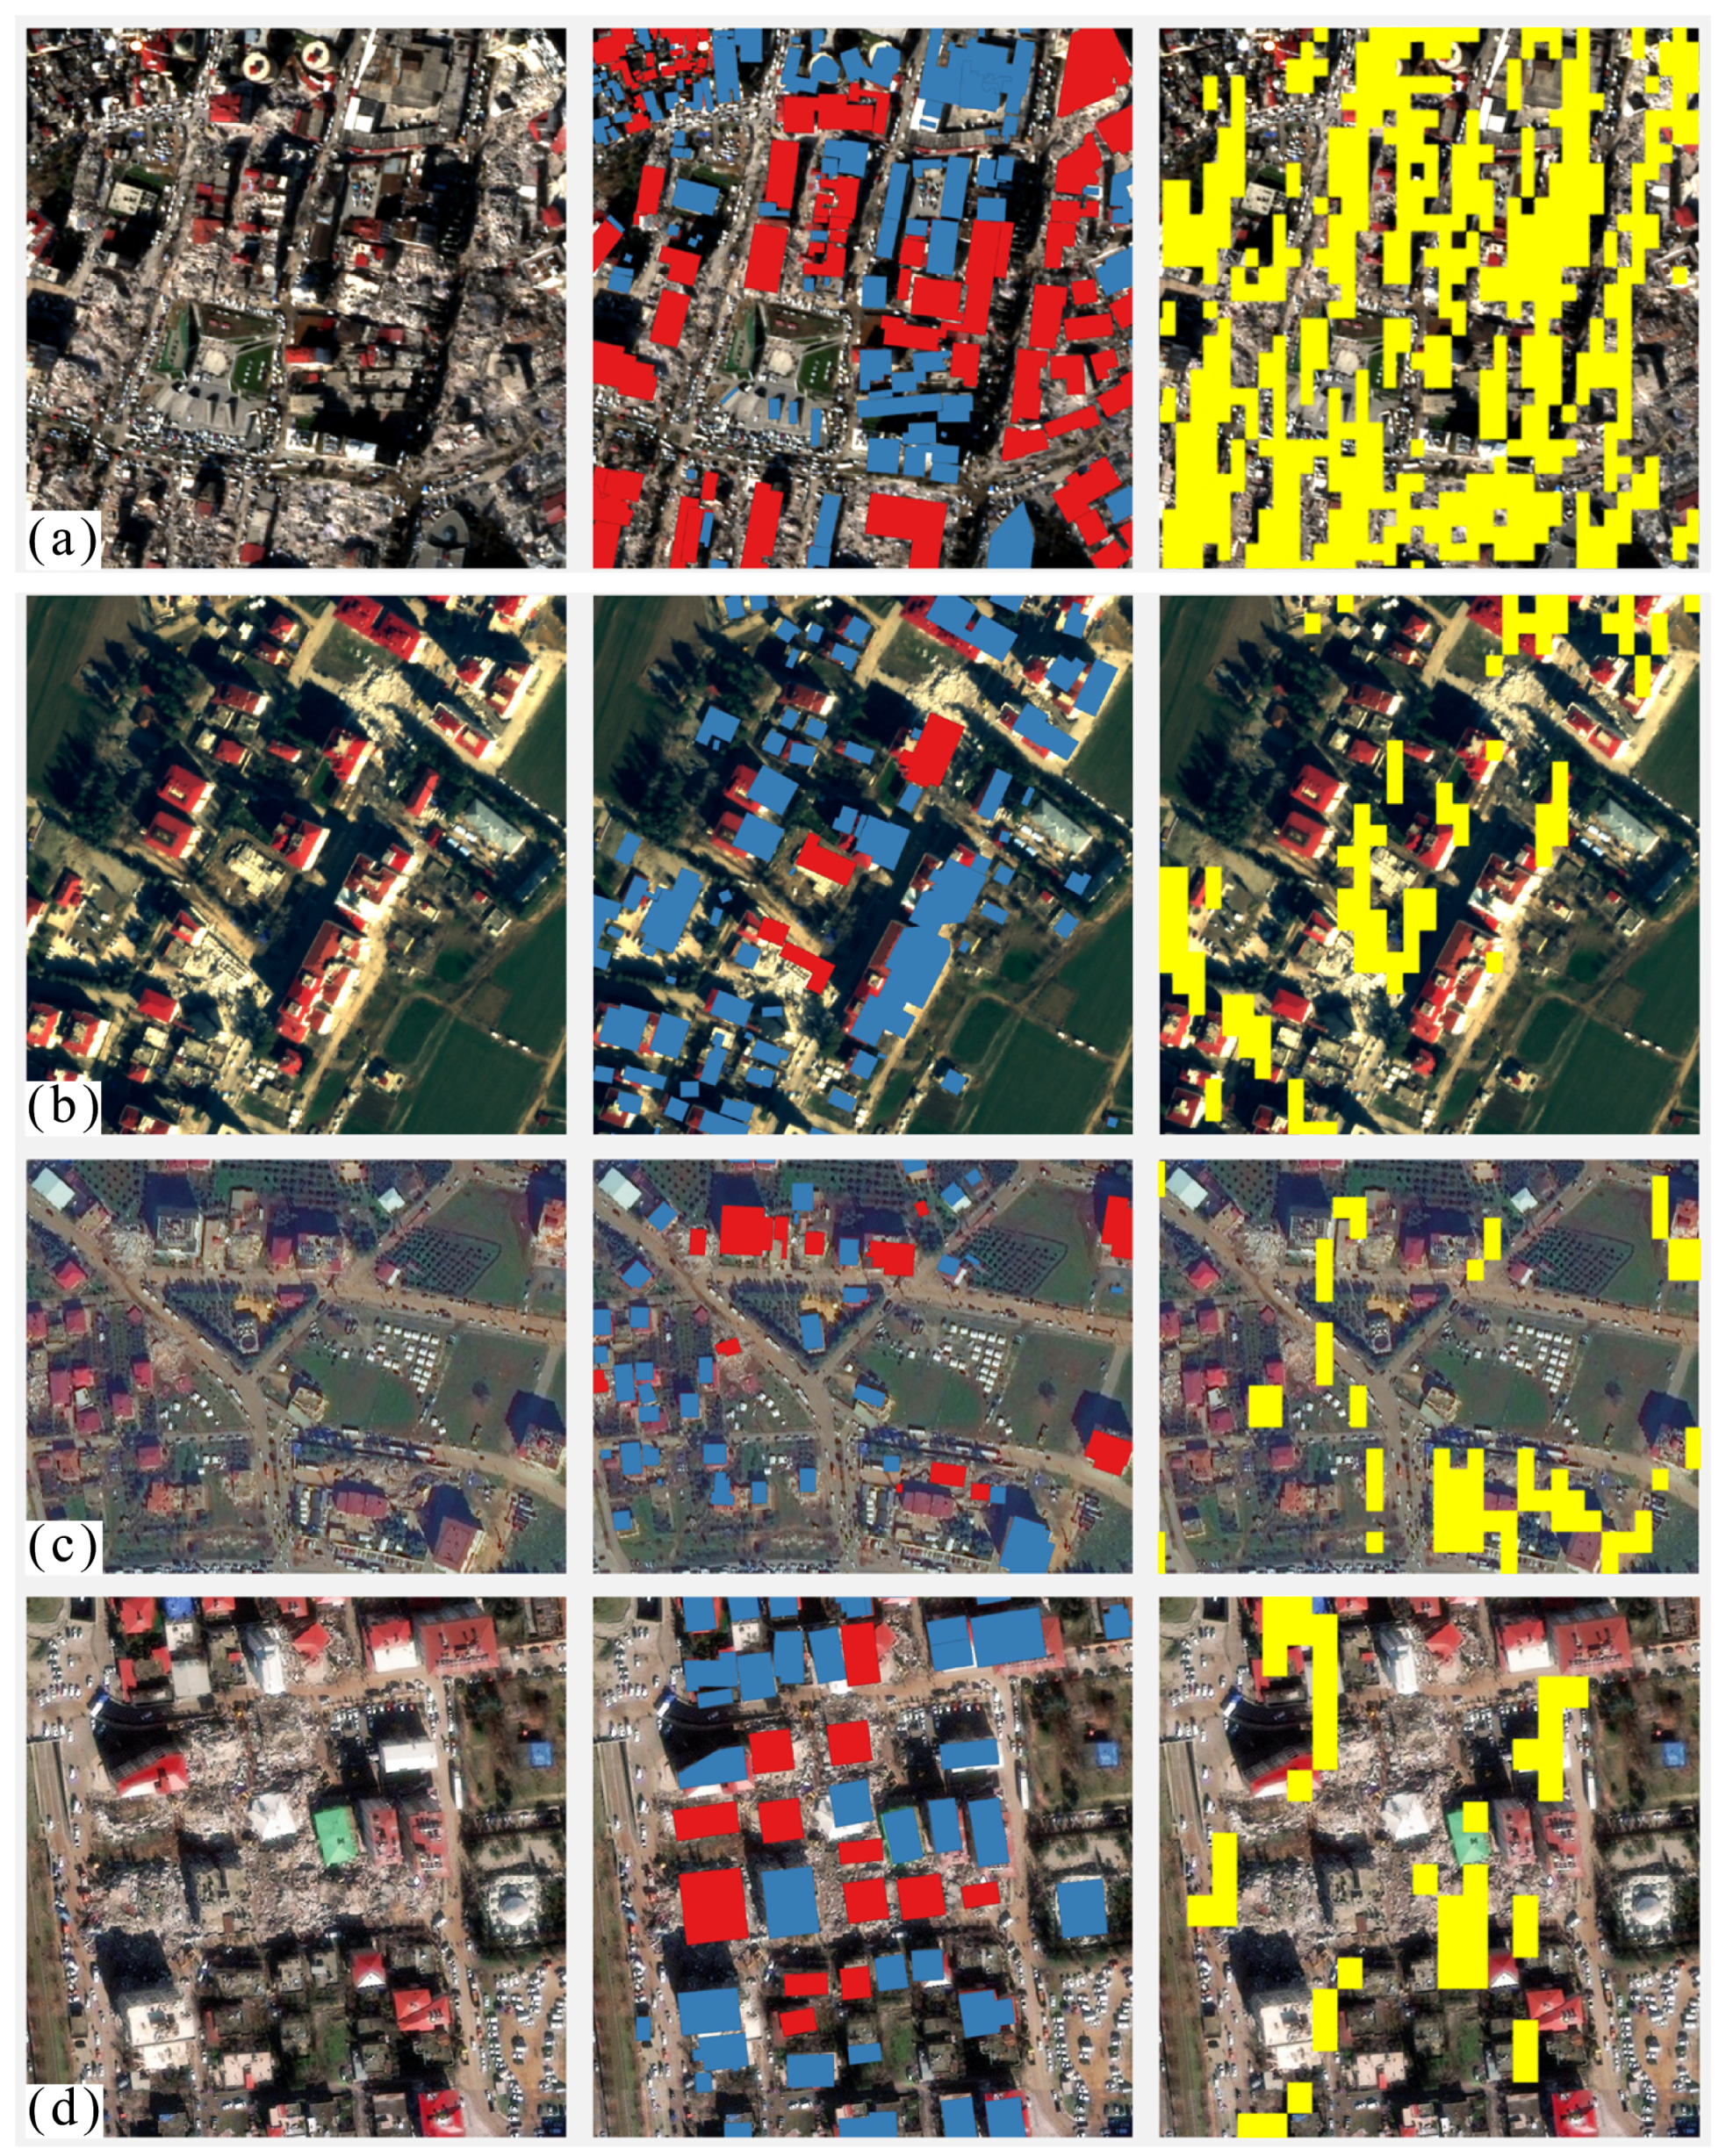
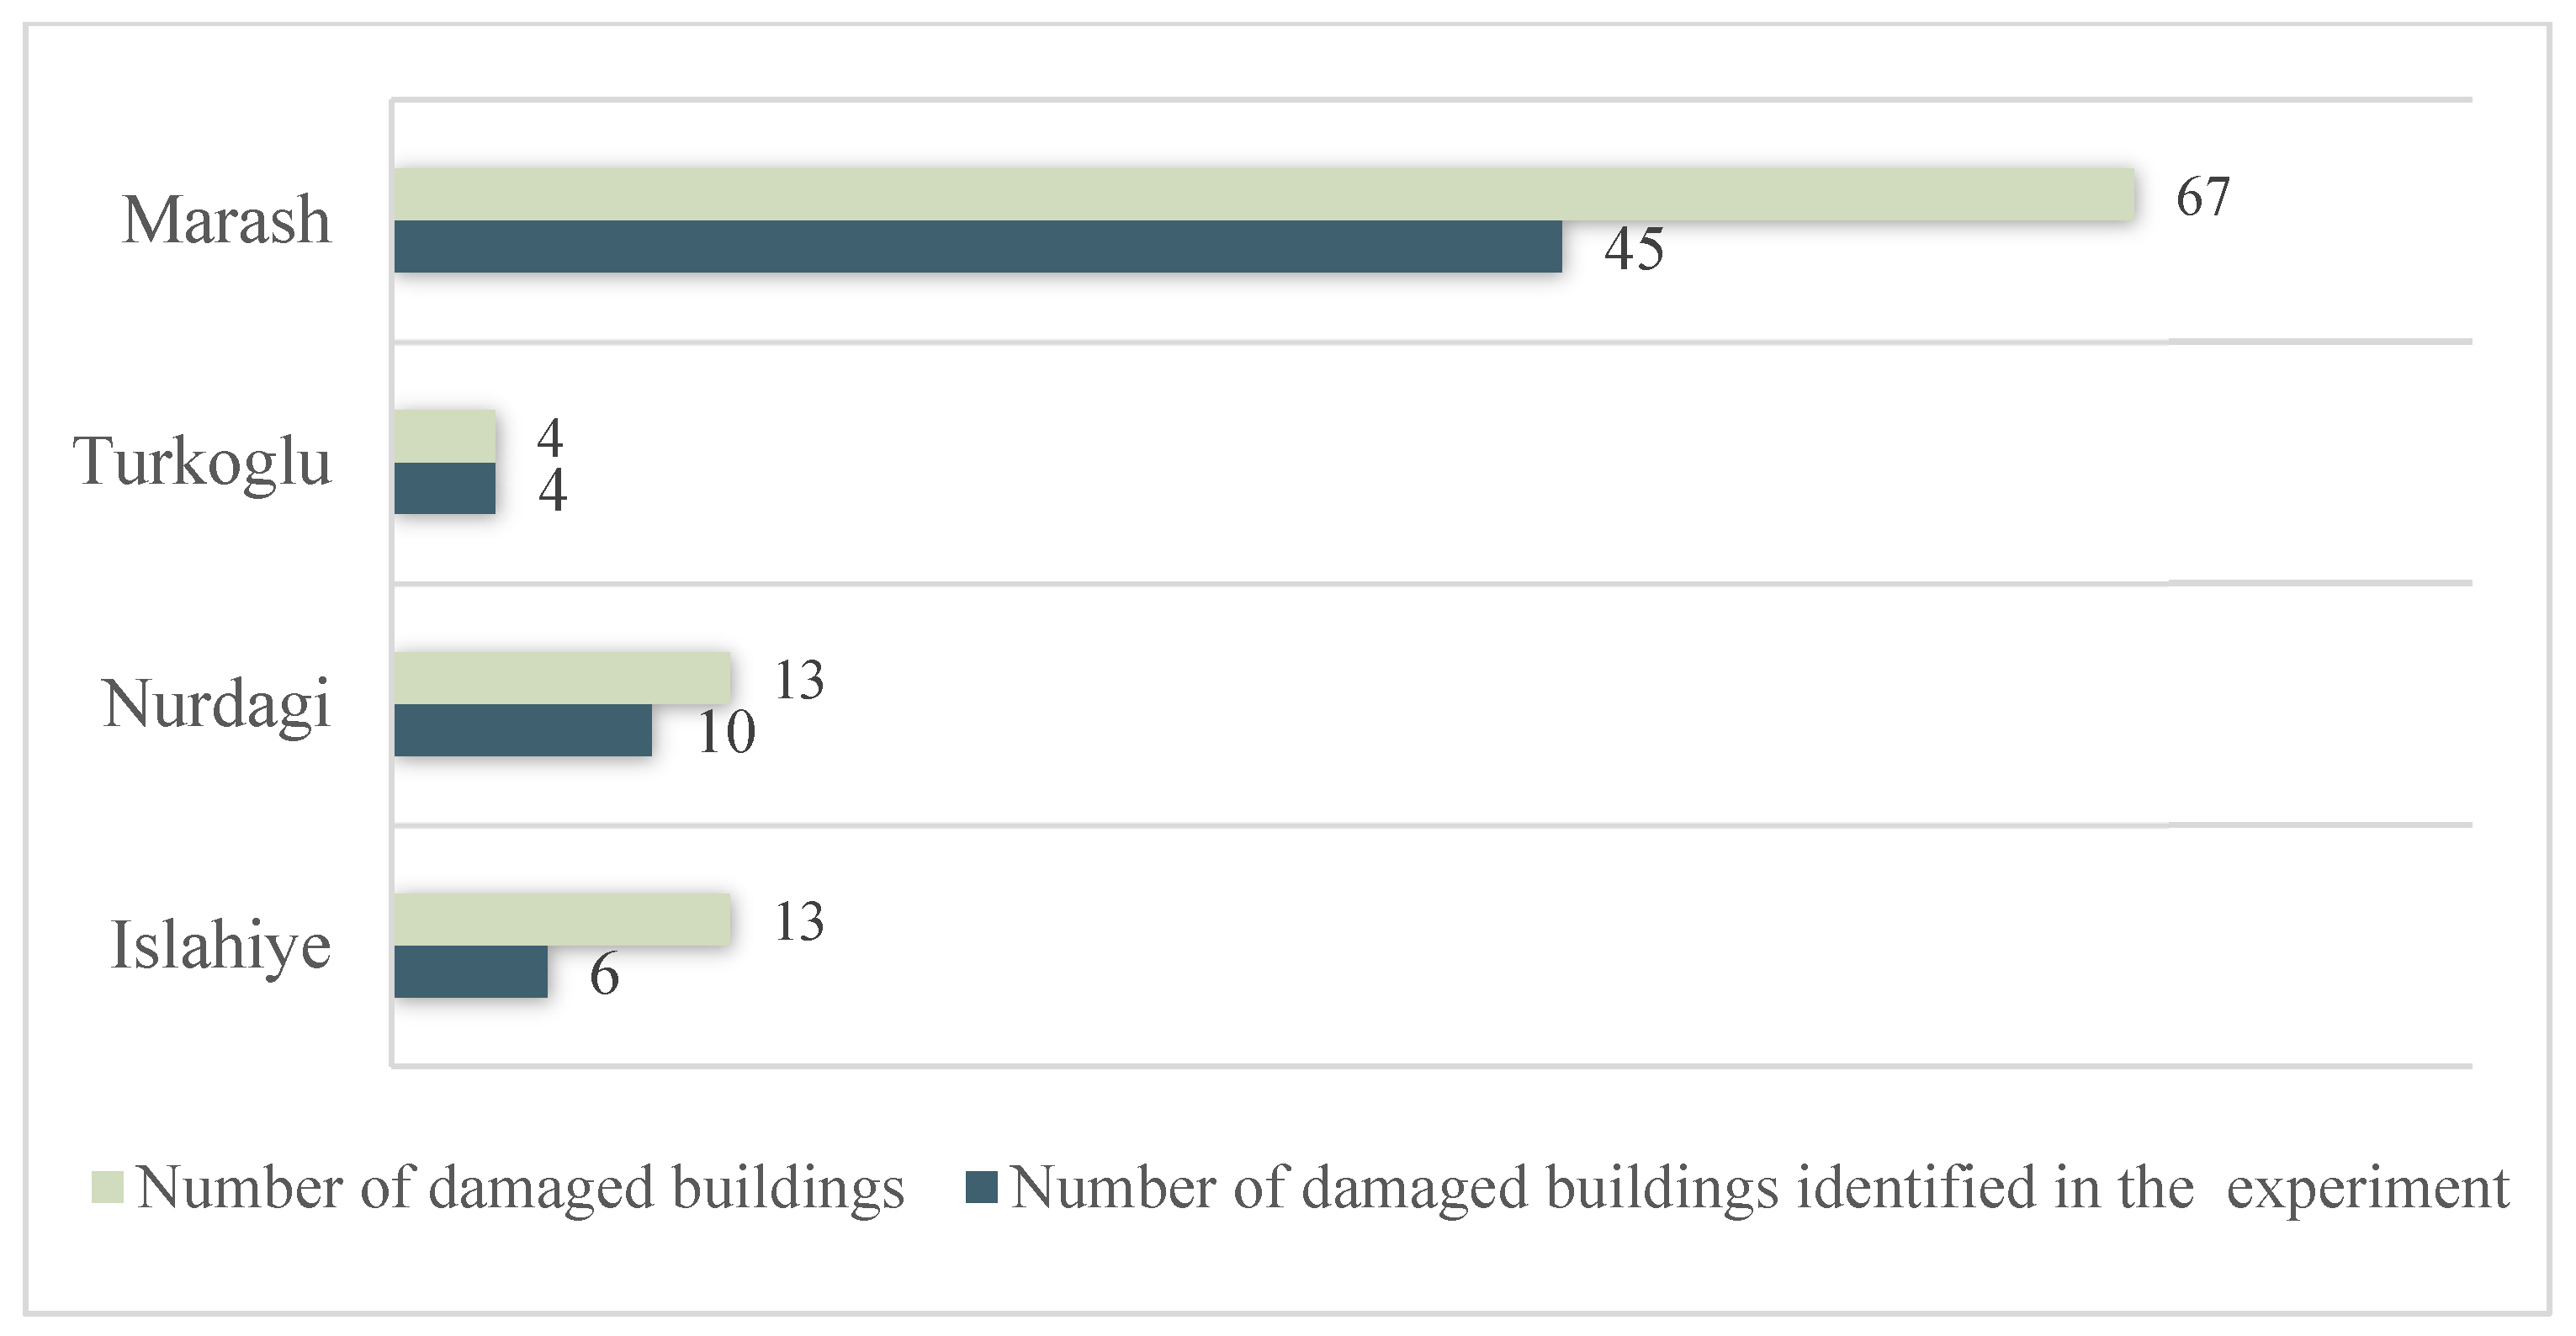
4.1.1. Comparing Our Results with High-Resolution Optical Images
4.1.2. Comparing Our Results with the Results Obtained by the Microsoft Team
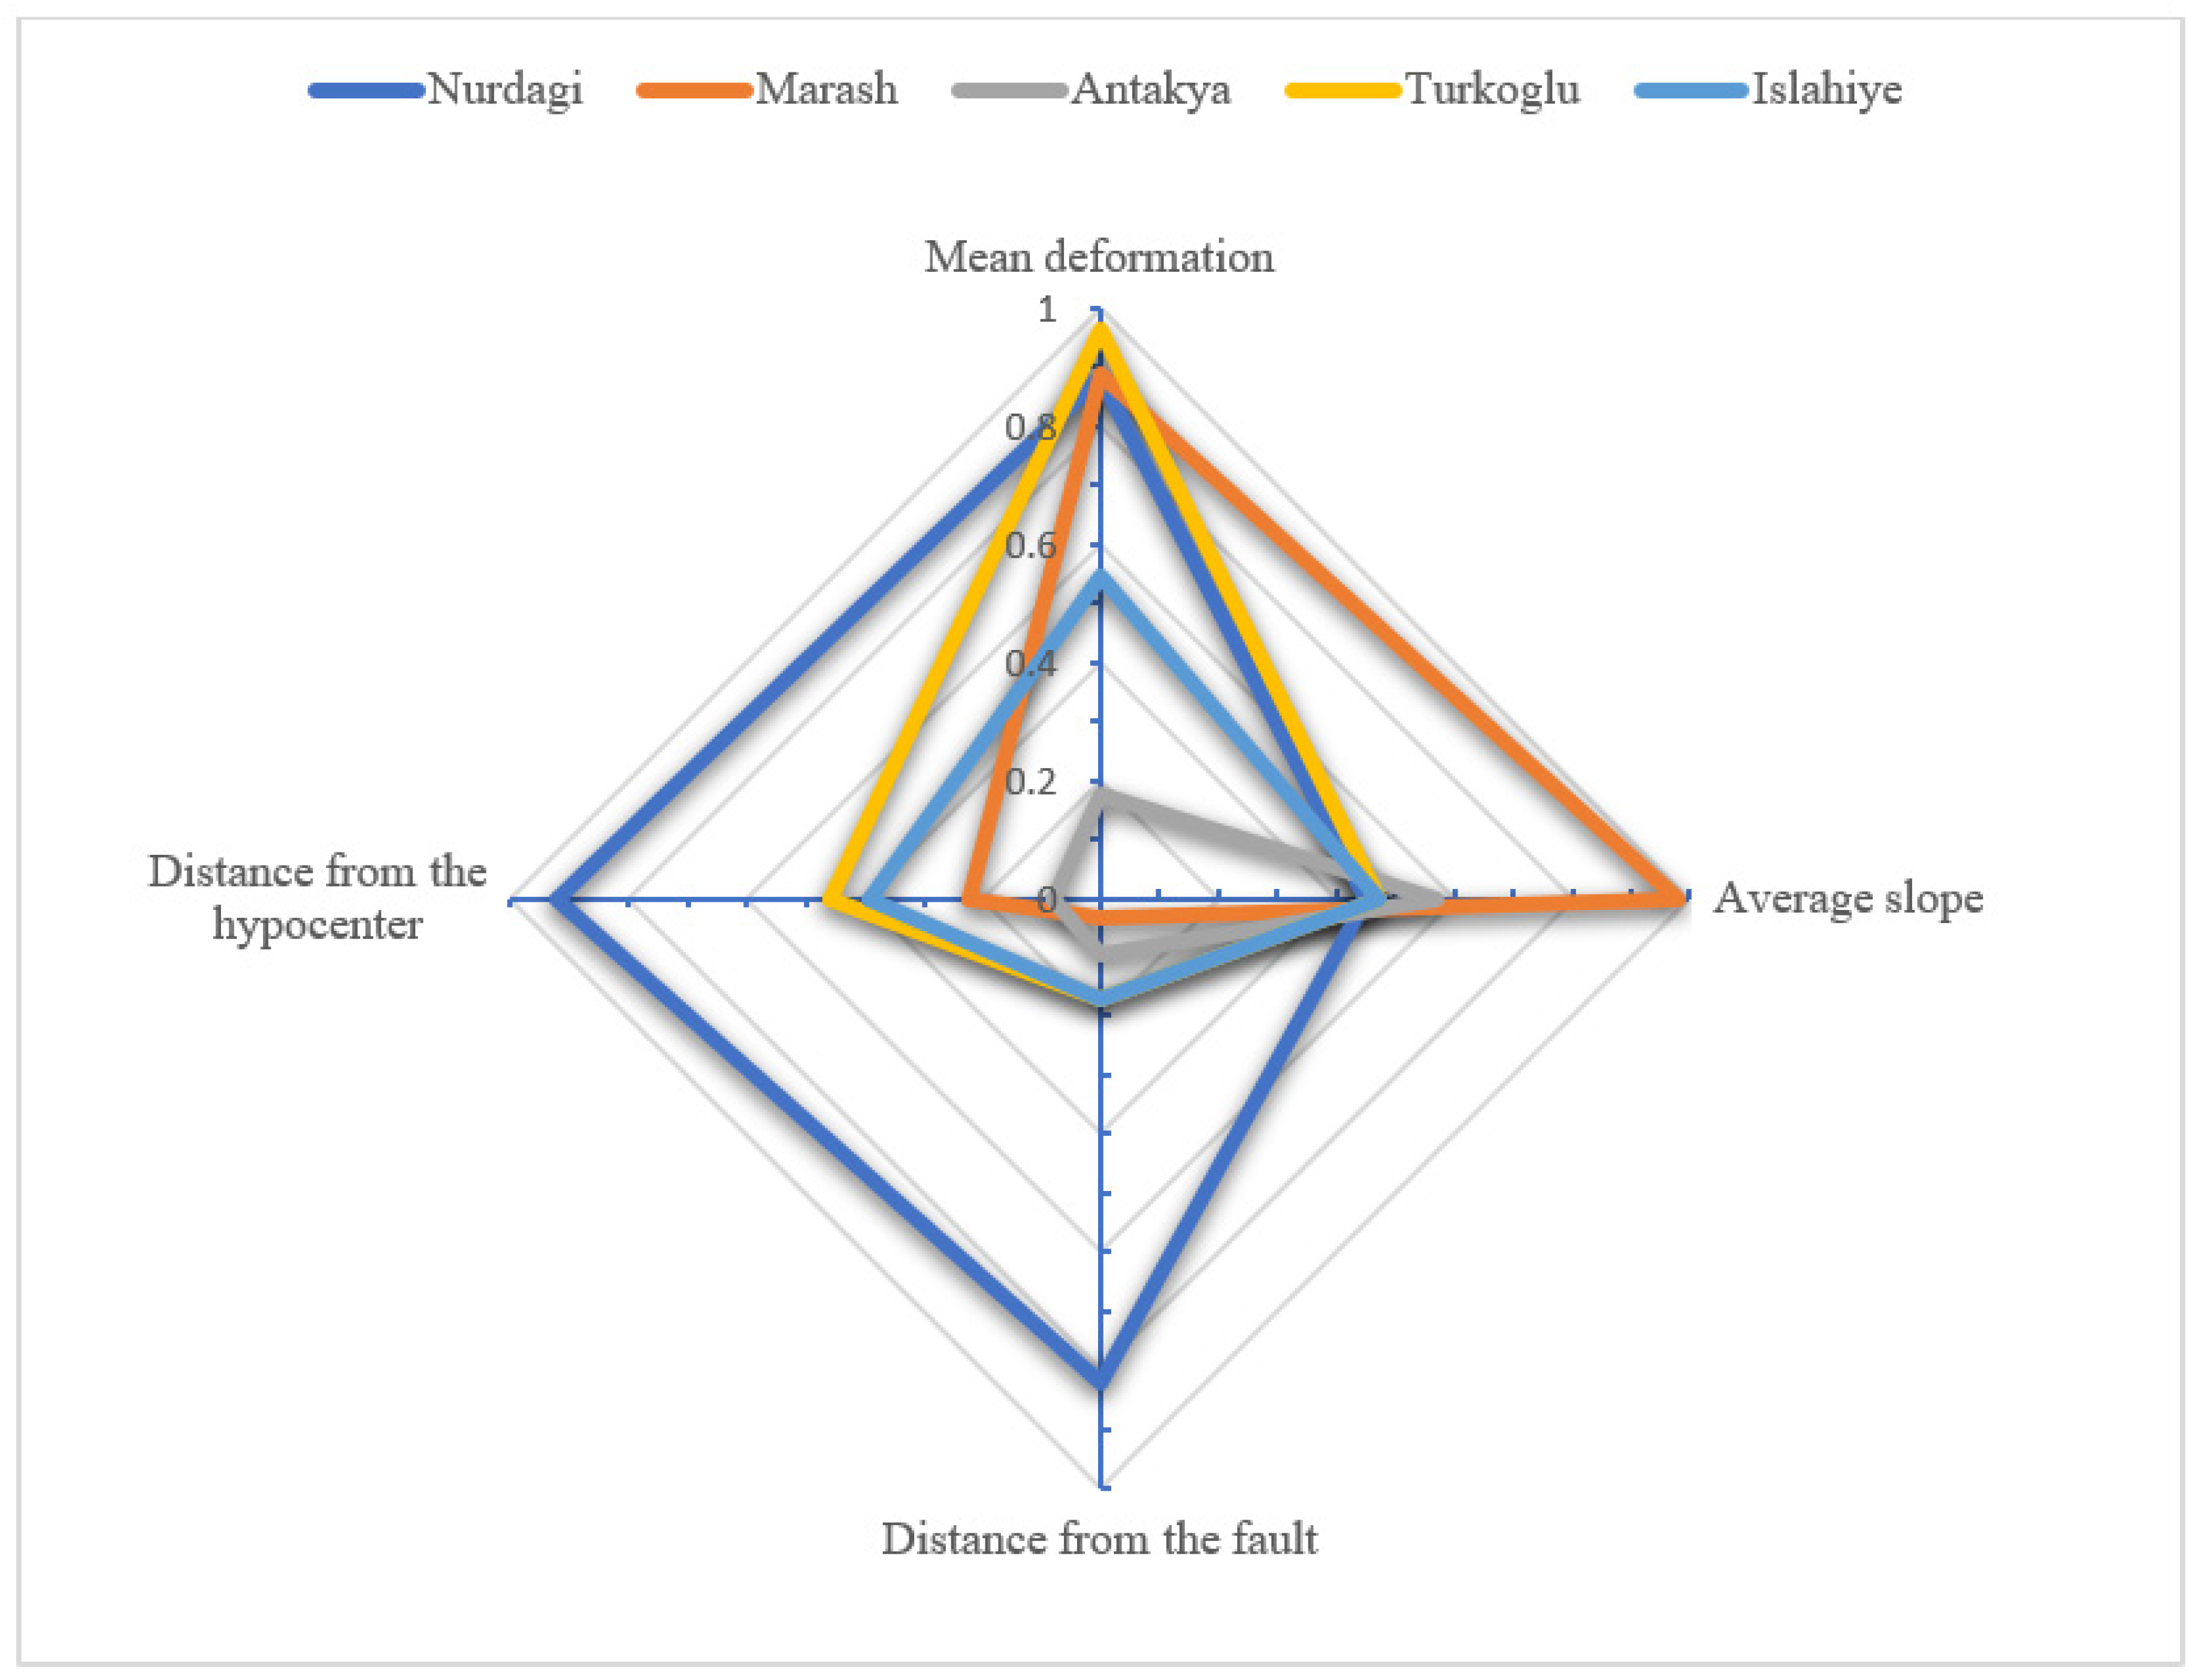
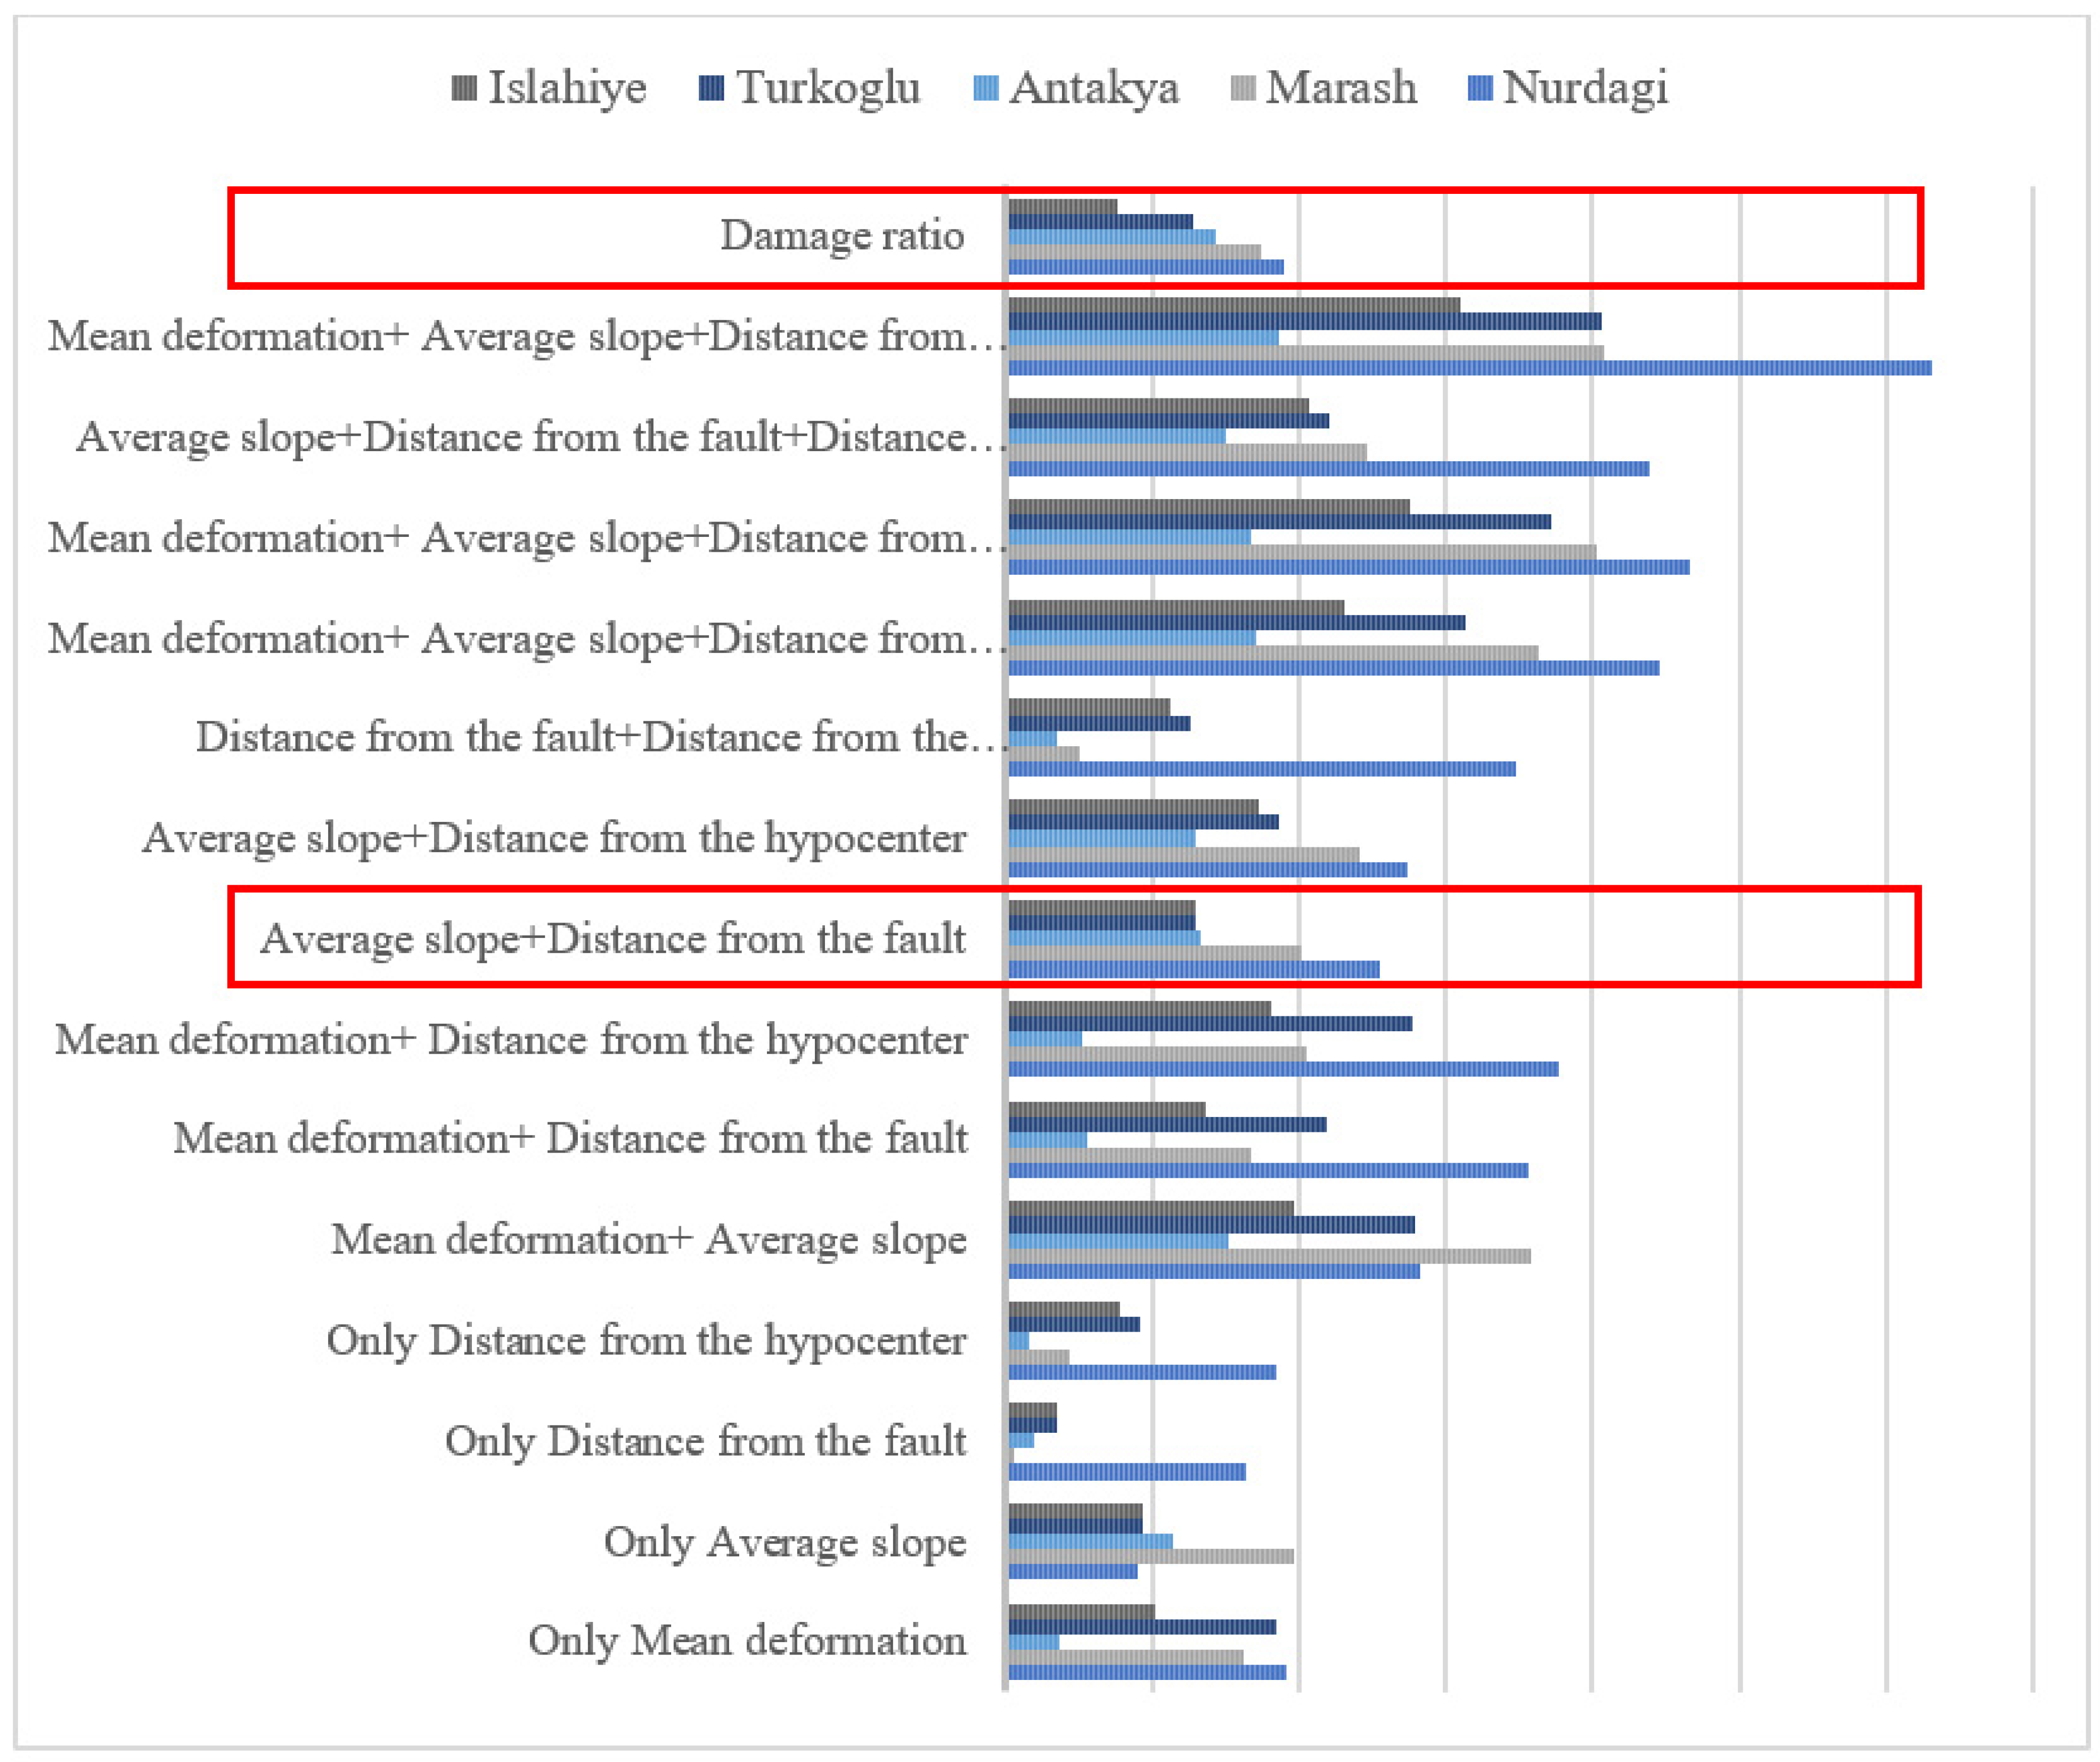
4.2. Correlation Analysis of Surface Deformation and Damaged Building Identification Results
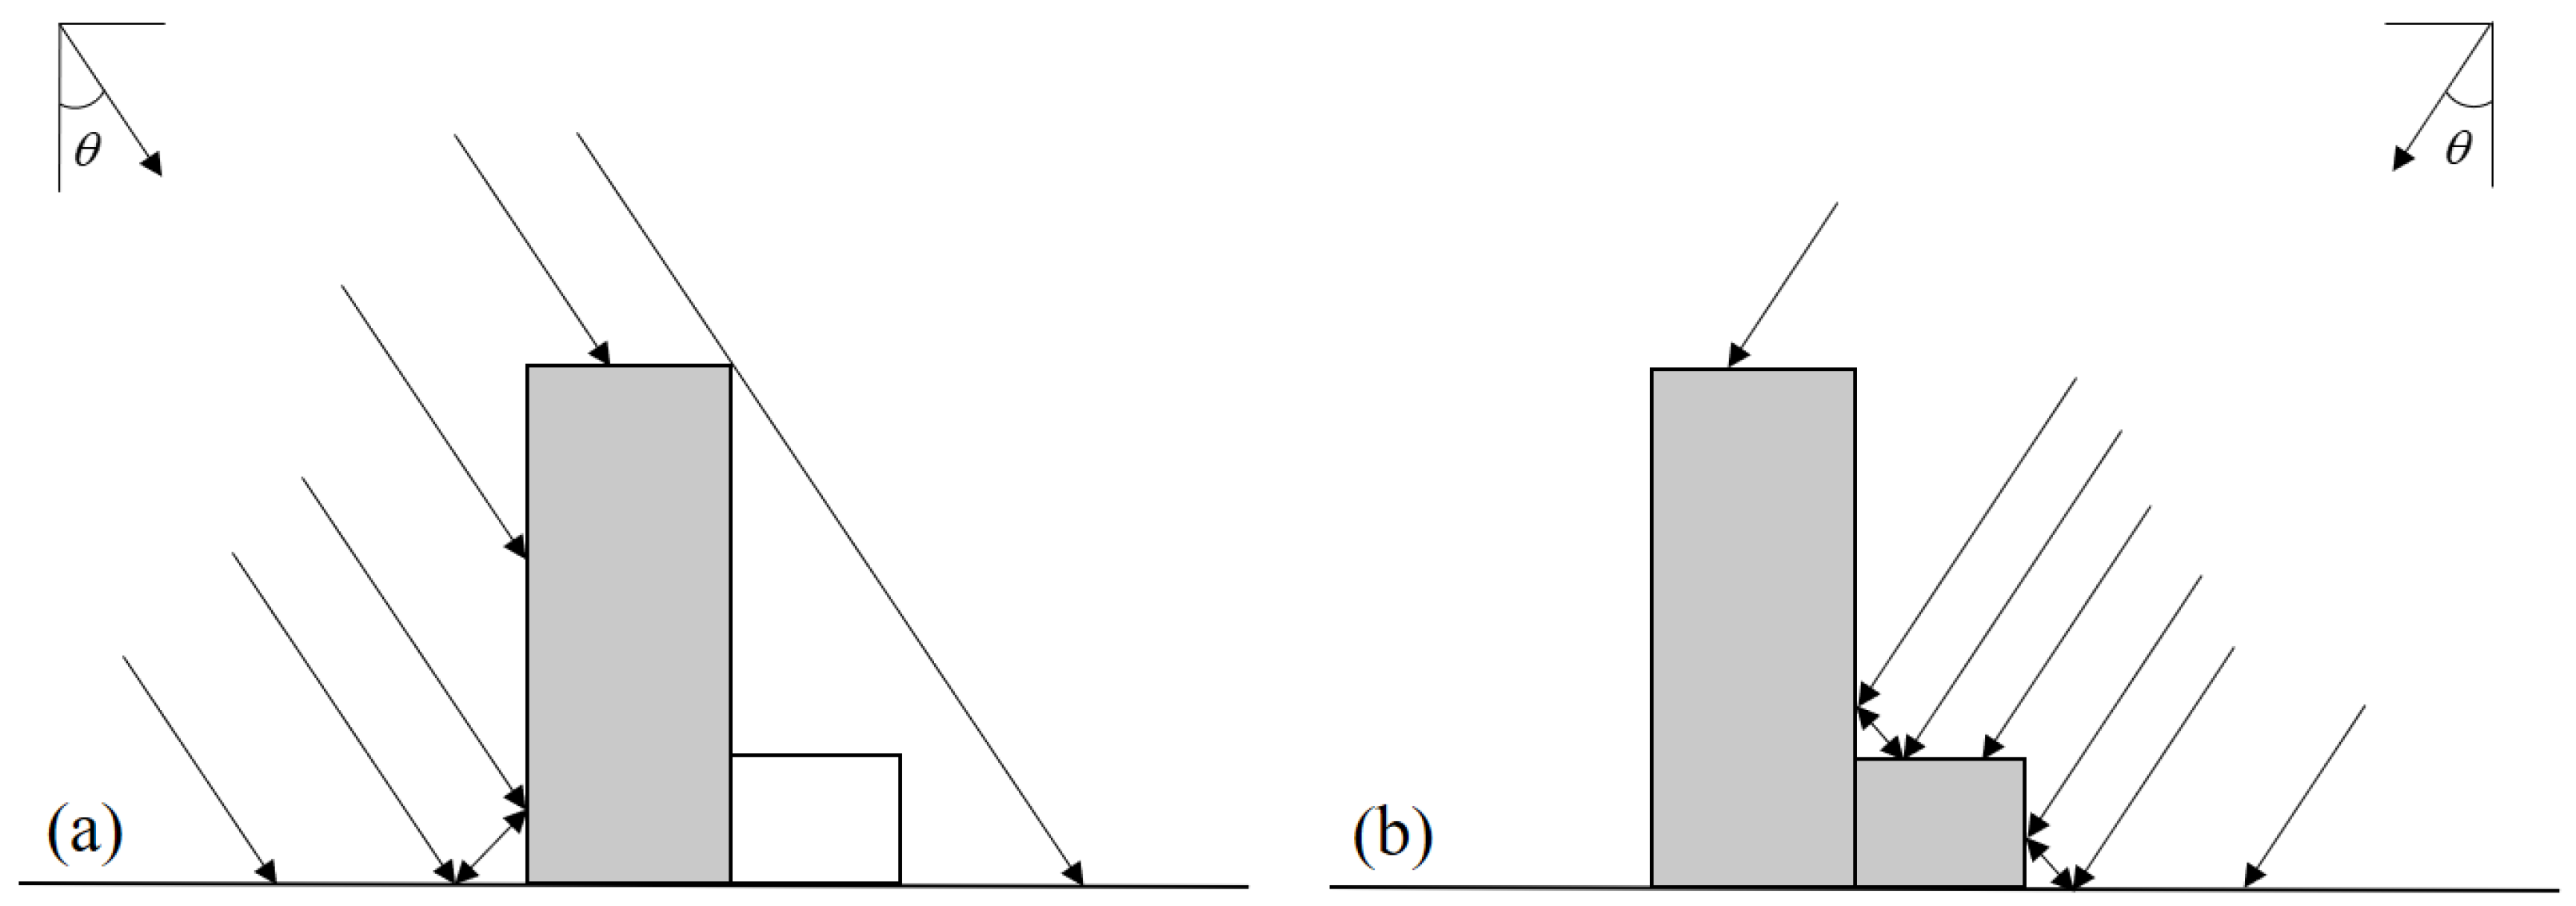
4.3. SAR Image Parameters and the Identification Results
5. Conclusions
Author Contributions
Funding
Data Availability Statement
Acknowledgments
Conflicts of Interest
Appendix A

References
- Kelam, A.A.; Karimzadeh, S.; Yousefibavil, K.; Akgün, H.; Askan, A.; Erberik, M.A.; Koçkar, M.K.; Pekcan, O.; Ciftci, H. An evaluation of seismic hazard and potential damage in Gaziantep, Turkey using site specific models for sources, velocity structure and building stock. Soil Dyn. Earthq. Eng. 2022, 154, 107129. [Google Scholar] [CrossRef]
- Guo, Y.; Li, H.; Liang, P.; Xiong, R.; Chaozhong, H.; Xu, Y. Preliminary report of coseismic surface rupture (part) of Turkey’s Mw7.8 earthquake by remote sensing interpretation. Earthq. Res. Adv. 2023, 100219, in press. [Google Scholar] [CrossRef]
- Microsoft Corp. Turkey Building Damage Assessment. Available online: https://www.microsoft.com/en-us/research/publication/turkey-earthquake-report/ (accessed on 23 February 2023).
- Huang Xin’s Team Used Remote Sensing Deep Learning Technology to Evaluate the Earthquake Disaster in Turkey. Available online: https://news.whu.edu.cn/info/1015/69325.htm (accessed on 31 March 2023).
- Aoki, H.; Matsuoka, M.; Yamazaki, F. Characteristics of satellite SAR images in the damaged areas due to the Hyogoken-Nanbu earthquake. AARS 1998, 7, 1–6. [Google Scholar]
- Matsuoka, M.; Yamazaki, F. Use of satellite SAR intensity imagery for detecting building areas damaged due to earthquakes. Earthq. Spectra 2004, 20, 975–994. [Google Scholar] [CrossRef]
- Li, Q.; Zhang, J.F.; Gong, L.X.; Xue, T. Extraction of earthquake-collapsed buildings based on correlation change detection of multi-texture features in SAR images. J. Remote Sens. 2018, 22, 128–138. [Google Scholar] [CrossRef]
- Shao, N.Y.; Zou, H.X.; Chen, C.; Yinghong, D.; Wei, X.; Fang, L. Change detection-oriented superpixel cosegmentation algorithm for SAR images. Syst. Eng. Electron. 2019, 41, 1496–1503. [Google Scholar]
- Liu, W.; Yang, J.; Zhao, J.; Yang, L. A Novel Method of Unsupervised Change Detection Using Multi-Temporal PolSAR Images. Remote Sens. 2017, 9, 1135. [Google Scholar] [CrossRef]
- Amitrano, D.; Belfiore, V.; Cecinati, F.; Di Martino, G.; Iodice, A.; Mathieu, P.-P.; Medagli, S.; Poreh, D.; Riccio, D.; Ruello, G. Urban Areas Enhancement in Multitemporal SAR RGB Images Using Adaptive Coherence Window and Texture Information. IEEE J. Sel. Top. Appl. Earth Obs. Remote Sens. 2016, 9, 3740–3752. [Google Scholar] [CrossRef]
- Feng, H.; Wu, J.; Zhang, L.; Liao, M. Unsupervised change detection of man-made objects using coherent and incoherent features of multi-temporal SAR images. J. Syst. Eng. Electron. 2022, 33, 896–906. [Google Scholar] [CrossRef]
- Monti-Guarnieri, A.V.; Brovelli, M.A.; Manzoni, M.; D’Alessandro, M.M.; Molinari, M.E.; Oxoli, D. Coherent Change Detection for Multipass SAR. IEEE Trans. Geosci. Remote Sens. 2018, 56, 6811–6822. [Google Scholar] [CrossRef]
- Liu, Y.H.; Qu, C.Y.; Shan, X.J.; Xiaogang, S. Application of SAR data to damage identification of the Wenchuan earthquake. Acta Seismol. Sin. 2010, 32, 214–223. [Google Scholar]
- Wang, Z.H.; Li, S.Q.; Wang, J.L. Multi-Scale Analysis for Coherent Change Detection: A Method for Extracting Typical Changed Area. Remote Sens. 2022, 14, 4986. [Google Scholar] [CrossRef]
- Lee, K.W.; Kim, H.-C.; Kim, B.; Lee, W.-K. Design of SAR Image Feature Detector for Smallscaled Coherent Change Detection. In Proceedings of the 2016 IEEE International Geoscience and Remote Sensing Symposium (IGARSS), Beijing, China, 10–15 July 2016; pp. 2344–2347. [Google Scholar]
- Li, H.; Zhu, F.; Zheng, X.; Liu, M.; Chen, G. MSCDUNet: A Deep Learning Framework for Built-Up Area Change Detection Integrating Multispectral, SAR, and VHR Data. IEEE J. Sel. Top. Appl. Earth Obs. Remote Sens. 2022, 15, 5163–5176. [Google Scholar] [CrossRef]
- Khelifi, L.; Mignotte, M. Deep Learning for Change Detection in Remote Sensing Images: Comprehensive Review and Meta-Analysis. IEEE Access 2020, 8, 126385–126400. [Google Scholar] [CrossRef]
- Gong, M.; Zhao, J.; Liu, J.; Miao, Q.; Jiao, L. Change detection in synthetic aperture radar images based on deep neural networks. IEEE Trans. Neural Netw. Learn. Syst. 2016, 27, 125–138. [Google Scholar] [CrossRef] [PubMed]
- Zhang, L.P.; Wu, C. Advance and future development of change detection for multi-temporal remote sensing imagery. Acta Geod. Cartogr. Sin. 2017, 46, 1447–1459. [Google Scholar]
- Sui, H.G.; Feng, W.Q.; Li, W.Z.; Wangdong, M. Review of change detection methods for multi-temporal remote sensing imagery. Geomat. Inf. Sci. Wuhan Univ. 2018, 43, 1885–1898. [Google Scholar]
- Zhang, B.; Zhang, R.; Liu, G.; Liu, Q.; Cai, J.; Yu, B.; Li, Z. Monitoring of interannual variabilities and outburst regularities analysis of glacial lakes at the end of Gongba Glacier utilizing SAR images. Geomat. Inf. Sci. Wuhan Univ. 2019, 44, 1054–1064. [Google Scholar]
- Wang, F.; Wu, Y.; Zhang, Q.; Zhang, P.; Li, M.; Lu, Y. Unsupervised Change Detection on SAR Images Using Triplet Markov Field Model. IEEE Geosci. Remote Sens. Lett. 2013, 10, 697–701. [Google Scholar] [CrossRef]
- Zhang, K.; Lv, X.; Chai, H.; Yao, J. Unsupervised SAR Image Change Detection for Few Changed Area Based on Histogram Fitting Error Minimization. IEEE Trans. Geosci. Remote Sens. 2022, 60, 1–19. [Google Scholar] [CrossRef]
- Marin, C.; Bovolo, F.; Bruzzone, L. Building Change Detection in Multitemporal Very High Resolution SAR Images. IEEE Trans. Geosci. Remote Sens. 2015, 53, 2664–2682. [Google Scholar] [CrossRef]
- Fialko, Y.; Simons, M.; Agnew, D. The complete (3-D) surface displacement field in the epicentral area of the 1999 MW7.1 Hector Mine Earthquake, California, from space geodetic observations. Geophys. Res. Lett. 2001, 28, 3063–3066. [Google Scholar] [CrossRef]
- Shi, X.; Wang, Y.; Liu-Zeng, J.; Weldon, R.; Wei, S.; Wang, T.; Sieh, K. How complex is the 2016 Mw7.8 Kaikoura earthquake, South Island, New Zealand. Sci. Bull. 2017, 62, 309–311. [Google Scholar] [CrossRef] [PubMed]
- Wang, T.; Wei, S.; Shi, X.; Qiu, Q.; Li, L.; Peng, D.; Weldon, R.J.; Barbot, S. The 2016 Kaikōura earthquake: Simultaneous rupture of the subduction interface and overlying faults. Earth Planet Sci. Lett. 2018, 482, 44–51. [Google Scholar] [CrossRef]
- He, L.J.; Feng, G.C.; Wu, X.X.; Lu, H.; Xu, W.B.; Wang, Y.D.; Liu, J.H.; Hu, J.; Li, Z. Coseismic and Early Postseismic Slip Models of the 2021 Mw7.4 Maduo Earthquake (Western China) Estimated by SpaceBased Geodetic Data. Geophys. Res. Lett. 2021, 48, e2021GL095860. [Google Scholar] [CrossRef]
- He, L.; Feng, G.; Hu, J.; Xu, W.; Liu, J.; Li, Z.; Feng, Z.; Wang, Y.; Lu, H. Surface Displacement and Source Model Separation of the Two Strongest Earthquakes during the 2019 Ridgecrest Sequence: Insights from InSAR, GPS, and Optical Data. J. Geophys. Res. Solid Earth 2022, 127, e2021JB022779. [Google Scholar] [CrossRef]
- Ding, C.; Feng, G.; Li, Z.; Shan, X.; Du, Y.; Wang, H. Spatio-Temporal error sources analysis and accuracy improvement in Landsat 8 image ground displacement measurements. Remote Sens. 2016, 8, 937. [Google Scholar] [CrossRef]
- Satellite Imagery. Available online: https://www.airbus.com/en/products-services/space/earth-observation/satellite-imagery (accessed on 26 March 2023).
- Shibata, A. Estimation of earthquake damage to urban systems. Struct. Control Health Monit. 2006, 13, 454–471. [Google Scholar] [CrossRef]
- Cheng, K. Rapid Assessment on Earthquake Damage Prediction of Monomer Buildings. Master’s Thesis, Dalian University of Technology, Dalian, China, 2012. [Google Scholar]
- Özmen, T.; Yamanaka, H.; Alkan, M.A.; Çeken, U.; Öztürk, T.; Sezen, A. Microtremor Array Measurements for Shallow S-Wave Profiles at Strong-Motion Stations in Hatay and Kahramanmaras Provinces, Southern Turkey. Bull. Seismol. Soc. Am. 2017, 107, 1–13. [Google Scholar] [CrossRef]
- McClusky, S.; Balassanian, S.; Barka, A.; Demir, C.; Ergintav, S.; Georgiev, I.; Gurkan, O.; Hamburger, M.; Hurst, K.; Kahle, H.; et al. Global positioning system constraints on plate kinematics and dynamics in the eastern mediterranean and caucasus. Geophys. Res. 2000, 105, 5695–5719. [Google Scholar] [CrossRef]
- Dogru, F. The importance of atmospheric corrections on InSAR surveys over turkey case study of tectonic deformation of bodrum-kos earthquake. Pure Appl. Geophys. 2020, 117, 5761–5780. [Google Scholar] [CrossRef]
- Lazos, I.; Sboras, S.; Pikridas, C.; Pavlides, S.; Chatzipetros, A. Geodetic analysis of the tectonic crustal deformation pattern in the North Aegean Sea, Greece. Mediterr. Geosci. Rev. 2021, 3, 79–94. [Google Scholar] [CrossRef]
- Imamoglu, M.; Kahraman, F.; Cakir, Z.; Sanli, F.B. Ground deformation analysis of Bolvadin (w. Turkey) by means of multi-temporal InSAR techniques and Sentinel-1 data. Remote Sens. 2019, 11, 1069. [Google Scholar] [CrossRef]
- Doring, B.J.; Schwerdt, M. The Radiometric Measurement Quantity for SAR Images. IEEE Trans. Geosci. Remote Sens. 2013, 51, 5307–5314. [Google Scholar] [CrossRef]
- Xue, T.F. Earthquake Damaged Buildings Extraction from SAR Images Using Change Detection Technology Based on Multiple Features. Ph.D. Thesis, Institute of Engineering Mechanics, China Earthquake Administration, Beijing, China, 2017. [Google Scholar]
- Gong, M.G.; Su, L.Z.; Li, H.; Liu, J. A survey on change detection in synthetic aperture radar imagery. J. Comput. Res. Dev. 2016, 53, 123–137. [Google Scholar]
- Wessel, P.; Luis, J.F.; Uieda, L.; Scharroo, R.; Wobbe, F.; Smith, W.H.F.; Tian, D. The Generic Mapping Tools Version 6. Geochem. Geophys. Geosyst. 2019, 20, 5556–5564. [Google Scholar] [CrossRef]


| Sensor | Band (Wavelength/cm) | Spatial Perpendicular Baseline (m) | Frames Width (km) | Track Direction | Frames | Incidence Angle (°) | Azimuth Angle (°) | Image Resolution (m) | Temporal |
|---|---|---|---|---|---|---|---|---|---|
| Sentinel-1 | C (5.63) | 106.49 | 250 | Descending | DT21 | 39.56 | 193.25 | 5 × 20 (Rg × Az) | 29 January 2023 10 February 2023 |
| C (5.63) | 106.49 | 250 | Ascending | AT116 | 39.53 | 90.00 | 5 × 20 (Rg × Az) | 4 February 2023 28 February 2023 |
| POT | Search Window Size (Rg × Az/Pixel) | Moving Step (Rg × Az/Pixel) | Oversampling Factor | |
| 300 × 60 | 5 × 1 | 2 | ||
| D-InSAR | Multi-look number of interferogram pair (Rg:Az) | Spatial perpendicular baseline (m) | Filtering window size (Rg × Az/pixel) | Filtering factor |
| 5:1 | 106.42 | 128 × 128 | 0.2 |
| City | Urban Area (km2) | Damaged Buildings Area (km2) | Damage Ratio (%) |
|---|---|---|---|
| Nurdagi | 2.58 | 0.49 | 18.93 |
| Marash | 37.92 | 6.59 | 17.37 |
| Antakya | 14.96 | 2.14 | 14.28 |
| Turkoglu | 3.07 | 0.39 | 12.79 |
| Islahiye | 3.32 | 0.25 | 7.59 |
| City | Mean Deformation (m) Obtained by POT | Mean Deformation (m) Obtained by D-InSAR | Mean Deformation (m) |
|---|---|---|---|
| Turkoglu | 0.46 | 0.54 | 0.50 |
| Marash | 0.40 | 0.52 | 0.46 |
| Nurdagi | 0.48 | 0.44 | 0.46 |
| Islahiye | 0.26 | 0.31 | 0.28 |
| Antakya | 0.09 | 0.09 | 0.09 |
| City | Mean Deformation (m) | Average Slope (°) | Distance from the Fault (km) | Distance from the Hypocenter (km) | Damage Ratio (%) |
|---|---|---|---|---|---|
| Nurdagi | 0.46 | 2.3 | 0.6 | 10.86 | 18.93 |
| Marash | 0.46 | 4.9 | 15.2 | 44.85 | 17.37 |
| Antakya | 0.09 | 2.9 | 5.2 | 124.92 | 14.28 |
| Turkoglu | 0.50 | 2.4 | 2.9 | 21.82 | 12.79 |
| Islahiye | 0.28 | 3.4 | 1.4 | 25.41 | 7.59 |
| City | Urban Area (km2) | Damaged Buildings Area (km2) (Descending) | Damaged Buildings Area (km2) (Ascending) | Damage Ratio (%) |
|---|---|---|---|---|
| Marash | 37.92 | 6.59 | 5.80 | 23.39 |
| Nurdagi | 2.58 | 0.49 | / | 18.93 |
| Turkoglu | 3.07 | 0.39 | 0.25 | 14.33 |
| Antakya | 14.96 | 2.14 | / | 14.28 |
| Islahiye | 3.32 | 0.25 | / | 7.59 |
Disclaimer/Publisher’s Note: The statements, opinions and data contained in all publications are solely those of the individual author(s) and contributor(s) and not of MDPI and/or the editor(s). MDPI and/or the editor(s) disclaim responsibility for any injury to people or property resulting from any ideas, methods, instructions or products referred to in the content. |
© 2023 by the authors. Licensee MDPI, Basel, Switzerland. This article is an open access article distributed under the terms and conditions of the Creative Commons Attribution (CC BY) license (https://creativecommons.org/licenses/by/4.0/).
Share and Cite
Wang, X.; Feng, G.; He, L.; An, Q.; Xiong, Z.; Lu, H.; Wang, W.; Li, N.; Zhao, Y.; Wang, Y.; et al. Evaluating Urban Building Damage of 2023 Kahramanmaras, Turkey Earthquake Sequence Using SAR Change Detection. Sensors 2023, 23, 6342. https://doi.org/10.3390/s23146342
Wang X, Feng G, He L, An Q, Xiong Z, Lu H, Wang W, Li N, Zhao Y, Wang Y, et al. Evaluating Urban Building Damage of 2023 Kahramanmaras, Turkey Earthquake Sequence Using SAR Change Detection. Sensors. 2023; 23(14):6342. https://doi.org/10.3390/s23146342
Chicago/Turabian StyleWang, Xiuhua, Guangcai Feng, Lijia He, Qi An, Zhiqiang Xiong, Hao Lu, Wenxin Wang, Ning Li, Yinggang Zhao, Yuedong Wang, and et al. 2023. "Evaluating Urban Building Damage of 2023 Kahramanmaras, Turkey Earthquake Sequence Using SAR Change Detection" Sensors 23, no. 14: 6342. https://doi.org/10.3390/s23146342
APA StyleWang, X., Feng, G., He, L., An, Q., Xiong, Z., Lu, H., Wang, W., Li, N., Zhao, Y., Wang, Y., & Wang, Y. (2023). Evaluating Urban Building Damage of 2023 Kahramanmaras, Turkey Earthquake Sequence Using SAR Change Detection. Sensors, 23(14), 6342. https://doi.org/10.3390/s23146342