

An Advanced Energy-Efficient Environmental Monitoring in Precision Agriculture Using LoRa-Based Wireless Sensor Networks


Abstract
1. Introduction
2. Literature Review
3. Methodology
3.1. Energy Consumption Model of Lora Sensor Node
- (a)
- Transmit mode of operation of the transceiver
- (b)
- Listen mode of operation of the transceiver
- (c)
- Receive mode of operation of the transceiver
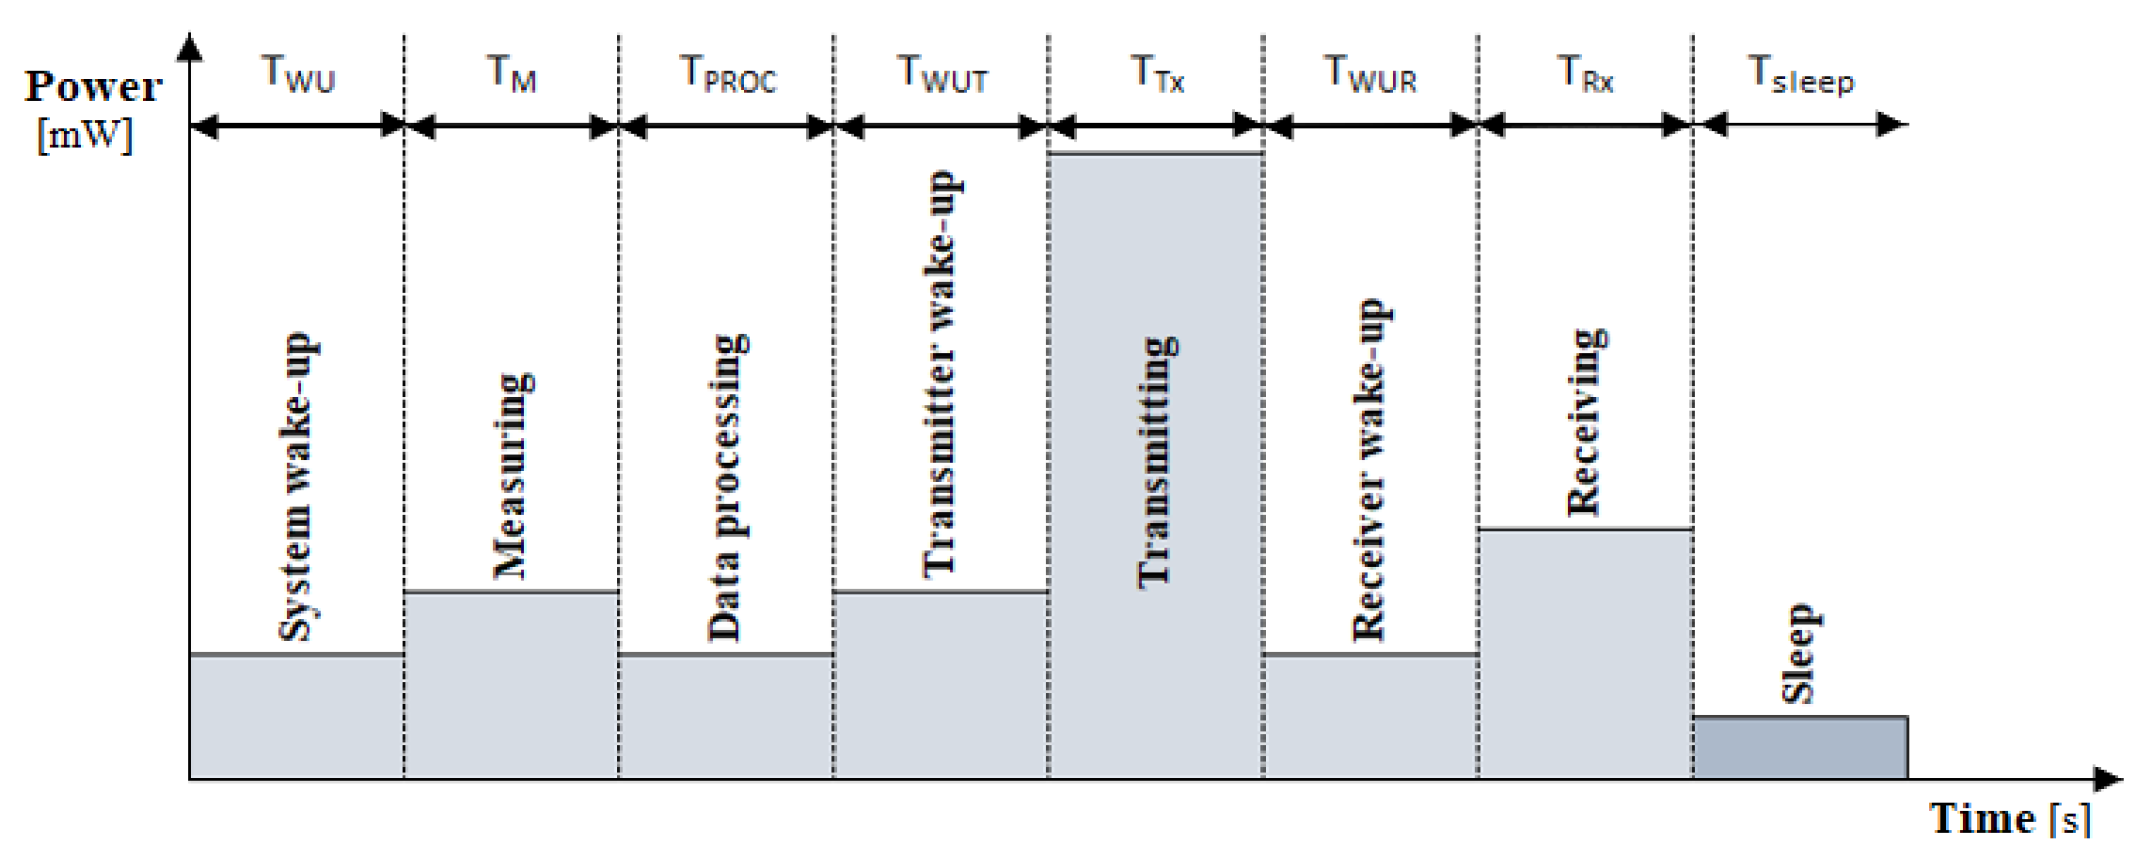
3.2. Energy Profile of LoRa Sensor Nodes
3.3. Selection of Adequate Parameters for LoRa-Based Communication
3.4. Choosing the Adequate Volume of Traffic in the LoRa Network
3.5. Time on Air Constraints of Communication Based on LoRa
3.6. Battery Lifespan
4. Results and Discussion
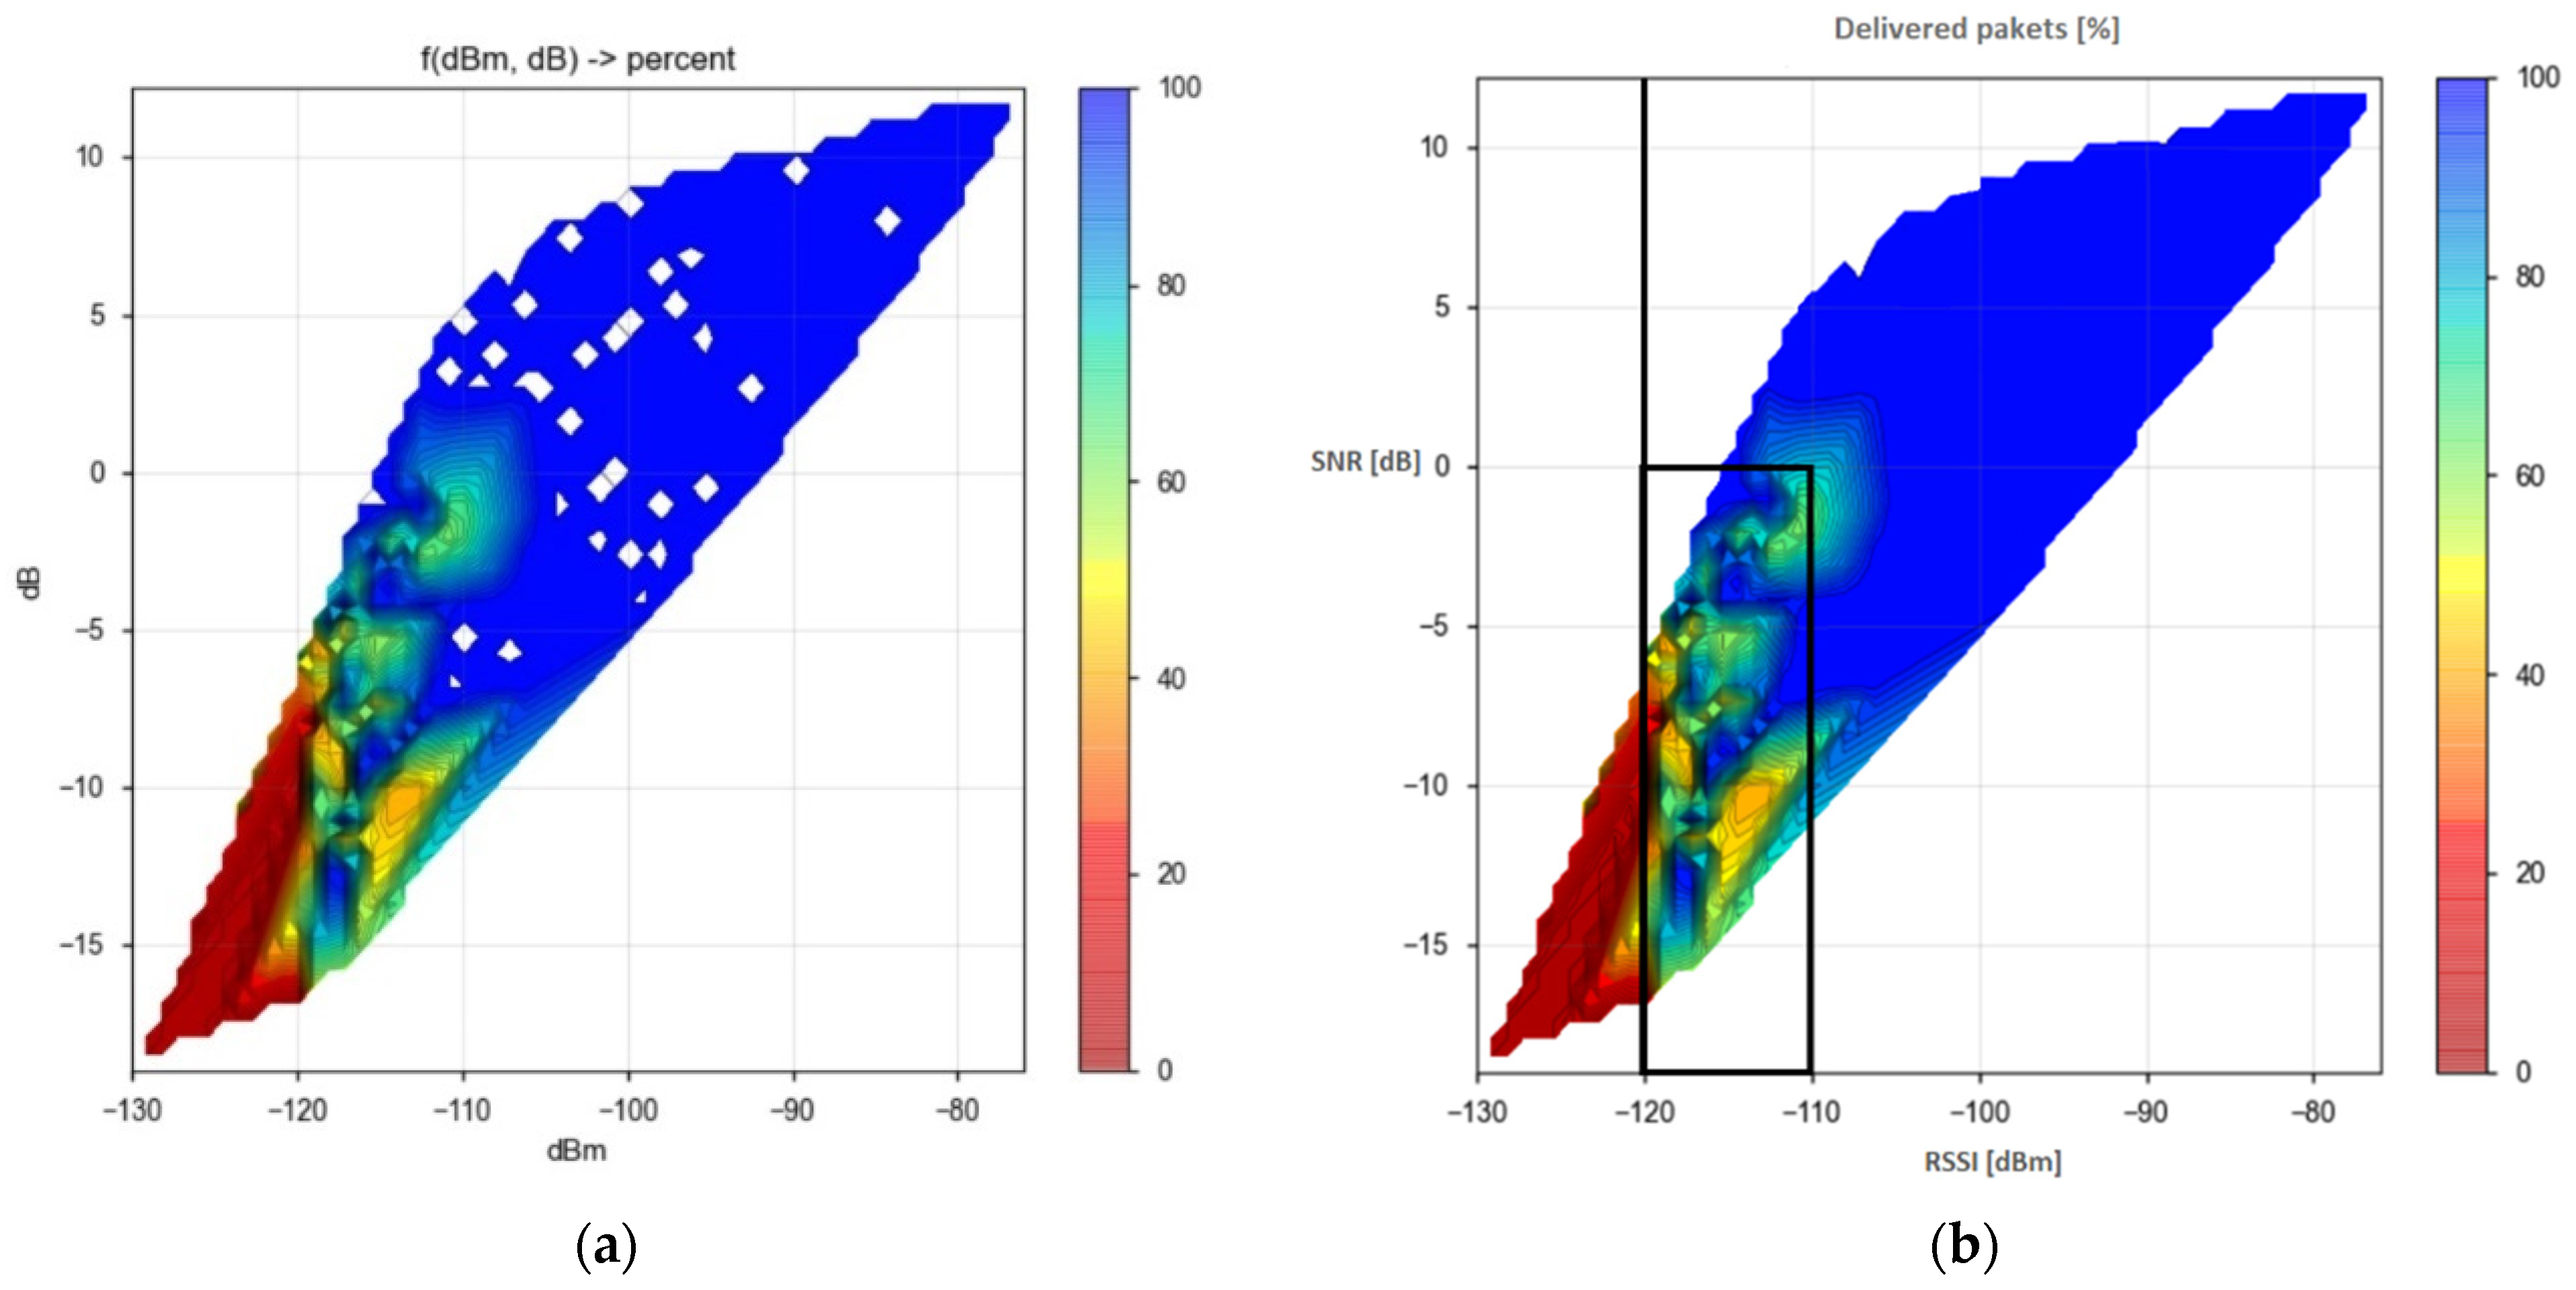
4.1. Evaluation of Communication Range and Channel Attenuation Modeling
4.2. Evaluation and Optimization of Energy Consumption in Simulated LoRa Networks
4.3. Overview of Simulation Results
| EUI, timestamp, FCnt, frequency, data rate, RSSI, SNR, gateway EUI, port, data |
| 0004A30B00FFEF62,1655557243123,161,868500000,SF11 BW125 4/5,-115,-3.5,024B0BFFFF0310B2,1,693e0001bf3eb0020000ff 0004A30B00FFEF62,1655557843123,162,867500000,SF11 BW125 4/5,-102,-12.8,024B0BFFFF0310B2,1,693e4001bf3e98020000ff 0004A30B00FFEF62,1655558443123,163,867700000,SF11 BW125 4/5,-115,-2.5,024B0BFFFF0310B2,1,693e4001bf3e80020000ff 0004A30B00FFEF62,1655559043103,164,868100000,SF11 BW125 4/5,-118,-2,024B0BFFFF0310B2,1,693e4001bd3e70020000ff 0004A30B00FFEF62,1655560243103,166,868300000,SF11 BW125 4/5,-115,-7.8,024B0BFFFF0310B2,1,693e8001bd3e58000000ff ⋯ |
5. Conclusions and Recommendation
Author Contributions
Funding
Data Availability Statement
Conflicts of Interest
References
- Grgić, K.; Žagar, D.; Balen, J.; Vlaović, J. Internet of Things in Smart Agriculture—Possibilities and Challenges. In Proceedings of the International Conference on Smart Systems and Technologies (SST), Osijek, Croatia, 19–22 October 2020; pp. 239–244. [Google Scholar]
- Wang, J.; Ju, C.; Gao, Y.; Sangaiah, A.K.; Kim, G. A PSO based Energy Efficient Coverage Control Algorithm for Wireless Sensor Networks. Comput. Mater. Contin. 2018, 56, 433–446. [Google Scholar]
- Callebaut, G.; Ottoy, G.; van der Perre, L. Cross-Layer Framework and Optimization for Efficient Use of the Energy Budget of IoT Nodes. In Proceedings of the IEEE Wireless Communications and Networking Conference, Marrakesh, Morocco, 15–18 April 2019; pp. 1–6. [Google Scholar]
- Callebaut, G.; Ottoy, G.; Perre, L.V.D. Optimizing Transmission of IoT Nodes in Dynamic Environments. In Proceedings of the 2020 International Conference on Omni-Layer Intelligent Systems, Barcelona, Spain, 31 August–2 September 2020; pp. 1–5. [Google Scholar]
- Akkas, M.A.; Sokullu, R. An IoT-based greenhouse monitoring system with Micaz motes. Procedia Comput. Sci. 2017, 113, 603–608. [Google Scholar] [CrossRef]
- Gonzalez-Amarillo, C.A.; Coralles-Munoz, J.C.; Moreno, M.A.M.; Amarillo, A.M.G.; Hussein, A.F.; Arunkumar, N.; Ramirez-Gonzalez, G. An IoT-based traceability system for greenhouse seedling crops. IEEE Access 2018, 6, 67528–67535. [Google Scholar] [CrossRef]
- Karim, F.; Karim, F.; Frihida, A. Monitoring system using web of things in precision agriculture. Procedia Comput. Sci. 2017, 110, 402–409. [Google Scholar] [CrossRef]
- Talavera, J.M.; Tobon, L.E.; Gomez, J.A.; Culman, M.A.; Aranda, J.M.; Parra, D.T.; Quiroz, L.A.; Hoyos, A.; Garreta, L.E. Review of IoT applications in agro-industrial and environmental fields. Comput. Electron. Agric. 2017, 142, 283–297. [Google Scholar] [CrossRef]
- Doshi, J.; Patel, T.; Bharti, S.K. Smart farming using IoT, a solution for optimally monitoring farming conditions. Procedia Comput. Sci. 2019, 160, 746–751. [Google Scholar] [CrossRef]
- Raza, U.; Kulkarni, P.; Sooriyabandara, M. Low power wide area networks: An overview. IEEE Commun. Surv. Tutor. 2017, 19, 855–873. [Google Scholar] [CrossRef]
- Mekki, K.; Bajic, E.; Chaxel, F.; Meyer, F. A comparative study of LPWAN technologies for large-scale IoT deployment. ICT Express 2019, 5, 1–7. [Google Scholar] [CrossRef]
- Sinha, R.S.; Wei, Y.; Hwang, S.-H. A survey on LPWA technology: LoRa and NB-IoT. ICT Express 2017, 3, 14–21. [Google Scholar] [CrossRef]
- Sundaram, J.P.S.; Du, W.; Zhao, Z. A survey on LoRa networking: Research problems, current solutions, and open issues. IEEE Commun. Surv. Tutor. 2020, 22, 371–388. [Google Scholar] [CrossRef]
- Xu, J.; Yao, J.; Wang, L.; Ming, Z.; Wu, K.; Chen, L. Narrowband Internet of Things: Evolutions, technologies, and open issues. IEEE Internet Things J. 2018, 5, 1449–1462. [Google Scholar] [CrossRef]
- Bouguera, T.; Diouris, J.-F.; Chaillout, J.-J.; Jaouadi, R.; Andrieux, G. Energy Consumption Model for Sensor Nodes Based on LoRa and LoRaWAN. Sensors 2018, 18, 2104. [Google Scholar] [CrossRef]
- Kamal, M.A.; Alam, M.M.; Sajak, A.A.B.; Súud, M.M. Requirements, Deployments, and Challenges of LoRa Technology: A Survey. Comput. Intell. Neurosci. 2023, 2023, 5183062. [Google Scholar] [CrossRef]
- Sun, Z.; Yang, H.; Liu, K.; Yin, Z.; Li, Z.; Xu, W. Recent Advances in LoRa: A Comprehensive Survey. ACM Trans. Sen. Netw. 2022, 18, 6. [Google Scholar] [CrossRef]
- Idris, S.; Karunathilake, T.; Förster, A. Survey and Comparative Study of LoRa-Enabled Simulators for Internet of Things and Wireless Sensor Networks. Sensors 2022, 22, 5546. [Google Scholar] [CrossRef]
- Li, C.; Cao, Z. LoRa Networking Techniques for Large-scale and Long-term IoT: A Down-to-top Survey. ACM Comput. Surv. 2022, 55, 52. [Google Scholar] [CrossRef]
- Raychowdhury, A.; Pramanik, A. Survey on LoRa Technology: Solution for Internet of Things. In Intelligent Systems, Technologies and Applications. Advances in Intelligent Systems and Computing; Springer: Singapore, 2020; Volume 1148. [Google Scholar] [CrossRef]
- Ikpehai, A.; Adebisi, B.; Rabie, K.M.; Anoh, K.; Ande, R.E.; Hammoudeh, M.; Gacanin, H.; Mbanaso, U.M. Low-Power Wide Area Network Technologies for Internet-of-Things: A Comparative Review. IEEE Internet Things J. 2019, 6, 2225–2240. [Google Scholar] [CrossRef]
- Devalal, S.; Karthikeyan, A. LoRa Technology—An Overview. In Proceedings of the 2018 Second International Conference on Electronics, Communication and Aerospace Technology (ICECA), Coimbatore, India, 29–31 March 2018; pp. 284–290. [Google Scholar] [CrossRef]
- Ertürk, M.A.; Aydın, M.A.; Büyükakkaşlar, M.T.; Evirgen, H. A Survey on LoRaWAN Architecture, Protocol and Technologies. Future Internet 2019, 11, 216. [Google Scholar] [CrossRef]
- Haxhibeqiri, J.; De Poorter, E.; Moerman, I.; Hoebeke, J. A Survey of LoRaWAN for IoT: From Technology to Application. Sensors 2018, 18, 3995. [Google Scholar] [CrossRef]
- Adelantado, F.; Vilajosana, X.; Tuset-Peiro, P.; Martinez, B.; Melia, J. Understanding the limits of lorawan. IEEE Commun. Mag. 2017. Available online: https://arxiv.org/pdf/1607.08011 (accessed on 12 June 2023).
- Augustin, A.; Yi, J.; Clausen, T. A study of LoRa: Long range & low power networks for the Internet of Things. Sensors 2016, 16, 1466. [Google Scholar] [PubMed]
- Derevianckine, G.H.; Guitton, A.; Iova, O.; Ning, B.; Valois, F. Opportunities and Challenges of LoRa 2.4 GHz. IEEE Commun. Mag. 2023; in press. 1–11. [Google Scholar] [CrossRef]
- Petajajarvi, J.; Mikhaylov, K.; Pettissalo, M.; Janhunen, J.; Iinatti, J. Performance of a low-power wide-area network based on LoRa technology: Doppler robustness, scalability, and coverage. Int. J. Distrib. Sens. Netw. 2017, 13, 1550147717699412. [Google Scholar] [CrossRef]
- Milarokostas, C.; Tsolkas, D.; Passas, N.; Merakos, L. A Comprehensive Study on LPWANs with a Focus on the Potential of LoRa/LoRaWAN Systems. IEEE Commun. Surv. Tutor. 2023, 25, 825–867. [Google Scholar] [CrossRef]
- Haxhibeqiri, J.; Van den Abeele, F.; Moerman, I.; Hoebeke, J. LoRa Scalability: A Simulation Model Based on Interference Measurements. Sensors 2017, 17, 1193. [Google Scholar] [CrossRef]
- Kim, B.; Hwang, K. Cooperative Downlink Listening for Low-Power Long-Range Wide-Area Network. Sustainability 2017, 9, 627. [Google Scholar] [CrossRef]
- Mahmoud, M.S.; Mohamad, A.A.H. A Study of Efficient Power Consumption Wireless Communication Techniques/Modules for Internet of Things (IoT) Applications. Adv. Intern. Things 2016, 6, 19–29. [Google Scholar] [CrossRef]
- Bor, M.; Roedig, U. LoRa Transmission Parameter Selection. In Proceedings of the 13th IEEE International Conference on Distributed Computing in Sensor Systems (DCOSS), Ottawa, ON, Canada, 5–7 June 2017. [Google Scholar]
- Magno, M.; Aoudia, F.A.; Gautier, M.; Berder, O.; Benini, L. WULoRa: An energy efficient IoT end-node for energy harvesting and heterogeneous communication. In Proceedings of the IEEE Design, Automation & Test in Europe Conference & Exhibition, Lausanne, Switzerland, 27–31 March 2017; pp. 1528–1533. [Google Scholar]
- Dongare, A.; Hesling, C.; Bhatia, K.; Balanuta, A.; Pereira, R.L.; Iannucci, B.; Rowe, A. OpenChirp: A Low-Power Wide-Area Networking architecture. In Proceedings of the IEEE International Conference on Pervasive Computing and Communications Workshops (PerCom Workshops), Kona, HI, USA, 13–17 March 2017; pp. 569–574. [Google Scholar]
- Cheikh, I.; Aouami, R.; Sabir, E.; Sadik, M.; Roy, S. Multi-Layered Energy Efficiency in LoRa-WAN Networks: A Tutorial. IEEE Access 2022, 10, 9198–9231. [Google Scholar] [CrossRef]
- Jawad, H.M.; Nordin, R.; Gharghan, S.K.; Jawad, A.M.; Ismail, M. Energy-Efficient Wireless Sensor Networks for Precision Agriculture: A Review. Sensors 2017, 17, 1781. [Google Scholar] [CrossRef]
- Kumar, D.P.; Amgoth, T. Chandra Sekhara Rao Annavarapu, Machine learning algorithms for wireless sensor networks: A survey. Inf. Fusion 2019, 49, 1–25. [Google Scholar] [CrossRef]
- Kolobe, L.G.F.; Lebekwe, C.K.; Sigweni, B. Systematic literature survey: Applications of LoRa communication. Int. J. Electr. Comput. Eng. 2020, 10, 3176–3183. [Google Scholar] [CrossRef]
- Wang, J.; Han, H.; Li, H.; He, S.; Sharma, P.K.; Chen, L. Multiple Strategies Differential Privacy on Sparse Tensor Factorization for Network Traffic Analysis in 5G. IEEE Trans. Ind. Inform. 2022, 18, 1939–1948. [Google Scholar] [CrossRef]
- Nolan, K.E.; Guibene, W.; Kelly, M.Y. An evaluation of low power wide area network technologies for the Internet of Things. In Proceedings of the IEEE International of Wireless Communications and Mobile Computing Conference (IWCMC), Paphos, Cyprus, 5–9 September 2016; pp. 440–444. [Google Scholar]
- Ribeiro, L.E.; Tokikawa, D.W.; Rebelatto, J.L.; Brante, G. Comparison between LoRa and NB-IoT coverage in urban and rural Southern Brazil regions. Ann. Telecommun. 2020, 75, 755–766. [Google Scholar] [CrossRef]
- Zewdu, E.; Adame, B.O.; Salau, A.O. An energy efficient coverage guaranteed greedy algorithm for wireless sensor networks lifetime enhancement. Eng. Rev. 2022, 42, 1–9. [Google Scholar] [CrossRef]
- Widianto, M.H.; Ramadhan, A.; Trisetyarso, A.; Abdurachman, E. Energy saving on IoT using LoRa: A systematic literature review. Int. J. Reconfigurable Embed. Syst. 2022, 11, 25–33. [Google Scholar] [CrossRef]
- Mare, S.; Vladimir, D.; Cvetan, G. Energy Consumption Estimation of Wireless Sensor Networks in Greenhouse Crop Production. In Proceedings of the IEEE EUROCON 17th International Conference on Smart Technologies, Ohrid, North Macedonia, 6–8 July 2017; pp. 870–874. [Google Scholar]
- Phui, S.C.; Johan, B.; Chris, H.; Jeroen, F. Comparison of LoRaWAN Classes and their Power Consumption. In Proceedings of the IEEE Symposium on Communications and Vehicular Technology (SCVT), Leuven, Belgium, 14 November 2017. [Google Scholar]
- Casals, L.; Mir, B.; Vidal, V.; Gomez, C. Modeling the Energy Performance of LoRaWAN. Sensors 2017, 17, 2364. [Google Scholar] [CrossRef] [PubMed]
- Available online: https://lora-developers.semtech.com/build/tools/calculator/ (accessed on 12 June 2023).
- Neumann, P.; Montavont, J.; Noël, T. Indoor deployment of low-power wide area networks (LPWAN): A LoRaWAN case study. In Proceedings of the IEEE 12th International Conference on Wireless and Mobile Computing, Networking and Communications (WiMob), New York, NY, USA, 17–19 October 2016; pp. 2–9. [Google Scholar]
- Mikhaylov, K.; Petajajarvi, J. Design and implementation of the plug-play enabled flexible modular wireless sensor and actuator network platform. Asian J. Control 2017, 19, 1393–1411. [Google Scholar] [CrossRef]
- Johnny, G.; Patrick, V.T.; Jo, V.; Hendrik, R. LoRa Mobile-To-Base-Station Channel Characterization in the Antarctic. Sensors 2017, 17, 1903. [Google Scholar]
- Spišić, J.; Pejković, A.; Zrnić, M.; Križanović, V.; Grgić, K.; Žagar, D. LoRaWAN Parameters Optimization for Efficient Communication. In Proceedings of the International Conference on Smart Systems and Technologies, Osijek, Croatia, 19–21 October 2022. [Google Scholar]
- Chettri, L. A comprehensive survey on Internet of Things (IoT) toward 5G wireless systems. IEEE Internet Things J. 2020, 7, 16–32. [Google Scholar] [CrossRef]
- RFM95/96/97/98(W) v1.0 & v2.0—Low Power Long Range Transceiver Module. Available online: https://www.hoperf.com/modules/lora/RFM95.html (accessed on 12 June 2023).
- Liaqat, R.M.; Branch, P.; But, J. LoRa Based Linear Network Applications, Design Considerations and Open Challenges: A Review. In Proceedings of the 20th ACM Conference on Embedded Networked Sensor Systems (SenSys ’22), Boston, MA, USA, 6–9 November 2022; Association for Computing Machinery: New York, NY, USA, 2023; pp. 913–917. [Google Scholar] [CrossRef]
- Nayak, J.; Manoj, P.; Uday, J. A Review on LoRa Transmission. Int. J. Eng. Res. Technol. 2022, 10, 211–213. [Google Scholar]
- Philip, M.S.; Singh, P. Energy Consumption Evaluation of LoRa Sensor Nodes in Wireless Sensor Network. In Proceedings of the 2021 Advanced Communication Technologies and Signal Processing (ACTS), Rourkela, India, 15–17 December 2021; pp. 1–4. [Google Scholar] [CrossRef]
- SX1272/73—Doczz.net. Available online: https://doczz.net/doc/7947188/sx1272-73 (accessed on 12 June 2023).
- Errata Microchip RN2483. Available online: http://ww1.microchip.com/downloads/en/DeviceDoc/80000689A.pdf (accessed on 12 June 2023).
- Chirp Spread Spectrum (CSS)—IoT ONE. Available online: https://www.iotone.com/term/chirp-spread-spectrum-css/t110 (accessed on 12 June 2023).
- Petajajarvi, J.; Mikhaylov, K.A.; Yasmin, R.; Hämäläinen, M.; Iinatti, J. Evaluation of LoRa LPWAN Technology for Indoor Remote Health and Wellbeing Monitoring. Int. J. Wirel. Inf. Netw. 2017, 24, 153–165. [Google Scholar] [CrossRef]
- Bor, M.C.; Roedig, U.; Voigt, T.; Alonso, J.M. Do LoRa Low-Power Wide-Area Networks Scale? In Proceedings of the 19th ACM International Conference on Modeling, Analysis and Simulation of Wireless and Mobile Systems (MSWiM ’16), Valletta, Malta, 13–17 November 2016; pp. 59–67. [Google Scholar]
- Extraordinary Optical Transmission—Wikipedia. Available online: https://en.wikipedia.org/wiki/Extraordinary_optical_transmission (accessed on 12 June 2023).
- ISL067 ISL067R Operational Description SX1276-7-8.Book Invisible Systems. Available online: https://fccid.io/ZWZ-ISL067/Operational-Description/operational-description-2326556 (accessed on 12 June 2023).
- Application of LoRa Protocol on Arduino—Principle and Code Analysis (1). Available online: https://blog.csdn.net/weixin_39584176/article/details/104814971 (accessed on 12 June 2023).
- Wake on SyncAddress Interrupt. Semtech SX1236. Available online: https://manualzz.com/doc/o/15k5bf/semtech-sx1236-fsk-transceiver-datasheet-7.3.2.--wake-on-syncaddress-interrupt (accessed on 12 June 2023).
- Alenezi, M.; Chai, K.K.; Chen, Y.; Jimaa, S. Ultra-Dense LoRaWAN: Reviews and Challenges. First published: 1 June 2020. Available online: https://ietresearch.onlinelibrary.wiley.com/doi/10.1049/iet-com.2018.6128 (accessed on 12 June 2023).
- Available online: https://www.thethingsnetwork.org/forum/t/how-to-find-maximum-packet-size/25321/2 (accessed on 12 June 2023).
- Križanović, V.; Ćaćić, D.; Grgić, K.; Žagar, D. Energy Efficiency of LoRa based Wireless Sensor Networks for Environmental Monitoring and Precision Agriculture. In Proceedings of the Eighteenth Advanced International Conference on Telecommunications AICT 2022, Porto, Portugal, 26–30 June 2022. [Google Scholar]
- LoRa™ Modulation Basics, Semtech Std. 2015. [Online]. Available online: https://www.semtech.com/uploads/documents/an1200.22.pdf (accessed on 12 June 2023).
- LoRa Designer’s Guide, Semtech Std. SX1272/3/6/7/8. 2013. [Online]. Available online: https://www.semtech.com/uploads/documents/LoraDesignGuideSTD.pdf (accessed on 12 June 2023).
- LoRaWAN™ 1.0.3 Specification, LoRa Alliance. 2018. Available online: https://lora-alliance.org/wp-content/uploads/2020/11/lorawan1.0.3.pdf (accessed on 12 June 2023).
- LoRa Modem Low Energy Consumption Design, Semtech Std. SX1272/3/6/7/8. 2013. [Online]. Available online: https://www.semtech.com/uploads/documents/LoraLowEnergyDesignSTD.pdf (accessed on 12 June 2023).
- Pop, A.-I.; Raza, U.; Kulkarni, P.; Sooriyabandara, M. Does bidirectional traffic do more harm than good in LoRaWAN based LPWA networks? arXiv 2017, arXiv:1704.04174. [Google Scholar]
- LoRa Developer Portal. Available online: https://lora-developers.semtech.com/documentation/technical-documents (accessed on 12 June 2023).
- Stewart, S.; Nguyen, H.H.; Barton, R.; Henry, J. Reducing the Cost of Implementing Filters in LoRa Devices. Sensors 2019, 19, 4037. [Google Scholar] [CrossRef]
- Available online: https://witekio.com/fr/blog-fr/lorawan-a-dedicated-iot-network/ (accessed on 12 June 2023).
- Available online: https://lora-developers.semtech.com/documentation/tech-papers-and-guides/the-book/packet-size-considerations (accessed on 12 June 2023).
- Available online: https://dramco.be/tools/lora-calculator/ (accessed on 12 June 2023).
- Libelium Products and Pricing Catalogue. Available online: https://manualzz.com/doc/8165880/libelium-products-and-pricing-catalogue (accessed on 12 June 2023).
- Petajajarvi, J.; Mikhaylov, K.; Roivainen, A.; Hanninen, T.; Pettissalo, M. On the coverage of LPWANs: Range evaluation and channel attenuation model for LoRa technology. In Proceedings of the 2015 14th International Conference on ITS Telecommunications (ITST), Copenhagen, Denmark, 2–4 December 2015; pp. 55–59. [Google Scholar] [CrossRef]
- Aslan, Y.E.; Korpeoglu, I.; Ulusoy, Ö. A framework for use of wireless sensor networks in forest fire detection and monitoring. Comput. Environ. Urban Syst. 2012, 36, 614–625. [Google Scholar] [CrossRef]
- Foughali, K.; Fathallah, K.; Frihida, A. Using cloud IoT for disease prevention in precision agriculture. Procedia Comput. Sci. 2018, 130, 575–582. [Google Scholar] [CrossRef]
- Farooq, M.S.; Riaz, S.; Abid, A.; Abid, K.; Naeem, M.A. A survey on the role of IoT in agriculture for the implementation of smart farming. IEEE Access 2019, 7, 156237–156271. [Google Scholar] [CrossRef]
- Nikitin, A.V.; Davidchack, R.L. Aggregate Spread Pulse Modulation in LPWANs for IoT applications. In Proceedings of the 2021 IEEE 7th World Forum on Internet of Things (WF-IoT), New Orleans, LA, USA, 14 June–31 July 2021; pp. 101–106. [Google Scholar] [CrossRef]
- Heusse, M.; Tourancheau, B.; Coutaud, U. LoRa Channel Characterization for Flexible and High Reliability Adaptive Data Rate in Multiple Gateways Networks. Computers 2021, 10, 44. [Google Scholar] [CrossRef]
- Callebaut, G. LoRaWAN Network Simulator. Available online: https://github.com/GillesC/LoRaEnergySim/tree/v0.1.0 (accessed on 12 June 2023).
- Available online: https://www.thethingsnetwork.org/docs/lorawan/adaptive-data-rate/index.html (accessed on 12 June 2023).
- Rana, A.K.; Salau, A.O.; Sharma, S.; Tayal, S.; Gupta, S. Internet of Things Energy, Industry, and Healthcare; CRC Press: Boca Raton, FL, USA, 2021; ISBN 9780367686529. [Google Scholar]
- Kumar, A.; Salau, A.O.; Gupta, S.; Paliwal, K. Recent Trends in IoT and Its Requisition with IoT Built Engineering: A Review. In Advances in Signal Processing and Communication. Lecture Notes in Electrical Engineering; Rawat, B., Trivedi, A., Manhas, S., Karwal, V., Eds.; Springer: Singapore, 2019; Volume 526. [Google Scholar] [CrossRef]
- Salau, A.O.; Chettri, L.; Bhutia, T.K.; Lepcha, M. IoT Based Smart Digital Electric Meter for Home Appliances. In Proceedings of the 2020 International Conference on Decision Aid Sciences and Application (DASA), Online, 8–9 November 2020; pp. 708–713. [Google Scholar]


| Transceiver | Current Consumption | |||||||
|---|---|---|---|---|---|---|---|---|
| Transmit | Receive | Sleep | References | |||||
| 20 dBm | 14 dBm | 13 dBm | 7 dBm | 2 dBm | ||||
| HopeRF RFM95/96/97/98(W) | 120 mA | - | 29 mA | 20 mA | - | 11.5 mA (min. 10.8 mA, max. 12.1 mA) | 0.2 µA (max. 1 µA) | [54] |
| HopeRF HM-TRLR-LF/HFS | 120 mA | - | 35 mA | - | - | 16 mA (min. 15 mA, max. 18 mA) | 2 µA (max. 3 µA) | [59] |
| 133 mA | - | - | - | - | 16.3 mA | 7.7 µA | [60] | |
| Semtech SX1276 | 120 mA | - | - | 20 mA | - | 11.5 mA (min. 10.8 mA, max. 12.0 mA) | 0.2 µA (max. 1 µA) | [61] |
| - | - | - | - | - | 14 mA | 0.17 mA | [34] | |
| - | - | - | - | - | 16.6. mA | 3.7 mA | [35,62] | |
| Semtech SX1272 | 124 mA | - | - | 18 mA | - | 10.5 mA or 11.2 mA | 0.1 µA (max. 1 µA) | [63] |
| - | - | - | - | - | 11 mA | 2 µA | [31,64] | |
| - | - | - | - | 26 mA | 12 mA | 40 µA | [32,64] | |
| - | - | - | - | - | 20 mA | 70 µA | [33,65] | |
| Microchirp RN2482 | - | 38.9 mA | - | - | - | 14.2 mA | up to 100–150 µA | [58,60,66,67] |
| - | 48 mA | - | - | - | 17.2 mA | 3.4 mA | [62,66] | |
| - | 38.5 mA | - | - | 23.9 mA | - | - | [68] | |
| - | - | - | - | - | 46 mA | 34 mA | [69] | |
| Transmit Power for the Defined Finite Transmit Power States | ||||||
|---|---|---|---|---|---|---|
| Transceiver | Transmit Mode | RFOP = +7 dBm, on RFO_LF/HF Pin | RFOP = +13 dBm, on RFO_LF/HF Pin | RFOP = +17 dBm, on PA_BOOST | RFOP = +20 dBm, on PA_BOOST | Reference |
| SX1272 | Power consumption (mW) | 95.4 | 95.4 | 297 | 412 | [15] |
| RFM95/96/97/98(W) | 66 | 95.7 | 287 | 396 | [54] | |
| Energy Profile Used in the Analyses | ||||||
|---|---|---|---|---|---|---|
| Sensor State | Power [54] | Duration (ms) [70,71,73] | ||||
| Sleep | 4.95 × 10⁻³ mW | - | ||||
| Processing | 19.14 mW | 5 ms | ||||
| Tx prep. | 12.5 mW | 40 ms | ||||
| Tx | 2 dBm | 7 dBm | 14 dBm | 17 dBm | 20 dBm | Equation in [3] |
| 25 mW | 66 mW | 125 mW | 287 mW | 396 mW | ||
| Wait Rx1 | 4.95 × 10⁻³ mW | 1 × 10³ ms | ||||
| Wait Rx2 | 4.95 × 10⁻³ mW | 1 × 10³–len (state Rx1) | ||||
| Rx prep. | 5.94 mW | 3.4 | ||||
| Rx1 | 37.95 mW | air_time (DR = DR_tx) | ||||
| Rx2 | 35.64 mW | air_time (DR = 3) | ||||
| Rx post proc. | 5.94 mW | 10.7 | ||||
| Packet Payload Format: 11-Byte Payload | |||||||||||
|---|---|---|---|---|---|---|---|---|---|---|---|
| Measured Parameter | Type | Battery | Temperature | T_min | T_max | Humidity | Atmospheric Pressure | Irradiation | Max Irradiation | Rain | Min Time between Rain Gauge Clicks |
| Bit start position | 1st | 3rd bit | 8th bit | 19th bit | 25th bit | 31st bit | 40th bit | 54th bit | 64th bit | 73rd bit | 81st bit |
| No. of bits | 2 | 5 | 11 | 6 | 6 | 9 | 14 | 10 | 9 | 8 | 8 |
| Value in binary | 01 | 10100 | 10011111000 | 000000 | 000000 | 011011111 | 10011111010110 | 0000000001 | 000000000 | 00000000 | 11111111 |
| Value in units | 1 | 4 | 27.2 | 0 | 0 | 44.6 | 100,990 | 2 | 0 | 0 | 255 |
| Units | N/A | V | °C | °C | °C | % | Pa | W/m2 | W/m2 | Pulses | Seconds |
| Resolution | 1 | 0.05 | 0.1 | 0.1 | 0.1 | 0.2 | 5 | 2 | 2 | 1 | 1 |
| Max no. of values | 4 | 32 | 2048 | 64 | 64 | 512 | 16,384 | 1024 | 512 | 256 | 256 |
| Min–max value | 0–3 | 3–4.55 | −100–104.7 | 0–6.3 | 0–6.3 | 0–102.2 | 50,000–131,920 | 0–2046 | 0–1022 | 0–255 | 0–255 |
| Req min–max values | 0–3 | 3–4.5 | −50–80 | 0–3 | 0–3 | 0–100 | 60,000–128,000 | 0–1500 | 0–100 | 0–25 | 1–255 |
| Check | OK | OK | OK | OK | OK | OK | OK | OK | OK | OK | OK |
| Packet Payload Format: 6-Byte Payload | ||||||
|---|---|---|---|---|---|---|
| Measured Parameter | Battery | Temperature | Humidity | Atmospheric Pressure | Irradiation | Rain |
| Bit start position | 1st bit | 6th bit | 14th bit | 23rd bit | 35th bit | 44th bit |
| No. of bits | 5 | 8 | 9 | 12 | 9 | 5 |
| Value in binary | 10100 | 10000110 | 011011111 | 100101101011 | 000000001 | 00000000 |
| Value in units | 4 | 27.0 | 44.6 | 100,987 | 3 | 0 |
| Units | V | °C | % | Pa | W/m2 | Pulses |
| Resolution | 0.05 | 0.5 | 0.2 | 17 | 3 | 1 |
| Max no. of values | 32 | 256 | 512 | 4096 | 512 | 32 |
| Min–max value | 3–4.55 | −40–87.5 | 0–102.2 | 60,000–129,632 | 0–1536 | 0–32 |
| Req min–max values | 3–4.5 | −50–80 | 0–100 | 60,000–128,000 | 0–1500 | 0–25 |
| Check | OK | OK | OK | OK | OK | OK |
| Output | SF6 | SF7 | SF8 | SF9 | SF10 | SF11 | SF12 |
|---|---|---|---|---|---|---|---|
| SF | 6 | 7 | 8 | 9 | 10 | 11 | 12 |
| DE | 0 | 0 | 0 | 0 | 0 | 1 | 1 |
| Tsym (ms) | 0.5 | 1.0 | 2.0 | 4.1 | 8.2 | 16.4 | 32.8 |
| Tpreamble (ms) | 6.3 | 12.5 | 25.1 | 50.2 | 100.4 | 200.7 | 401.4 |
| Application payload size | 51 bytes | ||||||
| payloadSymbNb (symbols) | 123 | 103 | 93 | 83 | 73 | 83 | 73 |
| Tpayload (ms) | 63.0 | 105.5 | 190.5 | 340.0 | 598.0 | 1359.9 | 2392.1 |
| Tpacket (ms) | 69.2 | 118.0 | 215.6 | 390.1 | 698.4 | 1560.6 | 2793.5 |
| TTN Fair Access Policy (messages/day) | 254 | 139 | 76 | 42 | 19 | 10 | |
| TTN Fair Access Policy [messages/hour] | 10.6 | 5.8 | 3.2 | 1.8 | 0.8 | 0.4 | |
| Duty cycle (s): 0.1% | 69.2 | 118.0 | 215.6 | 390.1 | 698.4 | 1560.6 | 2793.5 |
| Duty cycle (s): 1% | 6.9 | 11.8 | 21.6 | 39.0 | 69.8 | 156.1 | 279.3 |
| Duty cycle (s): 10% | 0.7 | 1.2 | 2.2 | 3.9 | 7.0 | 15.6 | 27.9 |
| Application payload size | 11 bytes | ||||||
| payloadSymbNb (symbols) | 53 | 48 | 43 | 38 | 33 | 38 | 33 |
| Tpayload (ms) | 27.1 | 49.2 | 88.1 | 155.6 | 270.3 | 622.6 | 1081.3 |
| Tpacket (ms) | 33.4 | 61.7 | 113.2 | 205.8 | 370.7 | 823.3 | 1482.8 |
| TTN Fair Access Policy (messages/day) | 486 | 265 | 145 | 80 | 36 | 20 | |
| TTN Fair Access Policy (messages/hour) | 20.3 | 11.0 | 6.1 | 3.4 | 1.5 | 0.8 | |
| Duty cycle (s): 0.1% | 33.4 | 61.7 | 113.2 | 205.8 | 370.7 | 823.3 | 1482.8 |
| Duty cycle (s): 1% | 3.3 | 6.2 | 11.3 | 20.6 | 37.1 | 82.3 | 148.3 |
| Duty cycle (s): 10% | 0.3 | 0.6 | 1.1 | 2.1 | 3.7 | 8.2 | 14.8 |
| Application payload size | 6 bytes | ||||||
| payloadSymbNb (symbols) | 48 | 38 | 38 | 33 | 28 | 33 | 28 |
| Tpayload (ms) | 24.6 | 38.9 | 77.8 | 135.2 | 229.4 | 540.7 | 917.5 |
| Tpacket (ms) | 30.8 | 51.5 | 102.9 | 185.3 | 329.7 | 741.4 | 1318.9 |
| TTN Fair Access Policy (messages/day) | 583 | 291 | 161 | 90 | 40 | 22 | |
| TTN Fair Access Policy (messages/hour) | 24.3 | 12.1 | 6.7 | 3.8 | 1.7 | 0.9 | |
| Duty cycle (s): 0.1% | 30.8 | 51.5 | 102.9 | 185.3 | 329.7 | 741.4 | 1318.9 |
| Duty cycle (s): 1% | 3.1 | 5.1 | 10.3 | 18.5 | 33.0 | 74.1 | 131.9 |
| Duty cycle (s): 10% | 0.3 | 0.5 | 1.0 | 1.9 | 3.3 | 7.4 | 13.2 |
| Application Payload (Bytes) | Messages per Hour | Configuration | Periodicity Toff (min:s) | Battery TTL (years/months/weeks) | Battery Type | ||||
|---|---|---|---|---|---|---|---|---|---|
| AAA (Alkaline, 800 mAh) | Li-Ion (260 mAh) | AA (Alkaline, 2500 mAh) | Li-Ion (1000 mAh) | Li-Ion (2000 mAh) | |||||
| 51 | 12 | SF12/125 kHz | 4:57 | Worst case | 1 m | 1 m | 3 m | 4 m | 7 m 3 w |
| SF7/125 kHz | 5:00 | Best case | 9 m | 9 m | 2 y 4 m 1 w | 2 y 10 m 3 w | 5 y 9 m 2 w | ||
| 6 | SF12/125 kHz | 9:57 | Worst case | 2 m | 2 m | 6 m 1 w | 7 m 3 w | 1 y 3 m 3 w | |
| SF7/125 kHz | 10:00 | Best case | 1 y 4 m 3 w | 1 y 5 m | 4 y 4 m 3 w | 5 y 5 m | 10 y 10 m 1 w | ||
| 11 | 12 | SF12/125 kHz | 4:57 | Worst case | 2 m | 2 m | 6 m 1 w | 7 m 3 w | 1 y 3 m 3 w |
| SF7/125 kHz | 5:00 | Best case | 10 m 1 w | 10 m 1 w | 2 y 8 m 1 w | 3 y 4 m | 6 y 8 m | ||
| 6 | SF12/125 kHz | 9:57 | Worst case | 4 m | 4 m | 1 y 3 w | 1 y 3 m 2 w | 2 y 7 m 1 w | |
| SF7/125 kHz | 10:00 | Best case | 1 y 7 m 1 w | 1 y 7 m 1 w | 5 y | 6 y 2 m | 12 y 4 m 1 w | ||
| 6 | 12 | SF12/125 kHz | 4:57 | Worst case | 2 m 1 w | 2 m 1 w | 7 m 1 w | 9 m | 1 y 6 m |
| SF7/125 kHz | 5:00 | Best case | 10 m 2 w | 10 m 2 w | 2 y 8 m 3 w | 3 y 4 m 2 w | 6 y 9 m | ||
| 6 | SF12/125 kHz | 9:57 | Worst case | 4 m 2 w | 4 m 2 w | 1 y 2 m 2 w | 1 y 5 m 3 w | 2 y 11 m 3 w | |
| SF7/125 kHz | 10:00 | Best case | 1 y 7 m 2 w | 1 y 7 m 2 w | 5 y 3 w | 6 y 3 m | 12 y 6 m | ||
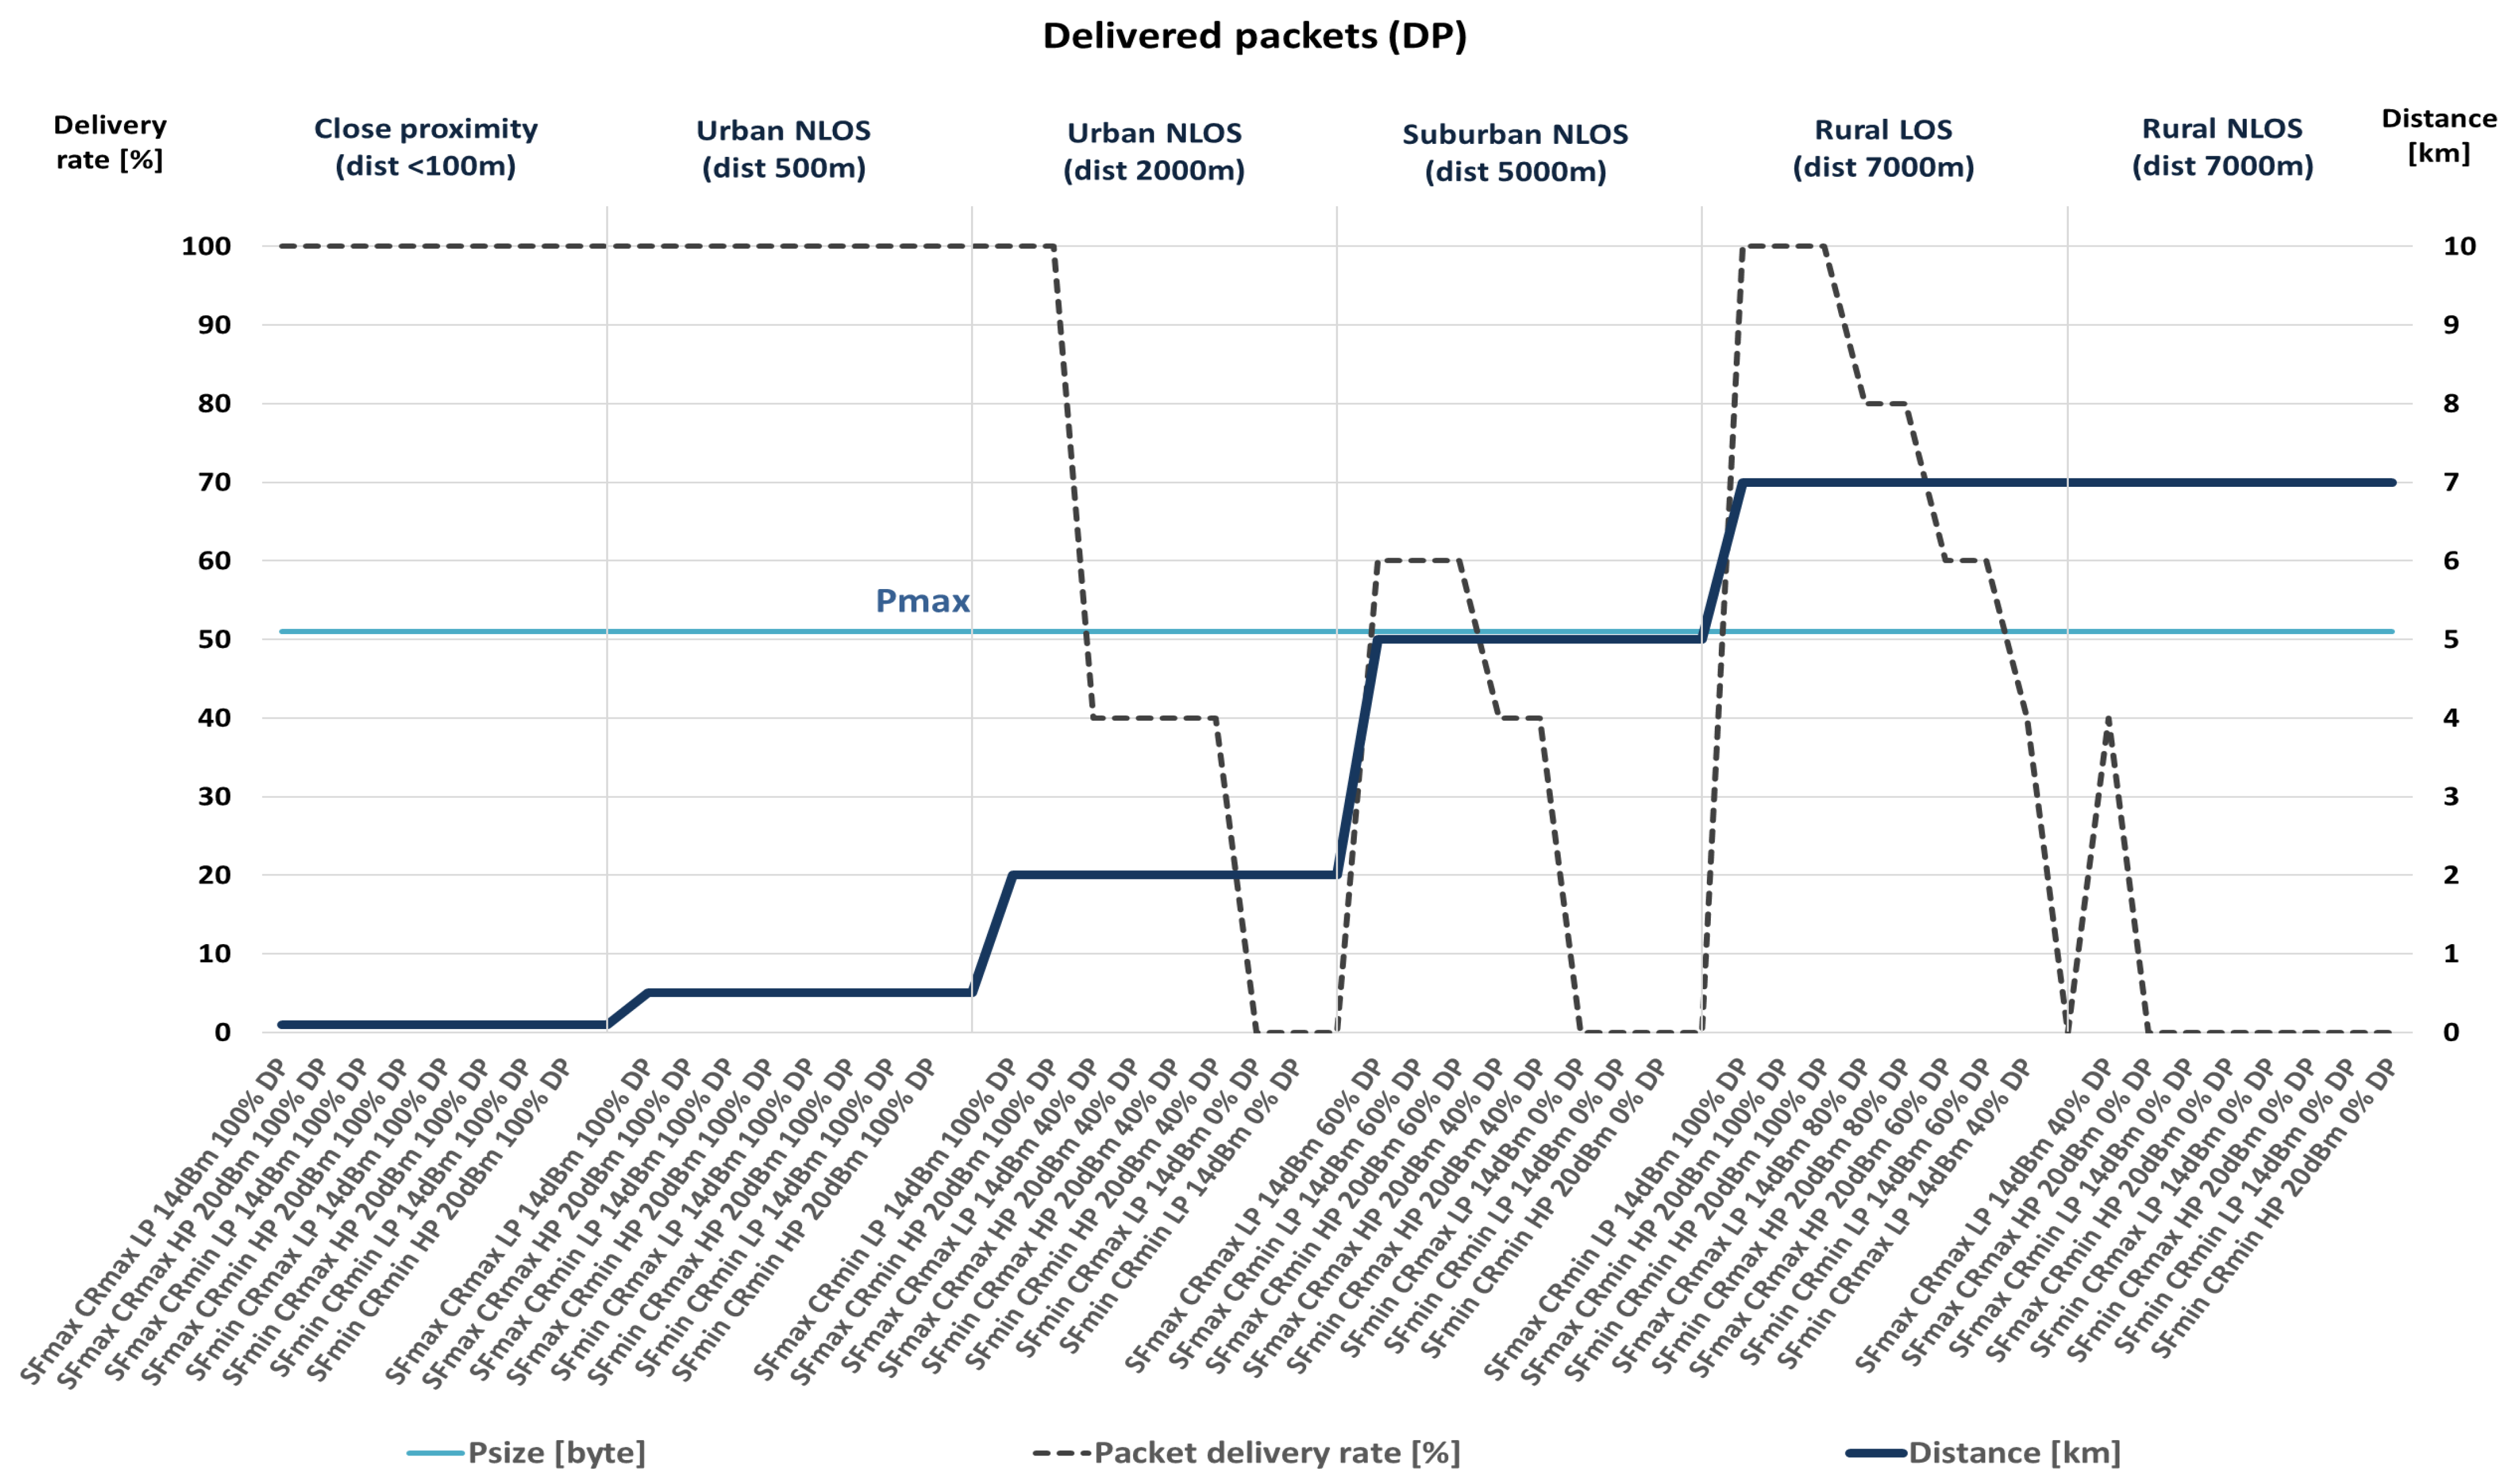
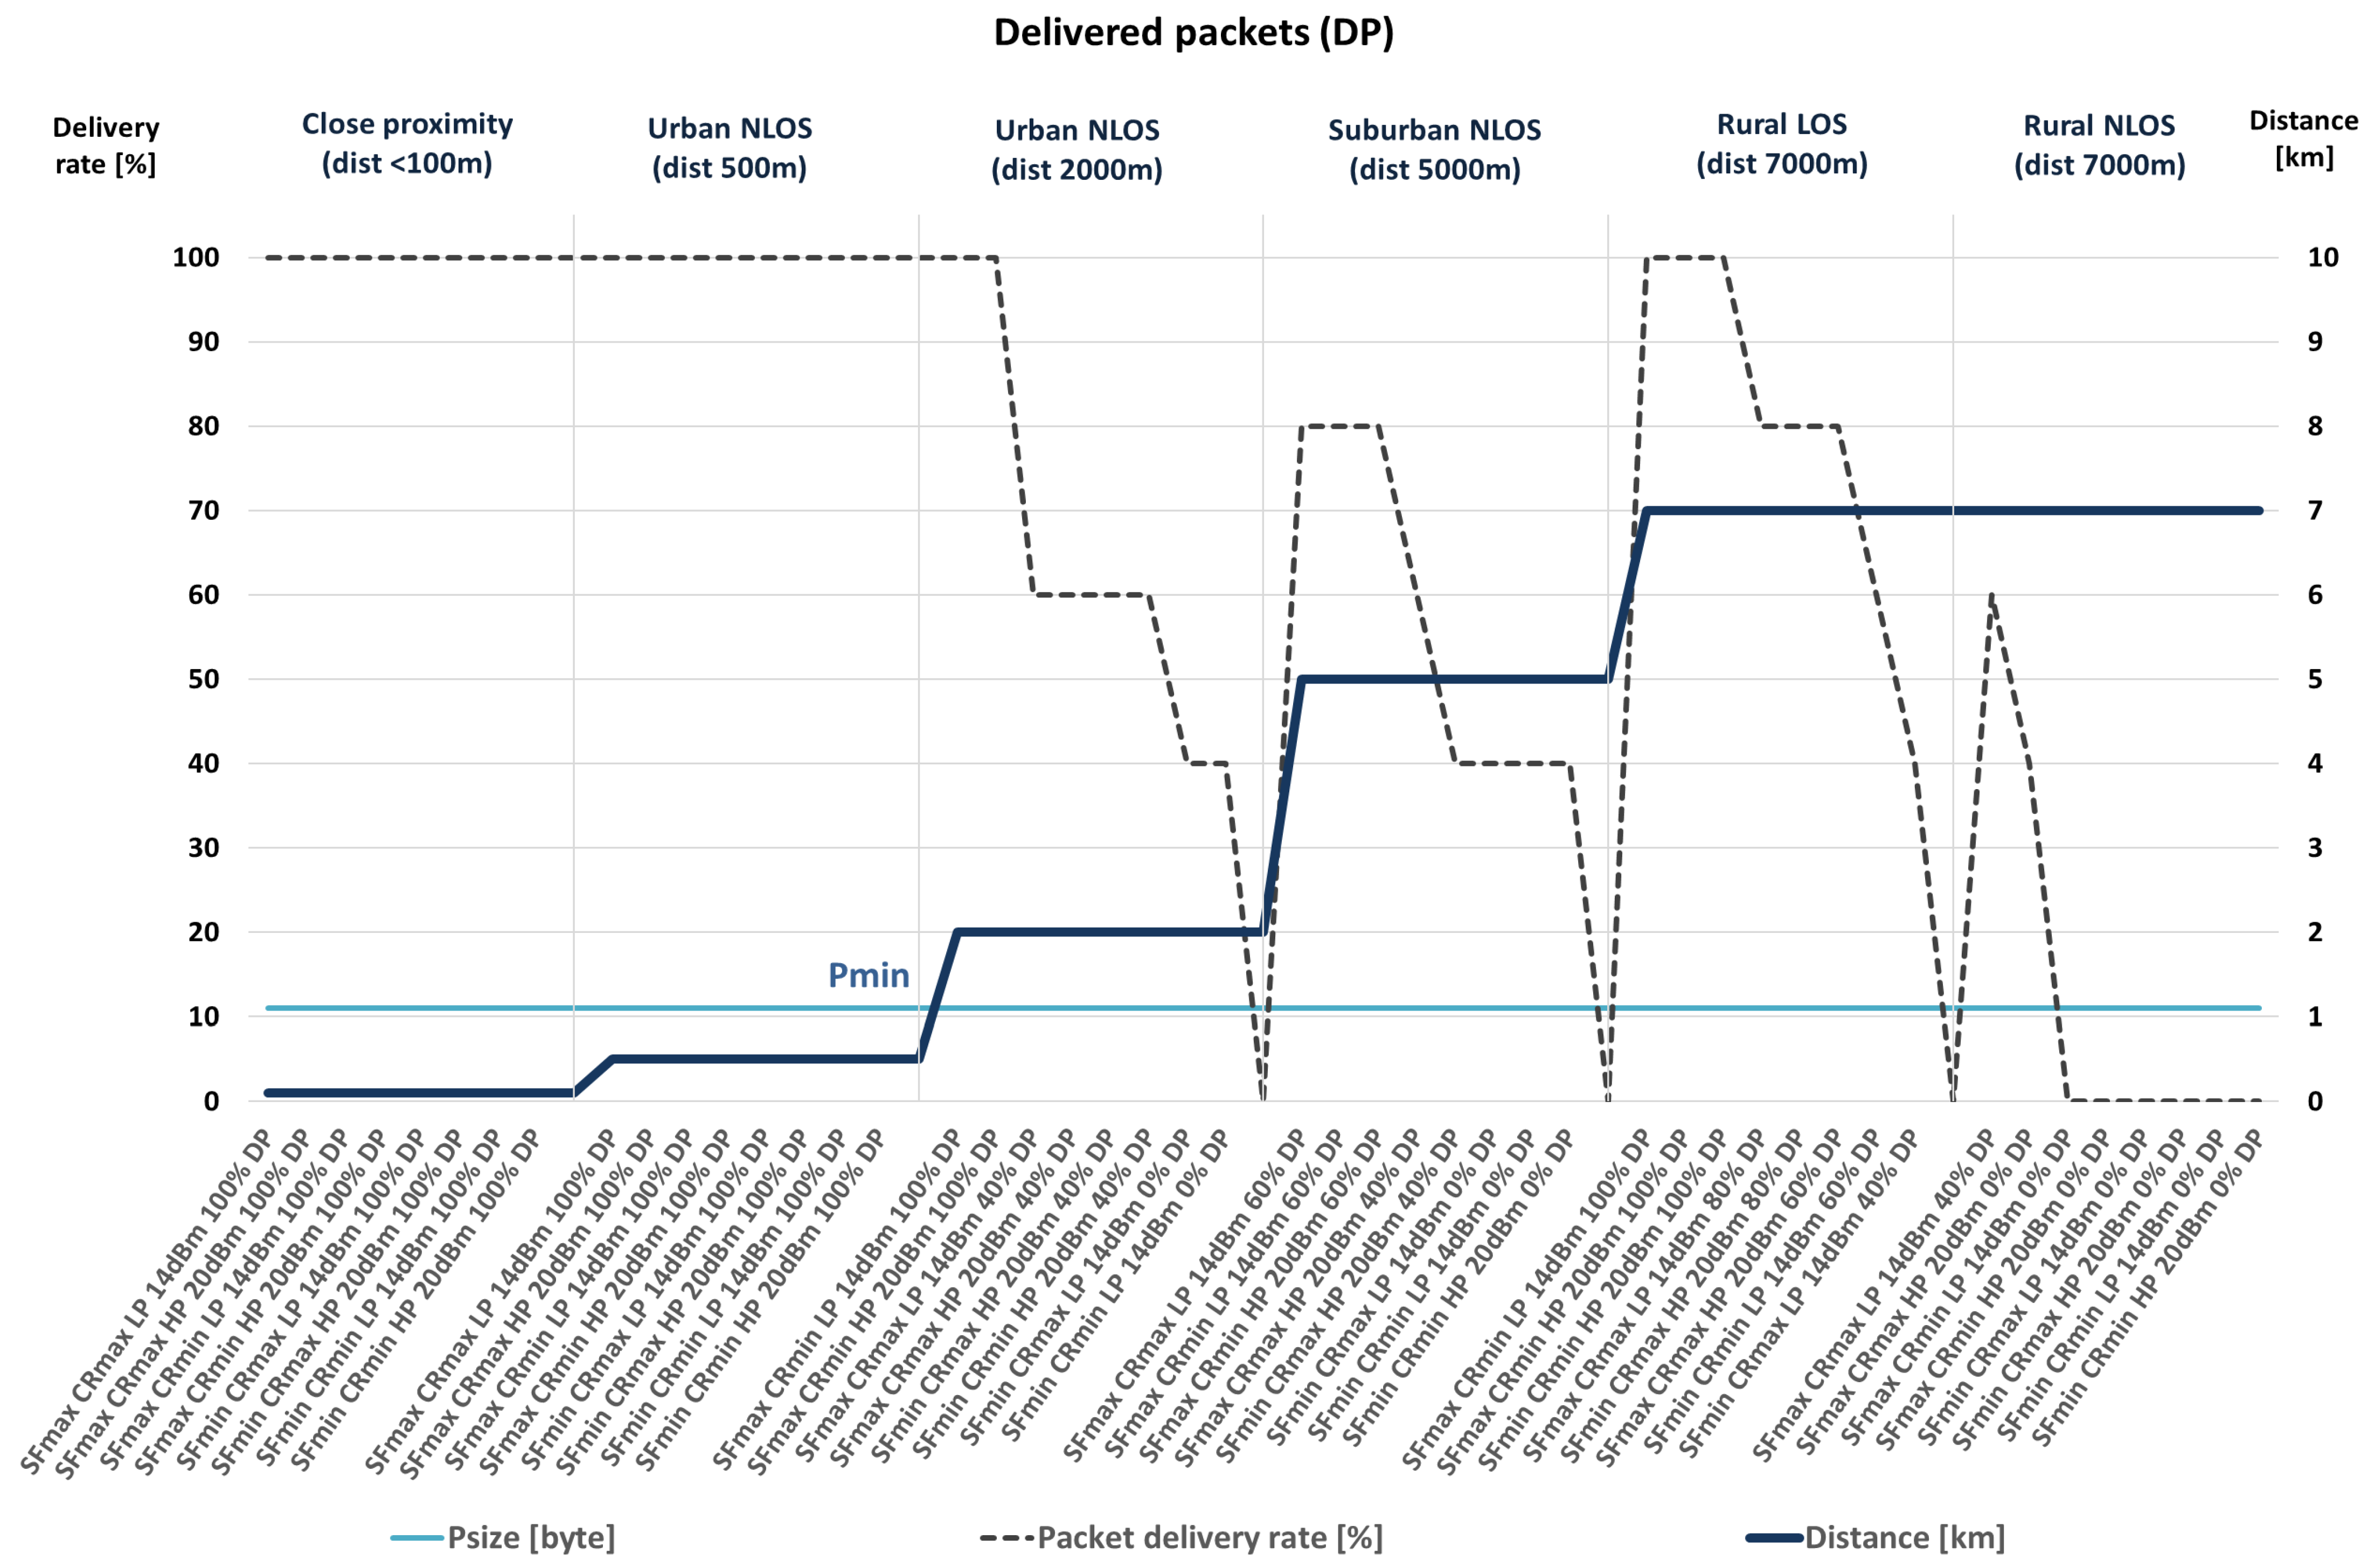
| Packet (P) Size: | Pmax | Pmin | ||||||||||||||
|---|---|---|---|---|---|---|---|---|---|---|---|---|---|---|---|---|
| Transceiver Power Mode: | Low Power (14 dBm) | High Power (20 dBm) | Low Power (14 dBm) | High Power (20 dBm) | ||||||||||||
| SF: | 7 | 10 | 7 | 10 | 7 | 10 | 7 | 10 | ||||||||
| CR: | 4/5 | 4/8 | 4/5 | 4/8 | 4/5 | 4/8 | 4/5 | 4/8 | 4/5 | 4/8 | 4/5 | 4/8 | 4/5 | 4/8 | 4/5 | 4/8 |
| Scenario: | Delivered Packets (DP) in Relation to Sent Packets: | |||||||||||||||
| Close Proximity (distance: <100 m) | 100% | 100% | 100% | 100% | 100% | 100% | 100% | 100% | 100% | 100% | 100% | 100% | 100% | 100% | 100% | 100% |
| Urban NLOS (distance: 500 m) | 100% | 100% | 100% | 100% | 100% | 100% | 100% | 100% | 100% | 100% | 100% | 100% | 100% | 100% | 100% | 100% |
| Urban NLOS (distance: 2000 m) | 0% | 0% | 40% | 100% | 40% | 40% | 40% | 100% | 40% | 40% | 60% | 100% | 60% | 60% | 60% | 100% |
| Suburban NLOS (distance: 5000 m) | 0% | 0% | 60% | 60% | 40% | 0% | 40% | 60% | 40% | 40% | 60% | 80% | 40% | 80% | 40% | 80% |
| Rural LOS (distance: 7000 m) | 40% | 60% | 80% | 100% | 80% | 100% | 60% | 100% | 40% | 80% | 80% | 100% | 80% | 80% | 60% | 100% |
| Rural NLOS (distance: 7000 m) | 0% | 0% | 40% | 0% | 0% | 0% | 0% | 0% | 0% | 0% | 40% | 0% | 0% | 0% | 0% | 60% |
| Packet Payload in Bytes | Maximal Total Packet Size in Bytes | Transmission Rate per Hour |
|---|---|---|
| 6 | 14 | 0.19 × 10⁻³ |
| 11 | 19 | 0.25 × 10⁻³ |
| 51 | 59 | 0.79 × 10⁻³ |
Disclaimer/Publisher’s Note: The statements, opinions and data contained in all publications are solely those of the individual author(s) and contributor(s) and not of MDPI and/or the editor(s). MDPI and/or the editor(s) disclaim responsibility for any injury to people or property resulting from any ideas, methods, instructions or products referred to in the content. |
© 2023 by the authors. Licensee MDPI, Basel, Switzerland. This article is an open access article distributed under the terms and conditions of the Creative Commons Attribution (CC BY) license (https://creativecommons.org/licenses/by/4.0/).
Share and Cite
Križanović, V.; Grgić, K.; Spišić, J.; Žagar, D. An Advanced Energy-Efficient Environmental Monitoring in Precision Agriculture Using LoRa-Based Wireless Sensor Networks. Sensors 2023, 23, 6332. https://doi.org/10.3390/s23146332
Križanović V, Grgić K, Spišić J, Žagar D. An Advanced Energy-Efficient Environmental Monitoring in Precision Agriculture Using LoRa-Based Wireless Sensor Networks. Sensors. 2023; 23(14):6332. https://doi.org/10.3390/s23146332
Chicago/Turabian StyleKrižanović, Višnja, Krešimir Grgić, Josip Spišić, and Drago Žagar. 2023. "An Advanced Energy-Efficient Environmental Monitoring in Precision Agriculture Using LoRa-Based Wireless Sensor Networks" Sensors 23, no. 14: 6332. https://doi.org/10.3390/s23146332
APA StyleKrižanović, V., Grgić, K., Spišić, J., & Žagar, D. (2023). An Advanced Energy-Efficient Environmental Monitoring in Precision Agriculture Using LoRa-Based Wireless Sensor Networks. Sensors, 23(14), 6332. https://doi.org/10.3390/s23146332