

Metrological Qualification of PD Analysers for Insulation Diagnosis of HVDC and HVAC Grids
 , , , , ,
Abstract
1. Introduction
2. Reference PD Pulse Trains and Noise Signals
2.1. Reference PD Pulse Trains Used for the Metrological Tests
2.2. Pulsating and Non-Pulsating Noises
3. Importance of the PD Charge Value and Considerations about the Estimation Method
4. Charge Measurement Methods
4.1. Charge Estimation Method by Direct Reading
4.2. Charge Estimation Method by Applying the Quasi-Integration Approach
4.3. Charge Estimation Method by Integrating the Current Signal
5. Metrological Tests Description
5.1. Noise Rejection Test
5.2. Linearity Test
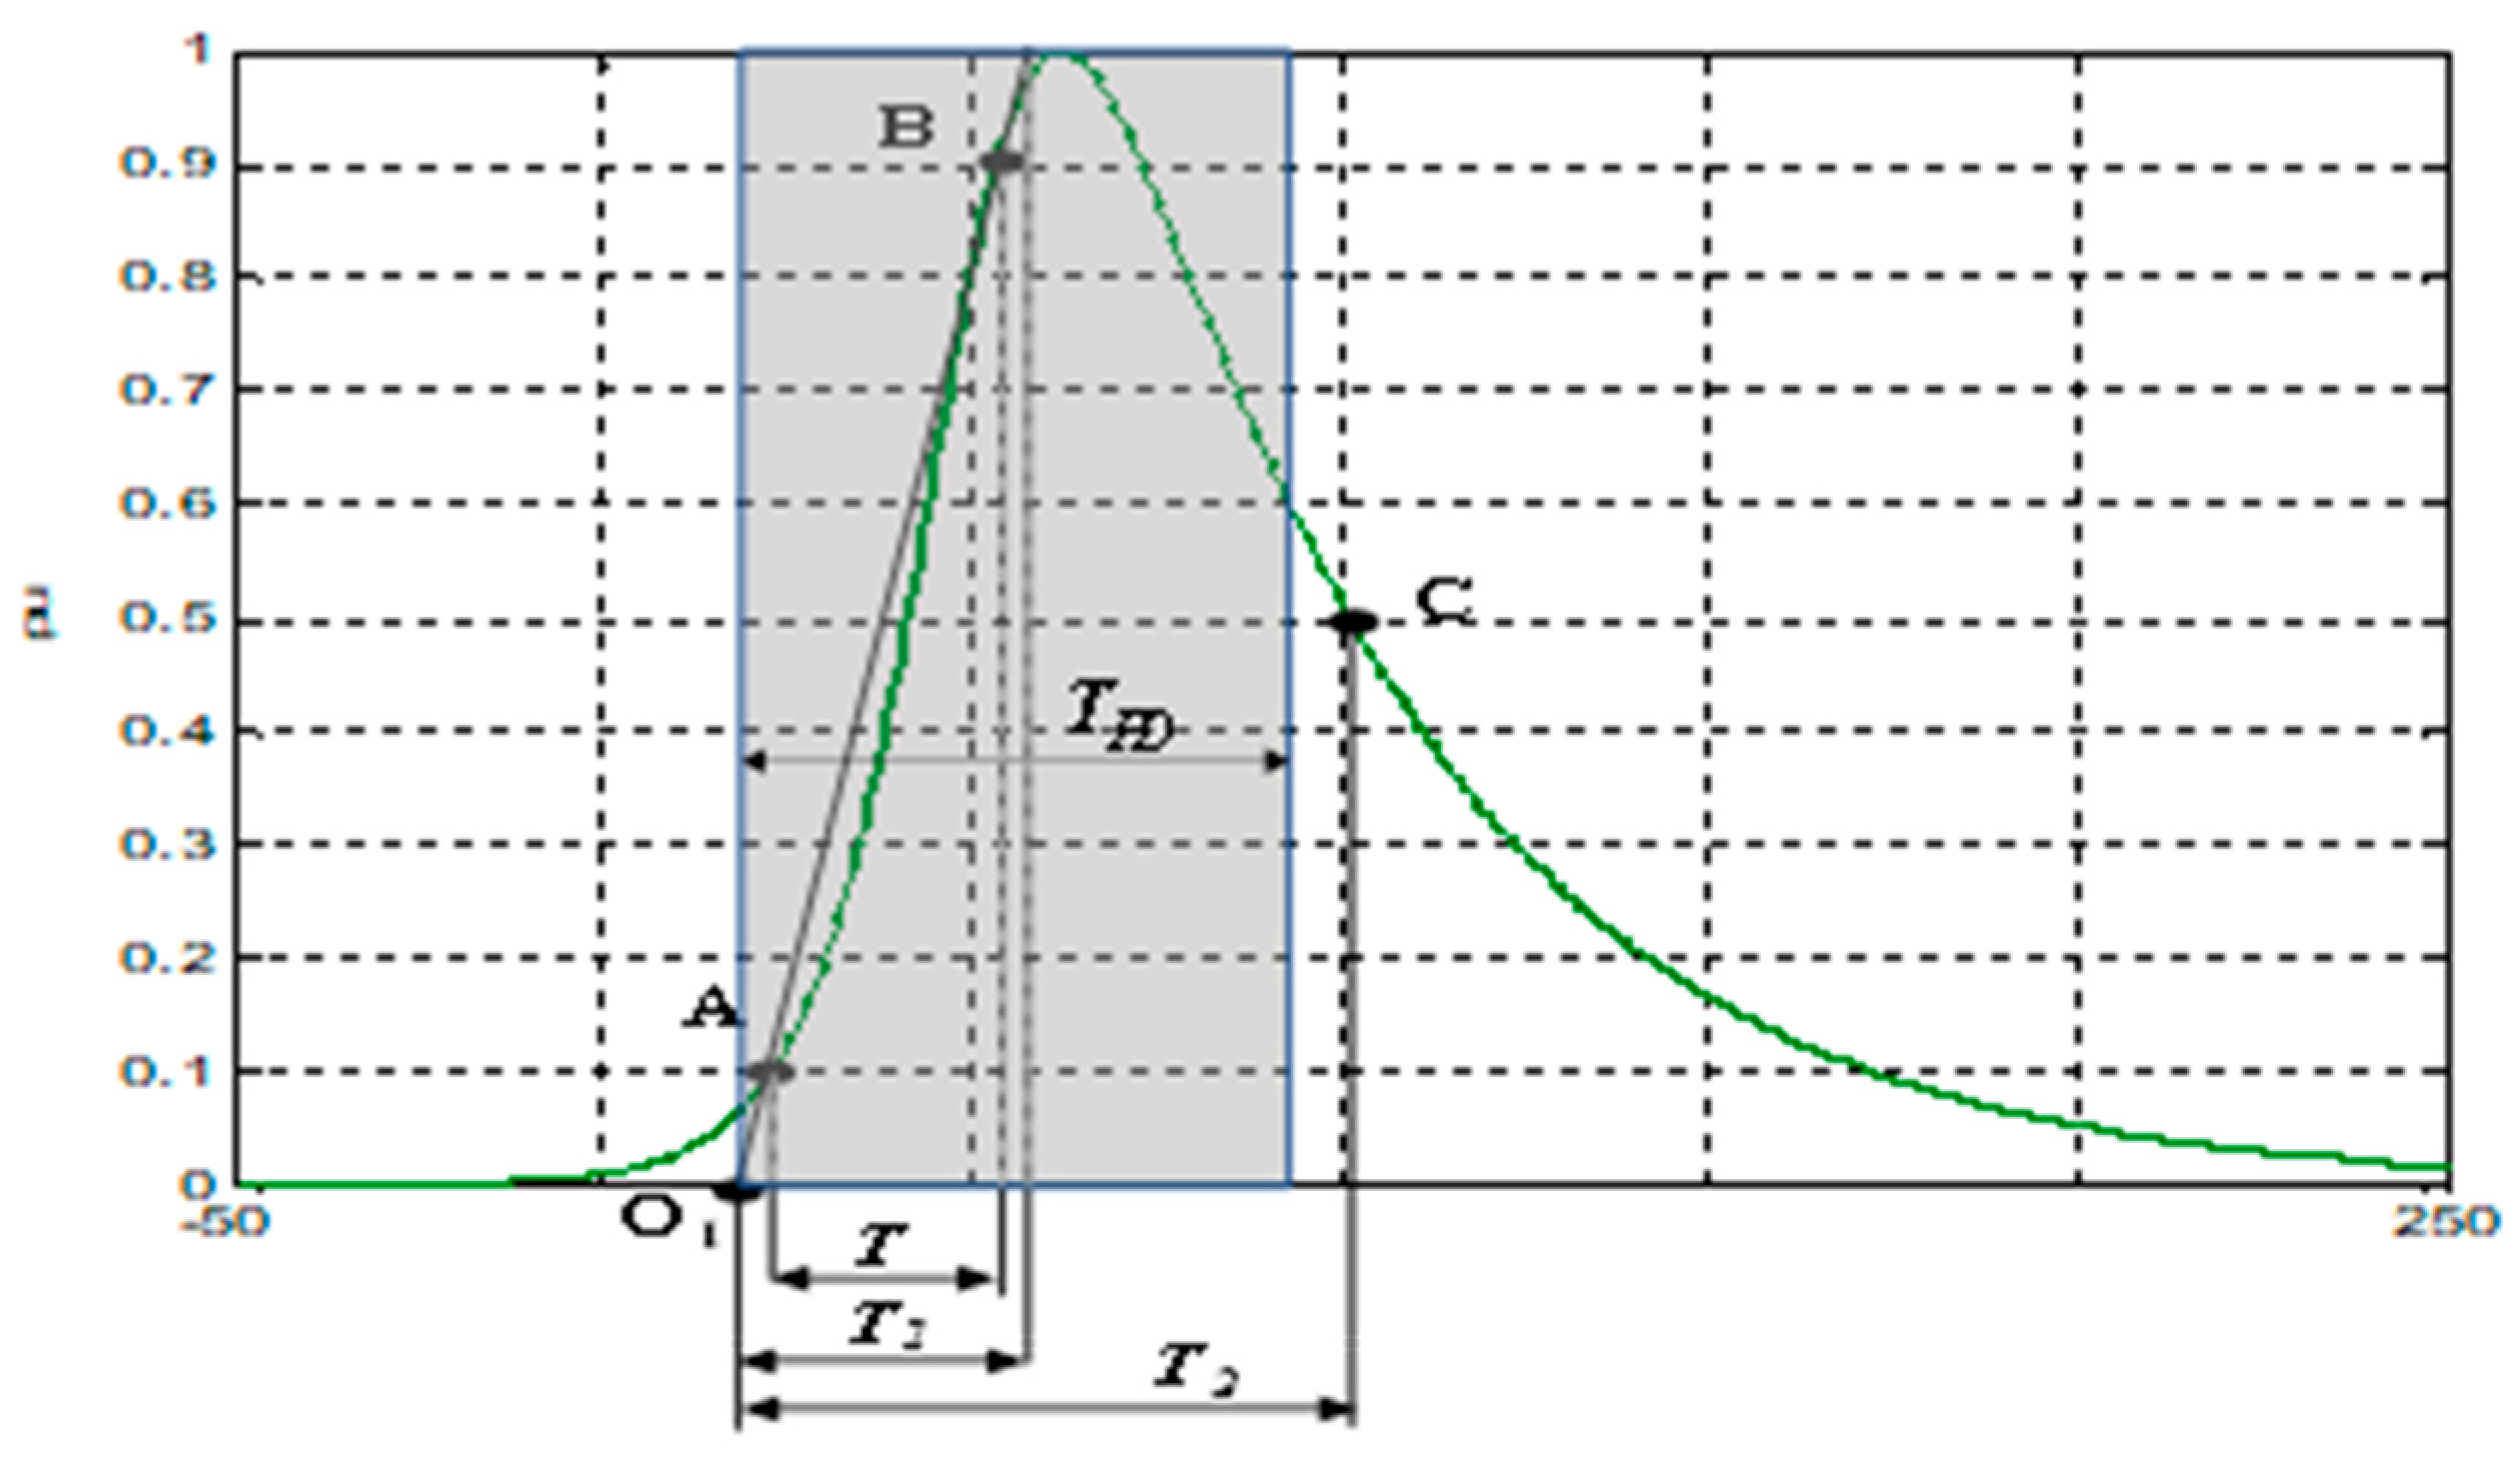
5.3. PD Time Test
5.4. Resolution Time (tres) Test
6. Practical Cases of Metrological Qualification of PD Analysers
6.1. Metrological Qualification of PD Analysers Operating for Off-Line Measurements
6.2. Metrological Qualification of PD Analysers Operating in On-Line Sporadic Measurements
6.3. Metrological Qualification of PD Analysers for Continuous PD Monitoring
7. Conclusions
Author Contributions
Funding
Data Availability Statement
Conflicts of Interest
References
- Sikorski, W.; Wielewski, A. Low-Cost Online Partial Discharge Monitoring System for Power Transformers. Sensors 2023, 23, 3405. [Google Scholar] [CrossRef] [PubMed]
- Álvarez, F.; Garnacho, F.; Ortego, J.; Sánchez-Urán, M.A. Application of HFCT and UHF sensors in on-line partial discharge measurements for insulation diagnosis of high voltage equipment. Sensors 2015, 15, 7360–7387. [Google Scholar] [CrossRef] [PubMed]
- Álvarez, F.; Albarracín, R.; Garnacho, F.; Granizo, R. Diagnosis of insulation condition of MV switchgears by application of different partial discharge measuring methods and sensors. Sensors 2018, 18, 720. [Google Scholar] [CrossRef] [PubMed]
- Sheng, B.; Zhou, C.; Hepburn, D.M.; Dong, X.; Peers, G.; Zhou, W.; Tang, Z. Partial discharge pulse propagation in power cable and partial discharge monitoring system. IEEE Trans. Dielectr. Electr. Insul. 2014, 21, 948–956. [Google Scholar] [CrossRef]
- Bassan, F.R.; Rosolem, J.B.; Floridia, C.; Penze, R.S.; Aires, B.N.; Roncolatto, R.A.; Peres, R.; Júnior, J.R.N.; Fracarolli, J.P.V.; da Costa, E.F.; et al. Multi-Parameter Optical Monitoring Solution Applied to Underground Medium-Voltage Electric Power Distribution Networks. Sensors 2023, 23, 5066. [Google Scholar] [CrossRef] [PubMed]
- Hu, X.; Zhang, G.; Liu, X.; Chen, K.; Zhang, X. Design of High-Sensitivity Flexible Low-Profile Spiral Antenna Sensor for GIS Built-in PD Detection. Sensors 2023, 23, 4722. [Google Scholar] [CrossRef]
- Riba, J.-R. Application of Image Sensors to Detect and Locate Electrical Discharges: A Review. Sensors 2022, 22, 5886. [Google Scholar] [CrossRef]
- Morshuis, P.H.F.; Smit, J.J. Partial discharges at DC voltage: Their mechanism, detection and analysis. IEEE Trans. Dielectr. Electr. Insul. 2005, 12, 328–340. [Google Scholar] [CrossRef]
- Morshuis, P.; Jeroense, M.; Beyer, J. Partial discharge. Part XXIV: The analysis of PD in HVDC equipment. IEEE Electr. Insul. Mag. 1997, 13, 6–16. [Google Scholar] [CrossRef]
- Seo, I.J.; Lee, Y.J.; Choi, W.; Lee, B.W.; Koo, J.Y.; Kim, J.T. A Development of DC PD Pattern Recognition Method Using Modified CAPD Together with PD Founding for Gas Insulated Apparatus under DC Voltage. In Proceedings of the CIGRE Session 2016. Session Materials D1-306_2016, Paris, France, 2016; Available online: https://e-cigre.org/publication/D1-306_2016 (accessed on 1 June 2023).
- Wang, G.; Jo, H.E.; Kim, S.J.; Kim, S.W.; Kil, G.S. Measurement and analysis of partial discharges in SF6 gas under HVDC. Measurement 2016, 91, 351–359. [Google Scholar] [CrossRef]
- Fard, M.A.; Farrag, M.E.; McMeekin, S.G.; Reid, A.J. Partial discharge behavior under operational and anomalous conditions in HVDC systems. IEEE Trans. Dielectr. Electr. Insul. 2017, 24, 1494–1502. [Google Scholar] [CrossRef]
- Winkelmann, E.; Shevchenko, I.; Steiner, C.; Kleiner, C.; Kaltenborn, U.; Birkholz, P.; Schwarz, H.; Steiner, T. Monitoring of Partial Discharges in HVDC Power Cables. IEEE Electr. Insul. Mag. 2022, 38, 7–18. [Google Scholar] [CrossRef]
- Garnacho, F.; Khamlichi, A.; Álvarez, F.; Ramírez, A.; Vera, C.; Rovira, J.; Simón, P.; Camuñas, A.; Arcones, E.; Ortego, J. Best practices for Partial Discharge Monitoring of HVDC Cable Systems and Qualification Tests. CIGRE Sci. Eng. Scopus Regist. Mag. (CSE) 2023, 27, 2426–1335. [Google Scholar]
- Koltunowicz, W.; Plath, R. Synchronous multi-channel PD measurements. IEEE Trans. Dielectr. Electr. Insul. 2008, 15, 1715–1723. [Google Scholar] [CrossRef]
- Zhou, X.; Zhou, C.; Kemp, I.J. An improved methodology for application of wavelet transform to partial discharge measurement denoising. IEEE Trans. Dielectr. Electr. Insul. 2005, 12, 586–594. [Google Scholar] [CrossRef]
- Ma, X.; Zhou, C.; Kemp, I.J. Automated wavelet selection and thresholding for PD detection. IEEE Electr. Insul. Mag. 2002, 18, 37–45. [Google Scholar] [CrossRef]
- De Oliveira, H.; Chaves, L.; Cunhas, T.; Vasconcelos, F.H. Partial discharge signal denoising with spatially adaptive wavelet thresholding and support vector machines. Electr. Power Syst. Res. 2011, 81, 644–659. [Google Scholar]
- Kyprianou, A.; Lewin, P.L.; Efthimiou, V.; Stavrou, A.; Georghiou, G.E. Wavelet packet denoising for online partial discharge detection in cables and its application to experimental field results. Meas. Sci. Technol. 2006, 17, 2367–2379. [Google Scholar] [CrossRef]
- Wang, Y.; Chen, P.; Zhao, Y.; Sun, Y. A Denoising Method for Mining Cable PD Signal Based on Genetic Algorithm Optimization of VMD and Wavelet Threshold. Sensors 2022, 22, 9386. [Google Scholar] [CrossRef]
- Alvarez, F.; Ortego, J.; Garnacho, F.; Sanchez-Uran, M.A. A clustering technique for partial discharge and noise sources identification in power cables by means of waveform parameters. IEEE Trans. Dielectr. Electr. Insul. 2016, 23, 469–481. [Google Scholar] [CrossRef]
- Cavallini, A.; Montanari, G.C.; Puletti, F.; Contin, A. A new methodology for the identification of PD in electrical apparatus: Properties and applications. IEEE Trans. Dielectr. Electr. Insul. 2005, 12, 203–215. [Google Scholar] [CrossRef]
- Ardila-Rey, J.A.; Martínez-Tarifa, J.M.; Robles, G.; Rojas-Moreno. Partial discharge and noise separation by means of spectral-power clustering techniques. IEEE Trans. Dielectr. Electr. Insul. 2013, 20, 1436–1443. [Google Scholar] [CrossRef]
- IEC 60270:2000+AMD1:2015 CSV Consolidated Version; High-Voltage Test Techniques—Partial Discharge Measurements. TC 42 High-Voltage and High-Current Test Techniques. International Electrotechnical Commission (IEC) Standards: Geneva, Switzerland, 2015.
- Guidelines for Partial Discharge Detection Using Conventional (IEC 60270) and Unconventional Methods; CIGRE WG D1.37 Technical Brochure 662, Electra; 2016; Volume 288. Available online: https://www.researchgate.net/publication/258120850_Partial_Discharge_and_Noise_Separation_by_Means_of_Spectral-Power_Clustering_Techniques (accessed on 1 June 2023).
- Lemke, E.; Berlijn, S.; Gulski, E.; Muhr, M.; Pultrum, E.; Strehl, T.; Hauschild, W.; Rickmann, J.; Rizzi, G. Guide for Partial Discharge Measurement in Compliance to IEC 60270; CIGRE WG D1.33 Technical Brochure 366, Electra. 2008. ISBN 978-2-85873-053-7. Available online: https://webstore.iec.ch/publication/23841 (accessed on 1 June 2023).
- Lemke, E. A critical review of partial-discharge models. IEEE Electr. Insul. Mag. 2012, 28, 11–16. [Google Scholar] [CrossRef]
- Cavallini, A.; Montanari, G.C.; Tozzi, M. PD apparent charge estimation and calibration: A critical review. IEEE Trans. Dielectr. Electr. Insul. 2010, 17, 198–205. [Google Scholar] [CrossRef]
- IEC TS 62478:2016; High Voltage Test Techniques—Measurement of Partial Discharges by Electromagnetic and Acoustic Methods. TC 42 High-Voltage and high-Current Test Techniques. International Electrotechnical Commission (IEC) Standards: Geneva, Switzerland, 2016.
- Gulski, E.; Meijer, S.; Agoris, P.; Strehl, T.; Tenbohlen, S.; Judd, M.D.; Bodega, R.; Lemke, E.; Jongen, R.A. Guidelines for Unconventional Partial Discharge Measurements; CIGRE WG D1.33 Technical Brochure 444. 2010. ISBN 978-2-85873-132-9. Available online: https://www.semanticscholar.org/paper/PD-apparent-charge-estimation-and-calibration%3A-A-Cavallini-Montanari/6733323fc85f7a637383a6f7f522af5296a2f765 (accessed on 1 June 2023).
- Arcones, E.; Álvarez, F.; Ortego, J.; Khamlichi, A.; Camuñas, A.; Rosete, A.; Garnacho, F.; Gómez, P. Development, testing and aging of reference insulation defects for the improvement in partial discharges diagnosis. In Proceedings of the IEEE Electrical Insulation Conference (EIC), Denver, CO, USA, 7–28 June 2021. [Google Scholar]


| Test Parameters of the PD Trains | Metrological Tests for Qualification of PD Analysers | |||
|---|---|---|---|---|
| 5.1) Noise Rejection | 5.2) Linearity | 5.3) PD Time (TPD) | 5.4) Resolution Time (tres) | |
| TPD (ns) | 75 | 75 | 8; 16; 37.5; 75; 110; 150 | 75 |
| n, N (pulse/s) | n = 400 | n = 400 | n = 400 | N = 400; 3125; 6250; 12,500; 25,000; 50,000 and 100,000 |
| Δt (μs) | 1000 | 1000 | 1000 | 2500, 320, 160, 80, 40, 20 and 10 μs |
| Charge value q (pC) | 100 | 10; 50; 100; 200; 500; 1000; 2400 | 200 | 200 |
| Noise Amplitude | 20%; 50%; 100%; 200% | 35% for noises #1 and #2 and 10% for noise #3 (1) | ||
| Noise #1 | Noise #2 | Noise #3 | |
|---|---|---|---|
| Fixed noise spectrum applicable to PD analysers for off-line PD measurements | Fixed noise spectrum applicable to PD analysers for sporadic on-line PD measurements | Variable noise spectrum applicable to PD analysers for on-line PD continuous monitoring (1) | |
 |  | From tn to tn+1 = tn + ΔT | From tn+1 to tn+2 = tn+1 + ΔT |
 |  | ||
| PD Analyser for Off-Line Measurements | Analyser A-1 | Analyser A-2 | Analyser A-3 | |
|---|---|---|---|---|
| f1–f2 (kHz) | 40–400 | 40–800 | 610–770 | |
| Δf (kHz) | 360 | 760 | 160 | |
| Charge measurement method | Quasi-integration | Quasi-integration | Quasi-integration | |
| Filtering method | None | Manual selection of f1, f2 and | trigger level | |
| Metrological tests | ||||
| Noise rejection q = 100 pC | Noise amplitude (%) | Charge and PD repetition rate errors versus noise level Requirements Max |εq|≤ 10%; Max |εn| ≤ 2% under 50% noise level | ||
| 200 | εq = 248% | εq = 151% | εq = 61.9% | |
| εn > 1000% | εn > 1000% | εn = −0.4% | ||
| 100 | εq = 104.3% | εq = 53.9% | εq = 32.0% | |
| εn>1000% | εn > 1000% | εn = −0.4% | ||
| 50 | εq = 27% | εq = 26% | εq = 2.6% | |
| εn > 1000% | εn > 1000% | εn = −0.4% | ||
| 20 | εq = 7.8% | εq = 9.6% | εq = 0.5% | |
| εn > 1000% | εn = 496% | εn = −0.4% | ||
| Linearity under 35% noise | Charge range (pC) | Linearity error = εl = (Maxεqvalue–Minεqvalue)/2 Requirement εl ≤ 5% under 35% noise level | ||
| 50 to 2.400 | ±16.3% | ±6.2% | ±2.9% | |
| 10 to 2.400 | >100% | ±6.2% | ±2.9% | |
| PD time (TPD) under 35% noise q = 200 pC | Pulse width TPD range (ns) | TPD= (Maxεqvalue–Minεqvalue)/2 ≤ 30% under 35% noise level | ||
| 8 to 150 | ±2.5% | ±2.5% | ±2.7% | |
| Resolution time under 35% noise q = 200 pC | tresrange (μs) | PD repetition rate error Requirement Max|εn|≤ 2% under 35% noise level, at least 20 μs | ||
| 2.500–10 | 2.5 ms; |εn| > 2.0% | 2.5 ms; |εn| > 2.0% | 10 μs; |εn| = 1.3% | |
| PD Analyser for Sporadic Online Measurements | Analyser B-1 | Analyser B-2 | Analyser B-3 | Analyser B-4 | |
|---|---|---|---|---|---|
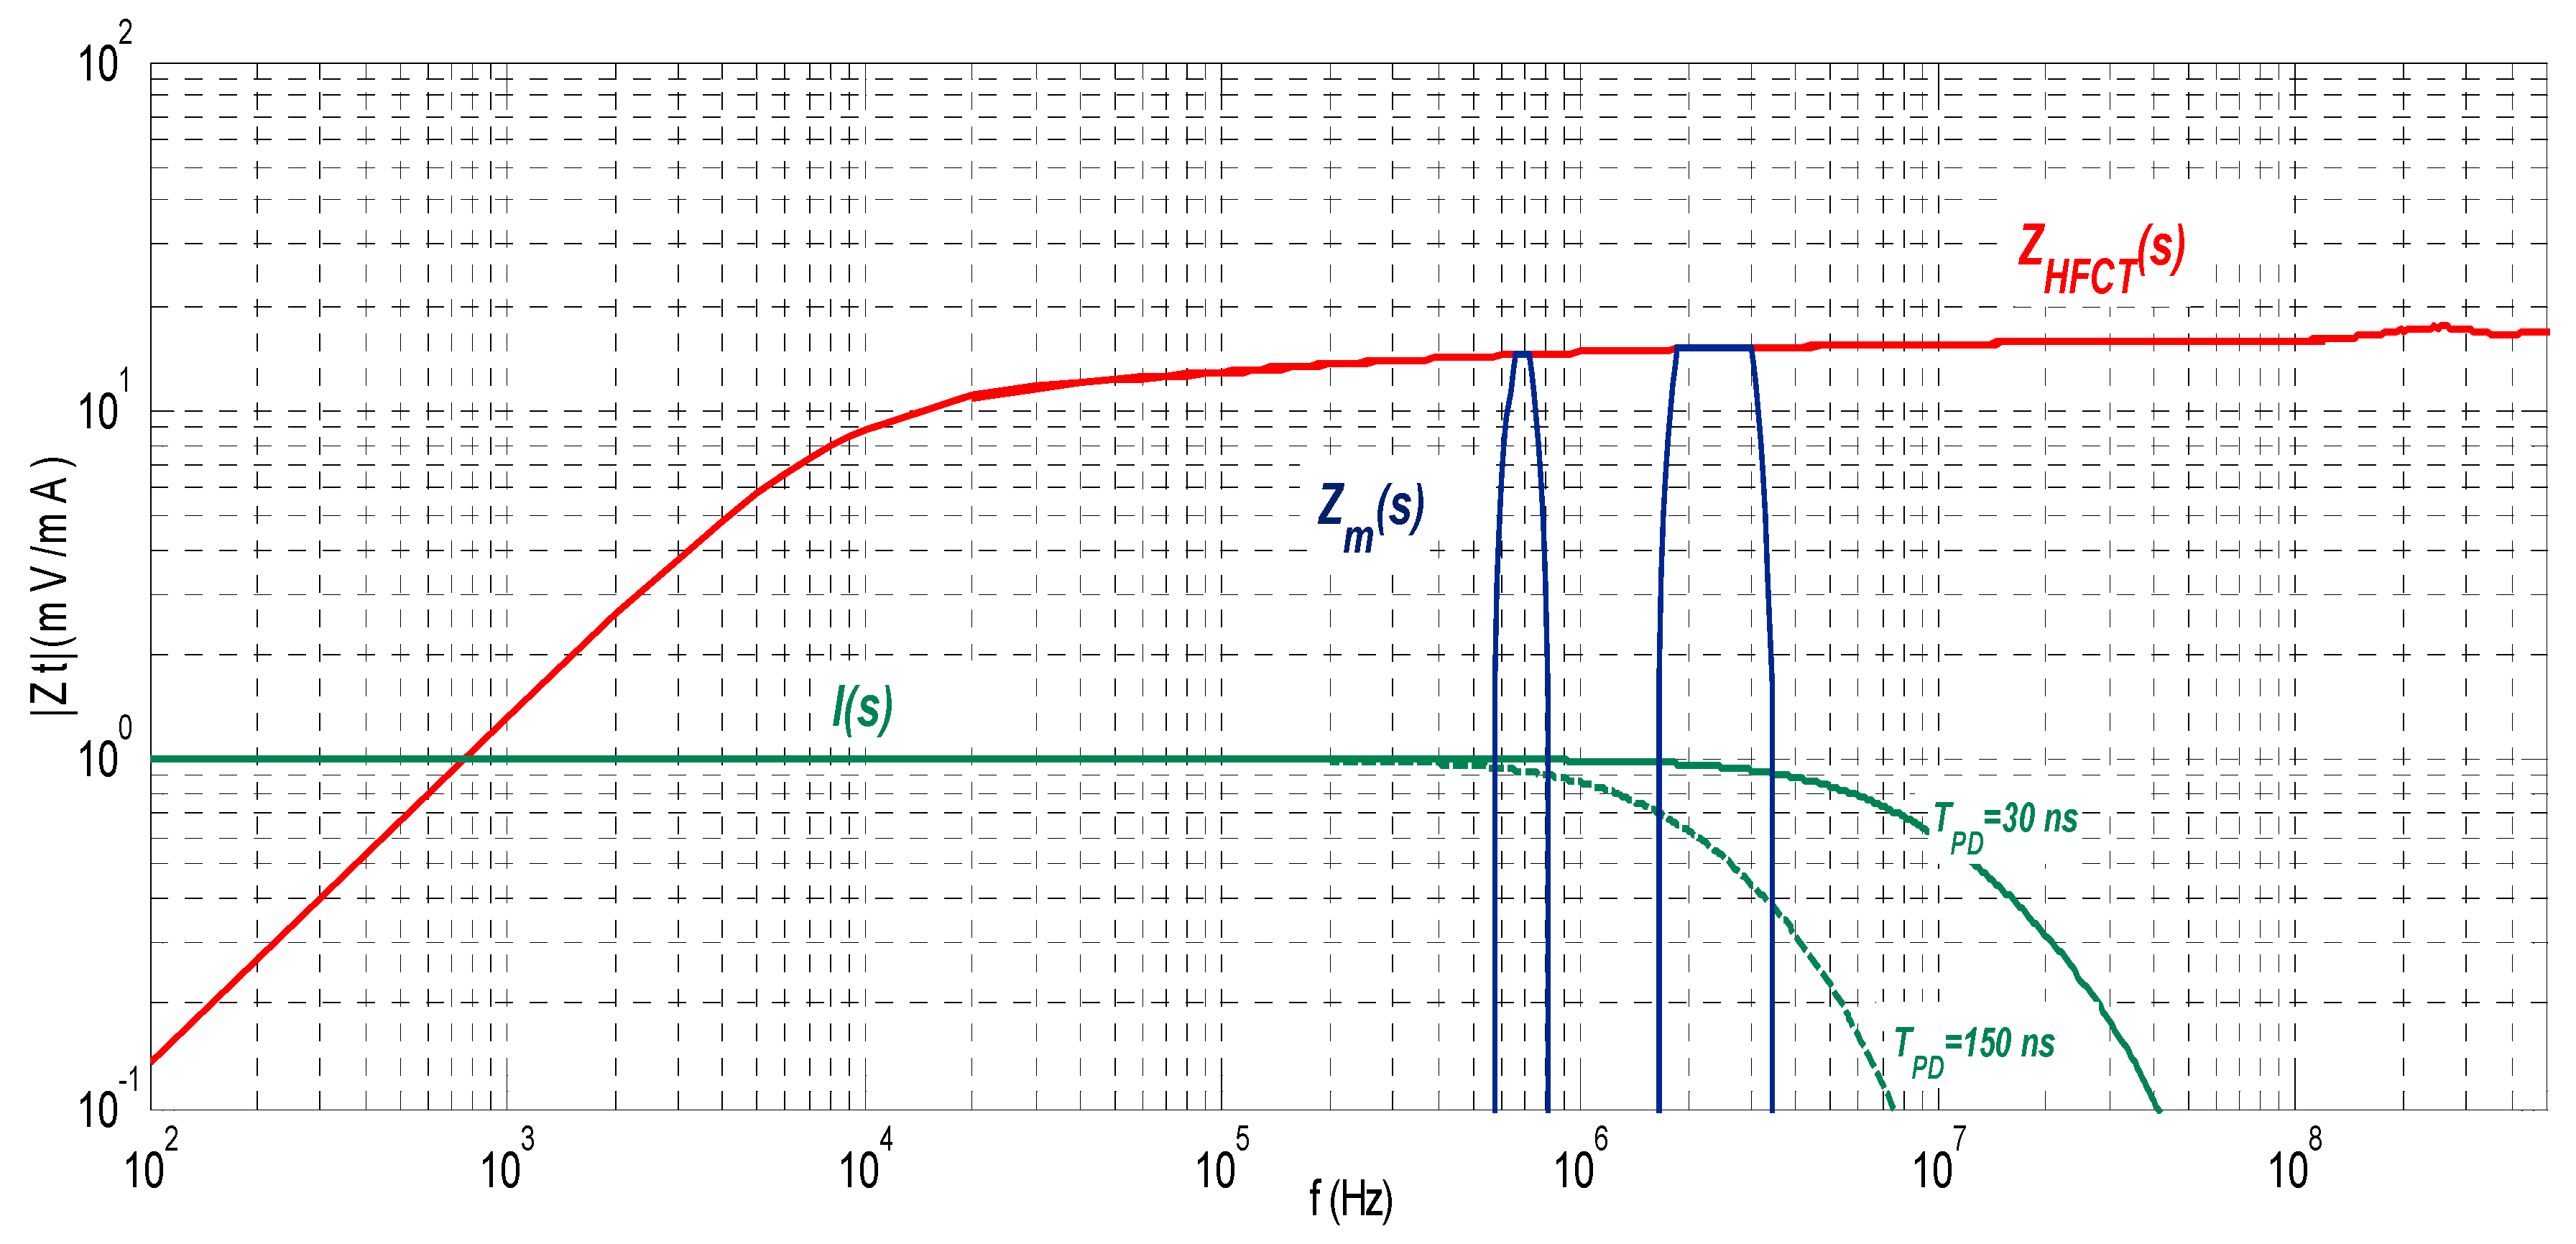
| HFCT bandwidth f1–f2 (MHz) | 0.2–20 | 0.08–61 | 0.004–1.112 | 0.2–20 | |
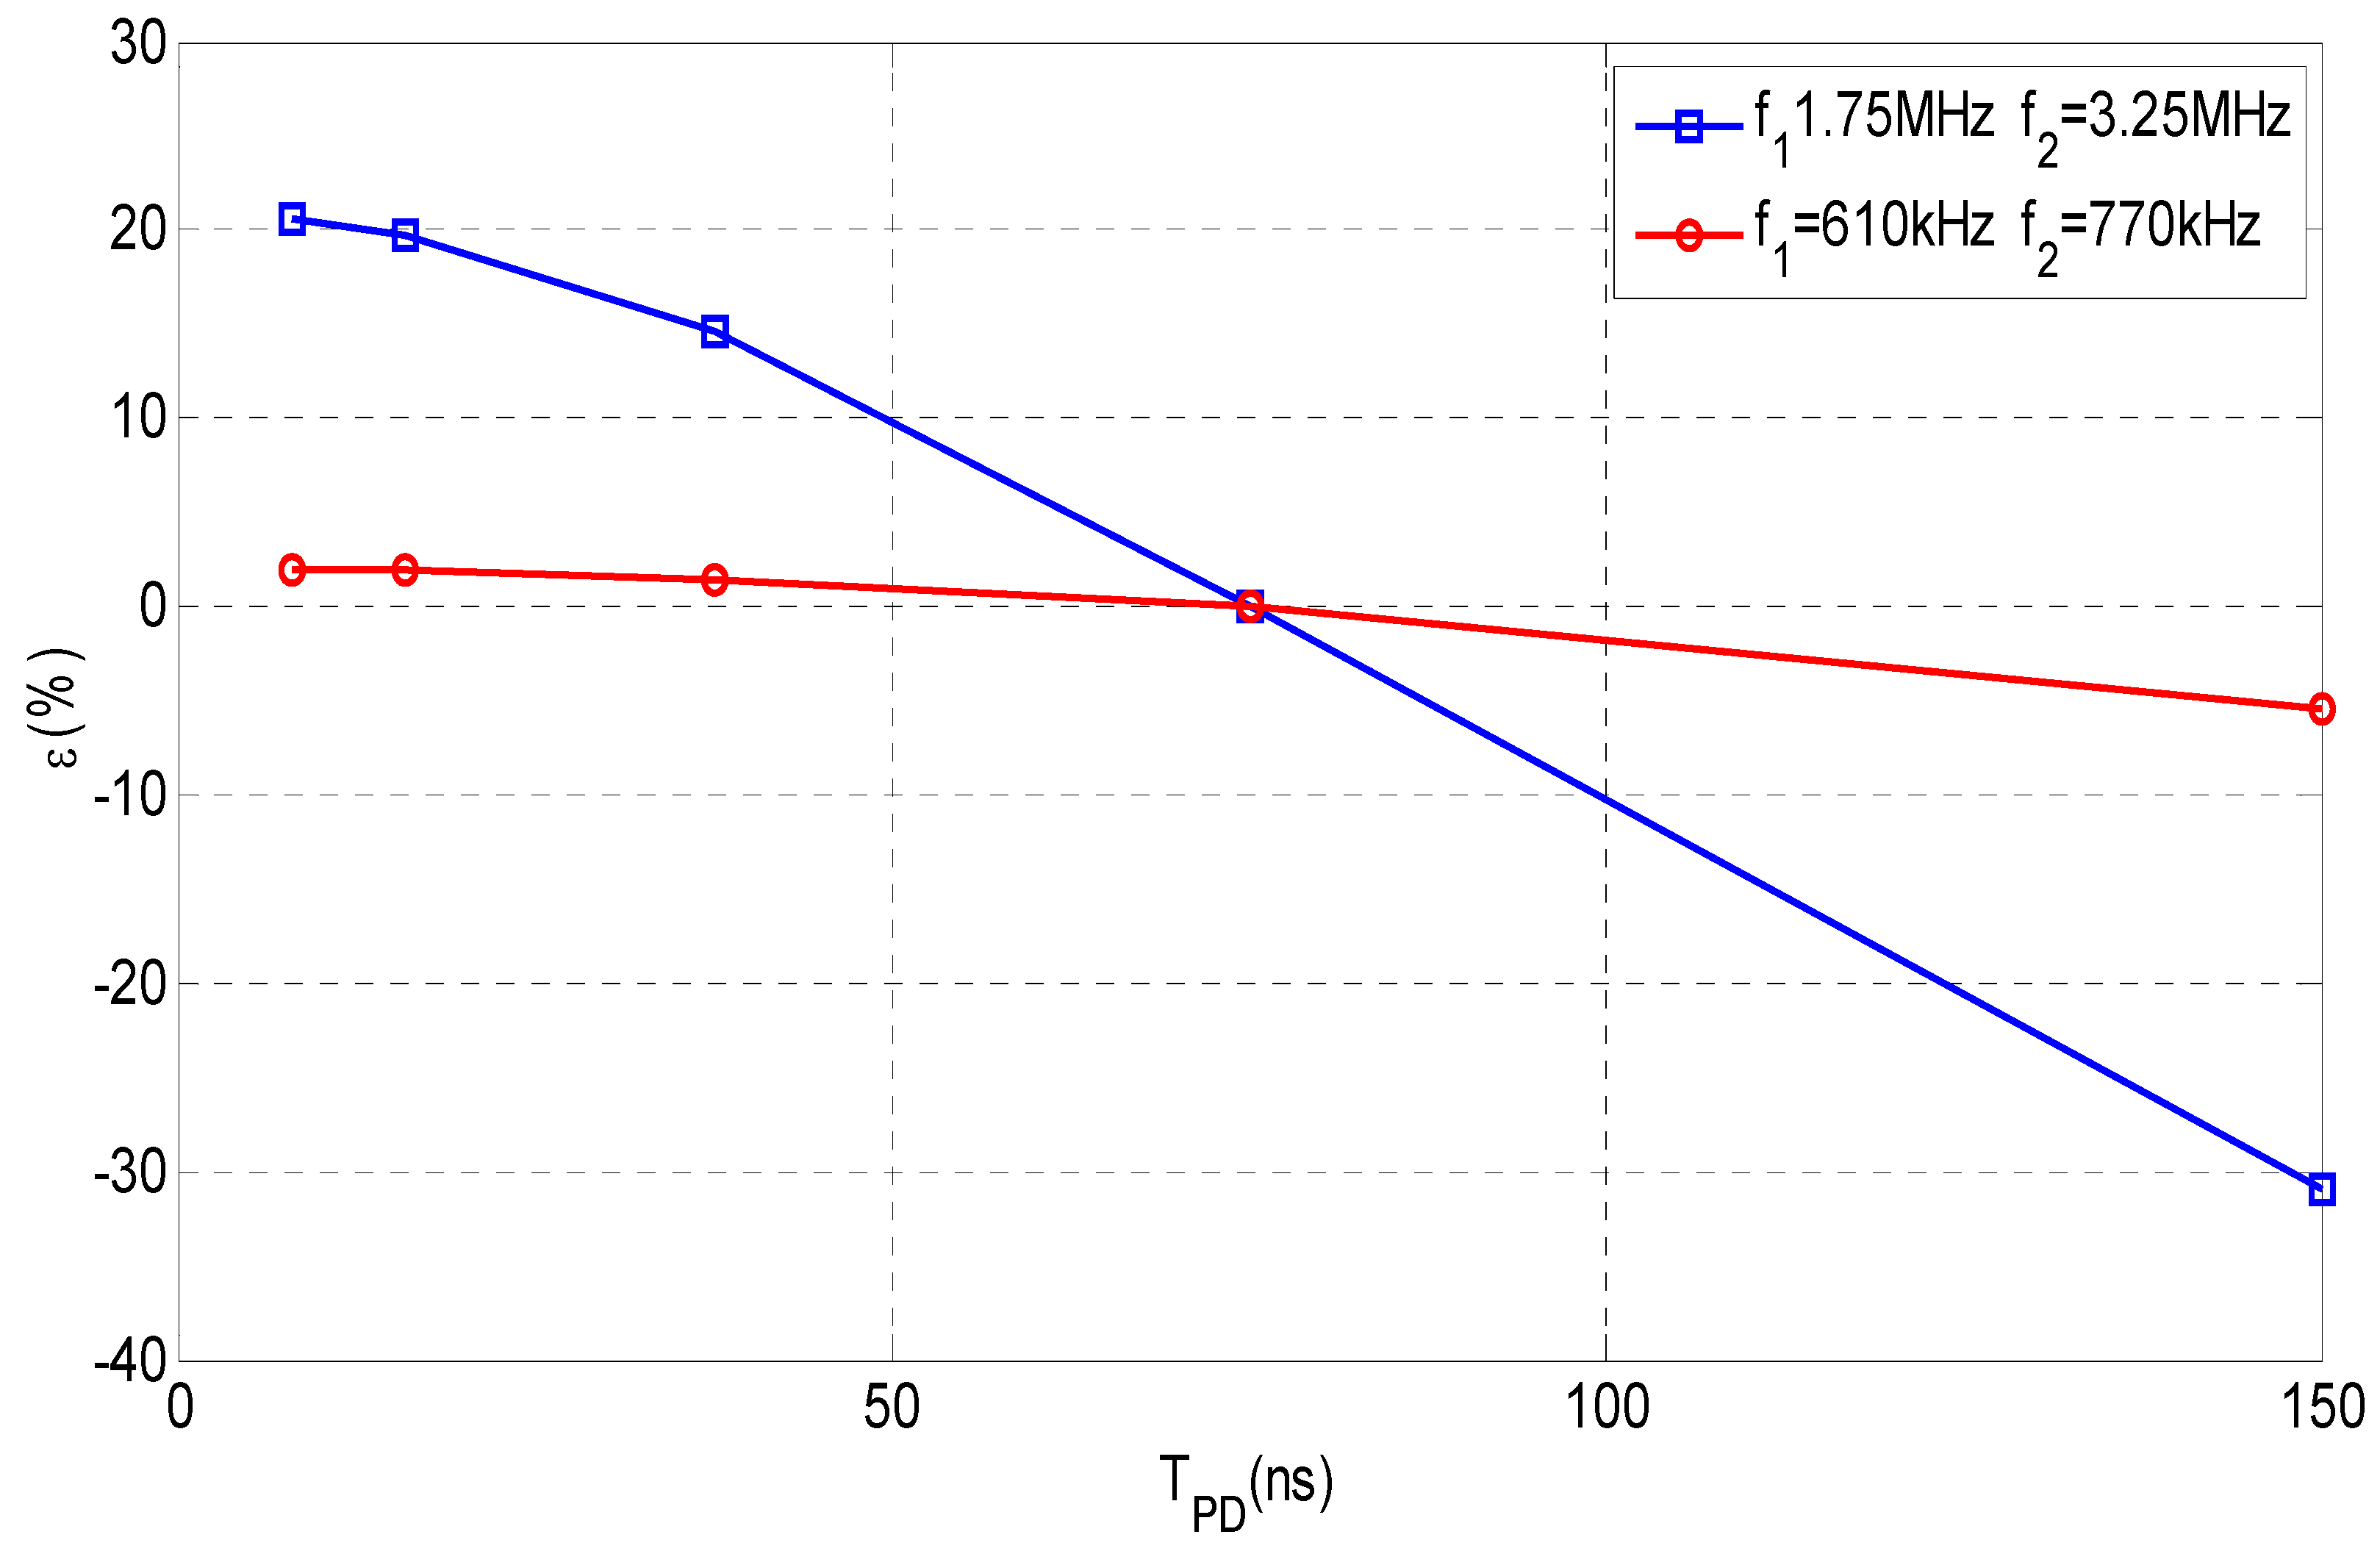
| Charge measurement method f1–f2 (MHz) | Quasi-integration f1 = 1.75, f2 = 3.25 | Applying formula (3) | Integration in time domain | Quasi-integration f1 = 2.45, f2 = 3.95 | |
| Digitiser: Bandwidth (Sampling rate) | 30 MHz (60 MS/s) | 50 MHz (100 MS/s) | 20 MHz (1.25 GS/s) | 50 MHz (100 MS/s) | |
| Filtering method f1–f2 (MHz) | Passband filter Manual selection of f1, f2 and trigger level f1 = 1.75, f2 = 3.25 | 4th-order Passband filter Butterworth f1 = 0.05, f2 = 45 (software) | 8th-order lowpass filter f2 = 20 (hardware) | Passband filter Manual selection of f1, f2 and trigger level f1 = 2.45, f2 = 3.95 | |
| Metrological tests | |||||
| Noise rejection q = 100 pC | Noise amplitude (%) | Charge error and PD repetition rate errors versus noise level Requirements Max |εq| ≤ 30%, Max |εn| ≤ 2% under 200% noise level | |||
| 200 | εq = 8.0% | εq = −0.9% | εq = −36.5% | εq = 16.4% | |
| εn = 0.0% | εn = 0.0% | εn = 0.7% | εn = 0.0% | ||
| 100 | εq = 3.2% | εq = −0.4% | εq = 13.0% | εq = 8.1% | |
| εn = 0.0% | εn = 0.0% | εn = 0.7% | εn = −0.0% | ||
| 50 | εq = −0.9% | εq = −0.2% | εq = 10.4% | εq = 3.3% | |
| εn = 0.0% | εn = 0.0% | εn = 0.7% | εn = −0.0% | ||
| 20 | εq = 0.2% | εq = −0.1% | εq = 1.7% | εq = 1.0% | |
| εn = 0.0% | εn = 0.0% | εn = 0.7% | εn = −0.0% | ||
| Linearity under 35% noise | Charge range (pC) | Linearity error = εl = (Maxεqvalue–Minεqvalue)/2 Requirement εl ≤ 5% under 35% noise level | |||
| 50 to 2.400 | ±0.3% | ±0.6% | ±13.2% | ±3.6% | |
| 10 to 2.400 | ±0.6% | ±12.7% | ±14.0% | ±4.1% | |
| PD time (TPD) under 35% noise q = 200 Pc | TPD range (ns) | = (Maxεqvalue–Minεqvalue)/2 ≤ 30% under 35% noise level | |||
| 37.5–150 | ±25.1% | ±2.0% (*) | ±2.8% | ±25.4% | |
| 8 to 150 | ±29.1% | Not applicable (**) | ±4.0% | ±29.6% | |
| Resolution time under 35% noise q = 200 pC | tres range (μs) | PD repetition rate error Requirement Max |εn| ≤ 2% under 35% noise level, at least 20 μs | |||
| 2.500–10 | 10 μs, εn = −0.4% | 20 μs, εn = 0.0% | 2.5 ms, εn = 0.0% | 10 μs, εn = 0.0% | |
| PD Analyser for Continuous PD Monitoring | PD Analyser B-1 | PD Analyser B-2 | PD Analyser B-3 | PD Analyser C | |
|---|---|---|---|---|---|
| HFCT bandwidth f1–f2 (MHz) | 0.2–20 | 0.08–61 | 0.004–1.100 | 0.2–20 | |
| Charge measurement method f1–f2 (MHz) | Quasi-integration f1 = 1.0, f2 = 4.0 | Applying formula (3) | Integration in time domain | Quasi-integration f1 = 2.45, f2 = 3.95 | |
| Digitiser: Bandwidth (Sampling rate) | 30 MHz (60 MS/s) | 50 MHz (100 MS/s) | 20 MHz (1.25 GS/s) | 50 MHz (100 MS/s) | |
| Filtering method f1–f2 (MHz) | Passband filter Manual selection of f1, f2 and trigger level f1 = 1.75, f2 = 3.25 | 4th-order passband filter Butterworth f1 = 0.05, f2 = 45 (software) | 8th-order lowpass filter f2 = 20 (hardware) | Automatic wavelet filter for recognising PD pulses and pulsating noises | |
| Metrological tests | |||||
| Noise rejection q = 100 pC | Noise amplitude (%) | Charge error and PD repetition rate errors versus noise level Requirements Max |εq| ≤ 30%, Max |εn| ≤ 2% under 200% noise level | |||
| 200 | εq = 4.1% | εq = −0.4% | εq = −40.0% | εq = −11.7% | |
| εn = 0.0% | εn = 0.0% | εn = 0.7% | εn = −0.0% | ||
| 100 | εq = 0.8% | εq = 0.0% | εq = 16.5% | εq = −1.6% | |
| εn = 0.0% | εn = 0.0% | εn = 0.7% | εn = −0.0% | ||
| 50 | εq = −0.1% | εq = 0.1% | εq = 8.7% | εq = 1.7% | |
| εn = 0.0% | εn = 0.0% | εn = 0.0% | εn = −0.0% | ||
| 20 | εq = 0.0% | εq = 0.2% | εq = 3.5% | εq = 1.7% | |
| εn = 0.0% | εn = 0.2% | εn = 0.0% | εn = −0.0% | ||
| Linearity under noise | Charge range q (pC) | Linearity error = εl = (Maxεqvalue–Minεqvalue)/2 Requirement εl ≤ 5% under 10% noise level | |||
| 50 to 2.400 | ±0.1% | ±0.5% | ±2.0% | ±0.2% | |
| 10 to 2.400 | ±0.7% | ±11.0% | ±85.0% | ±0.8% | |
| PD time (TPD) under noise q = 200 pC | TPD range (ns) | = (Maxεqvalue–Minεqvalue)/2 ≤ 30% under 10% noise level | |||
| 37.5 to 150 | ±24.1% | ± 2.1% (*) | ±0.8% | ±25.5% | |
| 8 to 150 | ±28.7% | Not applicable (**) | ±1.5% | ±29.8% | |
| Resolution time under noise q = 200 pC | tresrange (μs) | PD repetition rate error Requirement Max|εn|≤ 2% under 10% noise level, at least 20 μs | |||
| 2.500–10 | 10 μs, εn = 0.0% | 20 μs, εn = 0.0% | 2.5 ms, εn = 0.5% | 10 μs, εn = 0.0% | |
Disclaimer/Publisher’s Note: The statements, opinions and data contained in all publications are solely those of the individual author(s) and contributor(s) and not of MDPI and/or the editor(s). MDPI and/or the editor(s) disclaim responsibility for any injury to people or property resulting from any ideas, methods, instructions or products referred to in the content. |
© 2023 by the authors. Licensee MDPI, Basel, Switzerland. This article is an open access article distributed under the terms and conditions of the Creative Commons Attribution (CC BY) license (https://creativecommons.org/licenses/by/4.0/).
Share and Cite
Garnacho, F.; Álvarez, F.; Elg, A.-P.; Mier, C.; Lahti, K.; Khamlichi, A.; Arcones, E.; Klüss, J.; Rodrigo Mor, A.; Pakonen, P.; et al. Metrological Qualification of PD Analysers for Insulation Diagnosis of HVDC and HVAC Grids. Sensors 2023, 23, 6317. https://doi.org/10.3390/s23146317
Garnacho F, Álvarez F, Elg A-P, Mier C, Lahti K, Khamlichi A, Arcones E, Klüss J, Rodrigo Mor A, Pakonen P, et al. Metrological Qualification of PD Analysers for Insulation Diagnosis of HVDC and HVAC Grids. Sensors. 2023; 23(14):6317. https://doi.org/10.3390/s23146317
Chicago/Turabian StyleGarnacho, Fernando, Fernando Álvarez, Alf-Peter Elg, Christian Mier, Kari Lahti, Abderrahim Khamlichi, Eduardo Arcones, Joni Klüss, Armando Rodrigo Mor, Pertti Pakonen, and et al. 2023. "Metrological Qualification of PD Analysers for Insulation Diagnosis of HVDC and HVAC Grids" Sensors 23, no. 14: 6317. https://doi.org/10.3390/s23146317
APA StyleGarnacho, F., Álvarez, F., Elg, A.-P., Mier, C., Lahti, K., Khamlichi, A., Arcones, E., Klüss, J., Rodrigo Mor, A., Pakonen, P., Vidal, J. R., Camuñas, Á., Rovira, J., Vera, C., & Haider, M. (2023). Metrological Qualification of PD Analysers for Insulation Diagnosis of HVDC and HVAC Grids. Sensors, 23(14), 6317. https://doi.org/10.3390/s23146317