Article

NanoFN10: A High-Contrast Turn-On Fluorescence Nanoprobe for Multiphoton Singlet Oxygen Imaging

by
Renzo P. Zanocco
1,*,
Roger Bresolí-Obach
2,
Francisco Nájera
3,4,
Ezequiel Pérez-Inestrosa
3,4,
Antonio L. Zanocco
1,
Else Lemp
1 and
Santi Nonell
2,*
1
Departamento de Química Orgánica y Fisicoquímica, Facultad de Ciencias Químicas y Farmacéuticas, Universidad de Chile, Santiago 8330015, Chile
2
Institut Químic de Sarrià, Universitat Ramon Llull, Via Augusta 390, 08017 Barcelona, Spain
3
Departamento de Química Orgánica, Universidad de Málaga, Campus Teatinos s/n, 29071 Málaga, Spain
4
Instituto de Investigación Biomédica de Málaga y Plataforma en Nanomedicina—IBIMA, Plataforma Bionand, Parque Tecnológico de Andalucía, 29590 Málaga, Spain
*
Authors to whom correspondence should be addressed.
Sensors 2023, 23(10), 4603; https://doi.org/10.3390/s23104603
Submission received: 8 March 2023 / Revised: 19 April 2023 / Accepted: 6 May 2023 / Published: 9 May 2023
(This article belongs to the Special Issue Colorimetric Sensors: Methods and Applications)

Abstract

:
An “off-on” fluorescent nanoprobe for near-infrared multiphoton imaging of singlet oxygen has been developed. The nanoprobe comprises a naphthoxazole fluorescent unit and a singlet-oxygen-sensitive furan derivative attached to the surface of mesoporous silica nanoparticles. In solution, the fluorescence of the nanoprobe increases upon reaction with singlet oxygen both under one- and multiphoton excitation, with fluorescence enhancements up to 180-fold. The nanoprobe can be readily internalized by macrophage cells and is capable of imaging intracellular singlet oxygen under multiphoton excitation.

1. Introduction

Singlet molecular oxygen (O2(1Δg), hereafter 1O2), the first electronic excited state of the oxygen molecule [1,2], is a highly reactive oxygen species (ROS) capable of oxidizing electron-rich cellular components such as proteins, nucleic acids, and lipid structures [3]. 1O2 plays a key role in a wide variety of chemical and biological processes, e.g., in organic synthesis [4], photodynamic therapy of cancer [5], the eradication of pathogenic microorganisms [6], cell signaling [7], or plant defense [8].
Notwithstanding its relevance, only a few techniques are available for monitoring 1O2 in biological media [2]. The preferred one is the optical detection of its near-infrared phosphorescence (NIR) at 1270 nm, which is selective, non-invasive, and robust [9,10]. Nonetheless, the detection of NIR phosphorescence requires sophisticated equipment available only in a few specialized laboratories [11]. In addition, the 1O2 phosphorescence quantum yield is exceedingly low in water (<1 × 10⁶, meaning that only one in a million 1O2 molecules decays by emitting a photon) and even lower in biological media due to the action of 1O2 quenchers. Hence, the detection of this reduced number of photons poses severe technical challenges. Not surprisingly, alternative, simpler, yet indirect detection methods have been developed based on probes that react selectively with 1O2 [12,13,14].
Among them, fluorescent probes are attractive tools for the detection of 1O2 in biological media due to their high sensitivity and fast response, together with the widespread adoption of fluorescence microscopy and imaging techniques [15,16,17,18]. The most popular fluorescence probes use anthracenes to trap 1O2, e.g., anthracene dipropionic or dimalonic acids (ADPA and ADMA, respectively) [19] or Singlet Oxygen Sensor Green (SOSG) [20]. Anthracenes react with 1O2, forming endoperoxides and losing their native fluorescence as a result. ADPA and ADMA are thus turn-off probes. In contrast, SOSG, composed of an anthracene bound to a fluorescein-like fluorophore, is a turn-on probe whose fluorescence (due to fluorescein) is quenched by the intact anthracene moiety in its native state. Oxidation of anthracene by 1O2 leads to fluorescence enhancements up to 10-fold [15]. A negative effect of the presence of anthracenes in both probes is their non-negligible ability to self-photosensitize the production of 1O2, which may lead to false positives if appropriate control experiments are not employed [21]. In addition, molecular probes readily form complexes with proteins, which inhibit their internalization by cells and lead to strong fluorescence enhancements. This decreases the contrast between the native and oxidized forms, hampering the ability to detect 1O2 [22,23]. We have recently shown that conjugation of ADPA and SOSG to nanoparticles minimizes binding to proteins, thereby allowing the detection of 1O2 in bacteria [24] and in eukaryotic cells [25]. Moreover, we have recently described a new class of 1O2 fluorescent molecular probes, the furyl naphthoxazoles (FNs), which achieve fluorescence enhancements up to 300-fold owing to a change in absorption and fluorescence spectrum upon reaction with 1O2 [26]. In this work, we have combined the two approaches to develop a furyl-naphthoxazole nanoprobe (termed NanoFN10) that brings together the high contrast of FN probes and the advantages of the nano approach to improve the detection of 1O2 in biological media.

2. Materials and Methods

2.1. General Materials

The following were purchased from Sigma-Aldrich (St. Louis, MO, USA) and used as received: 2-Methylnaphthoxazole, 5-(hydroxymethyl)furan-2-carbaldehyde, new methylene blue (NMB), rose bengal (RB), tetraethyl orthosilicate (TEOS), cetyltrimethylammonium chloride solution (25 wt % in H2O; CTAC), 3-(triethoxysilyl)propyl isocyanate, (3-iodopropyl)trimethoxysilane, 4,7,10-trioxa-1,13-tridecanediamine (PEG-diamino linker), succinic anhydride, N-(3-dimethylaminopropyl)-N′-ethylcarbodiimide hydrochloride (EDC), N-hydroxysuccinimide (NHS), 4-(dimethylamino)pyridine (DMAP), Dubelcco’s phosphate-buffered saline (PBS), quinine sulfate (QS), 9,10-dimethyl anthracene (DMA), dimethyl sulfoxide (DMSO), phenalenone (PN), potassium superoxide (potassium dioxide, KO2), and hydrogen peroxide (H2O2). Absolute ethanol (EtOH), benzene, acetonitrile (ACN), dimethylformamide (DMF), ammonia solution (NH3 30 wt % in H2O), dichloromethane (DCM), hydrochloric acid solution (HCl 37 wt % in H2O), glacial acetic acid (AcOH), potassium hydroxide (KOH), and methanol (MeOH) were supplied by Panreac (Barcelona, Spain). Roswell Park Memorial Institute (RPMI) 1640 medium, fetal bovine serum, penicillin, streptomycin, and gentamicin were purchased from Life Technologies, Invitrogen, (Carlsbad, CA, USA).

2.2. General Synthetic Remarks

All reactions were monitored by TLC analysis using POLYGRAM® SIL G/UV254 pre-coated polyester sheets (0.2-mm thickness) (Machery-Nagel, Düren, Germany).
NMR spectra were recorded at room temperature on a Varian Mercury 400 (1H at 400 MHz and 13C at 100.6 MHz; Palo Alto, CA, USA) spectrometer. The chemical shifts (δ) are reported in parts per million (ppm) relative to the solvent signal, and coupling constants (J) are reported in Hertz (Hz). The following abbreviations are used to define the multiplicities in 1H NMR spectra: s = singlet, d = doublet, t = triplet, q = quartet, dt = doublet of triplets, ddd = doublet of doublet of doublets, m = multiplet, or combinations of these descriptive names.
Infrared spectra were recorded in a Nicolet Magna 560 FTIR (Madison, WI, USA) spectrophotometer supported on a potassium bromide disk. Values are reported in wave numbers (cm−1).
Mass spectrometry (MS) for reported compounds was conducted on an Agilent Technologies 5975 mass spectrometer (Santa Clara, CA, USA) operating in electron ionization (EI) mode at 70-eV and 4-kV accelerating potential.

2.3. Synthesis of FN10 [(E)-(5-(2-(Naphtho[1,2-d]oxazol-2-yl)vinyl)furan-2-yl)methanol]

To a mixture of 2-methylnaphthoxazole (1.1 mmol, 170 μL) and 5-(hydroxymethyl)furan-2-carbaldehyde (1.0 mmol, 100 μL) in 2 mL of dimethyl sulfoxide, 62 μL of aqueous KOH 50% was added. The mixture was stirred for 1 h at room temperature protected from light. The addition of 10 mL of water afforded a yellow precipitate, which was washed with 50 mL of cold water and 80 mL of cold methanol. Recrystallization from acetonitrile afforded 131 mg of the yellow product (FN10), yield 45%. 1H-NMR (400 MHz, DMSO-d6): 8.36 (d, 1H, J = 8.5 Hz, Ar-H8), 8.09 (d, 1H, J = 8.0 Hz, Ar-H5), 7.93 (d, 1H, J = 9.0 Hz, Ar-H3), 7.89 (d, 1H, J = 9.0 Hz, Ar-H4), 7.69 (dt, 1H, J = 8.0; 7.0 Hz, Ar-H7), 7.62 (d, 1H, J = 16.0 Hz, Vi-Ha), 7.58 (dt, 1H, J = 8.0; 7.0 Hz, Ar-H6), 6.92 (d, 1H, J = 15.0 Hz, Vi-Hb), 6.89 (d, 1H, J = 3.5 Hz, Fu-Hc), 6.47 (d, 1H, J = 3.5 Hz, Fu-Hd), 4.47 (s, 2H, -CH2-), 3.52 (s, 1H, -OH). 13C-NMR (100 MHz, DMSO-d6): 162.2, 158.6, 150.7, 147.7, 137.5, 131.3, 129.3, 127.7, 126.7, 126.0, 126.0, 125.9, 122.0, 115.9, 111.4, 110.4, 110.3, 56.3. IR (KBr) υ (cm−1): 3293, 3062, 2922, 1633, 1372, 1018, 950. MS: calculated: 292.09 Da; experimental: 292.12 Da.

2.4. Isolation and Identification of the FN10 Oxidation Product (FN10-ox)

Fifty mg of FN10 was dissolved in 30 mL of methanol. Afterward, 50 mL of a methanolic new methylene blue solution (3.1 mM) was added and irradiated with red light (660 ± 10 nm; M660L4, Thorlabs, Newton, NJ, USA) for 24 h. The photoproduct was purified by silica flash chromatography (ethyl acetate/hexane 1:10 as mobile phase). 1H-NMR (300 MHz, DMSO-d6): 8.37 (d, 1H, J = 8.0 Hz, Ar-H9), 8.11 (d, 1H, J = 8.0 Hz, Ar-H12), 7.97 (d, 1H, J = 9.0 Hz, Ar-H8), 7.90 (d, 1H, J = 9.0 Hz, Ar-H7), 7.81 (d, 1H, J = 5.5 Hz, Vi-H3), 7.71 (ddd, 1H, J = 8.0; 6.0; 1.0 Hz, Ar-H10), 7.61 (ddd, 1H, J = 8.0; 5.5; 1.0 Hz, Ar-H11), 6.98 (d, 1H, J = 17.5 Hz, Vi-H5), 6.60 (d, 1H, J = 5.5 Hz, Vi-H4), 6.26 (d, 1H, J = 17.5 Hz, Ar-H5), 3.76 (m, 2H, OC-H2), 3.35 (s, 3H, OC-H1); 13C-NMR (100 MHz, CDCl3): 189.0, 152.7, 128.7, 128.6, 128.0, 127.6, 127.4, 127.3, 125.9, 125.7, 123.8, 122.2, 122.0, 120.5, 110.6, 107.3, 103.7, 60.7, 15.2. IR (KBr) υ (cm−1); 3334, 3067, 2925, 1773, 1622, 1445, 1083. MS: calculated: 322.10 Da; experimental: 322.20 Da.

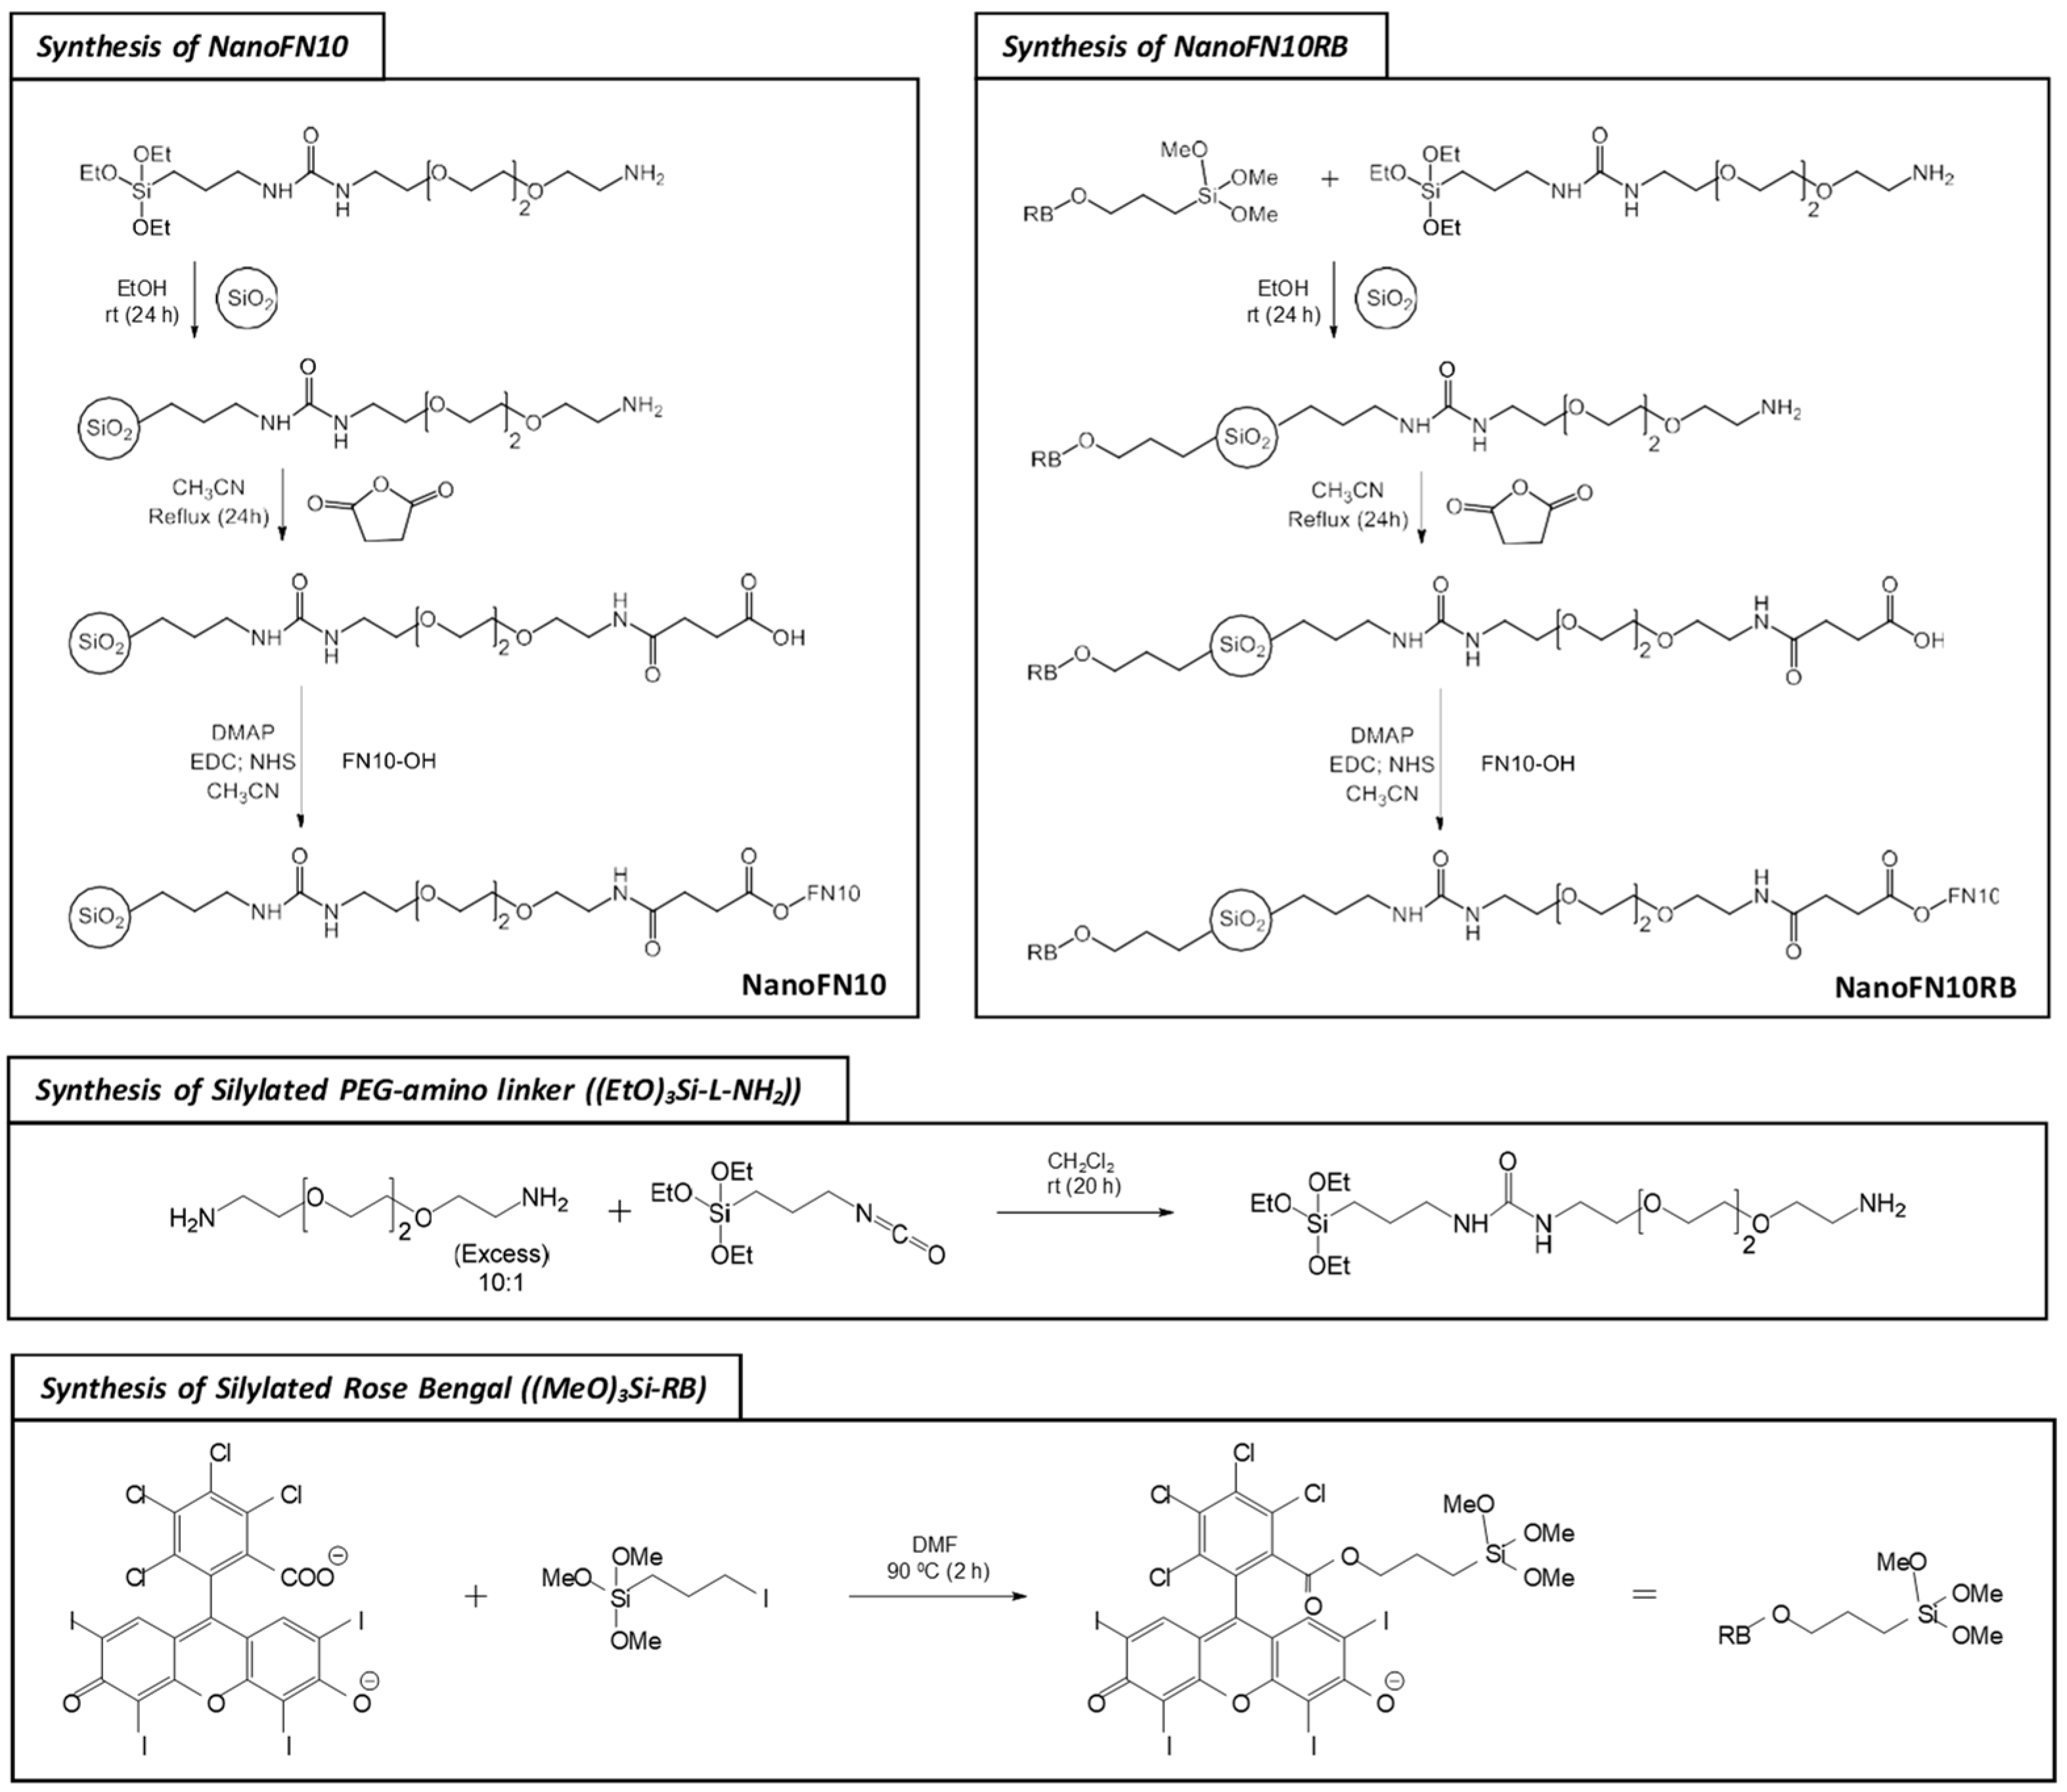
2.5. Synthesis of the Silylated PEG-Amino Linker [(EtO)3Si-L-NH2)]

N-(4,7,10-trioxa-13-tridecaneamine)-N’(3-triethoxysilyl)propyl-urea was synthesized as described previously [25].

2.6. Synthesis of Silylated Rose Bengal [(MeO)3Si-RB: 2,4,5,7-Tetraiodo-3-oxo-9-(2,3,4,5-tetrachloro-6-((3-(trimethoxysilyl)-propoxy)-carbonyl)-phenyl)-3H-xanthen-6-olate]

Rose bengal (51 mg, 53 μmol) was added to a solution of (3-iodopropyl)trimethoxysilane (30 μL, 153 μmol) in 1 mL of DMF anhydrous. The solution was stirred for 2 h at 90 °C. Afterward, the crude was used without further purification.

2.7. Synthesis of Mesoporous Silica Nanoparticles (MSNP)

MSNPs were synthesized as described previously [25,27] and stored suspended in absolute EtOH (10 mg/mL).

2.8. Grafting of Rose Bengal onto Mesoporous Silica Nanoparticles (MSNP-RB)

One mL of the (MeO)3Si-RB solution was added to 12 mL of MSNP solution (33 mg/mL). The solution was left stirring at room temperature for 24 h. Afterward, the MSNP-RB was recovered by centrifugation (15,000× g; 20 min). The MSNP was washed with EtOH. This procedure was repeated several times until no color was observed in the supernatant. The final MSNP-RB nanoparticles were stored suspended in absolute EtOH (10 mg/mL).

2.9. Grafting of the Sylilated PEG-Amino Linker onto Mesoporous Silica Nanoparticles

Two hundred mg of (EtO)3Si-L-NH2 (430 μmols) were added to 12 mL of MSNP or MSNP-RB suspension (33 mg/mL) and left stirring at room temperature for 24 h. Afterward, the nanoparticles were recovered by centrifugation (15,000× g; 20 min). The nanoparticles were washed twice with ethanol and once with ACN. The final MSNP-L-NH2 or RB-MSNP-L-NH2 nanoparticles were stored suspended in ACN (10 mg/mL).

2.10. Grafting of Carboxylic-Acid Groups on the MSNP-L-NH-CO-CH2-CH2-COOH and RB-MSNP-L-NH-CO-CH2-CH2-COOH Nanoparticles

One hundred mg of succinic anhydride (1 mmol) was added to 12 mL of MSNP-L-NH2 or RB-MSNP-L-NH2 suspension (33 mg/mL). The suspensions were left stirring at room temperature for 24 h. Afterward, the nanoparticles were recovered by centrifugation (15,000× g; 20 min) and washed thrice with ACN. The final MSNP-L-NH-CO-CH2-CH2-COOH or RB-MSNP-L-NH-CO-CH2-CH2-COOH nanoparticles were stored suspended in ACN (10 mg/mL).

2.11. Synthesis of NanoFN10 [MSNP-L-NH-CO-CH2-CH2-CO-O-FN10] and NanoFN10RB [MSNP-L-NH-CO-CH2-CH2-CO-O-FN10]

Three hundred and fifty mg (2.3 mmol) of EDC, 350 mg of NHS (3.3 mmol), and 300 mg (2.5 mmol) of DMAP were directly dissolved into 12 mL of a suspension of MSNP-L-NH-CO-CH2-CH2-COOH or RB-MSNP-L-NH-CO-CH2-CH2-COOH nanoparticles (ACN, 33 mg/mL). The suspension was left stirring at room temperature for 2 h. Then, 100 mg of FN10 was added and left stirring for an additional 72 h. Afterward, the nanoparticles were recovered by centrifugation (15,000× g; 20 min) and washed twice with ACN and twice with MeOH. The final nanoFN10 and nanoFN10RB nanoparticles were stored suspended in MeOH (5 mg/mL).

2.12. Determination of the Hydrodynamic Size, ζ-Potential, and Organic Elemental Analysis of the Synthesized Nanoparticles

Hydrodynamic size and ζ-potential of the synthesized (MSNPs) were measured using a Nano-ZS Zetasizer (Malvern Instruments Ltd., Worcestershire, UK). For hydrodynamic size, a diluted aliquot in EtOH was measured. For ζ-potential examination, a diluted aliquot in milli-Q water was measured.

2.13. One-Photon Spectroscopy

Absorption spectra were recorded on a Cary 6000i spectrophotometer (Varian, Palo Alto, CA, USA) and a Perkin Elmer Lambda 2B spectrophotometer (Norwalk, CT, USA). Fluorescence emission spectra were recorded using a Spex Fluoromax-4 spectrofluorometer (Horiba Jobin-Ybon, Edison, NJ, USA) and an Optical Building Blocks Quatro III spectrofluorometer (Birmingham, NY, USA).
Time-resolved near-infrared phosphorescence experiments were carried out using a customized Fluotime 200 fluorescence lifetime system (PicoQuant GmbH, Berlin, Germany). Briefly, a diode-pumped Nd:YAG laser (FTSS355-Q, Crystal Laser, Berlin, Germany) was used for excitation at 355 or 532 nm (10 kHz, 0.5 or 1.2 μJ per pulse, respectively). A 1064-nm rugate notch filter (Edmund Optics Ltd., Barrington, NJ, USA) was placed at the exit port of the laser to remove any residual component of its fundamental emission in the NIR region. The luminescence exiting from the side of the sample was filtered by one long-pass filter of 1000 nm to remove any scattered laser radiation and isolate the NIR emission. Additional narrow bandpass filters at 1270, 1220, or 1110 nm were used to select a particular near-infrared region. A TE-cooled Hamamatsu NIR sensitive photomultiplier tube assembly (H9170-45, Hamamatsu Photonics, Hamamatsu City, Japan) was used as the detector. Photon counting was achieved with a multichannel scaler (PicoQuant’s NanoHarp 250; PicoQuant GmbH, Berlin, Germany).

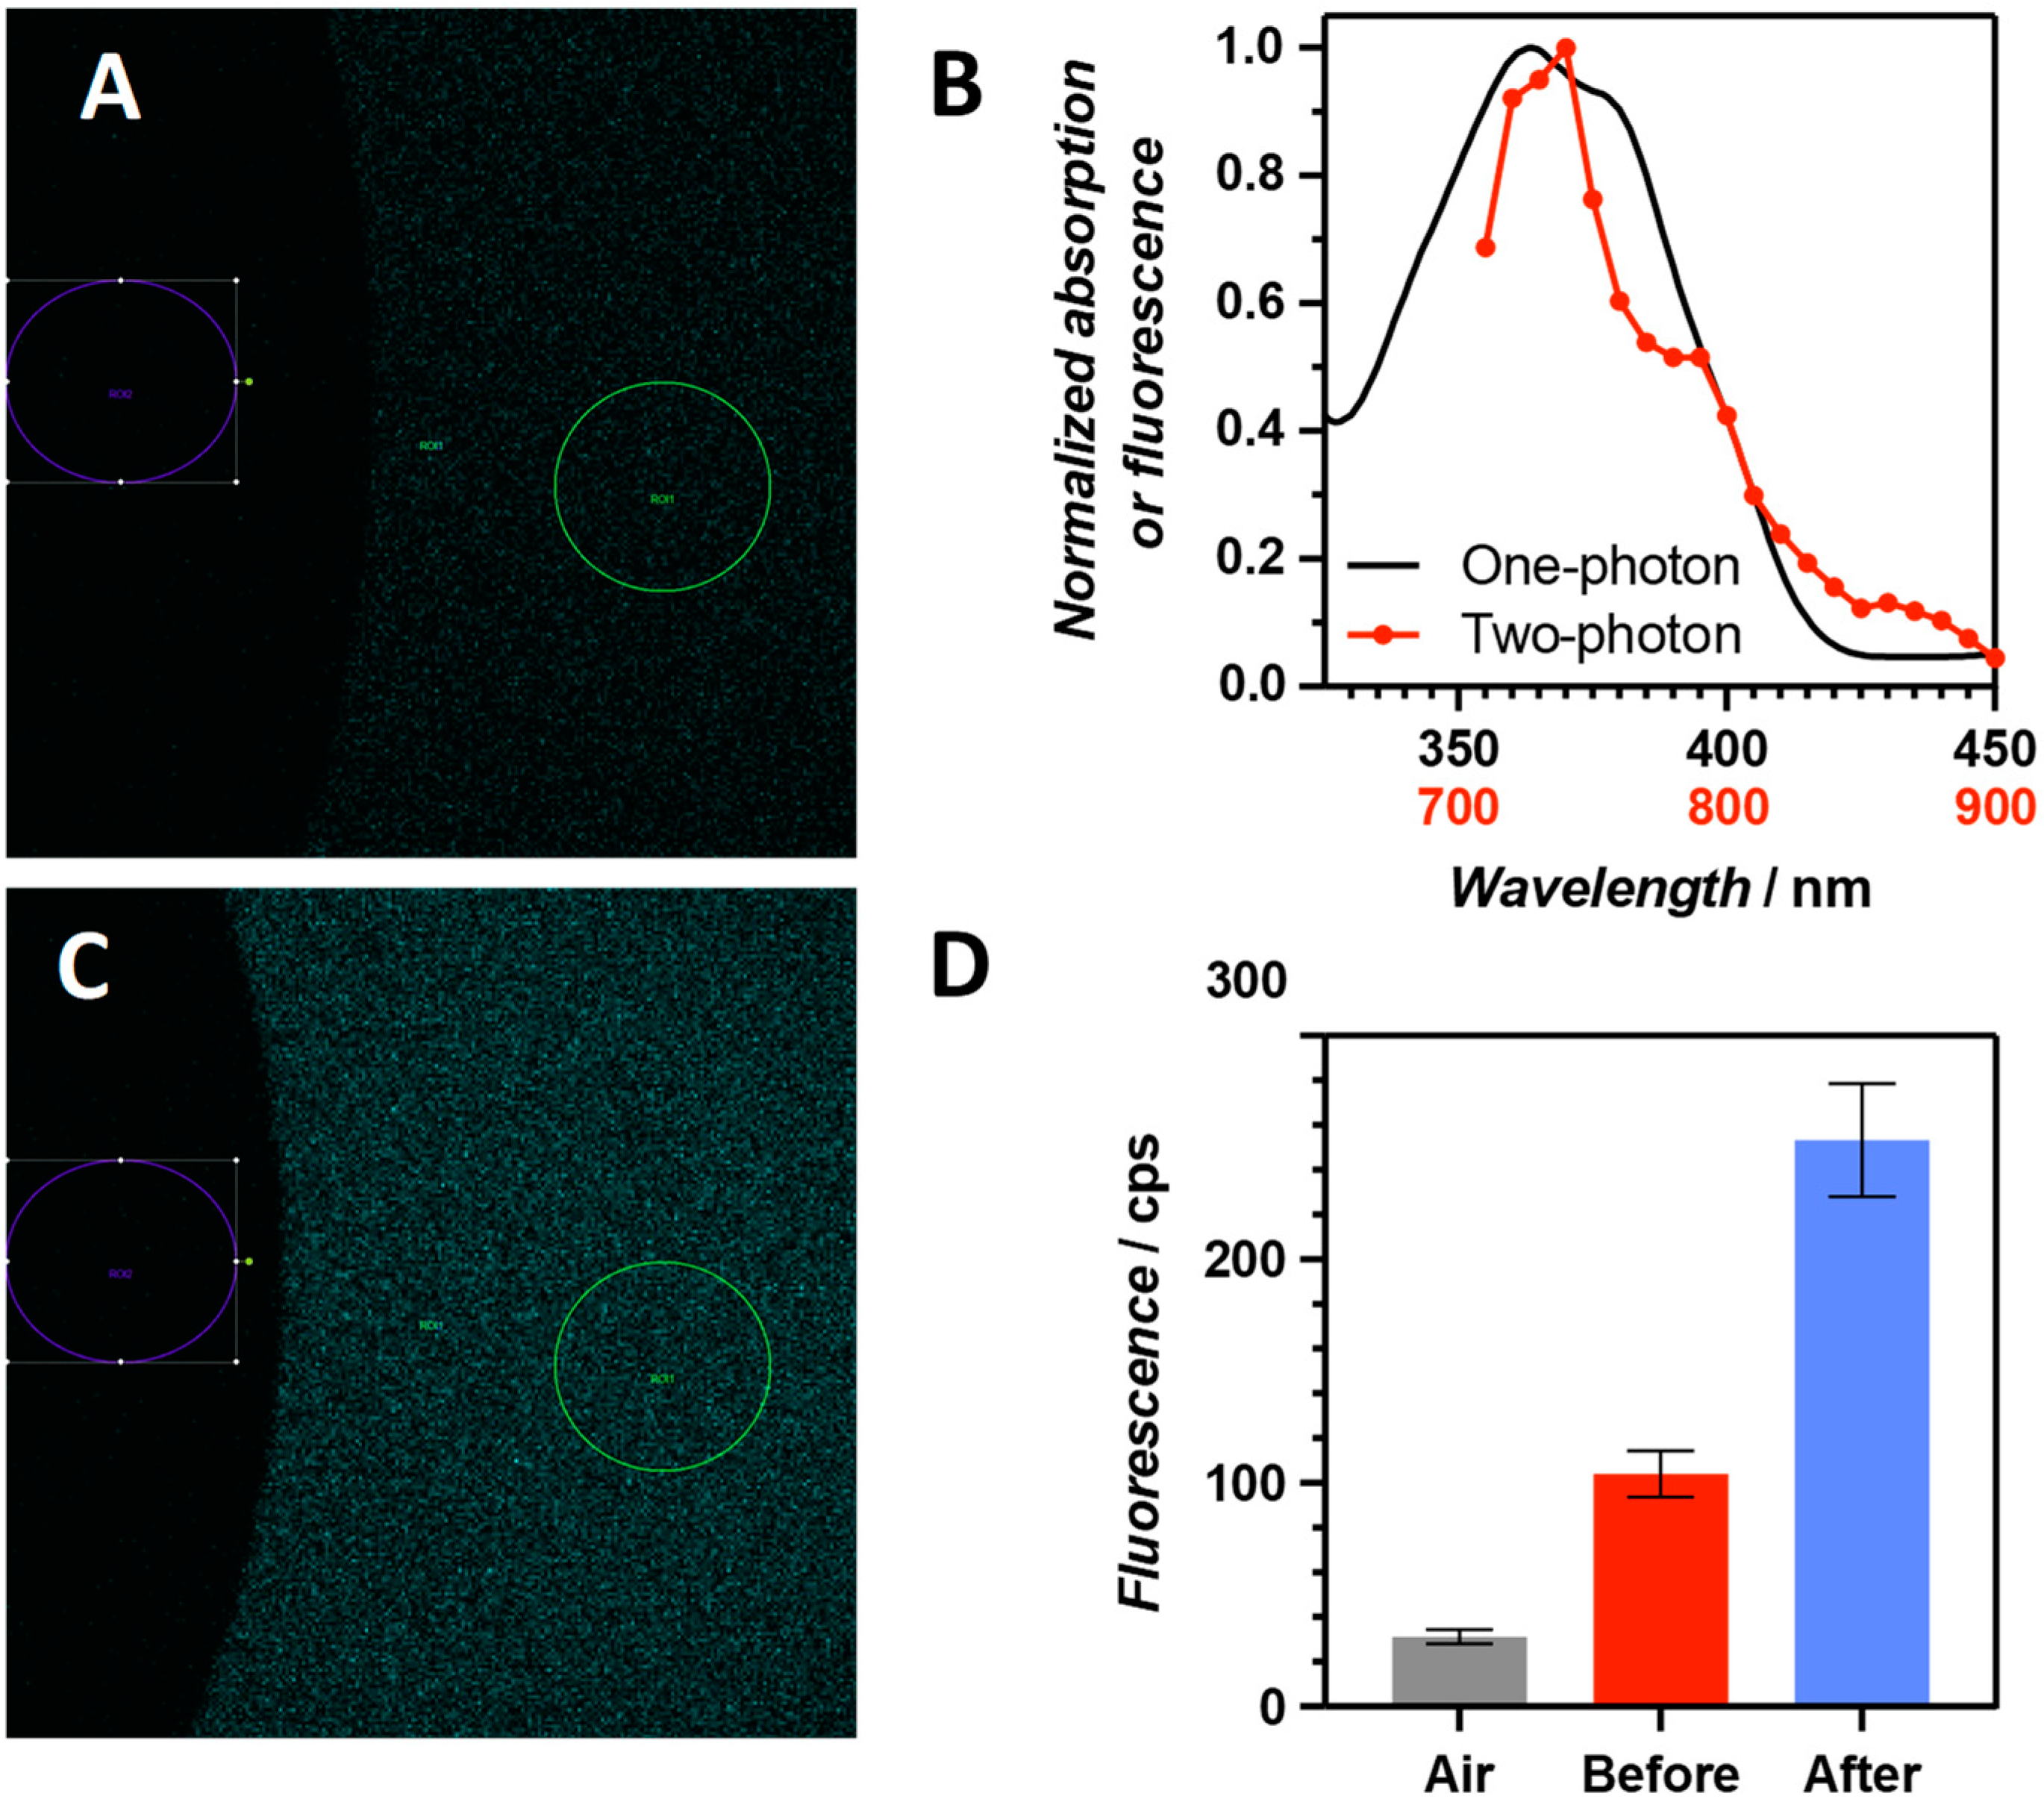
2.14. Two-Photon Spectroscopy

FN10 was analyzed using a Leica SP5 MP scanning confocal/multiphoton system with a Leica (Wetzler, Germany) DM6000 inverted microscope and 10× HCX PL APO CS 10× 0.40 NA dry objective lens with the Spectra Physics Ti:Saphire MaiTai HP tunable IR pulsed laser (MKS Instruments, Andover, MA, USA) as the light source. Samples were loaded into thin quartz cuvettes and positioned to focus on the air–solvent interface. Focusing at this interface provides a negative control for non-specific reflections and background noise. FN10 was characterized by using excitation and emission scans acquired using the Leica LAS AF software suite.
Excitation scans were performed using a fixed emission detection window (330–550 nm) and variable multiphoton excitation (700–1040 nm in 10 nm intervals). Average intensity was measured in regions of interest (ROIs) positioned in sample and air regions of each assay image. FN10 was photooxidized by adding MSNP-RB and irradiating with green light. After the irradiation, MSNP-RB was removed by centrifugation (15,000× g; 10 min).

2.15. Cell Culture

N13 microglia adherent cells were grown to 60% confluence in a Labtek 8 well-chambered slide in standard culture medium (RPMI media with 10% Fetal Bovine Serum, 1% Pen/Strep 10,000 units/mL, 1% Gentamicin) and under standard conditions (37 °C and 5% CO2 in a humidified incubator) and incubated nanoFN10RB for 24 h. Cells were washed three times with fresh culture medium to remove nanoFN10RB in the remaining medium before transfer to the microscope.

2.16. Microscopy Analysis

Multiphoton experiments employed a Leica SP5 MP scanning confocal/multiphoton system using a Leica DM6000 inverted microscope and HCX IRAPO L x25.0 NA0.95 WATER objective lens with Spectra Physics MaiTai HP tunable IR-pulsed and 561-nm CW lasers as light sources. N13 microglia cells within the chambered slide were maintained under optimal conditions (37 °C and 5% CO2 in a semi-closed, humidified microscope incubator) throughout the experiment.
Experiments were performed using a sequential time-lapse mode at a single focal plane. Samples were alternately measured for fluorescence using the multiphoton laser tuned to 720 nm (1% power with 3 accumulations) and a 413–532-nm detection window, and then activated by scanning the sample a total of 50 times using the 561-nm laser with the transmission set to between 0% and 8% maximum power. Each complete cycle of detection and activation was completed in 27 s and immediately followed by the next cycle. Conditions were chosen to allow photooxidized molecules to be detected while minimizing the photobleaching effect of the multiphoton laser and maximizing the 1O2 generation. All photographs were processed and analyzed using the Fiji J software (Adobe Systems, San Jose, CA, USA) [28,29].

3. Results and Discussion

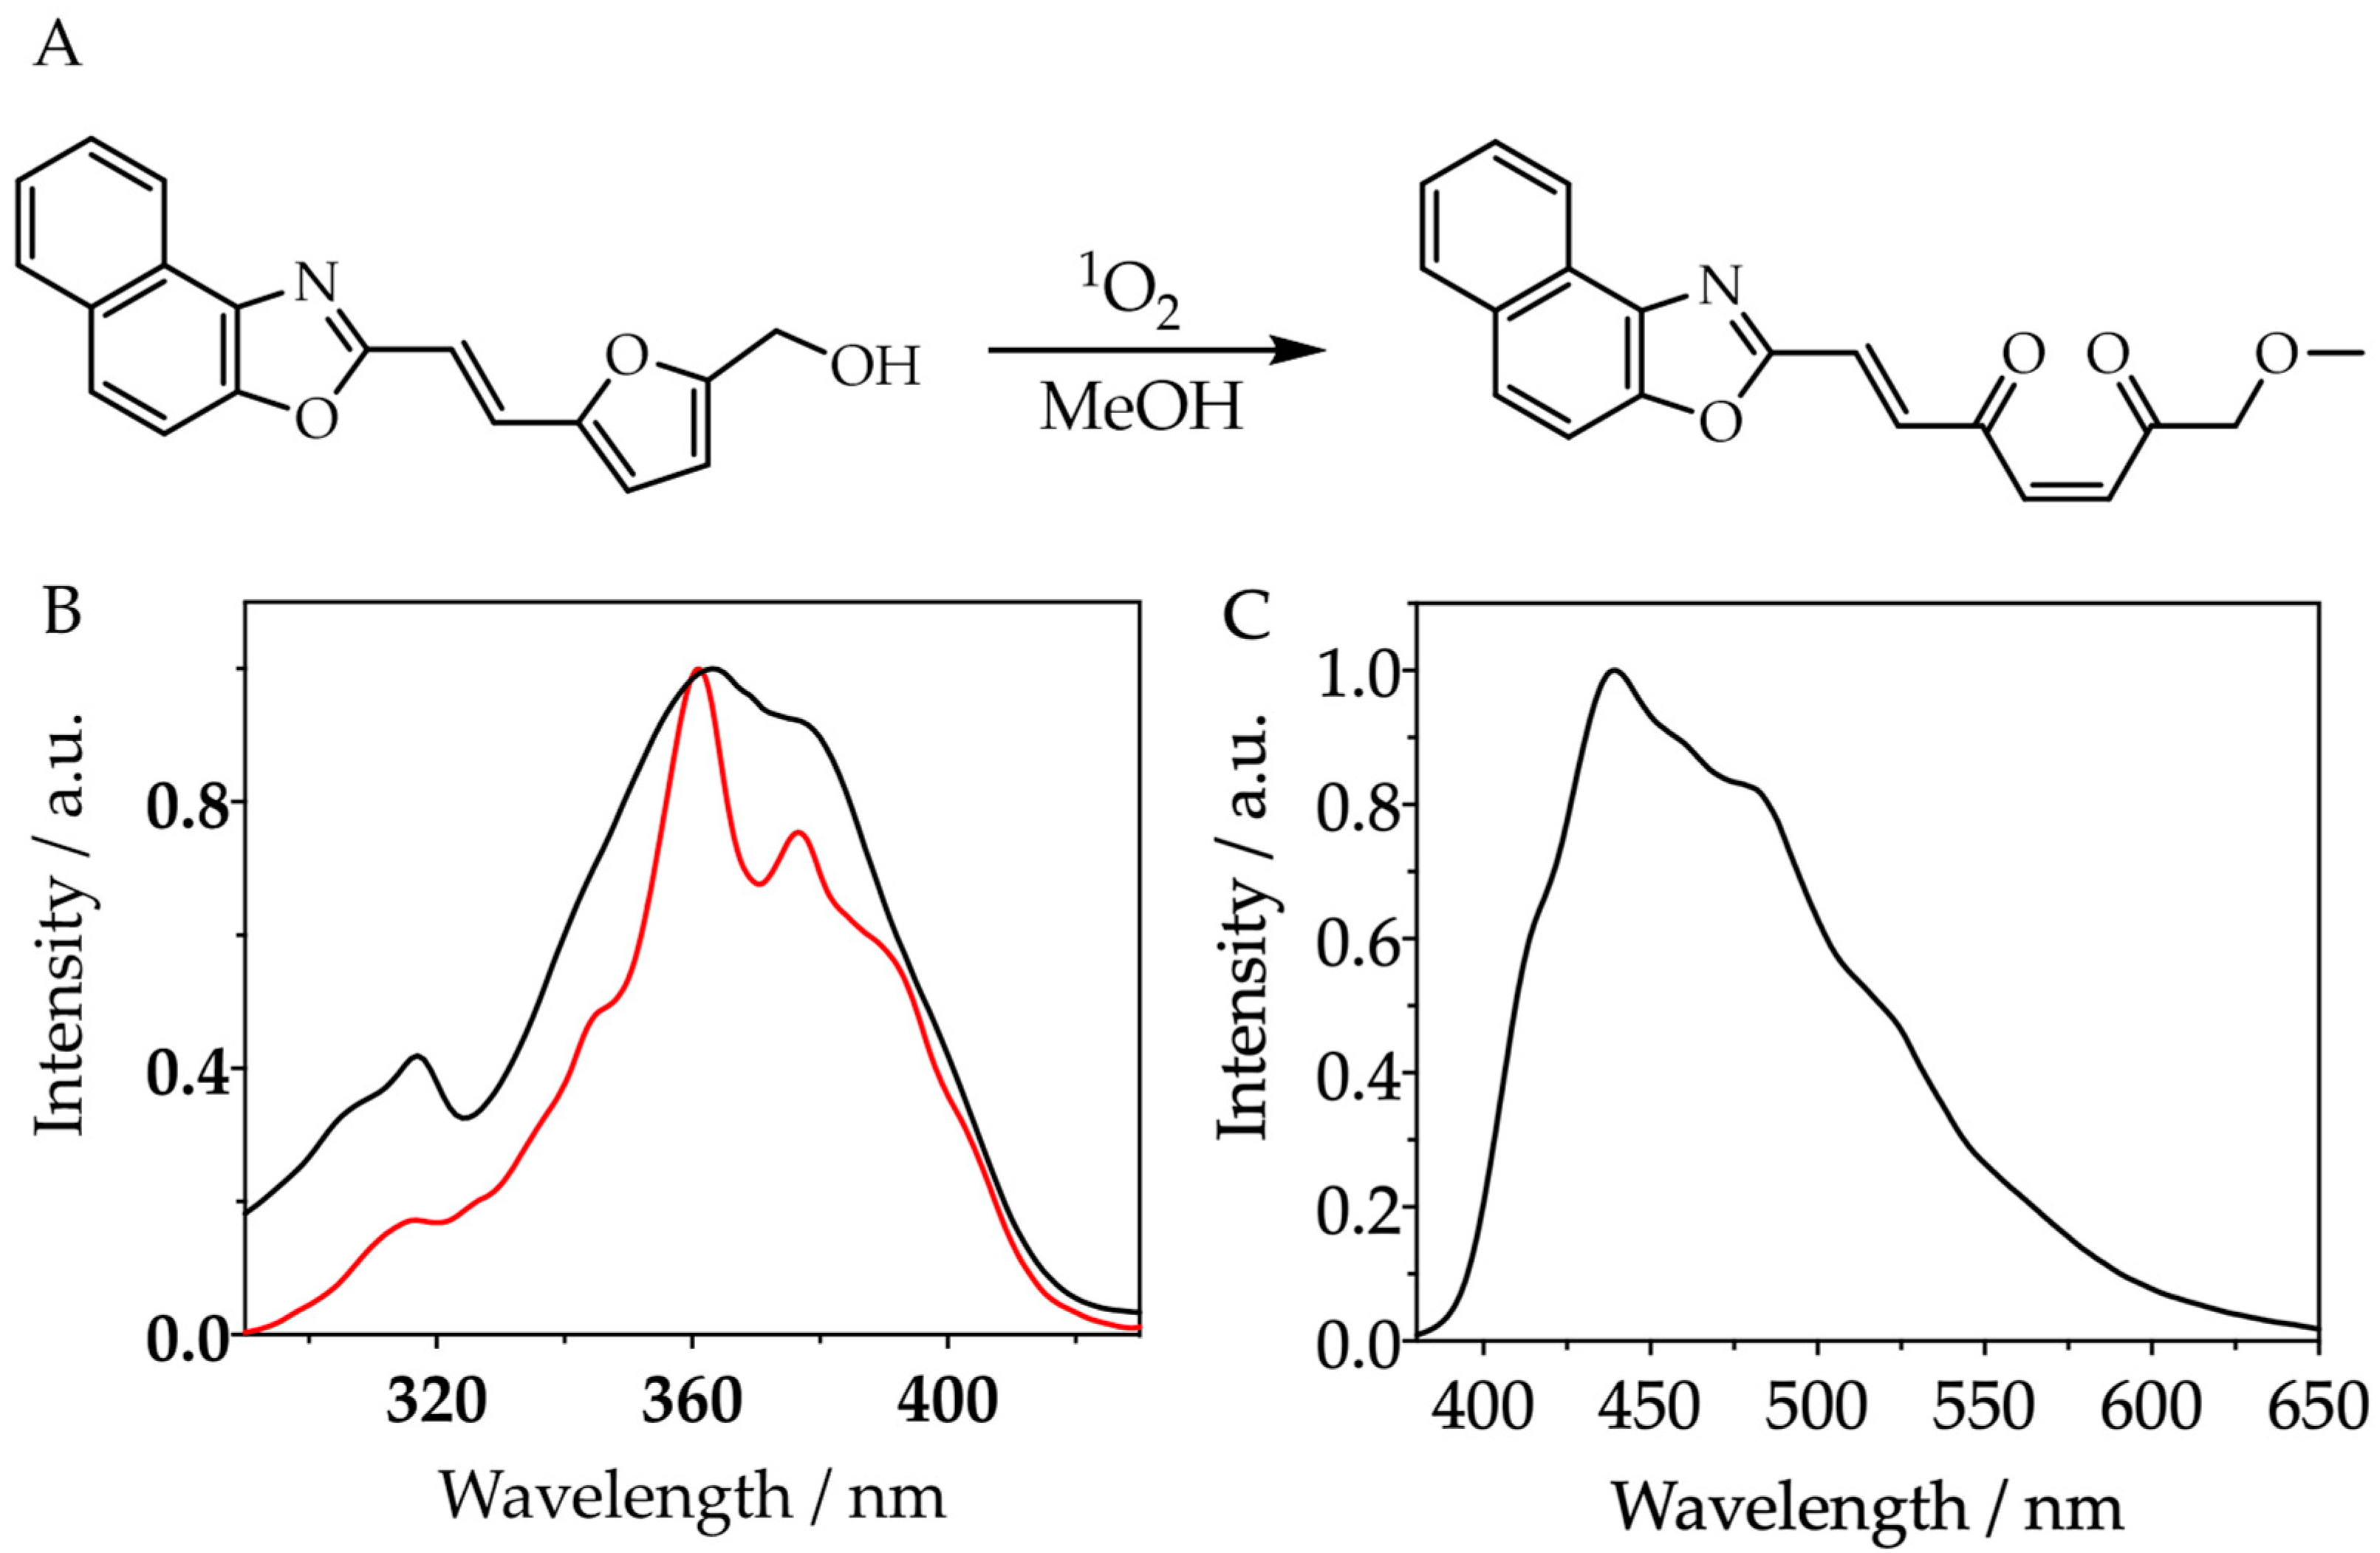
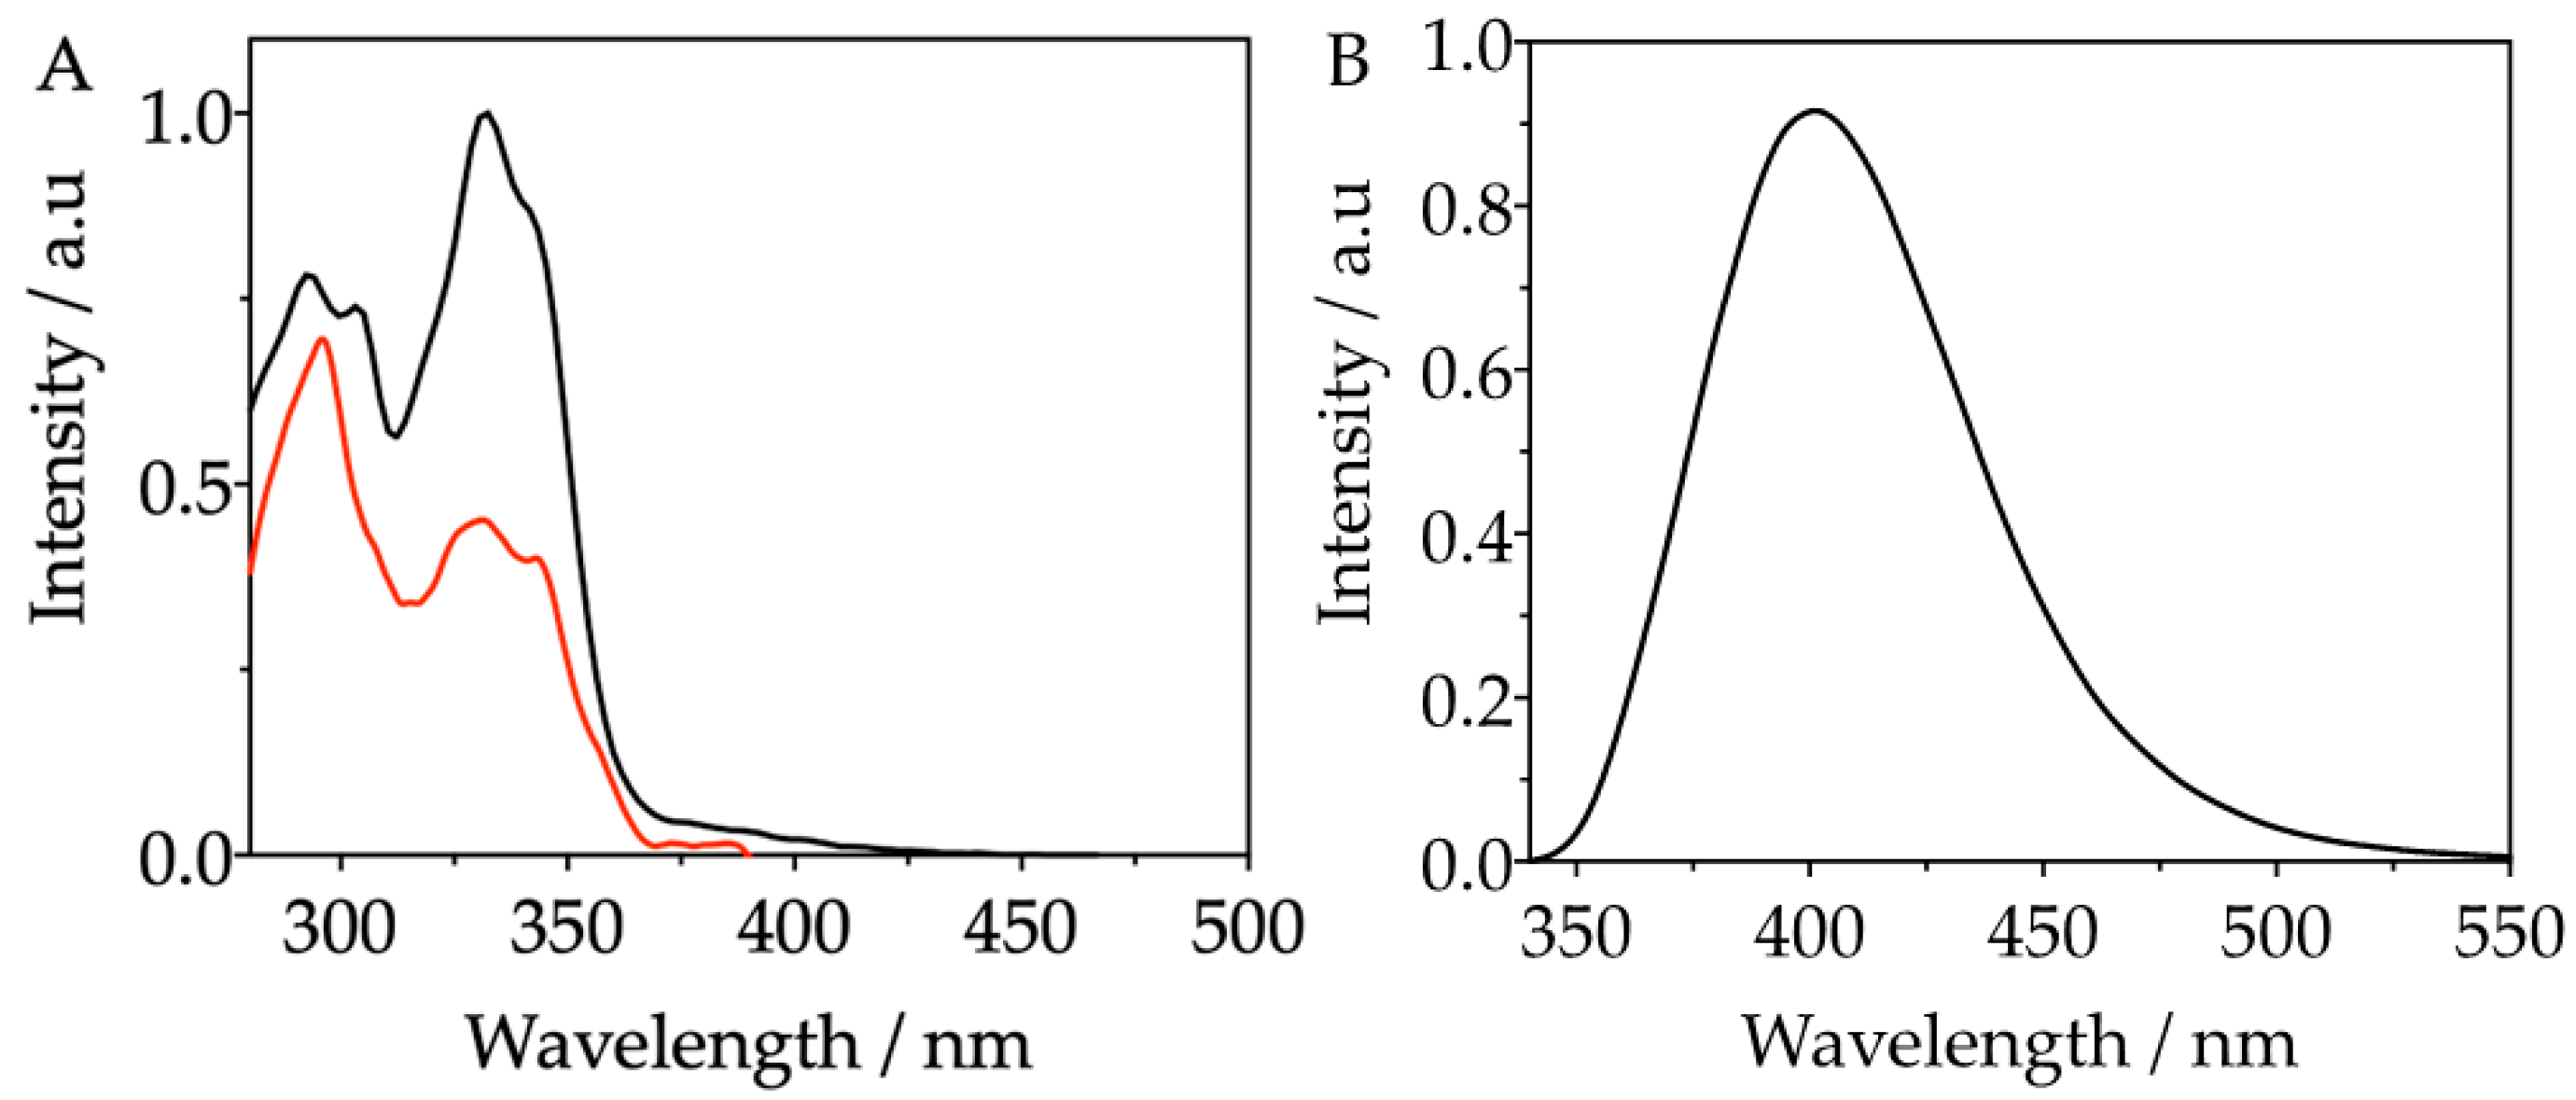
3.1. Synthesis and Characterization of the Molecular Probe FN10

The molecular probe FN10 is a modification of the furyl naphthoxazoles reported in our previous communication [26], in which the hydrogen in position C-5 of the furan has been replaced by a hydroxymethyl group. This improves the furan’s reactivity towards 1O2 and allows its conjugation to nanoparticles via a Steglich esterification [30,31]. FN10 has been synthesized by a one-pot, two-step reaction, in which the conjugation of methylnaphthoxazole anion to furaldehyde is followed by a dehydration step (Figure 1A). The spectroscopic characterization is shown in the supplementary information (Figure S1).
The absorption spectrum of FN10 in methanol shows a maximum at 363 nm and a second peak at 290 nm, while the fluorescence spectrum shows a maximum at 439 nm (Figure 1B). The fluorescence quantum yield (ΦF) ranges from 0.05 in acetonitrile to 0.005 in methanol (Figure S2), indicating efficient quenching of the naphthoxazole singlet excited state by the furan in the protic solvent. The photophysical properties of FN10 in methanol are collected in Table 1.

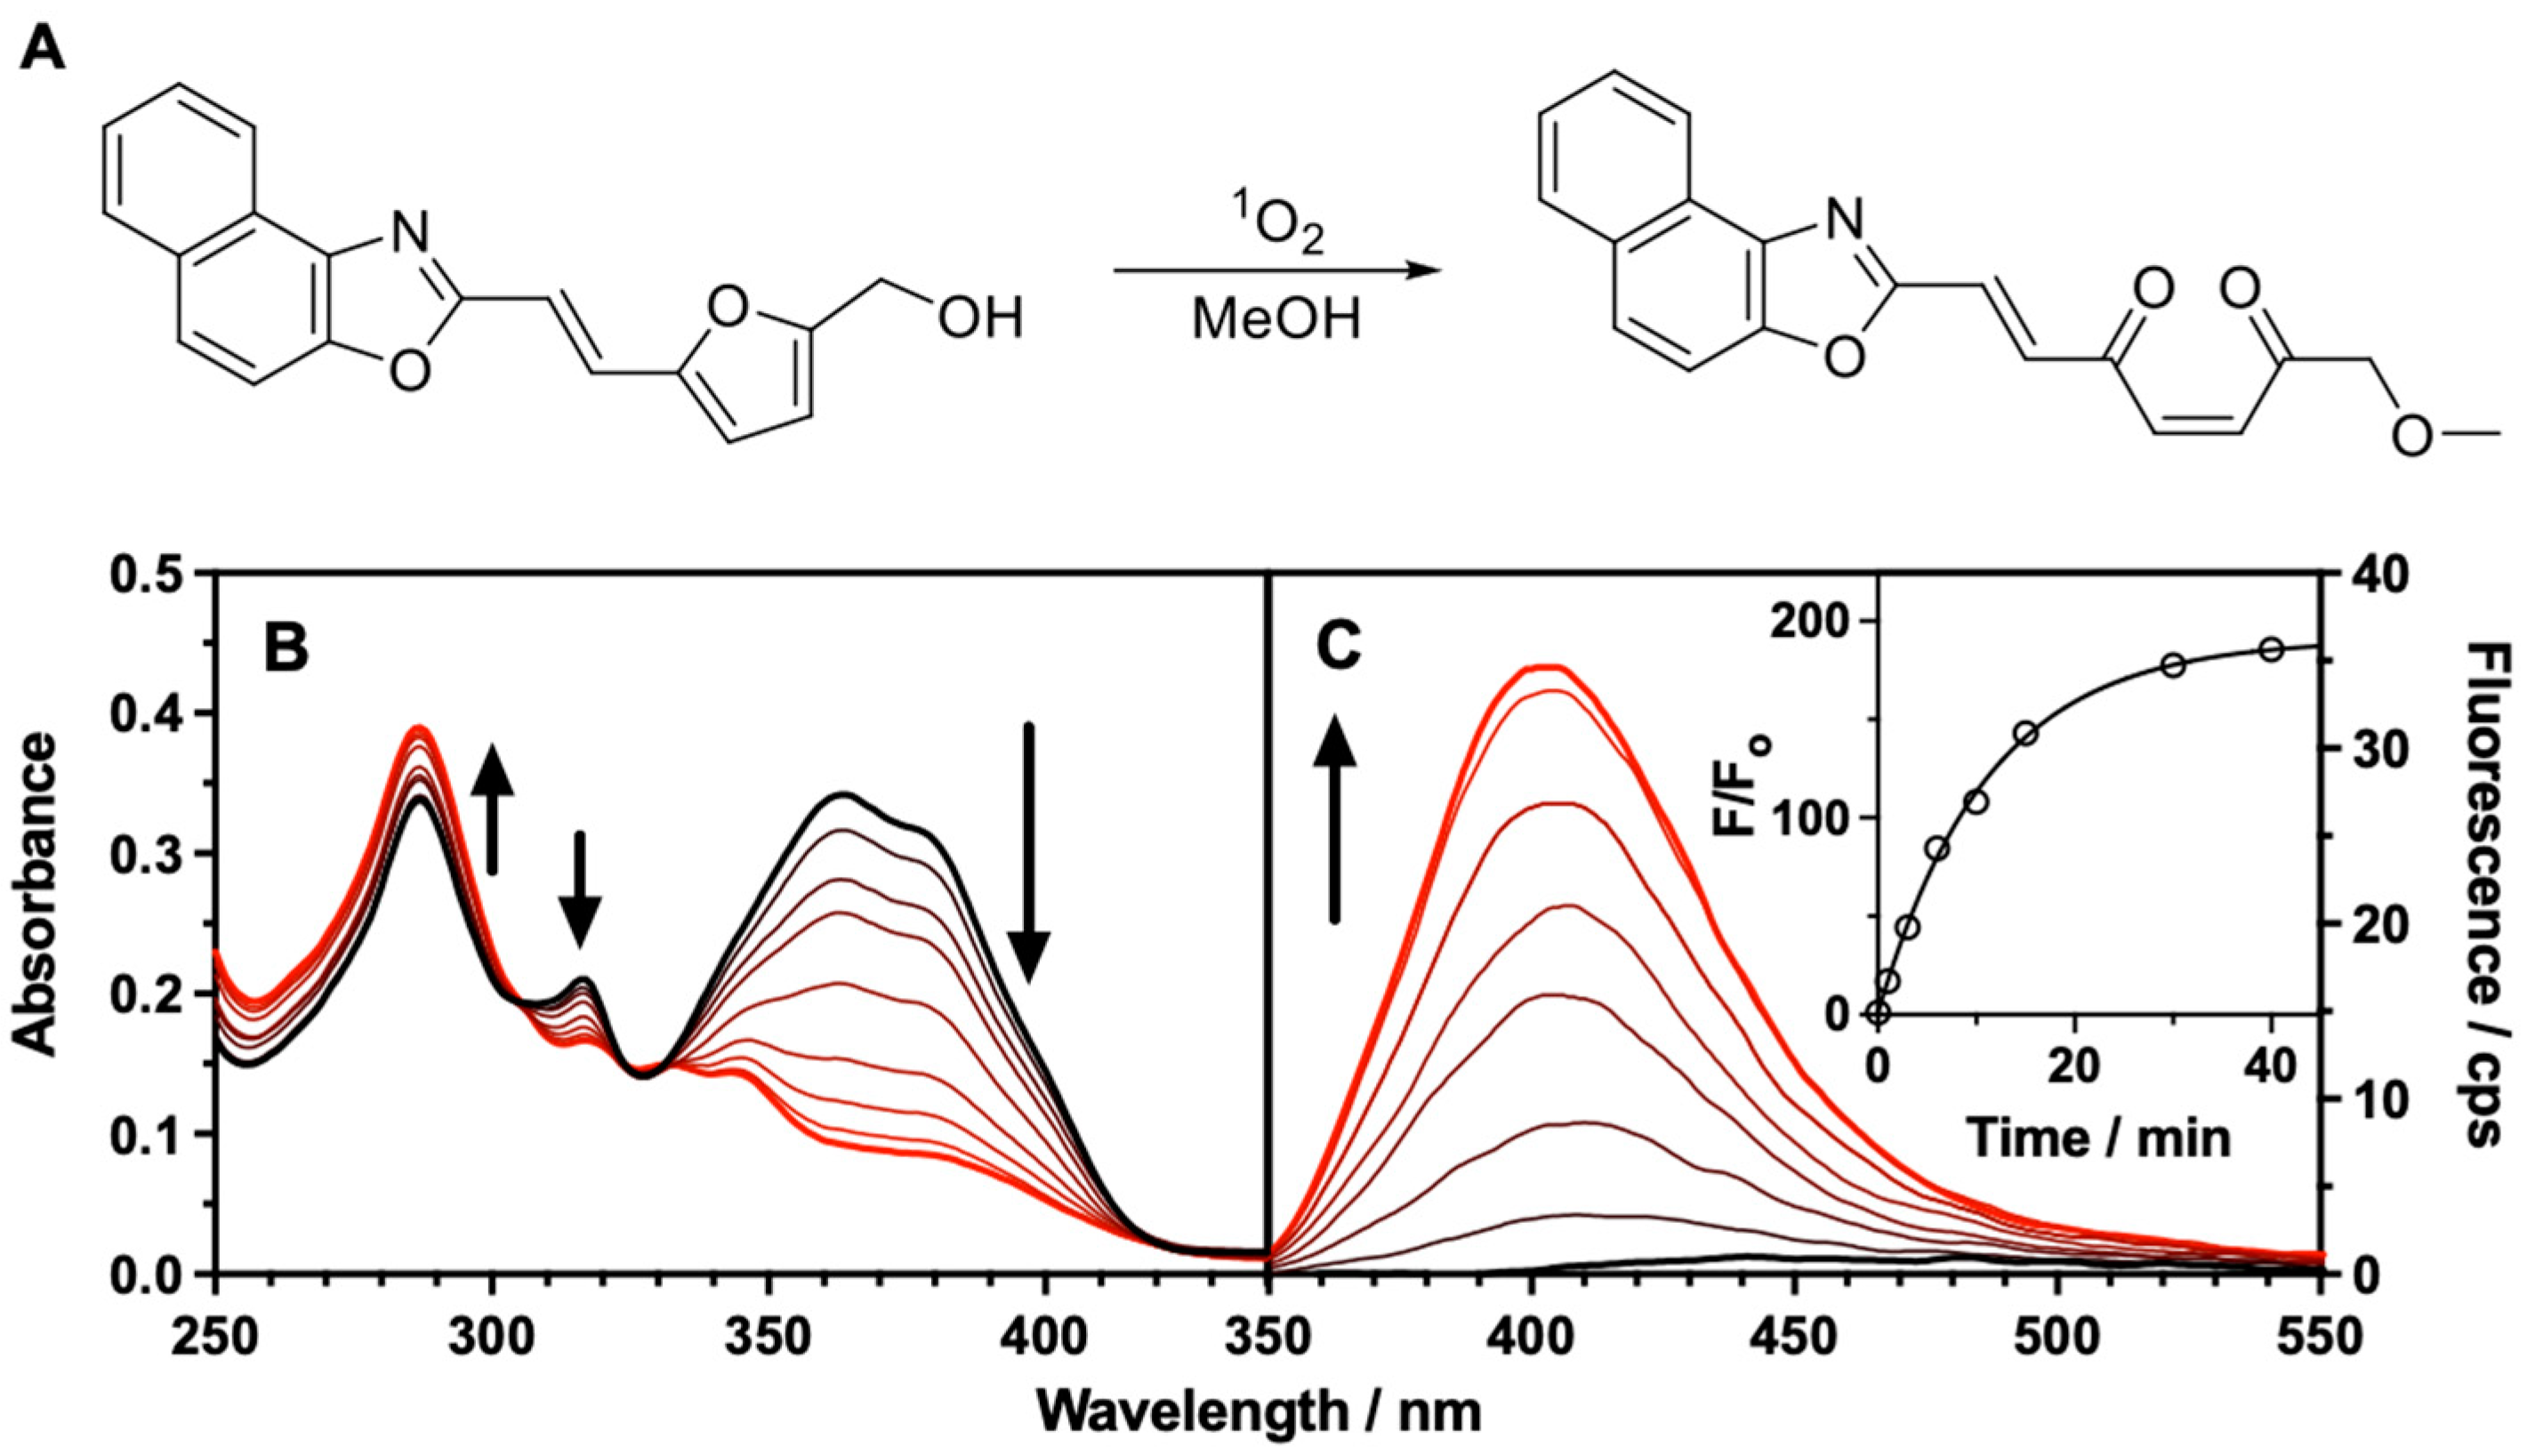
3.2. Reactivity of FN10 with Singlet Oxygen

The reactivity of FN10 towards 1O2 was studied by generating it using new methylene blue photosensitization and monitoring the concomitant changes in the absorption and emission spectra of the probe (Figure 2). In the presence of 1O2, the absorbance of the 363-nm FN10 band decreased strongly (Figure 2B), and an intense fluorescence emission appeared with a maximum at 400 nm (Figure 2C). HPLC analysis of the photoirradiated samples revealed the formation of a single photoproduct, FN10-ox (Figure S3). The observation of isosbestic points in the absorption spectra is consistent with this finding. The structure of FN10-ox was determined by MS, IR, and 1H/13C-NMR spectroscopies (Figure S4) and is shown in Figure 2A. Furan oxidation eliminates the fluorescence quencher and shortens the conjugation path in the probe, leading to changes in the absorption and emission spectra that enable the selective excitation and detection of FN10-ox fluorescence (Figure 3). The excitation spectra of the photooxidized samples show a maximum at 335 nm (Figure S5). Exciting the samples at this wavelength leads to a remarkable fluorescence enhancement of 180-fold when observed at 400 nm (inset of Figure 2C).
The rate constant for overall (physical and reactive) 1O2 quenching by FN10 was determined by measuring the 1O2 decay rate as a function of FN10 concentration in time-resolved 1O2 phosphorescence assays (Figure S6A) [32]. The value found, 3.0 × 10⁷ M1 s1 (Figure S6B), is 32-fold larger than for unsubstituted furyl naphthoxazoles [26]. The reactive rate constant was determined by comparing the rate of photooxidation of FN10 with that of dimethyl anthracene [32] and is 1.7 × 10⁷ M1 s1 (Figure S6C), comparable to that of the most reactive furans [33]. The reactivity of FN10 towards other ROS was examined, and it was found that it does not react with superoxide or hydrogen peroxide (Figure S7). Finally, FN10 shows a negligible quantum yield of 1O2 self-sensitization (ΦΔ = 0.003 in methanol and acetonitrile, Figure S8); for comparison, SOSG has ΦΔ = 0.03 at 355 nm and 0.009 at 532 nm in methanol [21]. Taken together, the above results suggest that FN10 could be an excellent fluorescent probe for 1O2 detection.

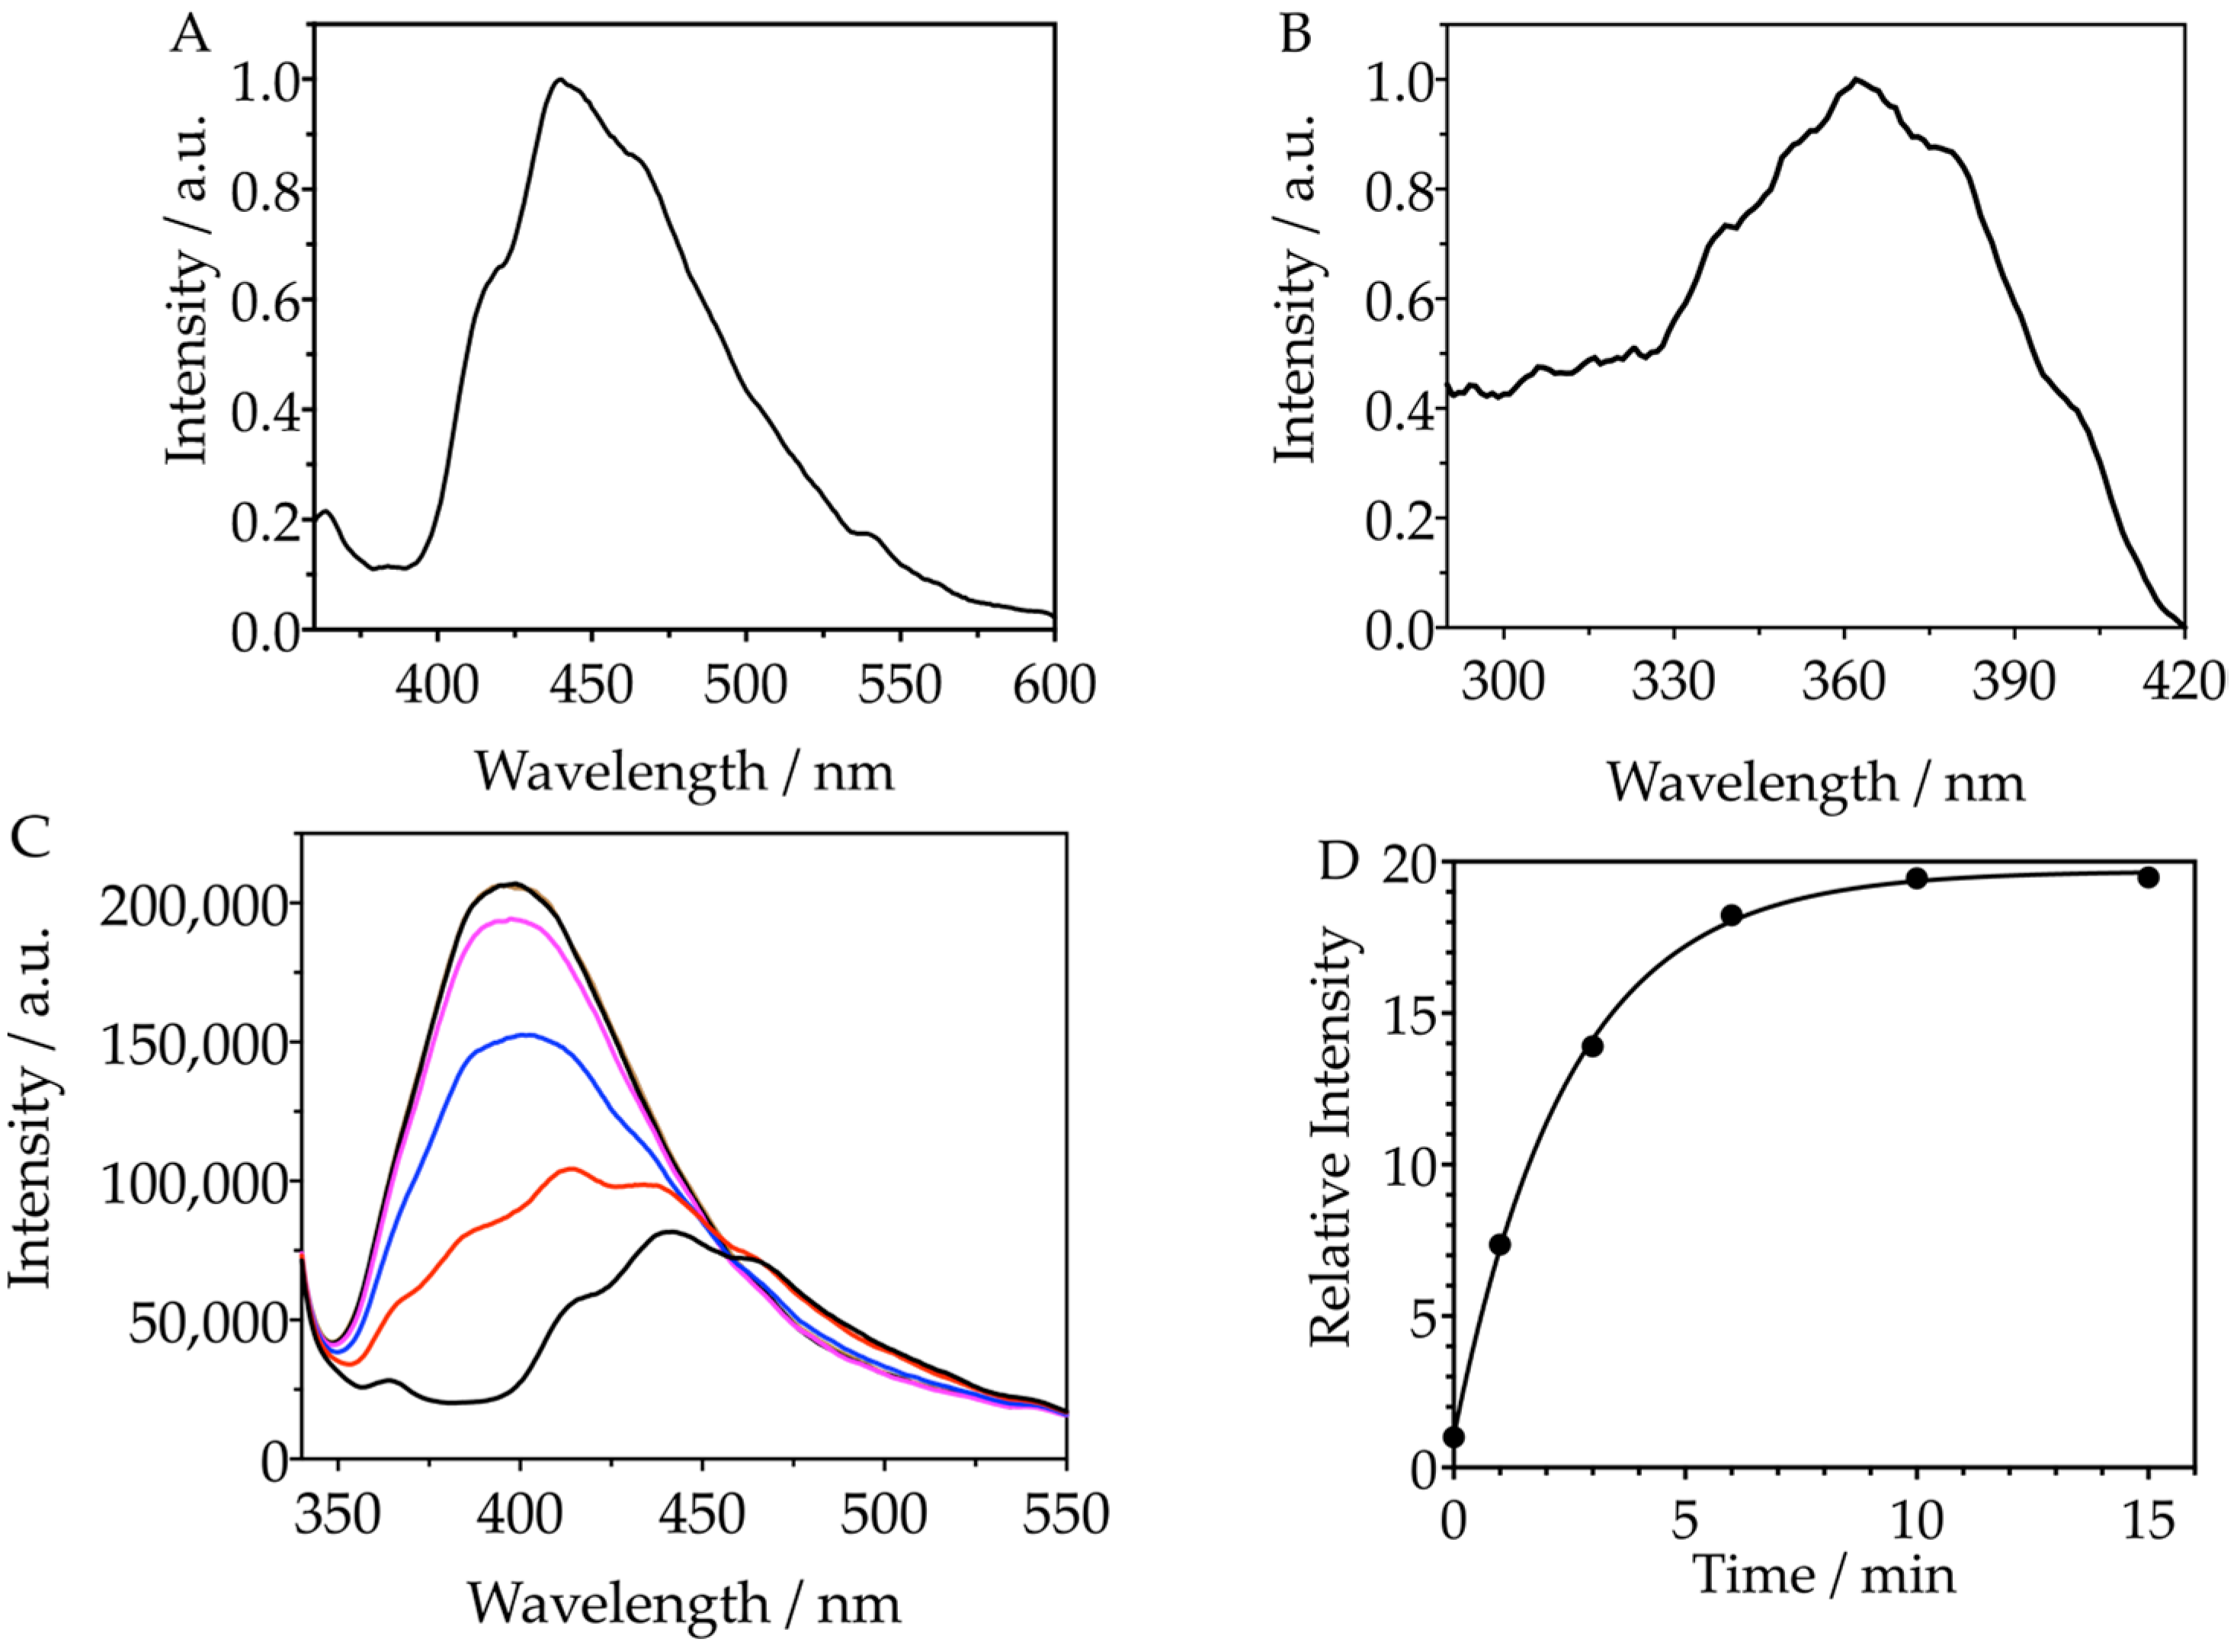
3.3. Synthesis and Characterization of the Nanoprobe NanoFN10

Given the excellent properties of FN10, we aimed to synthesize a nanosensor (nanoFN10) where FN10 would be covalently linked to the surface of mesoporous silica nanoparticles through a 2.3-nm PEG linker (Figure S9). Previous results from our laboratory show that linkers of this length preclude the complexation of the probe with proteins while still preserving its reactivity towards 1O2 (Scheme 1) [24,25].
In the first step, 10 eq of the diamino PEG linker was reacted with 1 eq of (3-isocyanate propyl)-triethoxysilane to yield a monosubstituted aminosilylated-PEG linker, which was then grafted onto the surface of 160-nm mesoporous silica nanoparticles. Since the amino moieties cannot react directly with the hydroxyl group of FN10, they were converted to carboxylic moieties via reaction with succinic anhydride. Finally, the FN10 fluorescent probe was conjugated to the functionalized nanoparticles by Steglich esterification. The bare MSNPs and the final nanoFN10 probe were characterized by their hydrodynamic diameter (150 to 200 nm) and ζ-potential (−21 to −23 mV). Covalent conjugation of FN10 did not significantly modify the size and the ζ-potential of the silica nanoparticles.
Once the nanoFN10 was in hand, the particles were suspended in aerated methanol for optical and photophysical characterization. The emission and excitation spectra of nanoFN10 were essentially identical to those of its molecular counterpart, although 10-nm blue-shifted probably due to the esterification of the hydroxymethyl group (Figure 4A,B). Irradiation of the suspension with red light in the presence of added new methylene blue led to the expected growth of a blue-shifted, bright fluorescence band, as in the case of FN10. A fluorescence enhancement of 20-fold was observed at 390 nm (Figure 4C,D).
Having established that the nanoprobe enhances its fluorescence upon reaction with 1O2, we prepared a new nanosystem by simultaneously grafting the sylilated diamino PEG linker and a sylilated 1O2 photosensitizer (rose bengal, RB) to its surface, thereby enabling orthogonal attachment of FN10 and RB (Scheme 1). This ensured the generation of 1O2 in close vicinity to the sensor in the cellular experiments. The bifunctional nanoprobe (termed nanoFN10RB) reproduced the behavior of nanoFN10 (Figure S10).

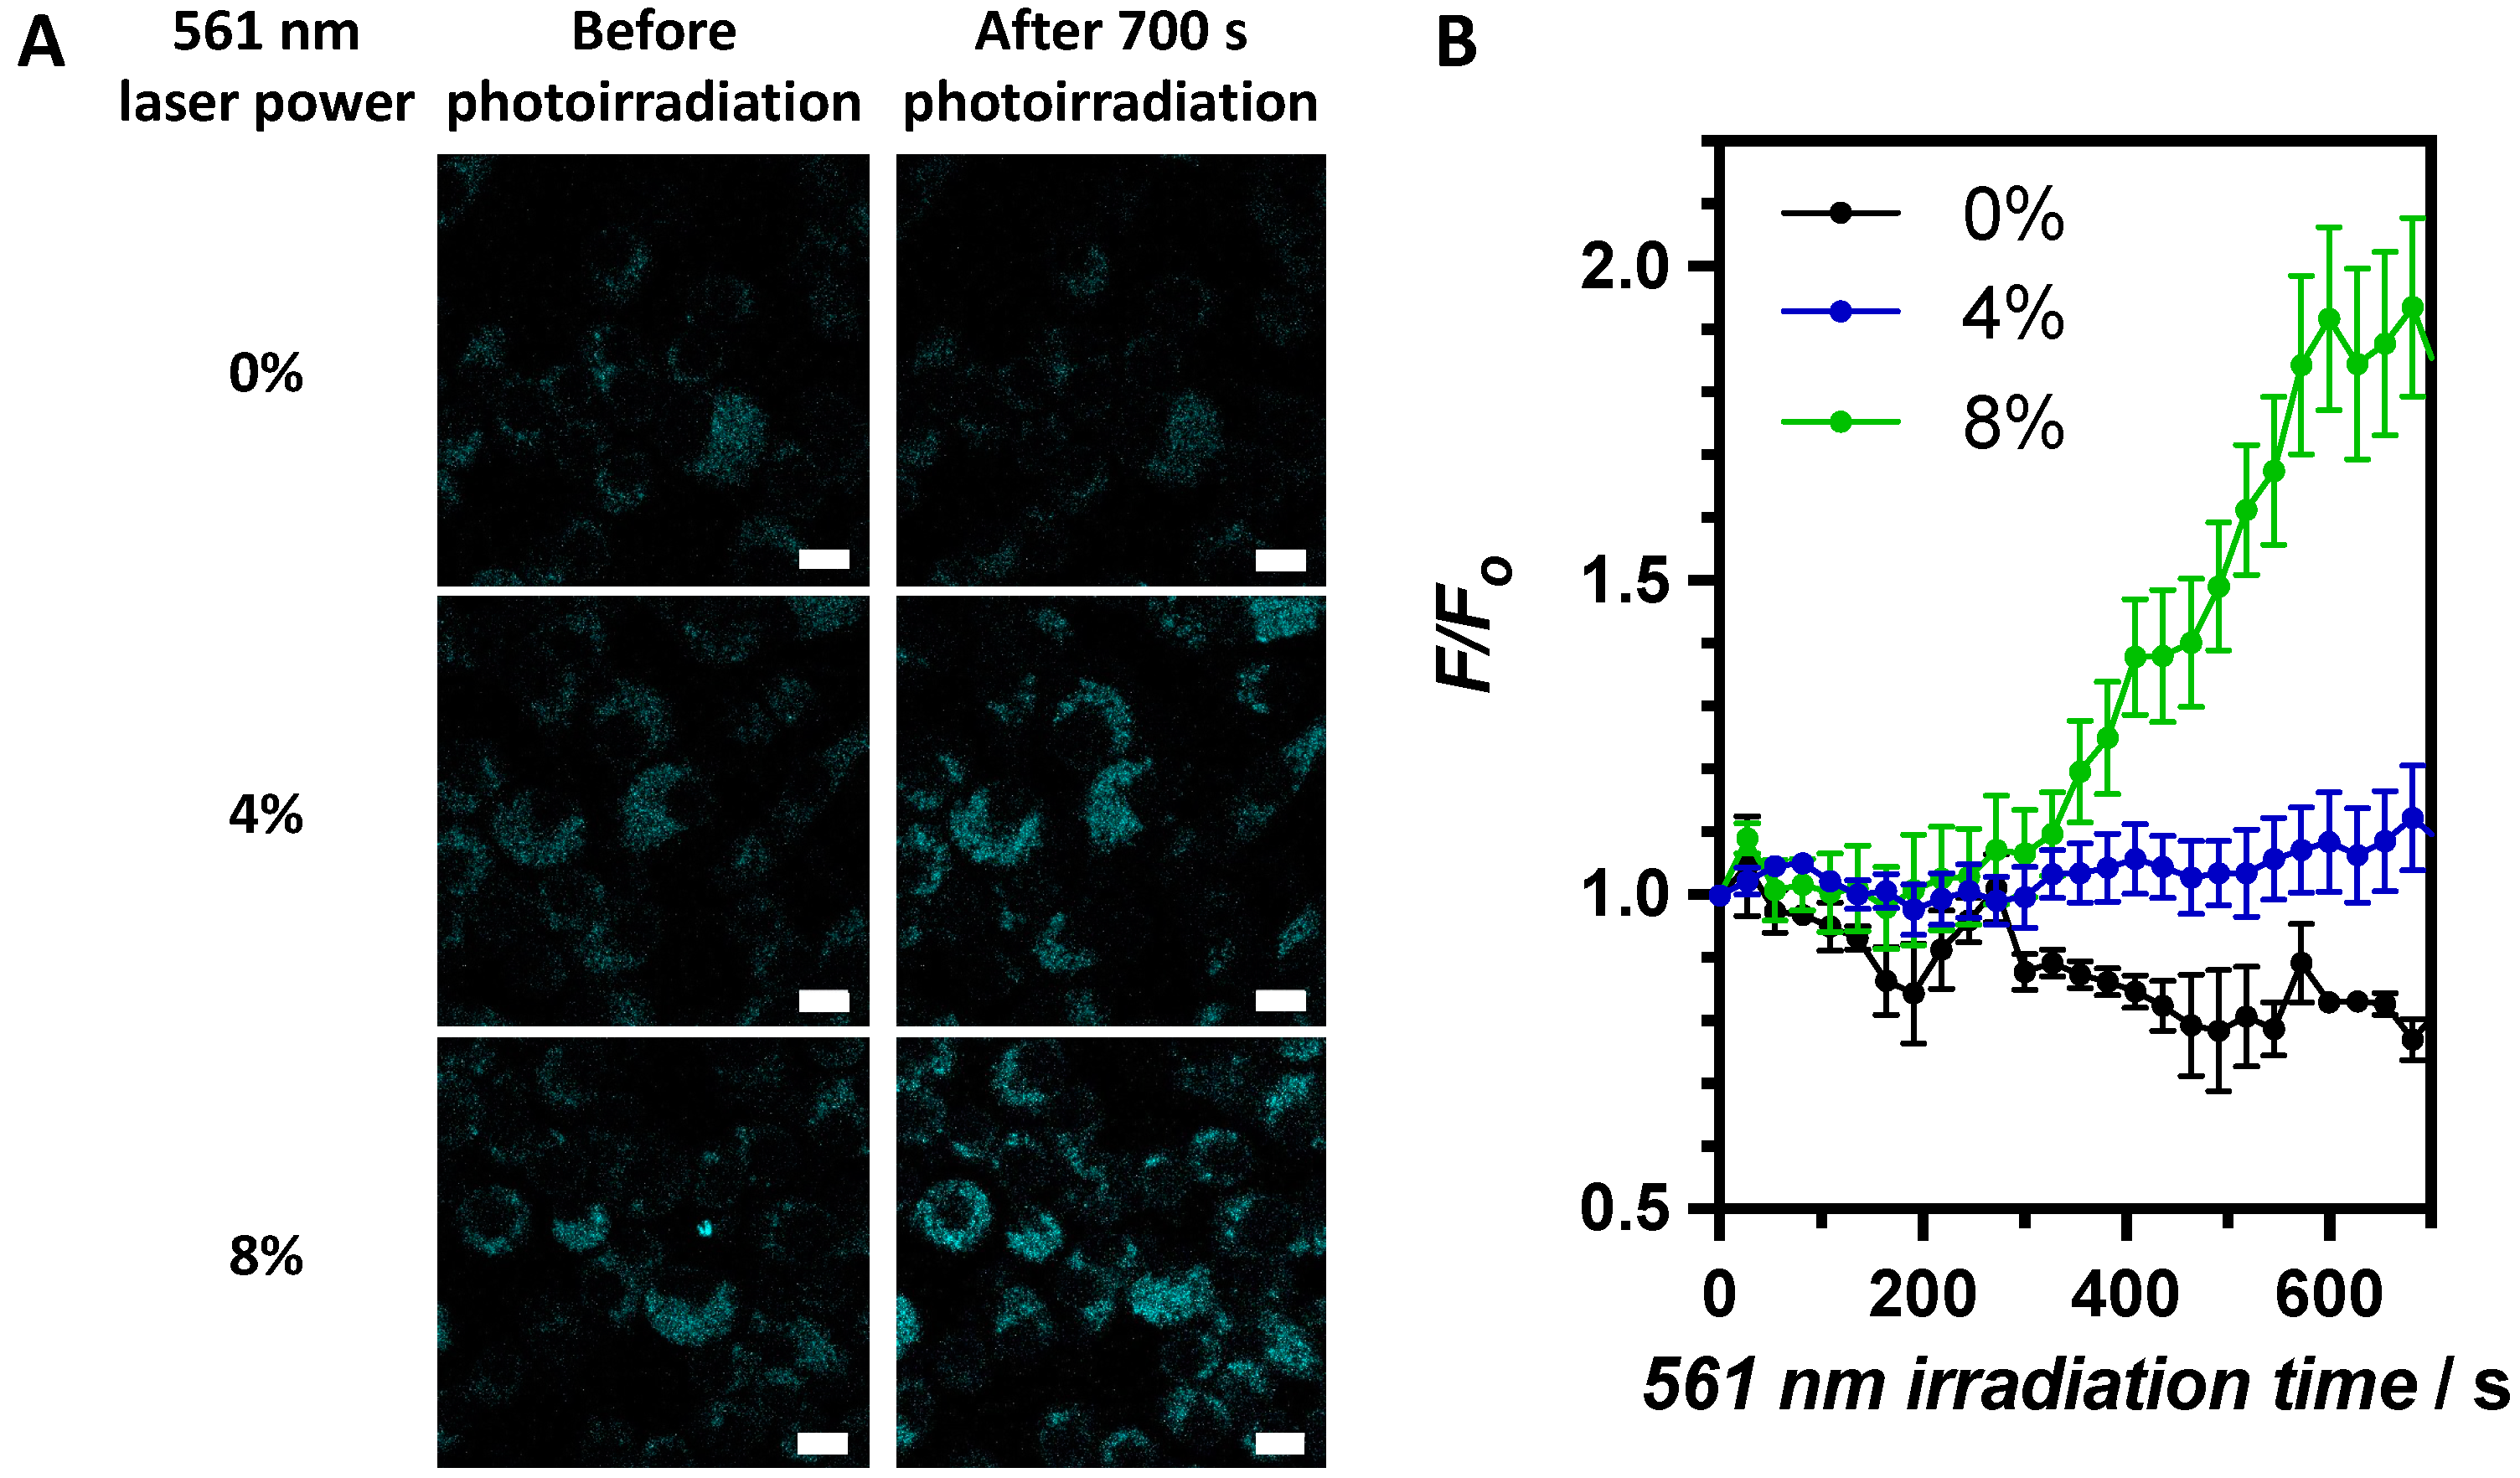
3.4. Imaging of Singlet Oxygen in Cells

We have successfully developed a novel turn-on singlet oxygen-specific fluorescent probe that shows a remarkable contrast between the native and oxidized forms. We have attached it to the surface of mesoporous silica nanoparticles and combined it with a photosensitizer to ensure co-localization with the singlet oxygen source. However, an excitation wavelength of 335 nm is required to achieve the maximum fluorescence enhancement upon reaction with 1O2, which is not suitable for studies in biological media. Notwithstanding, the probe could be valuable for multiphoton imaging microscopy. Multiphoton excitation would confer additional advantages for bioimaging such as longer excitation wavelength, deeper tissue penetration, lower fluorescence background, reduced photodamage in living systems, and better three-dimensional spatial resolution [34,35]. In light of a recent report on a naphthalimide-anthracene fluorescent probe that showed multiphoton absorption properties [36], we investigated whether the fluorescence of FN10 could be amenable to multiphoton excitation.
As shown in Figure 5A, multiphoton excitation was able to elicit the fluorescence of FN10 in microscopy imaging experiments using a simple solution with an air bubble as a zero-contrast reference image. Figure 5B shows the one-photon absorption and the two-photon fluorescence excitation spectra of FN10, the latter derived from spectroscopic analysis of the microscopy images. The maximum of the two-photon excitation spectrum is found at exactly twice the maximum of the one-photon absorption (and excitation spectra), confirming that FN10 is amenable to two-photon excitation.
Upon reaction with 1O2, a 3-fold increase in fluorescence was observed (Figure 5C,D). The contrast was much smaller than under one-photon excitation because the excitation wavelength for FN10-ox had to be set at 720 nm rather than 670 nm (=2 × 335 nm) due to equipment limitations. Despite the lower fluorescence enhancement, we attempted to image 1O2 in N13 microglia adherent cells.
In the first series of experiments, the N13 microglia cells were incubated with the nanoFN10RB probe for 24 h, and images were taken under two-photon excitation at λexc 720 nm (Figure S11). As shown in Figure S12, the two-photon fluorescence colocalizes with the one-photon fluorescence of RB (λexc 561 nm), confirming its assignment to FN10.
In a second series of experiments, a group of cells preincubated with nanoFN10RB were irradiated with a CW green laser (λexc 561 nm) at different laser powers (0%, 4%, and 8%), and biphotonic fluorescence images (λexc 720 nm) were recorded every 30 s (Figure 6A). At 0% green laser power, when no 1O2 was produced, the only effect observed was the photobleaching of the nanoprobe upon prolonged two-photon excitation. However, when 1O2 was generated by green light irradiation of RB, the initial photobleaching was followed by a fluorescence enhancement phase (Figure 6). The duration and extension of the photobleaching and fluorescence-enhancement phases depend on the laser power. At the maximum power (8%), a fluorescence enhancement of 80% could be observed. The time delay between the photobleaching and the fluorescence enhancement is attributed to the period required to eliminate the endogenous 1O2 quenchers that compete with the probe oxidation, as has been previously reported for bacteria during a PDT treatment [24]. These results confirm the ability of nanoFN10RB to generate and detect 1O2 inside N13 cells by NIR two-photon microscopy.

4. Conclusions

We have developed a novel naphthoxazole-furan turn-on fluorescent probe, FN10, which is selective and highly reactive towards 1O2; it shows enhancement factors up to 180 and produces very little 1O2 by photosensitization, and its fluorescence can be excited by multiphoton processes. FN10 was successfully attached to MSNPs to protect it from interaction with proteins and other biological components. NanoFN10RB is readily internalized by N13 microglia cells and reacts with intracellularly generated 1O2, enabling two-photon fluorescence imaging of this reactive oxygen species. Work is currently in progress to further enhance the contrast between the native and oxidized nanoprobes.

Supplementary Materials

The following supporting information can be downloaded at: https://www.mdpi.com/article/10.3390/s23104603/s1. Figure S1: Spectroscopic characterization of FN10. Figure S2: Determination of the FN10 fluorescence quantum yield. Figure S3: HPLC monitoring of FN10 oxidation by singlet oxygen. Figure S4: Spectroscopic characterization of FN10-ox. Figure S5: Evolution of the excitation spectra of FN10 upon reaction with singlet oxygen. Figure S6: Reactivity of FN10 with singlet oxygen. Figure S7: Reactivity of FN10 with other reactive oxygen species. Figure S8: Quantum yield of singlet oxygen production by FN10. Figure S9: Geometry of FN10 grafted onto the surface of a silica particle through a PEG linker. Figure S10: Fluorescence evolution of the nanoFN10RB probe upon reaction with singlet oxygen. Figure S11: Two-photon microscopy of N13 microglia cells incubated with nanoFN10RB. Figure S12: Co-localization of FN10 and rose bengal fluorescence in microglia cells incubated with nanoFN10RB. References [37,38,39,40,41,42] are cited in the Supplementary Information.

Author Contributions

Conceptualization, S.N. and R.P.Z.; methodology, S.N., E.P.-I. and R.P.Z.; validation, S.N., E.P.-I. and R.P.Z.; investigation, R.B.-O., F.N., A.L.Z., E.L. and R.P.Z.; resources, S.N., E.P.-I. and R.P.Z.; data curation, R.P.Z.; writing—original draft preparation, R.B.-O. and R.P.Z.; writing—review and editing, R.B.-O., E.P.-I., R.P.Z. and S.N.; supervision, S.N. and E.P.-I.; project administration, S.N. and R.P.Z.; funding acquisition, S.N., E.P.-I. and R.P.Z. All authors have read and agreed to the published version of the manuscript.

Funding

This research was funded by the Spanish Ministerio de Economía y Competitividad (grant number CTQ2016-78454-C2-1-R) and the Agencia Estatal de Investigación and FEDER (grant numbers PID2019-104293GB-I00 and PID2020-115801RB-C22), Chilean Agencia Nacional de Investigación y Desarrollo (FONDECYT-Postdoctoral grant 3190627), and by the Chilean National Commission for Scientific and Technological Research (CONICYT; grant FONDECYT 1150210). R.P.Z. thanks CONICYT for his Ph.D. scholarship Nº 2012831739. R.B.-O. thanks the Agencia Estatal de Investigación for a Ramon y Cajal contract (RYC2021-032773-I). S.N. thanks the Departament de Recerca i Universitats de la Generalitat de Catalunya for the support given to our research group (2021 SGR 01023) and the ICREA—Catalan Institution for Research and Advanced Studies for grant No. Ac2232308.

Institutional Review Board Statement

Not applicable.

Informed Consent Statement

Not applicable.

Data Availability Statement

The data presented in this study are available in the article and Supplementary Materials.

Acknowledgments

We acknowledge the ICTS ‘‘NANBIOSIS’’ facilities, more specifically the U28 Unit of the Andalusian Centre for Nanomedicine & Biotechnology (BIONAND), where the 2PA characterization was carried out.

Conflicts of Interest

The authors declare no conflict of interest. The funders had no role in the design of the study; in the collection, analyses, or interpretation of data; in the writing of the manuscript; or in the decision to publish the results.

References

  1. Nonell, S.; Flors, C. Singlet Oxygen: Applications in Biosciences and Nanosciences; Royal Society of Chemistry: Cambridge, UK, 2016. [Google Scholar]
  2. Ogilby, P.R. Singlet oxygen: There is indeed something new under the sun. Chem. Soc. Rev. 2010, 39, 3181–3209. [Google Scholar] [CrossRef]
  3. Davies, M.J. Singlet oxygen-mediated damage to proteins and its consequences. Biochem. Biophys. Res. Commun. 2003, 305, 761–770. [Google Scholar] [CrossRef] [PubMed]
  4. Kopetzki, D.; Lévesque, F.; Seeberger, P.H. A continuous-flow process for the synthesis of artemisinin. Chem. Eur. J. 2013, 19, 5450–5456. [Google Scholar] [CrossRef] [PubMed]
  5. Agostinis, P.; Berg, K.; Cengel, K.A.; Foster, T.H.; Girotti, A.W.; Gollnick, S.O.; Hahn, S.M.; Hamblin, M.R.; Juzeniene, A.; Kessel, D.; et al. Photodynamic therapy of cancer: An update. J. Am. Cancer Soc. 2011, 61, 250–281. [Google Scholar] [CrossRef]
  6. Wainwright, M.; Maisch, T.; Nonell, S.; Plaetzer, K.; Almeida, A.; Tegos, G.P.; Hamblin, M.R. Photoantimicrobials—Are we afraid of the light? Lancet Infect. Dis. 2017, 17, e49–e55. [Google Scholar] [CrossRef]
  7. Kim, C.; Meskauskiene, R.; Apel, K.; Laloi, C. No single way to understand singlet oxygen signalling in plants. EMBO Rep. 2008, 9, 435–439. [Google Scholar] [CrossRef] [PubMed]
  8. Flors, C.; Nonell, S. Light and singlet oxygen in plant defense against pathogens:  Phototoxic phenalenone phytoalexins. Acc. Chem. Res. 2006, 39, 293–300. [Google Scholar] [CrossRef] [PubMed]
  9. Salokhiddinov, K.I.; Byteva, I.M.; Dzhagarov, B.M. Duration of luminescence of singlet oxygen in solutions with laser excitation. Opt. Spektrosk. 1979, 47, 881–887. [Google Scholar]
  10. Jiménez-Banzo, A.; Ragàs, X.; Kapusta, P.; Nonell, S. Time-resolved methods in biophysics. 7. Photon counting vs. analog time-resolved singlet oxygen phosphorescence detection. Photochem. Photobiol. Sci. 2008, 7, 1003–1010. [Google Scholar] [CrossRef]
  11. Nonell, S.; Braslavsky, S.E. Chapter 4: Time-resolved singlet oxygen detection. In Methods in Enzymology 310; Packer, L., Sies, H., Eds.; Elsevier: Amsterdam, The Netherlands, 2000; pp. 37–49. [Google Scholar]
  12. Rabello, B.R.; Gerola, A.P.; Pellosi, D.S.; Tessaro, A.L.; Aparício, J.L.; Caetano, W.; Hioka, N. Singlet oxygen dosimetry using uric acid as a chemical probe: Systematic evaluation. J. Photochem. Photobiol. A Chem. 2012, 238, 53–62. [Google Scholar] [CrossRef]
  13. Umezawa, N.; Tanaka, K.; Urano, Y.; Kikuchi, K.; Higuchi, T.; Nagano, T. Novel Fluorescent Probes for Singlet Oxygen. Angew. Chem. Int. Ed. 1999, 38, 2899–2901. [Google Scholar] [CrossRef]
  14. Kálai, T.; Hideg, E.; Vass, I.; Hideg, K. Double (fluorescent and spin) sensors for detection of reactive oxygen species in the thylakoid membrane. Free Radic. Biol. Med. 1998, 24, 649–652. [Google Scholar] [CrossRef] [PubMed]
  15. Flors, C.; Fryer, M.J.; Waring, J.; Reeder, B.; Bechtold, U.; Mullineaux, P.M.; Nonell, S.; Wilson, M.T.; Baker, N.R. Imaging the production of singlet oxygen in vivo using a new fluorescent sensor, Singlet Oxygen Sensor Green. J. Exp. Bot. 2006, 57, 1725–1734. [Google Scholar] [CrossRef] [PubMed]
  16. Tanaka, K.; Miura, T.; Umezawa, N.; Urano, Y.; Kikuchi, K.; Higuchi, T.; Nagano, T. Rational design of fluorescein-based fluorescence probes. Mechanism-based design of a maximum fluorescence probe for singlet oxygen. J. Am. Chem. Soc. 2001, 123, 2530–2536. [Google Scholar] [CrossRef]
  17. Price, M.; Reiners, J.J.; Santiago, A.M.; Kessel, D. Monitoring singlet oxygen and hydroxyl radical formation with fluorescent probes during photodynamic therapy. Photochem. Photobiol. 2009, 85, 1177–1181. [Google Scholar] [CrossRef]
  18. Kim, S.; Tachikawa, T.; Fujitsuka, M.; Majima, T. Far-red fluorescence probe for monitoring singlet oxygen during photodynamic therapy. J. Am. Chem. Soc. 2014, 136, 11707–11715. [Google Scholar] [CrossRef]
  19. Kim, S.; Fujitsuka, M.; Majima, T. Photochemistry of singlet oxygen sensor green. J. Phys. Chem. B 2013, 117, 13985–13992. [Google Scholar] [CrossRef]
  20. Lindig, B.A.; Rodgers, M.A.J.; Schaap, A.P. Determination of the lifetime of singlet oxygen in water-d2 using 9,10-anthracenedipropionic acid, a water-soluble probe. J. Am. Chem. Soc. 1980, 102, 5590–5593. [Google Scholar] [CrossRef]
  21. Ragàs, X.; Jiménez-Banzo, A.; Sánchez-García, D.; Batllori, X.; Nonell, S. Singlet oxygen photosensitisation by the fluorescent probe Singlet Oxygen Sensor Green®. Chem. Commun. 2009, 20, 2920–2922. [Google Scholar] [CrossRef]
  22. Gollmer, A.; Arnbjerg, J.; Blaikie, F.H.; Pedersen, B.W.; Breitenbach, T.; Daasbjerg, K.; Glasius, M.; Ogilby, P.R. Singlet Oxygen Sensor Green®: Photochemical behavior in solution and in a mammalian cell. Photochem. Photobiol. 2011, 87, 671–679. [Google Scholar] [CrossRef]
  23. Ruiz-González, R.; Cortajarena, A.L.; Mejias, S.H.; Agut, M.; Nonell, S.; Flors, C. Singlet Oxygen Generation by the Genetically Encoded Tag miniSOG. J. Am. Chem. Soc. 2013, 135, 9564–9567. [Google Scholar] [CrossRef] [PubMed]
  24. Ruiz-González, R.; Bresolí-Obach, R.; Gulías, O.; Agut, M.; Savoie, H.; Boyle, R.W.; Nonell, S.; Giuntini, F. NanoSOSG: A nanostructured fluorescent probe for the detection of intracellular singlet oxygen. Angew. Chem. Int. Ed. 2017, 56, 2885–2888. [Google Scholar] [CrossRef]
  25. Bresolí-Obach, R.; Nos, J.; Mora, M.; Sagristà, M.L.; Ruiz-González, R.; Nonell, S. Anthracene-based fluorescent nanoprobes for singlet oxygen detection in biological media. Methods 2016, 109, 64–72. [Google Scholar] [CrossRef]
  26. Ruiz-González, R.; Zanocco, R.; Gidi, Y.; Zanocco, A.L.; Nonell, S.; Lemp, E. Naphthoxazole-Based Singlet Oxygen Fluorescent Probes. Photochem. Photobiol. 2013, 89, 1427–1432. [Google Scholar] [CrossRef] [PubMed]
  27. Planas, O.; Bresolí-Obach, R.; Nos, J.; Gallavardin, T.; Ruiz-González, R.; Agut, M.; Nonell, S. Synthesis, Photophysical Characterization, and Photoinduced Antibacterial Activity of Methylene Blue-loaded Amino- and Mannose-Targeted Mesoporous Silica Nanoparticles. Molecules 2015, 20, 6284–6298. [Google Scholar] [CrossRef] [PubMed]
  28. Schneider, C.A.; Rasband, W.S.; Eliceiri, K.W. NIH image to imageJ: 25 years of image analysis. Nat. Methods 2012, 9, 671–675. [Google Scholar] [CrossRef]
  29. Schindelin, J.; Arganda-Carreras, I.; Frise, E.; Kaynig, V.; Longair, M.; Pietzsch, T.; Preibisch, S.; Rueden, C.; Saafeld, S.; Schmid, B.; et al. Fiji: An open-source platform for biological-image analysis. Nat. Methods 2012, 9, 676–682. [Google Scholar] [CrossRef]
  30. Neises, B.; Steglich, W. Simple Method for the Esterification of Carboxylic Acids. Angew. Chem. Int. Ed. 1978, 17, 522–524. [Google Scholar] [CrossRef]
  31. Zanocco, R.P.; Bresoli-Obach, R.; Nonell, S.; Lemp, E.; Zanocco, A.L. Structure-activity study of furyl aryloxazole fluorescent probes for the detection of singlet oxygen. PLoS ONE 2018, 13, e0200006. [Google Scholar] [CrossRef]
  32. Wilkinson, F.; Helman, W.P.; Ross, A.B. Rate constants for the decay and reactions of the lowest electronically excited singlet state of molecular oxygen in solution. An expanded and revised compilation. J. Phys. Chem. Ref. Data 1995, 24, 663–1021. [Google Scholar] [CrossRef]
  33. Clennan, E.L.; Mehrsheikh-Mohammadi, M.E. Mechanism of endoperoxide formation. 3. Utilization of the Young and Carlsson kinetic techniques. J. Am. Chem. Soc. 1984, 106, 7112–7118. [Google Scholar] [CrossRef]
  34. Denk, W.; Strickler, J.; Webb, W. Two-photon laser scanning fluorescence microscopy. Science 1990, 248, 73–76. [Google Scholar] [CrossRef] [PubMed]
  35. Hoover, E.E.; Squier, J.A. Advances in multiphoton microscopy technology. Nat. Photonics 2013, 7, 93–101. [Google Scholar] [CrossRef] [PubMed]
  36. Liu, H.W.; Xu, S.; Wang, P.; Hu, X.X.; Zhang, J.; Yuan, L.; Zhang, X.B.; Tan, W. An efficient two-photon fluorescent probe for monitoring mitochondrial singlet oxygen in tissues during photodynamic therapy. Chem. Commun. 2016, 52, 12330–12333. [Google Scholar] [CrossRef] [PubMed]
  37. Fletcher, A.A. Quinine sulfate as a fluorescence quantum yield standard. Photochem. Photobiol. 1969, 9, 439–444. [Google Scholar] [CrossRef]
  38. NIST Standard Reference Database 35. Available online: https://webbook.nist.gov/cgi/cbook.cgi?ID=C116165&Mask=80#IR-Spec (accessed on 30 January 2018).
  39. Günther, G.S.; Lemp, E.; Zanocco, A.L. On the use of 9,10-dimethylanthracene as chemical rate constant actinometer in singlet molecular oxygen reactions. Bol. Soc. Chil. Quím. 2000, 45, 637–644. [Google Scholar] [CrossRef]
  40. Schmidt, R.; Tanielian, C.; Dunsbach, R.; Wolff, C.; Womb, C.J. Phenalenone, a universal reference compound for the determination of quantum yields of singlet oxygen O2(1Δg) sensitization. Photochem. Photobiol. A Chem. 1994, 79, 11–17. [Google Scholar] [CrossRef]
  41. Marti, C.; Jürgens, O.; Cuenca, O.; Casals, M.; Nonell, S. Aromatic ketones as standards for singlet molecular oxygen photosensitization. Time-resolved photoacoustic and near-IR emission studies. J. Photochem. Photobiol. A Chem. 1996, 97, 11–18. [Google Scholar] [CrossRef]
  42. Rappé, A.K.; Casewit, C.J.; Colwell, K.S.; Goddard, W.A., III; Skid, W.M. UFF, a Full periodic table force field for molecular mechanics and dynamics simulations. J. Am. Chem. Soc. 1992, 114, 10024–10035. [Google Scholar] [CrossRef]
Figure 1. (A): Synthesis of FN10. (B): Normalized absorption (black line) and fluorescence excitation (red line) spectra of FN10 in methanol. (C): Normalized fluorescence spectrum.
Sensors 23 04603 g001
Figure 2. (A): Oxidation of FN10 with 1O2. (B): Absorbance changes upon the reaction of FN10 with 1O2. (C): Fluorescence changes upon the reaction of FN10 with 1O2. Inset: Fluorescence intensity enhancement at 400 nm. Note the blue shift and strong fluorescence increase. 1O2 was generated by photosensitization with new methylene blue (5 μM at 640 ± 10 nm). The experiments were carried out in aerated methanol. The fluorescence was excited at 335 nm to produce the highest enhancement.
Sensors 23 04603 g002
Figure 3. Spectra of FN10-ox in methanol. (A): Normalized absorption (black line) and excitation spectra (red line). (B): Fluorescence spectrum.
Sensors 23 04603 g003
Scheme 1. Synthesis and derivatization of NanoFN10 and NanoFN10RB.
Sensors 23 04603 sch001
Figure 4. (A): Normalized emission spectra of nanoFN10 (λexc = 335 nm). (B): Normalized excitation spectra of nanoFN10 (λobs = 450 nm). (C): NanoFN10 emission spectra changes upon reaction with 1O2exc = 335 nm). The photosensitizer used was new methylene blue 5 μM, the irradiation wavelength was 640 ± 10 nm, and the experiment was carried out in aerated methanol. (D): NanoFN10 fluorescence enhancement kinetics at λobs = 400 nm.
Sensors 23 04603 g004
Figure 5. FN10 fluorescence images obtained by excitation with two-photon absorption (λexc = 720 nm; λobs = 450–540 nm) before (A) and after (C) reacting with 1O2. In both images, two regions are observed: the dark one on the left corresponds to an air bubble while the right one corresponds to FN10/FN10-ox methanolic solution. The circles indicate the region used to quantify the emission intensity. (B): Normalized FN10 one-photon absorption (black line) and two-photon fluorescence excitation (red line) spectra. (D): Two-photon fluorescence intensity corresponding to the air bubble, FN10 and FN10-ox (before and after reacting with 1O2, respectively).
Sensors 23 04603 g005
Figure 6. (A): Fluorescence images of N13 microglia cells incubated with nanoFN10RB. The images in the left column are before photoirradiation, and those in the right column were taken after 700-s photoirradiation using different 561-nm power laser intensities. The length of the scale bar is 10 μm. (B): NanoFN10RB fluorescence enhancement kinetics as a function of the 561-nm laser power intensity (0%, 4%, and 8%; black, blue, and green lines, respectively). Open bars represent the mean SD for 20 independent NP systems where only the mean pixel intensity of the images is considered.
Sensors 23 04603 g006
Table 1. Photophysical properties of FN10 and FN10-ox in methanol.
FN10
λabs/nm363
ε/cm−1M−14.3 × 104
λflu/nm439
ΦF0.005
ΦΔ0.003
kq/M−1s−13.0 × 107
kr/M−1s−11.7 × 107
FN10-ox
λabs/nm335
λflu/nm405
Fluorescence enhancement180 (at 400 nm)
Disclaimer/Publisher’s Note: The statements, opinions and data contained in all publications are solely those of the individual author(s) and contributor(s) and not of MDPI and/or the editor(s). MDPI and/or the editor(s) disclaim responsibility for any injury to people or property resulting from any ideas, methods, instructions or products referred to in the content.

