Abstract
Precision magnetic field measurement is widely used for practical applications, fundamental research, and medical purposes, etc. We propose a novel quantum magnetometer based on atoms’ multi-wave (3-wave and 5-wave) Ramsey interference. Our design features high phase sensitivity and can be applied to in situ measurements of the magnetic field inside vacuum chambers. The final state detection is designed to be achieved by Raman’s two-photon transition. The analytical solution for applicable interference fringe is presented. Fringe contrast decay due to atom temperature and magnetic field gradient is simulated to estimate reasonable experimental conditions. Sensitivity functions for phase noise and magnetic field noise in a multi-wave system are derived to estimate the noise level required to reach the expected resolution. The validity of the model, dual-channel features on bias estimation, and the quasi-non-destructive detection feature are discussed.
1. Introduction
Magnetic field sensing is widely used in resource exploration [1,2], archaeology [3,4], and the medical domain [5,6,7,8,9], etc. In addition to the industrial application, measuring the magnetic field plays a key role in fundamental research [10], aerospace [11,12,13], and geophysics [14], etc. In metrology, countless experiments are related to the Zeeman effect. For example, it is important to estimate the magnetic-field-induced systematic uncertainty in atom clocks [15] and atom interferometers [16,17,18].
The required resolution for resource exploration or geophysical survey is at least a nanotesla [1]. Amplitudes of various biomagnetism signals go much further. For example, magnetoencephalography [19] and magnetocardiography [20] require resolution on a scale of femtoteslas. Optically pumped atomic magnetometers [21,22] and SQUID [23] have proven their sensitivity to femtotesla and even sub-femtotesla. Among these state-of-the-art magnetometers, atom magnetometers [6,7,8,9,12,13,20,24,25,26] have been developed for decades. Thermal atom sources lack spatial resolution and control of motion and have a long coherence time. Cold atom sources [27,28,29,30] are expected to make up for these shortages.
Several research groups have realized magnetic field measurement using ultra-cold atomic ensembles. Vengalattore et al. [30] reached a highly sensitive result of magnetic field mapping converted from field-dependent spatial amplitude distribution. Eto et al. [31] measured Larmor frequencies from interferometric fringes and observed the variance of spin to extract information about the magnetic field. Muessel et al. [32] demonstrated quantum-enhanced magnetometry with spin squeezed states in an effective two-level system, leading to a resolution ∼20% better than the standard quantum limit. These magnificent works demonstrated results pointing to the cutting edge of atom magnetometry.
An alternative way to increase measurement sensitivity is to take advantage of the increased fringe slopes in a multi-wave interferometer. Multi-wave interferometers [29,30,33,34,35,36,37] feature higher fringe slopes [38], leading to higher sensitivity and multiple observation ports containing more rich information. There have been some experimental results [39,40] on measuring magnetic fields with Raman two-photon interferometric methods in a two-level system. Experiments [29,30,35,41] have presented interference employing one-photon direct coupling or Raman two-photon coupling [42] in a multilevel system. We focus on the study of magnetometry in a multilevel system by RF coupling.
Here we combine the methodology of atom interferometry, especially the interferometer phase analysis [43], with atom magnetometry. Furthermore, we make use of all spin states on the hyperfine levels. As an example of the ground states in of , by preparing the initial state with atoms in both and states, a dual multi-wave interferometer is proposed. The atom source, the initial state preparation and the final state detection in the proposed scheme can be achieved optically. Our design can be applied to the in situ measurement of the magnetic field inside a vacuum chamber.
Our paper is organized as follows. First, we present the modeling in Section 2. Second, in Section 3, phase behavior applicable to magnetic field measurements and the expected resolution are presented. Third, in Section 4, reasonable experimental conditions are presented. Fourth, in Section 5, sensitivity functions to phase noise and magnetic field noise are demonstrated, deducing the required noise level for precision measurement. In the end, discussions about the relationship to the existing atom magnetometers, features for dual-channel magnetometers, multi-state detection and conclusions are presented.
2. Modeling
The level scheme and the sequence of the dual atom magnetometer are depicted in Figure 1. The sequence starts with a cold atom ensemble containing and states. This can be achieved by adjusting the repumper (for the transition) parameter as the intensity or duration, or in a coherent way by employing microwave or Raman transition between and states. The fraction of atoms in and systems form the two-atom interference magnetometers (AIM). We use the RF signal to perform Ramsey interference [44] between spin levels and then realize spatial separation by a magnetic field gradient pulse. The atoms of are detected first by resonant absorption imaging. After that, assisted by a microwave or Raman [45] pulse to probe atoms in one specific state, the interference fringe in the system is detected. Similar to the Ramsey interference in a two-wave system, in a multi-wave system, in our case, the relative phase shift between the RF signal and the magnetic-field-induced phase during evolution time T pushes atoms to one or the other levels, producing the fringes that can be read by the second RF pulse.
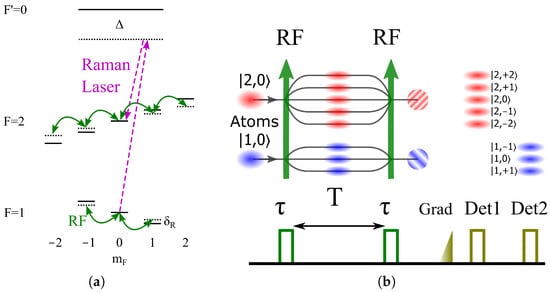
Figure 1.
The level scheme (a) and the time sequence (b) of a dual multi-wave atom magnetometer. (a) RF radiation couples different spin states. Raman transition couples states. For clarity, only state is sketched. (b) Two RF pulses of duration to couple spin levels and free evolution time T form Ramsey interference in the presence of a magnetic field . After a pulse of the magnetic field gradient, the fringes of are read at detection step 1, and those of are then read at detection step 2.
The conceptual design of the proposed scheme is sketched in Figure 2. The facilities of atom cooling lasers and Raman lasers are reported in Ref. [46]. Atom clouds are freely falling during the sequence. Raman lasers can be used for spin-specific detection in the system in detection step 2 in Figure 1.
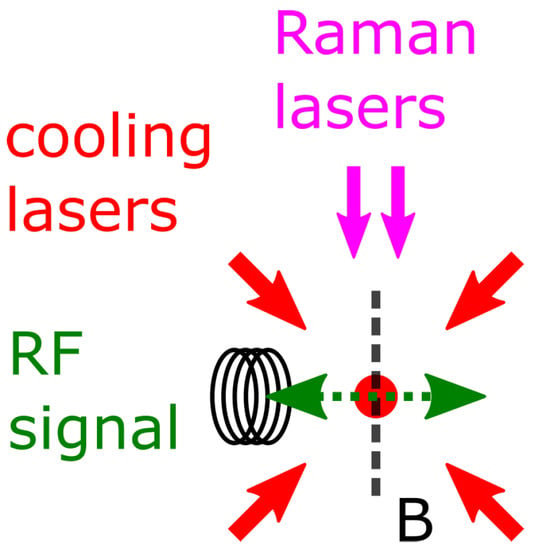
Figure 2.
Conceptual setup. Cooling lasers and Raman lasers are pointing to the atom cloud. At the position of the atom cloud, the RF oscillating signal is perpendicular to the bias magnetic field . Raman lasers are parallel to the field.
Similar to the theoretical framework of Refs. [47,48], when atoms are subjected to the homogeneous magnetic field , considering the first-order Zeeman effect, the Zeeman levels differ between each other, where is the magnetic dipole moment. We use an oscillating RF signal with the form to couple the spin levels, where is the RF wave amplitude, is the RF circular frequency, is the RF wave initial phase and indicates the direction. The direction of is taken as the quantization axis. is linearly polarized and is perpendicular to . The RF phase enables the later phase noise analysis.
Different from Ref. [35], we build the interferometer by using atoms in the state. Different from Ref. [29], the proposed scheme provides an option to use atoms in both F systems. The calculation in Appendix A demonstrates the reason for choosing the state as the initial state.
3. Multi-Wave Ramsey Interference
A typical Ramsey sequence consists of one excitation pulse, a period of free evolution and a final readout pulse for interference fringe. The excitation pulse and the readout pulse are described by , as in Equations (A4) and (A5). The transfer matrices describing the free evolution are diagonal, with matrix elements , where corresponds to the diagonal elements of Equations (A2) and (A3). The matrix forms are Equation (A11) for and Equation (A12) for . The interferometer phase , indicating the relative phase shift between the RF signal and the magnetic-field-induced phase during free evolution time T, is expressed as
The output of the Ramsey interferometer is
First of all, we calculate the center state interferometer fringes as a function of pulse area and interferometer phase . From Figure 3, for pulse area close to , during of , the fringes evolve with full contrast by one period. Only for pulse area close to , the fringe evolution periodicity is doubled, leading to higher fringe slopes. Within expectation, the fringes in the system are sharper than those in the system, as compared to the width of varying colors in Figure 3a,b. We choose the typical experimental parameters as pulse area of and , which are more like pulse and pulse in a two-level system, for the next step of the analysis.

Figure 3.
Ramsey fringes observed on state setting parameters as pulse area and interferometer phase in the (a) system and in the (b) system. Colorbars indicate the probability.
In the system, according to Figure A1b, a pulse spreads all atoms to states. Observation on output will present a zero population. If we set the pulse area to , a minimum as a dark fringe is expected at the Ramsey fringe center, where the interferometer phase is zero. On the contrary, in Figure A1b, a pulse recovers the full population on . If we set the RF pulse area to , a maximum as a bright fringe is expected at the Ramsey fringe center. The interferometer phase behavior on is expressed in Equations (2) and (3) and plotted in Figure 4. The evolution time T is set to for demonstration.
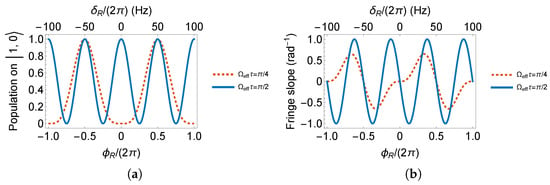
Figure 4.
(a) Ramsey fringes and (b) its slopes on .
From Figure 4, we can see that the phase of a Ramsey interferometer with two pulses evolves twice as fast as the one with two pulses.
In the case of , same as in system, two pulses produce a bright fringe center. Different to the case in , the fringe center with two pulses is no longer a zero population point. According to Figure A1d and the component in Equation (A10), the full population inversion occurs when . Therefore, we set as , noted as , to produce a dark fringe center. Phase behavior of pulse area of , and are listed in Equations (4)–(6) and plotted in Figure 5.

Figure 5.
(a) Ramsey fringes and (b) its slopes on .
The fringe slopes in Figure 4b and Figure 5b are, respectively, , , , , . We conclude that if is chosen to measure the magnetic field by the RF Ramsey method, conditions such as the initial state prepared on , observation on and pulse area of yield the highest fringe slope, resulting in the most sensitive measurement.
The fringes are periodic with the interferometer phase . To determine the fringe center, where , one can vary the free evolution time T in the Ramsey sequence. The fringe center is overlapped independent of evolution time T in Figure 6a. Although the fringes in a multi-wave interferometer are complicated, near the regime of the highest fringe slope, the change in the readout probability is linear to the change in the interferometer phase, as demonstrated in Figure 6b.
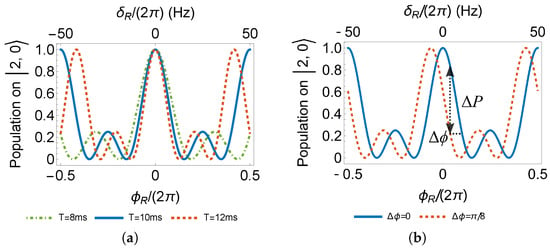
Figure 6.
(a) Determination of fringe center with different evolution time T. (b) Demonstration of fringe slope linearity to interferometer phase shift.
The resolution limit of magnetic field measurement is
where is the uncertainty limited by quantum projection noise [49] and P is the probability of detecting atoms at certain interferometer output, i.e., the phase behavior. Taking the calculated fringe slope of Equation (6), we can see from Figure 7 that preparing the initial state on with atoms, employing two pulses, and a free evolution time of is enough to reach a one-shot resolution of magnetic field. Under the same condition, using the microwave to measure the Zeeman shift between and results in one shot resolution of , as the dashed line in Figure 7. Despite the advantage in measurement resolution, atom species besides with a hyperfine ground state of more than five Zeeman levels can produce a fringe slope higher than the demonstration in this paper, leading to better resolution. With optimal conditions such as an atom number of , in principle, for free evolution is expected to attain the resolution limit of per shot. In the free-falling configuration, the free evolution time of requires a path of more than ! Rather than increasing the evolution time, increasing the atom number would be the proper strategy. Otherwise, the long evolution time limits the application to microgravity. In addition, the trapped configuration in Section 6.3 also provides a method for a long evolution time.
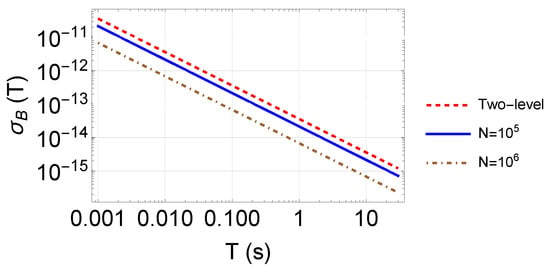
Figure 7.
One-shot resolution to magnetic field measurement. The pulse area is , and Equation (6) is chosen as the detection port. The red dashed line as the comparison basis is the resolution employing a microwave in a two-level system.
The noise floor limited by the quantum projection noise reaches the level of state-of-the-art magnetometers. The required resolution for resource exploration or geophysical survey is at least a nanotesla [1]. Amplitudes of various biomagnetism signals go much further. For example, magnetocardiography [6,20] and magnetoencephalography [19] require resolution on a scale of picoteslas or even femtoteslas. To reach the one-shot resolution of , reasonable experimental conditions and noise analysis before the experiment should be considered.
4. Experimental Condition
In addition to the atom number , which limits the noise floor, as shown in Figure 7, the atom temperature and the effect related to it, such as the magnetic field gradient, should also be considered.
Due to the finite temperature of atoms [46,50,51], the expansion of the atom cloud and the magnetic field gradient are coupled to bring decoherence to the Ramsey interference, leading to a decrease in the fringe contrast. Because of the magnetic field gradient and the spatial distribution of the atoms in the atom cloud, each atom experiences a different variation of the magnetic field during the free fall.
We use the normal distribution as the distribution of position and momentum for atoms in an atom cloud. During the free fall, we calculate the atom trajectory and, thus, the magnetic field variation and then calculate the probability of detection for each atom. The outcome of the interference is the average of each atom’s probability. Details of the calculation are presented in Appendix B.
From the result in Figure 8a, setting the free-falling time as , with an atom temperature of , to keep the contrast higher than , the magnetic field gradient is required to be less than . The colder the atom temperature, the higher the tolerance to the B field gradient. This effect is more obvious for higher free falling time. In Figure 8b, for an atom temperature of , with free falling time of , the B field gradient is required to be lower than . In a metal vacuum chamber, with a conventional cooling technique such as optical molasses reaching 1 K, a magnetic field gradient such as [52] can wash out the interference fringe for free falling time, reaching the level of .
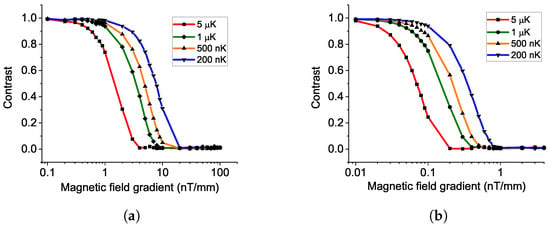
Figure 8.
Decrease in fringe contrast by magnetic field gradient and atom temperature in free falling condition, with an evolution time of (a) and (b) .
Experimentally, a scan for the magnetic field along the atomic trajectory is helpful in probing the homogeneity of the magnetic field inside atom interference devices [39,52].
There is a trade-off between atom number and atom temperature in the evaporation cooling technique. Meanwhile, the quantum projection noise affected by the atom number limits the noise floor. The atom temperature and the magnetic field gradient are coupled to limit the fringe contrast. With overall consideration of designing an experiment aiming for the one-shot resolution of , we show the recommended experimental conditions in Table 1.

Table 1.
Conditions required aiming for a magnetic field measurement one-shot resolution of .
The required atom number and temperature are conventional for results that achieved evaporation cooling producing BEC [46,53,54]. Still, there is plenty of room compared to the world’s top-level result [55]. The requirement on the B field gradient can be verified by the method from Refs. [39,52].
5. Noise Estimation
In this section, we present noise analysis in the proposed multi-wave atom interference magnetometer with the demonstration of a sensitivity function in a three-wave system and the resulting noise budget list.
5.1. Sensitivity Function in Three-Wave System
We deduce the sensitivity functions to the two most common noises affecting the measurement resolution, the phase noise of RF and the ambient high-frequency magnetic field noise. According to Ref. [43], the sensitivity function to phase noise is defined as Equation (8). Following the calculation sequence in Ref. [56] to insert phase noise in the quantum state of each step in the Ramsey sequence, as listed from Equation (A15) to Equation (A17), is shown as Equation (9) and is sketched in Figure 9.
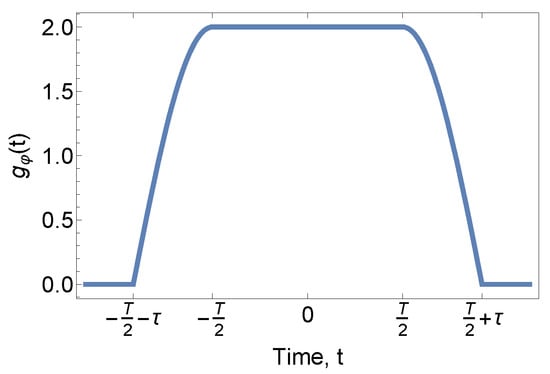
Figure 9.
Sensitivity function for RF phase noise.
The sensitivity function for phase noise in Figure 9 is two times that in a typical two-level system [43] because the phase evolution is doubled, as in Equation (3). This maintains consistency with the fringe slope result in the previous section. Equation (9) is the exact phase noise sensitivity function in the system. For the system, the resulting sensitivity function can be approximated by scaling the fringe slope or can be calculated from scratch with Equation (8).
The transfer function of RF phase noise , Equation (A23), can be obtained from times the Fourier transform of the sensitivity function , Equation (A22). According to the relationship between phase noise and the magnetic field noise as in Equation (10) from Ref. [57], the transfer function of the magnetic field noise is Equation (A24).
The phase uncertainty due to noise can be evaluated by
Aiming at a resolution goal of with sensitivity as high as possible, supposing the noise spectrum as white noise from to , by applying Equation (11), the phase noise is required to reach and the magnetic field noise is required to reach .
5.2. Noise Budget
In addition to the RF phase noise or magnetic field noise, [45] the detection noise coming from the detection beams and the noise when employing Raman transition at the final step in Figure 1, for example, should also be considered. These types of noise act as in Equation (7) to contribute to the overall statistical noise.
In Table 2, the requirement for RF phase noise is conventional according to Ref. [58]. For the requirement of magnetic field noise, there is room compared to the ambient magnetic field noise, roughly [21]. The detection noise is demonstrated in Ref. [45]. Table 2 estimates the noise-limited resolution per shot. The cycle time , including the duration for MOT-loading and atom evaporation is of the order of , as shown in Ref. [46]. The estimated resolution at is thus multiplied by . The shot-by-shot operation mode, together with the need for a long integration time to lower the statistical noise if necessary, limits the expected sensitivity and the frequency range of the measurement to DC or near DC.

Table 2.
List of noise sources and their estimated effect on one-shot resolution.
6. Discussion
6.1. Validity of the Model
When choosing RF pulses to form the magnetometer, the contribution of the oscillating RF field to the total magnetic field must be considered. Projected to the quantization axis, can be decomposed to and , respectively, perpendicular and parallel to the quantization axis. By analogy, with the AC stark shift from an oscillating electric field, an oscillating magnetic field causes an energy shift. The energy shift caused by and can be measured according to Ref. [59].
The calculation is based on the RWA approximation, supposing . The condition to the RWA approximation is the weak coupling condition [60]. Together with the strong driving condition , the validity of the analytical results is under the overall condition . The real constraint is between and the amplitude of B, especially close to or below the level of . As reported in Ref. [61], to measure the magnetic field of ∼, a single ∼ RF pulse of duration reveals a Rabi frequency in the order of . For the calculation, one can always set near zero and a low Rabi frequency to meet the overall condition. However, such a low Rabi frequency is not considered experimentally common because the longer the pulse duration, the more sources of decoherence kick in. The strong-coupling regime where is out of the scope of the article.
6.2. Systematic Bias Estimation
In our modeling and demonstrated calculation, only the first-order Zeeman effect is considered. Taking into account the second-order Zeeman effect, together with the difference of first-order Zeeman coefficients between the system of and of , different phase shifts in each channel of the dual atom-magnetometer will be measured as systematic bias. The more detailed Zeeman shifts [62] are given by
and
where , , and . When performing measurements using our dual magnetometer proposal, and without spatial separation of atom wave packets during initial state preparation, the observed different fringe shifts reveal the difference of Zeeman effect coefficients.
6.3. Trapped Configuration
The proposed magnetometer and the noise analysis are demonstrated with the free-falling configuration. Experiments can be conducted in an optical dipole trap or in a zero-gravity environment to increase the B variance tolerance. It should be noted that in an optical dipole trap, spin-dependent interactions [63,64,65] should be considered. In a magnetic trap, atoms only stay in the trap with low-field-seeker states. Forced use of the RF Ramsey sequence results in atom loss [41], leading to a fast reduction in fringe contrast. The quality of the state preparation should also be considered. Similar to the state preparation in atom clocks [66], atoms in states other than cause a reduction in fringe contrast. A proper optical pumping scheme [67] without significant atom losses is suggested. Spin-dependent interactions, together with the stability of the ambient magnetic field and temperature of atoms, bring a challenge to the long coherence time.
6.4. Quasi-Non-Destructive Detection
Excluding the non-resonant phase-contrast imaging method [68], just by employing the most common resonant absorption imaging method, in our proposed sequence, after detecting the atoms in system, a microwave or Raman pulse transfers atoms in the state to the state for absorption detection. Therefore, only the state is destroyed. The remained quantum state is able to provide the quantum superposition facility without the necessity for one more instance of state preparation. An extended free evolution time and a readout pulse can reveal the fringe pattern for further steps. This brings the possibility of a continuous quasi-non-destructive experimental study of magnetic field effects in one shot, increasing the detection efficiency.
7. Conclusions
We have presented the proposal for a novel quantum magnetometer based on atoms’ multi-wave Ramsey interference, coupled by RF radiation. We have demonstrated the applicable interference fringes, which are essential for the next step of precision magnetic field measurements. Assuming a target resolution of , we have demonstrated reasonable experimental conditions, including atom status and the effect of the magnetic field gradient. The sensitivity functions in a multi-wave system are deduced to estimate the noise budget for the target resolution. The validity of the model and the trapped configuration are also discussed. Moreover, the dual-channel configuration features bias estimation and state detection with high efficiency. The dual-channel design makes it possible to adjust the ratio of atoms in each channel, meeting the different experimental requirements between sensitivity and functionality. As an alternative method for magnetic field sensing, especially in DC and low-frequency range, the proposal can be compared to the existing magnetometers to extend the study in the domain of magnetometry and atom interferometry.
Author Contributions
Conceptualization, M.Z.; data curation, W.Y.; formal analysis, W.Y.; funding acquisition, M.Z.; methodology, W.Y. and M.Z.; project administration, M.Z.; software, W.Y.; supervision, M.Z. and Z.H.; validation, W.Y. and X.R.; writing—original draft, W.Y.; writing—review and editing, W.Y., X.R., and M.Z. All authors have read and agreed to the published version of the manuscript.
Funding
This study was funded by the National Natural Science Foundation of China (Grants No. 11922404, No. 11727809, No. 11625417, No. 12004128, No. 12104174 and No. 12274163) and the National Key Research and Development Program of China (Grant No. 2020YFC2200200).
Data Availability Statement
Codes and data are available upon reasonable requests from the authors.
Acknowledgments
The authors would like to thank Xiao-chun DUAN, Qin LUO and Lu-shuai CAO for the enlightening talk about this work.
Conflicts of Interest
The authors declare no conflict of interest. The funders had no role in the design of the study; in the collection, analyses, or interpretation of data; in the writing of the manuscript; or in the decision to publish the results.
Appendix A. Rabi Oscillation
The evolution of the system is the solution to the rotating-wave-approximation (RWA) time-dependent Schrödinger equation
where is the N-level state vector, respectively, containing the amplitudes for , , spin states, and containing the amplitudes for , , , , spin states.
The Hamiltonian for a three-level atom-photon system is demonstrated in Ref. [34]. The one for a five-level system is demonstrated in Ref. [26]. Taking Ref. [48] as the reference, in this paper, the Hamiltonians to describe the multilevel system of Rb are Equation (A2) for and Equation (A3) for , where , , is the Bohr magneton and is the Rabi frequency quantifying the coupling strength.
Different from Refs. [47,48], in the coupling terms of Equations (A2) and (A3), there is an additional phase factor . We use this phase to insert phase jumps to perform noise analysis under the framework of the atom interferometer in Section 5. This phase is close to that in Ref. [26]. Equation (A2) is close to the result in Ref. [34], which contains an extra phase factor from the AC stark shift.
Under the strong driving condition, , after employing the techniques in Ref. [47], the time evolution transfer matrix of Equations (A2) and (A3) are Equations (A4) and (A5), where .
where the column vectors S are
Due to the equality feature of trigonometric identities, different forms of Equations (A4) and (A5) exist. We present here the power-reduced forms, which easily reveal the state evolution periodicity.
Equations (A4) and (A5) describe the state of evolution when atoms are shined by RF radiation. Knowing the state at any time t as , after radiation duration , the state is
where can be or . In this way, the Schrödinger differential equation becomes a one step matrix operation.
We evaluate the Rabi oscillation with different pulse duration . The population of atoms on each spin state can be obtained from the modulo square of each component of . Experimentally, the initial quantum state can be easily prepared at a side state, the highest or the lowest state, or a center state, the state. Thus, we demonstrate these two situations. The Rabi oscillation in the system when the initial state is and are Equations (A7) and (A8). Respectively, the Rabi oscillation for the system when the initial state is and are Equations (A9) and (A10). We compare the results sketched in Figure A1.
With state initialization on ,
With state initialization on
With state initialization on
With state initialization on
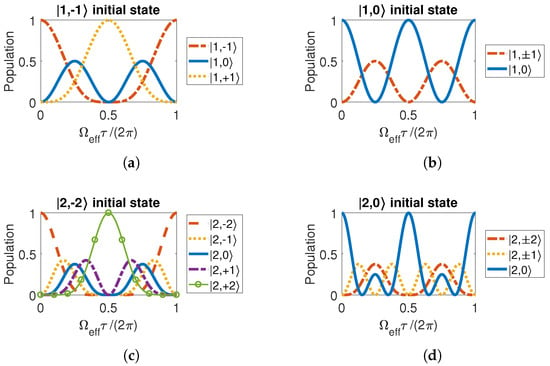
Figure A1.
Rabi oscillations in the system when the initial state is a (a) side state and a (b) center state. Rabi oscillations in the system when the initial state is a (c) side state and a (d) center state.
There are several features in Figure A1. First, not all the states are linear transformations of the sine function, especially in the h system. In the case of , the eigenvalues of are 0, and . The evolution is complicated by the wave frequencies and high harmonics in wave functions of the different matter. Second, when the initial state is a side state, only the two opposite side states have a full population inversion. The pulse area needed for the inversion is and one cycle is . Meanwhile, although the center state does not reach a complete population inversion, the periodicity is two times as fast as that of the side states. Third, if and only if the atoms are prepared in the center state, their evolution frequency is doubled and a complete population inversion is kept. The pulse area for one cycle is instead of . The last feature is important for producing an interference fringe with full contrast and with a high fringe slope in an atom interferometer. The fringe slopes in the next section prove this feature. The highest fringe slope can be obtained when preparing an initial center state.
Appendix B. Simulation of Fringe Contrast Decay
We use the normal distribution as the distribution of position and momentum for atoms in a thermal atom cloud. At time , the standard deviation in position space is related to the initial radius of the atoms , and the standard deviation in momentum space is related to the atom temperature as . During the free fall, due to the distribution in momentum space, the distribution in position space is expanding, as shown in Figure A2a, leading to the expansion of the atom cloud, which can be characterized by Equation (A13). The magnetic field felt by each atom during the free fall can be calculated by the position and the field gradient. The time sequence is divided by finite elements with a duration of s.
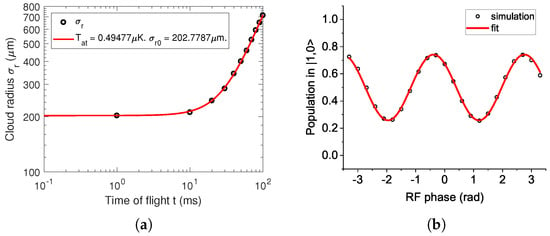
Figure A2.
(a) Simulation of expansion of atom cloud during free fall, the red fitted line shows the atom temperature of and initial cloud radius of m. (b) Simulation of decay of fringe contrast for a thermal atom cloud employed by Ramsey sequence of two pulses.
After repeating the Ramsey sequence calculation for each atom, as we demonstrated in Section 3, we obtain the resulting probability as the mean value of the probability of each atom. By scanning the RF phase, the decay of the fringe contrast is observed by the simulated fringe, as shown in Figure A2b. We set the bias magnetic field as , and its direction is along the gravity. The assumed magnetic field gradient in three dimensions is uniform.
Appendix C. Calculation of Sensitivity Function in Section 5
The details of the calculation of phase noise sensitivity function in a three-level system are listed below.
In a Ramsey sequence consisting of two pulses with pulse area of and a free evolution time T centered at time , the three time periods are from to , from to , and from to . We determine in the system, with state initialization on , at the output point on Ramsey fringe of the state, as shown in Figure 4a. The output point is achieved by setting in the pulse steps and during the free evolution time. The RF phase noise is defined as a phase step from 0 to at time t during the Ramsey sequence.
Under these conditions, when the phase step occurs during the first pulse, from to , the final state is calculated as Equation (A15). The probability at output is Equation (A16).
According to the definition of Equation (8), the resulting phase noise sensitivity function with noise inserted during the first pulse is Equation (A19).
The final state with phase noise inserted during the free evolution is Equation (A20), and the calculated probability is Equation (A21). The phase step that occurred at any time t during the free evolution is considered a phase shift at the start of the second pulse. For this physics reason, there is no step split caused by inserting the phase noise into Equation (A20).
References
- Gavazzi, B.; Maire, P.L.; de Lépinay, J.M.; Calou, P.; Munschy, M. Fluxgate three-component magnetometers for cost-effective ground, UAV and airborne magnetic surveys for industrial and academic geoscience applications and comparison with current industrial standards through case studies. Geomech. Energy Environ. 2019, 20, 100117. [Google Scholar] [CrossRef]
- Hato, T.; Tsukamoto, A.; Adachi, S.; Oshikubo, Y.; Watanabe, H.; Ishikawa, H.; Sugisaki, M.; Arai, E.; Tanabe, K. Development of HTS-SQUID magnetometer system with high slew rate for exploration of mineral resources. Supercond. Sci. Technol. 2013, 26, 115003. [Google Scholar] [CrossRef]
- Fassbinder, J.W.E. Magnetometry for Archaeology; Springer: Dordrecht, The Netherlands, 2017; pp. 499–514. [Google Scholar] [CrossRef]
- Schultze, V.; Linzen, S.; Schüler, T.; Chwala, A.; Stolz, R.; Schulz, M.; Meyer, H.G. Rapid and sensitive magnetometer surveys of large areas using SQUIDs – the measurement system and its application to the Niederzimmern Neolithic double-ring ditch exploration. Archaeol. Prospect. 2008, 15, 113–131. [Google Scholar] [CrossRef]
- Kuwahata, A.; Kitaizumi, T.; Saichi, K.; Sato, T.; Igarashi, R.; Ohshima, T.; Masuyama, Y.; Iwasaki, T.; Hatano, M.; Jelezko, F.; et al. Magnetometer with nitrogen-vacancy center in a bulk diamond for detecting magnetic nanoparticles in biomedical applications. Sci. Rep. 2020, 10, 2483. [Google Scholar] [CrossRef]
- Bison, G.; Wynands, R.; Weis, A. A laser-pumped magnetometer for the mapping of human cardiomagnetic fields. Appl. Phys. B 2003, 76, 325–328. [Google Scholar] [CrossRef]
- Jensen, K.; Skarsfeldt, M.A.; Stærkind, H.; Arnbak, J.; Balabas, M.V.; Olesen, S.P.; Bentzen, B.H.; Polzik, E.S. Magnetocardiography on an isolated animal heart with a room-temperature optically pumped magnetometer. Sci. Rep. 2018, 8, 16218. [Google Scholar] [CrossRef]
- Xia, H.; Ben-Amar Baranga, A.; Hoffman, D.; Romalis, M.V. Magnetoencephalography with an atomic magnetometer. Appl. Phys. Lett. 2006, 89, 211104. [Google Scholar] [CrossRef]
- Zhang, R.; Xiao, W.; Ding, Y.; Feng, Y.; Peng, X.; Shen, L.; Sun, C.; Wu, T.; Wu, Y.; Yang, Y.; et al. Recording brain activities in unshielded Earth’s field with optically pumped atomic magnetometers. Sci. Adv. 2020, 6, eaba8792. [Google Scholar] [CrossRef]
- Chacon, A.; Heinen, L.; Halder, M.; Bauer, A.; Simeth, W.; Mühlbauer, S.; Berger, H.; Garst, M.; Rosch, A.; Pfleiderer, C. Observation of two independent skyrmion phases in a chiral magnetic material. Nat. Phys. 2018, 14, 936–941. [Google Scholar] [CrossRef]
- Carletta, S.; Teofilatto, P.; Farissi, M.S. A Magnetometer-Only Attitude Determination Strategy for Small Satellites: Design of the Algorithm and Hardware-in-the-Loop Testing. Aerospace 2020, 7, 3. [Google Scholar] [CrossRef]
- Korth, H.; Strohbehn, K.; Tejada, F.; Andreou, A.G.; Kitching, J.; Knappe, S.; Lehtonen, S.J.; London, S.M.; Kafel, M. Miniature atomic scalar magnetometer for space based on the rubidium isotope 87Rb. J. Geophys. Res. Space Phys. 2016, 121, 7870–7880. [Google Scholar] [CrossRef] [PubMed]
- Dunlop, M.; Dougherty, M.; Kellock, S.; Southwood, D. Operation of the dual magnetometer on Cassini: Science performance. Planet. Space Sci. 1999, 47, 1389–1405. [Google Scholar] [CrossRef]
- Lockwood, M.; Owens, M.J.; Barnard, L.A.; Scott, C.J.; Watt, C.E.; Bentley, S. Space climate and space weather over the past 400 years: 2. Proxy indicators of geomagnetic storm and substorm occurrence. J. Space Weather Space Clim. 2018, 8, A12. [Google Scholar] [CrossRef]
- Ovchinnikov, Y.; Marra, G. Accurate rubidium atomic fountain frequency standard. Metrologia 2011, 48, 87–100. [Google Scholar] [CrossRef]
- Gillot, P.; Cheng, B.; Merlet, S.; Pereira Dos Santos, F. Limits to the symmetry of a Mach-Zehnder-type atom interferometer. Phys. Rev. A 2016, 93, 013609. [Google Scholar] [CrossRef]
- Wu, B.; Wang, Z.; Cheng, B.; Wang, Q.; Xu, A.; Lin, Q. The investigation of a μGal-level cold atom gravimeter for field applications. Metrologia 2014, 51, 452–458. [Google Scholar] [CrossRef]
- Hu, Q.Q.; Freier, C.; Leykauf, B.; Schkolnik, V.; Yang, J.; Krutzik, M.; Peters, A. Mapping the absolute magnetic field and evaluating the quadratic Zeeman-effect-induced systematic error in an atom interferometer gravimeter. Phys. Rev. A 2017, 96, 033414. [Google Scholar] [CrossRef]
- Baillet, S. Magnetoencephalography for brain electrophysiology and imaging. Nat. Neurosci. 2017, 20, 327–339. [Google Scholar] [CrossRef]
- Zheng, W.; Su, S.; Zhang, G.; Bi, X.; Lin, Q. Vector magnetocardiography measurement with a compact elliptically polarized laser-pumped magnetometer. Biomed. Opt. Express 2020, 11, 649–659. [Google Scholar] [CrossRef]
- Keder, D.A.; Prescott, D.W.; Conovaloff, A.W.; Sauer, K.L. An unshielded radio-frequency atomic magnetometer with sub-femtoTesla sensitivity. AIP Adv. 2014, 4, 127159. [Google Scholar] [CrossRef]
- Li, J.; Quan, W.; Zhou, B.; Wang, Z.; Lu, J.; Hu, Z.; Liu, G.; Fang, J. SERF Atomic Magnetometer–Recent Advances and Applications: A Review. IEEE Sens. J. 2018, 18, 8198–8207. [Google Scholar] [CrossRef]
- Schmelz, M.; Stolz, R.; Zakosarenko, V.; Schonau, T.; Anders, S.; Fritzsch, L.; Mück, M.; Meyer, H.G. Field-stable SQUID magnetometer with sub-fT Hz-1/2 resolution based on sub-micrometer cross-type Josephson tunnel junctions. Supercond. Sci. Technol. 2011, 24, 065009. [Google Scholar] [CrossRef]
- Bevington, P.; Gartman, R.; Botelho, D.J.; Crawford, R.; Packer, M.; Fromhold, T.M.; Chalupczak, W. Object surveillance with radio-frequency atomic magnetometers. Rev. Sci. Instrum. 2020, 91, 055002. [Google Scholar] [CrossRef] [PubMed]
- Pyragius, T.; Florez, H.M.; Fernholz, T. Voigt-effect-based three-dimensional vector magnetometer. Phys. Rev. A 2019, 100, 023416. [Google Scholar] [CrossRef]
- Weis, A.; Bison, G.; Pazgalev, A.S. Theory of double resonance magnetometers based on atomic alignment. Phys. Rev. A 2006, 74, 033401. [Google Scholar] [CrossRef]
- Fregosi, A.; Gabbanini, C.; Gozzini, S.; Lenci, L.; Marinelli, C.; Fioretti, A. Magnetic induction imaging with a cold-atom radio frequency magnetometer. Appl. Phys. Lett. 2020, 117, 144102. [Google Scholar] [CrossRef]
- Cohen, Y.; Jadeja, K.; Sula, S.; Venturelli, M.; Deans, C.; Marmugi, L.; Renzoni, F. A cold atom radio-frequency magnetometer. Appl. Phys. Lett. 2019, 114, 073505. [Google Scholar] [CrossRef]
- Sadgrove, M.; Eto, Y.; Sekine, S.; Suzuki, H.; Hirano, T. Ramsey Interferometry Using the Zeeman Sublevels in a Spin-2 Bose Gas. J. Phys. Soc. Japan 2013, 82, 094002. [Google Scholar] [CrossRef]
- Vengalattore, M.; Higbie, J.M.; Leslie, S.R.; Guzman, J.; Sadler, L.E.; Stamper-Kurn, D.M. High-Resolution Magnetometry with a Spinor Bose-Einstein Condensate. Phys. Rev. Lett. 2007, 98, 200801. [Google Scholar] [CrossRef]
- Eto, Y.; Sekine, S.; Hasegawa, S.; Sadgrove, M.; Saito, H.; Hirano, T. Control and Detection of the Larmor Precession of F = 287Rb Bose-Einstein Condensates by Ramsey Interferometry and Spin-Echo. Appl. Phys. Express 2013, 6, 052801. [Google Scholar] [CrossRef]
- Muessel, W.; Strobel, H.; Linnemann, D.; Hume, D.B.; Oberthaler, M.K. Scalable Spin Squeezing for Quantum-Enhanced Magnetometry with Bose-Einstein Condensates. Phys. Rev. Lett. 2014, 113, 103004. [Google Scholar] [CrossRef] [PubMed]
- Chen, L.; Zhang, K.; Xu, Y.; Luo, Q.; Xu, W.; Zhou, M.; Hu, Z. Multi-wave atom interferometer based on Doppler-insensitive Raman transition. Opt. Express 2020, 28, 8463–8474. [Google Scholar] [CrossRef]
- Zhou, M.K.; Zhang, K.; Duan, X.C.; Ke, Y.; Shao, C.G.; Hu, Z.K. Atomic multiwave interferometer for Aharonov-Casher-phase measurements. Phys. Rev. A 2016, 93, 023641. [Google Scholar] [CrossRef]
- Petrovic, J.; Herrera, I.; Lombardi, P.; Schäfer, F.; Cataliotti, F.S. A multi-state interferometer on an atom chip. New J. Phys. 2013, 15, 043002. [Google Scholar] [CrossRef]
- de Saint-Vincent, M.R.; Brantut, J.P.; Bordé, C.J.; Aspect, A.; Bourdel, T.; Bouyer, P. A quantum trampoline for ultra-cold atoms. Europhys. Lett. 2010, 89, 10002. [Google Scholar] [CrossRef]
- Gustavsson, M.; Haller, E.; Mark, M.J.; Danzl, J.G.; Hart, R.; Daley, A.J.; Nägerl, H.C. Interference of interacting matter waves. New J. Phys. 2010, 12, 065029. [Google Scholar] [CrossRef]
- Hinderthür, H.; Ruschewitz, F.; Lohe, H.J.; Lechte, S.; Sengstock, K.; Ertmer, W. Time-domain high-finesse atom interferometry. Phys. Rev. A 1999, 59, 2216–2219. [Google Scholar] [CrossRef]
- Deng, X.B.; Xu, Y.Y.; Duan, X.C.; Hu, Z.K. Precisely Mapping the Absolute Magnetic Field in Vacuum by an Optical Ramsey Atom Interferometer. Phys. Rev. Appl. 2021, 15, 054062. [Google Scholar] [CrossRef]
- Dong, R.; Wei, R.; Du, Y.; Zou, F.; Lin, J.; Wang, Y. Magnetic field measurement by weak magnetic-sensitive Zeeman splitting. Appl. Phys. Lett. 2015, 106, 152402. [Google Scholar] [CrossRef]
- Minardi, F.; Fort, C.; Maddaloni, P.; Modugno, M.; Inguscio, M. Time-Domain Atom Interferometry across the Threshold for Bose-Einstein Condensation. Phys. Rev. Lett. 2001, 87, 170401. [Google Scholar] [CrossRef]
- Lombardi, P.; Schaefer, F.; Herrera, I.; Cherukattil, S.; Petrovic, J.; Lovecchio, C.; Marin, F.; Cataliotti, F.S. Reading the phase of a Raman excitation with a multi-state atomic interferometer. Opt. Express 2014, 22, 19141–19148. [Google Scholar] [CrossRef] [PubMed]
- Santarelli, G.; Audoin, C.; Makdissi, A.; Laurent, P.; Dick, G.; Clairon, A. Frequency stability degradation of an oscillator slaved to a periodically interrogated atomic resonator. IEEE Trans. Ultrason. Ferroelectr. Freq. Control 1998, 45, 887–894. [Google Scholar] [CrossRef] [PubMed]
- Ramsey, N.F. A Molecular Beam Resonance Method with Separated Oscillating Fields. Phys. Rev. 1950, 78, 695–699. [Google Scholar] [CrossRef]
- Cheng, Y.; Zhang, K.; Chen, L.L.; Zhang, T.; Xu, W.J.; Duan, X.C.; Zhou, M.K.; Hu, Z.K. Momentum-resolved detection for high-precision Bragg atom interferometry. Phys. Rev. A 2018, 98, 043611. [Google Scholar] [CrossRef]
- Zhang, H.; Ren, X.; Yan, W.; Cheng, Y.; Zhou, H.; Gao, Z.; Luo, Q.; Zhou, M.; Hu, Z. Effects related to the temperature of atoms in an atom interferometry gravimeter based on ultra-cold atoms. Opt. Express 2021, 29, 30007–30019. [Google Scholar] [CrossRef]
- Cook, R.J.; Shore, B.W. Coherent dynamics of N-level atoms and molecules. III. An analytically soluble periodic case. Phys. Rev. A 1979, 20, 539–544. [Google Scholar] [CrossRef]
- Vitanov, N.V.; Suominen, K.A. Time-dependent control of ultracold atoms in magnetic traps. Phys. Rev. A 1997, 56, R4377–R4380. [Google Scholar] [CrossRef]
- Itano, W.M.; Bergquist, J.C.; Bollinger, J.J.; Gilligan, J.M.; Heinzen, D.J.; Moore, F.L.; Raizen, M.G.; Wineland, D.J. Quantum projection noise: Population fluctuations in two-level systems. Phys. Rev. A 1993, 47, 3554–3570. [Google Scholar] [CrossRef]
- Karcher, R.; Imanaliev, A.; Merlet, S.; Santos, F.P.D. Improving the accuracy of atom interferometers with ultracold sources. New J. Phys. 2018, 20, 113041. [Google Scholar] [CrossRef]
- Louchet-Chauvet, A.; Farah, T.; Bodart, Q.; Clairon, A.; Landragin, A.; Merlet, S.; Santos, F.P.D. The influence of transverse motion within an atomic gravimeter. New J. Phys. 2011, 13, 065025. [Google Scholar] [CrossRef]
- Zhou, M.K.; Hu, Z.K.; Duan, X.C.; Sun, B.L.; Zhao, J.B.; Luo, J. Precisely mapping the magnetic field gradient in vacuum with an atom interferometer. Phys. Rev. A 2010, 82, 061602. [Google Scholar] [CrossRef]
- Arnold, K.; Barrett, M. All-optical Bose-Einstein condensation in a 1.06 μm dipole trap. Opt. Commun. 2011, 284, 3288–3291. [Google Scholar] [CrossRef]
- Xie, D.; Wang, D.; Gou, W.; Bu, W.; Yan, B. Fast production of rubidium Bose Einstein condensate in a dimple trap. J. Opt. Soc. Am. B 2018, 35, 500–503. [Google Scholar] [CrossRef]
- Rudolph, J.; Herr, W.; Grzeschik, C.; Sternke, T.; Grote, A.; Popp, M.; Becker, D.; Müntinga, H.; Ahlers, H.; Peters, A.; et al. A high-flux BEC source for mobile atom interferometers. New J. Phys. 2015, 17, 065001. [Google Scholar] [CrossRef]
- Petelski, T. Atom Interferometers for Precision Gravity Measurements. Ph.D. Thesis, University of Florence, Florence, Italy, Pierre and Marie Curie University, Paris, France, 2005. [Google Scholar]
- Canuel, B. Étude d’un Gyromètre à Atomes Froids. Ph.D. Thesis, Pierre and Marie Curie University, Paris, France, 2007. [Google Scholar]
- Sen Gupta, A.; Popovic, D.; Walls, F. Cs frequency synthesis: A new approach. In Proceedings of the Proceedings of the 1999 Joint Meeting of the European Frequency and Time Forum and the IEEE International Frequency Control Symposium (Cat. No.99CH36313), Besancon, France, 13–16 April 1999; Volume 2, pp. 615–619. [Google Scholar] [CrossRef]
- Gan, H.C.J.; Maslennikov, G.; Tseng, K.W.; Tan, T.R.; Kaewuam, R.; Arnold, K.J.; Matsukevich, D.; Barrett, M.D. Oscillating-magnetic-field effects in high-precision metrology. Phys. Rev. A 2018, 98, 032514. [Google Scholar] [CrossRef]
- Wu, Y.; Yang, X. Strong-Coupling Theory of Periodically Driven Two-Level Systems. Phys. Rev. Lett. 2007, 98, 013601. [Google Scholar] [CrossRef]
- Jefferts, S.R.; Shirley, J.; Parker, T.E.; Heavner, T.P.; Meekhof, D.M.; Nelson, C.; Levi, F.; Costanzo, G.; Marchi, A.D.; Drullinger, R.; et al. Accuracy evaluation of NIST-F1. Metrologia 2002, 39, 321–336. [Google Scholar] [CrossRef]
- Sárkány, L.; Weiss, P.; Hattermann, H.; Fortágh, J. Controlling the magnetic-field sensitivity of atomic-clock states by microwave dressing. Phys. Rev. A 2014, 90, 053416. [Google Scholar] [CrossRef]
- Widera, A.; Gerbier, F.; Fölling, S.; Gericke, T.; Mandel, O.; Bloch, I. Precision measurement of spin-dependent interaction strengths for spin-1 and spin-2 87Rb atoms. New J. Phys. 2006, 8, 152. [Google Scholar] [CrossRef]
- Schmaljohann, H.; Erhard, M.; Kronjäger, J.; Kottke, M.; van Staa, S.; Cacciapuoti, L.; Arlt, J.J.; Bongs, K.; Sengstock, K. Dynamics of F = 2 Spinor Bose-Einstein Condensates. Phys. Rev. Lett. 2004, 92, 040402. [Google Scholar] [CrossRef]
- Kuwamoto, T.; Araki, K.; Eno, T.; Hirano, T. Magnetic field dependence of the dynamics of 87Rb spin-2 Bose-Einstein condensates. Phys. Rev. A 2004, 69, 063604. [Google Scholar] [CrossRef]
- Wynands, R.; Weyers, S. Atomic fountain clocks. Metrologia 2005, 42, S64–S79. [Google Scholar] [CrossRef]
- Avila, G.; Giordano, V.; Candelier, V.; de Clercq, E.; Theobald, G.; Cerez, P. State selection in a cesium beam by laser-diode optical pumping. Phys. Rev. A 1987, 36, 3719–3728. [Google Scholar] [CrossRef] [PubMed]
- Meppelink, R.; Rozendaal, R.A.; Koller, S.B.; Vogels, J.M.; van der Straten, P. Thermodynamics of Bose-Einstein-condensed clouds using phase-contrast imaging. Phys. Rev. A 2010, 81, 053632. [Google Scholar] [CrossRef]
Disclaimer/Publisher’s Note: The statements, opinions and data contained in all publications are solely those of the individual author(s) and contributor(s) and not of MDPI and/or the editor(s). MDPI and/or the editor(s) disclaim responsibility for any injury to people or property resulting from any ideas, methods, instructions or products referred to in the content. |
© 2022 by the authors. Licensee MDPI, Basel, Switzerland. This article is an open access article distributed under the terms and conditions of the Creative Commons Attribution (CC BY) license (https://creativecommons.org/licenses/by/4.0/).