
Content Swapping: A New Image Synthesis for Construction Sign Detection in Autonomous Vehicles


Abstract
:1. Introduction
- This is the first paper which deals with the construction sign detection.
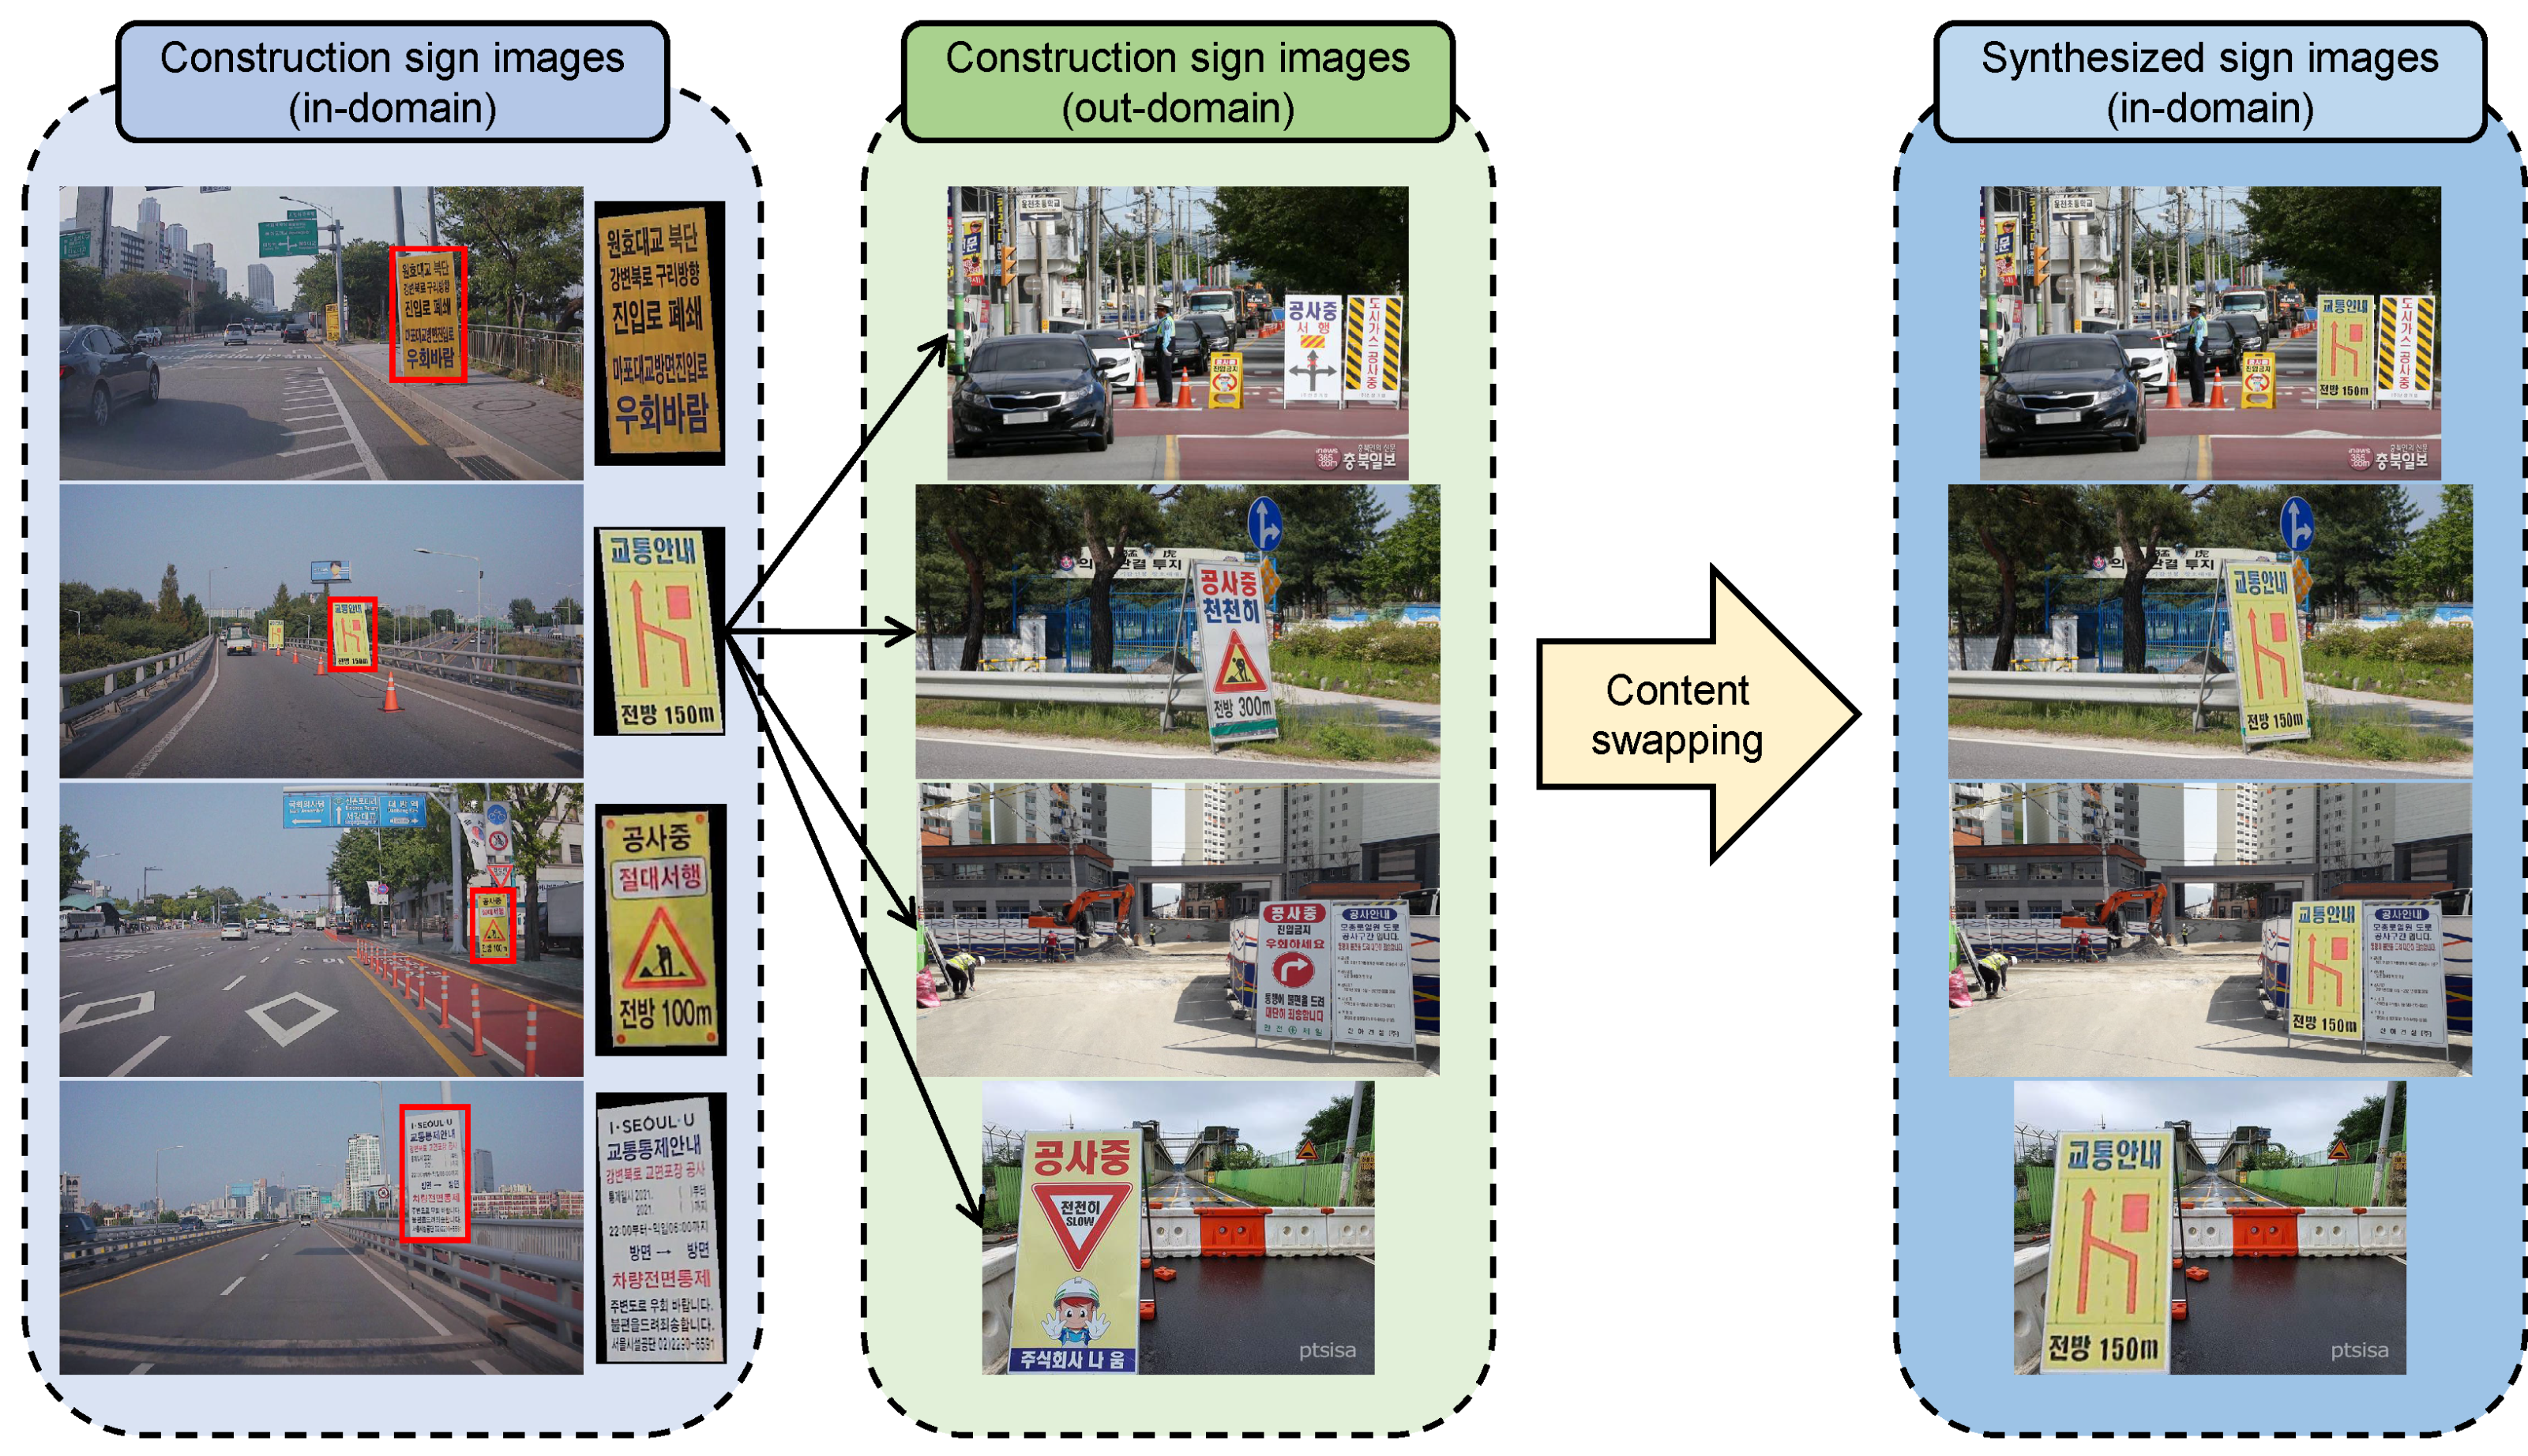
- We propose a new image synthesis method, content swapping, to avoid overfitting on limited instances in source images.
- We further present three fine-tunning methods for creating realistic construction images on roads.
- To demonstrate the efficacy of the proposed method, we construct a new dataset, CSS138, for construction sign detection.
- Finally, we achieve an AP50 score of 84.98%, creating a gap of 9.15% from the naive cut-and-paste method.
2. Related Work
2.1. Sign Detection
2.2. Image Synthesis for Network Training
3. Method
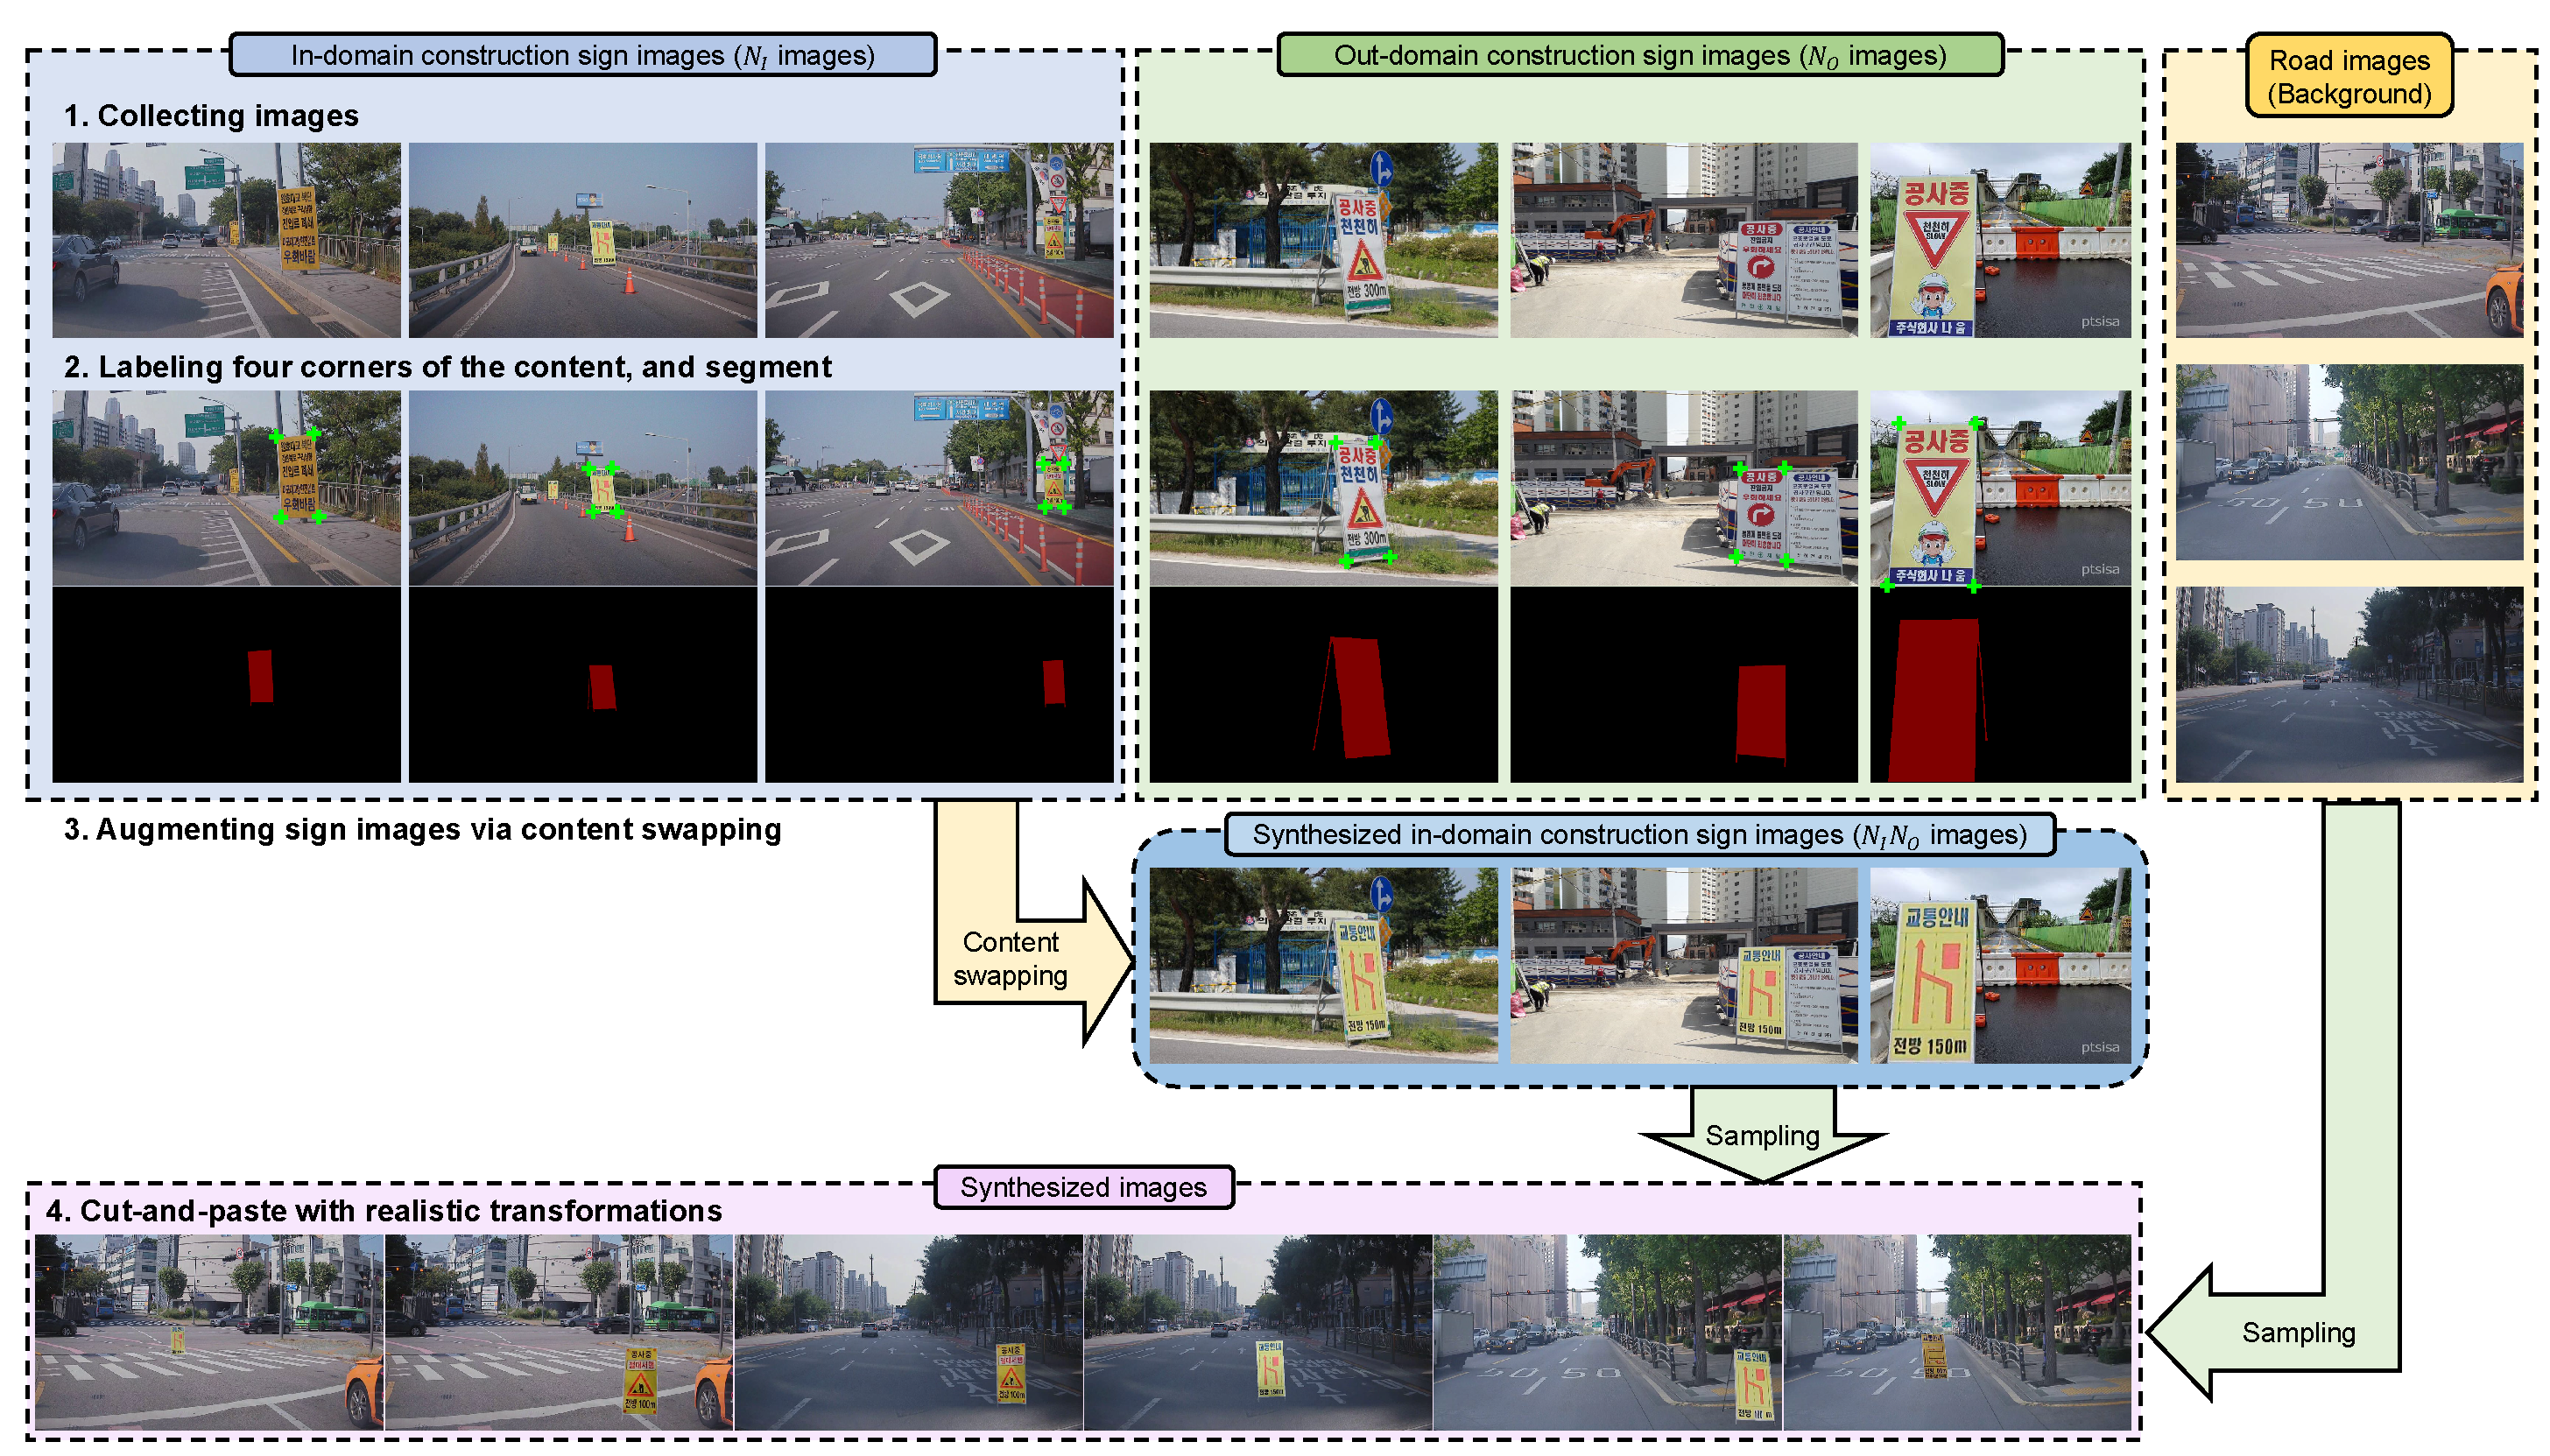
3.1. Overview
| Algorithm 1 Pseudo-code of the proposed method. |
Step1: Collecting construction sign and road images
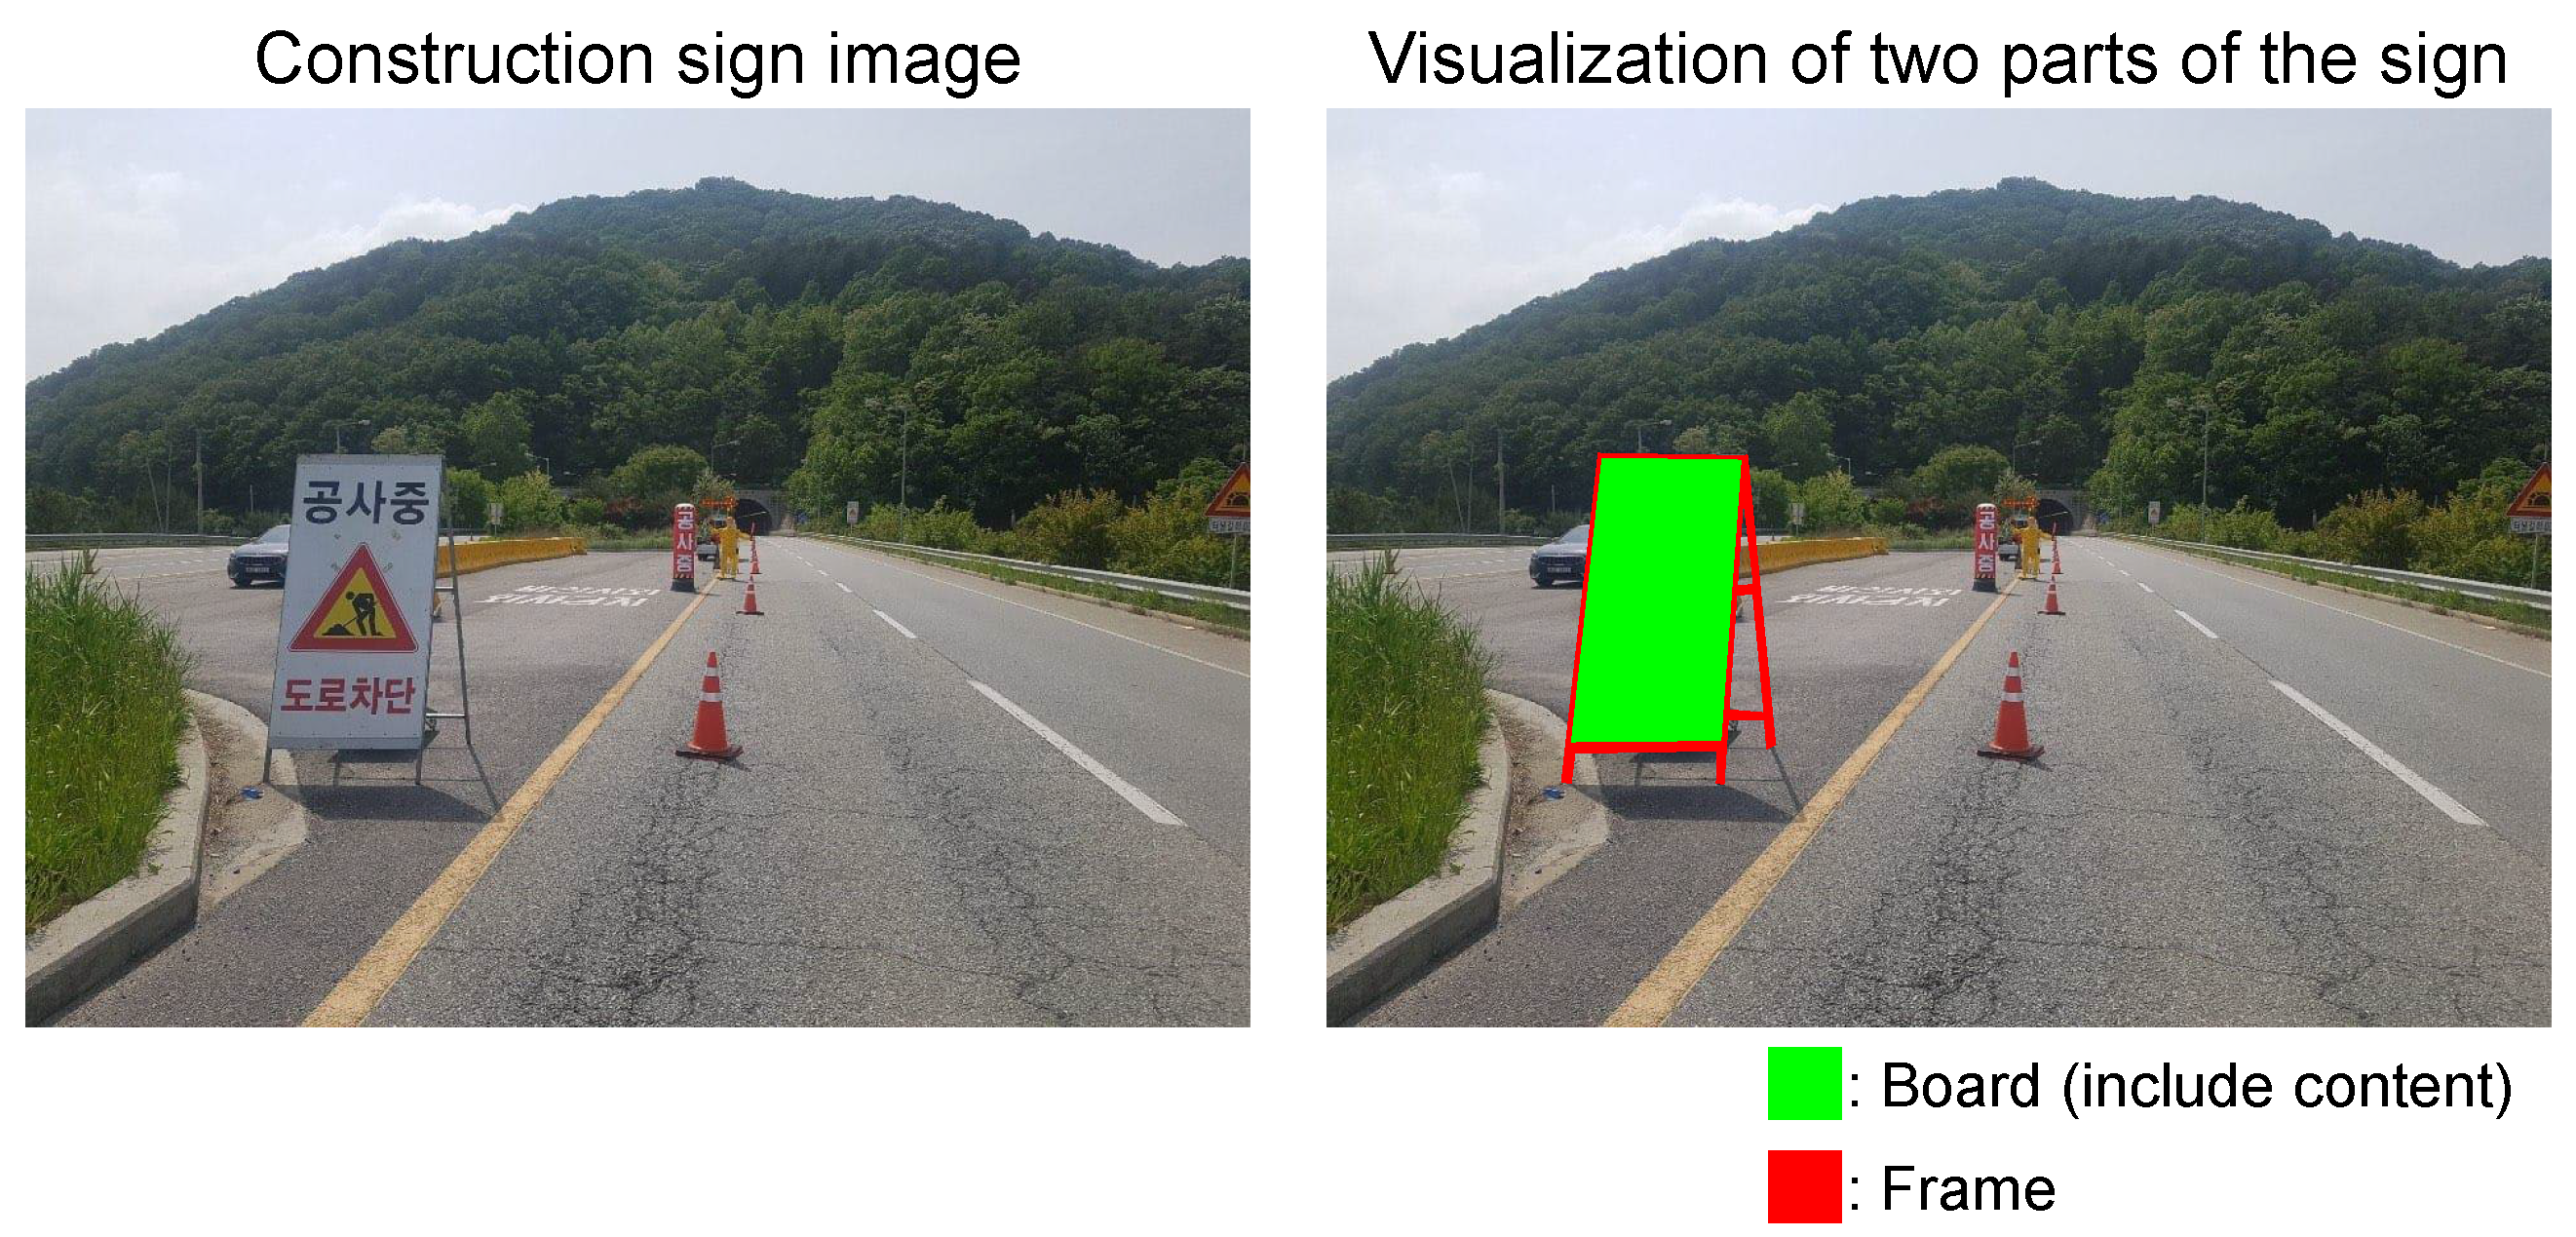
Step2: Labeling bounding box, segment, and four corners of the board
Step3: Content swapping
Step4: Cut-and-paste with realistic transformations
Output: Synthesized training image: ; Synthesized training label: |
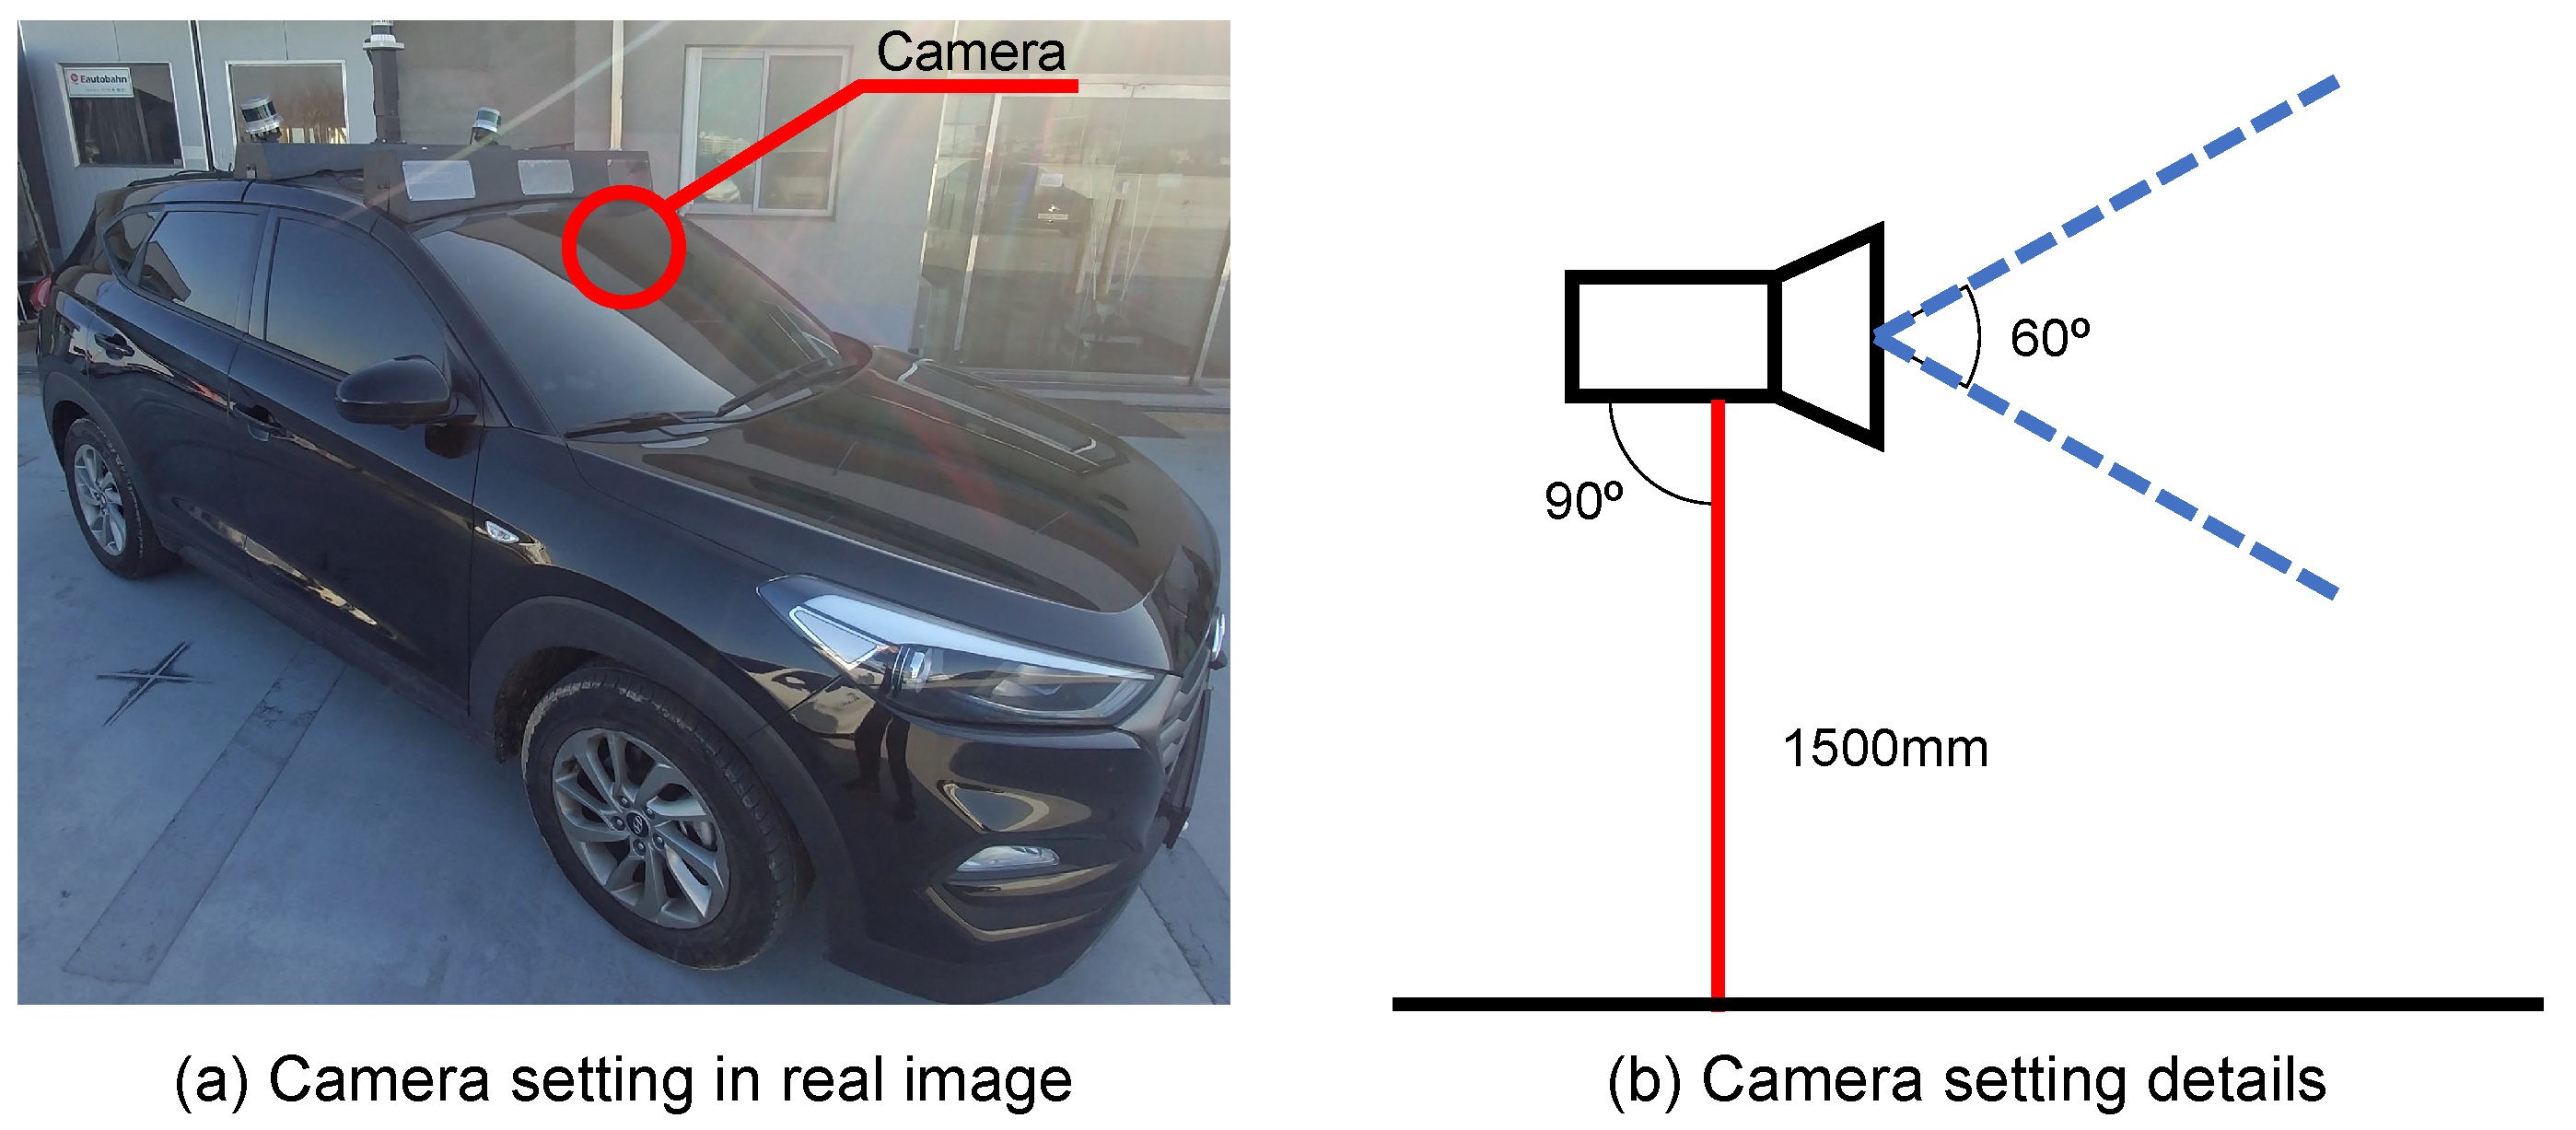
3.2. Collecting Images
3.3. Labeling
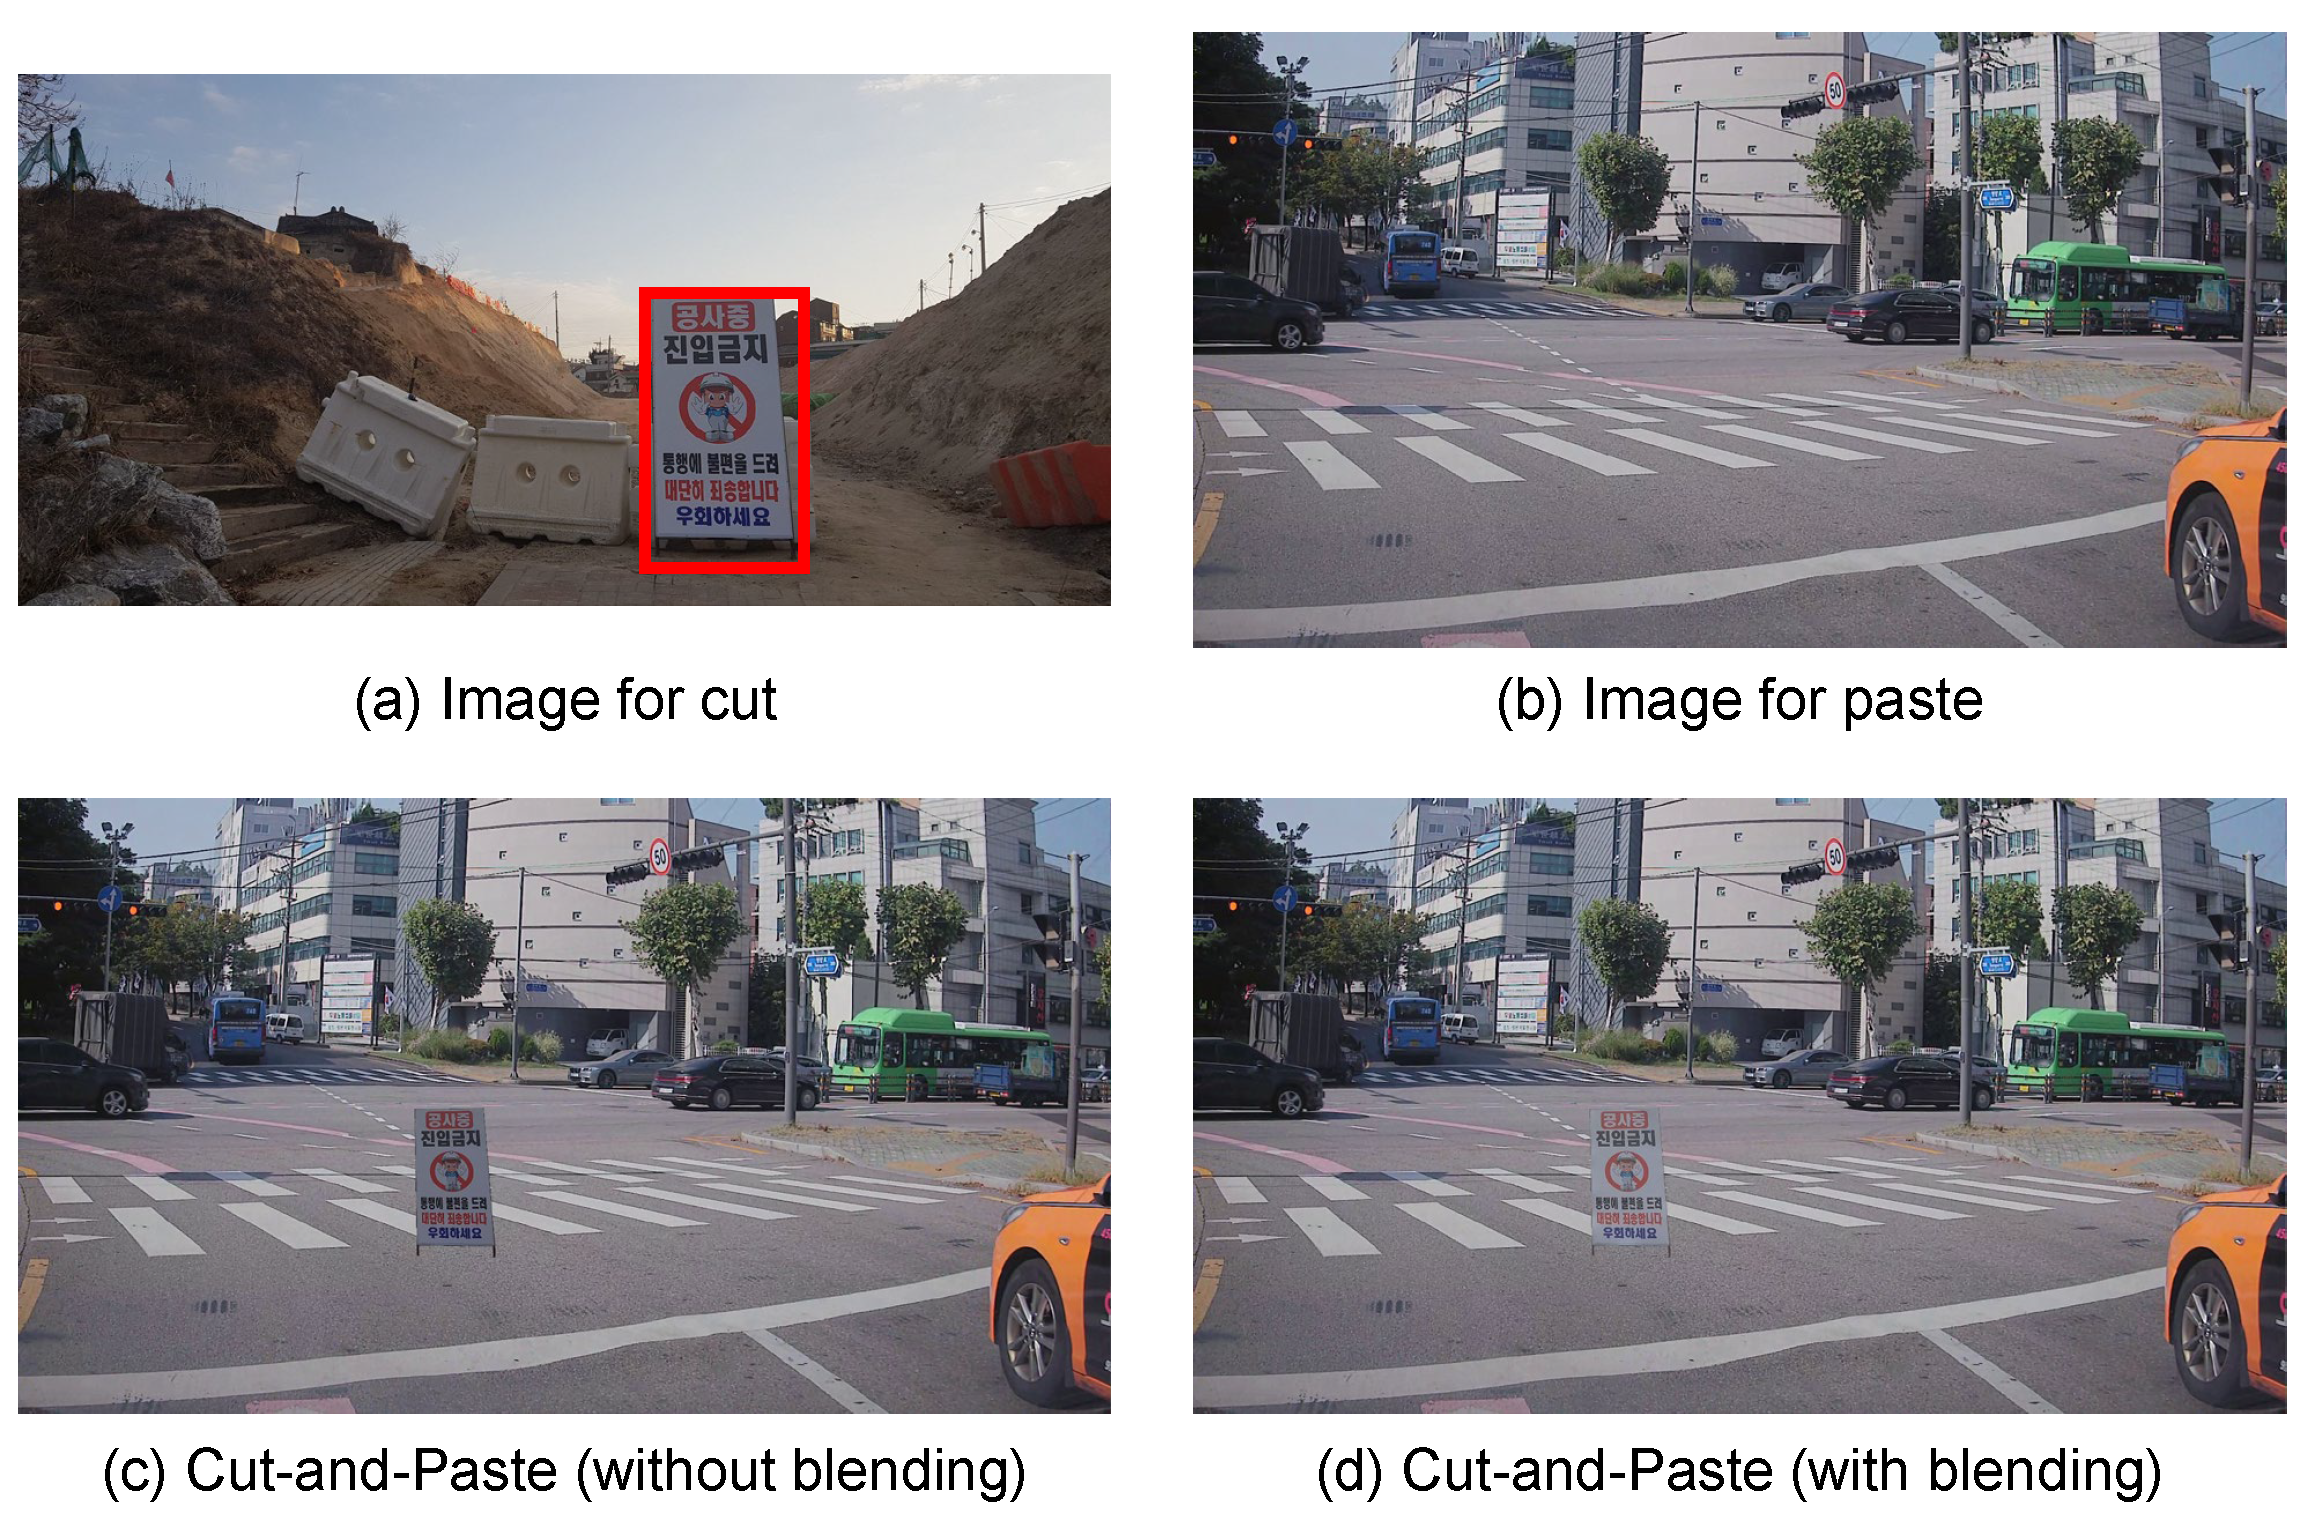
3.4. Content Swapping
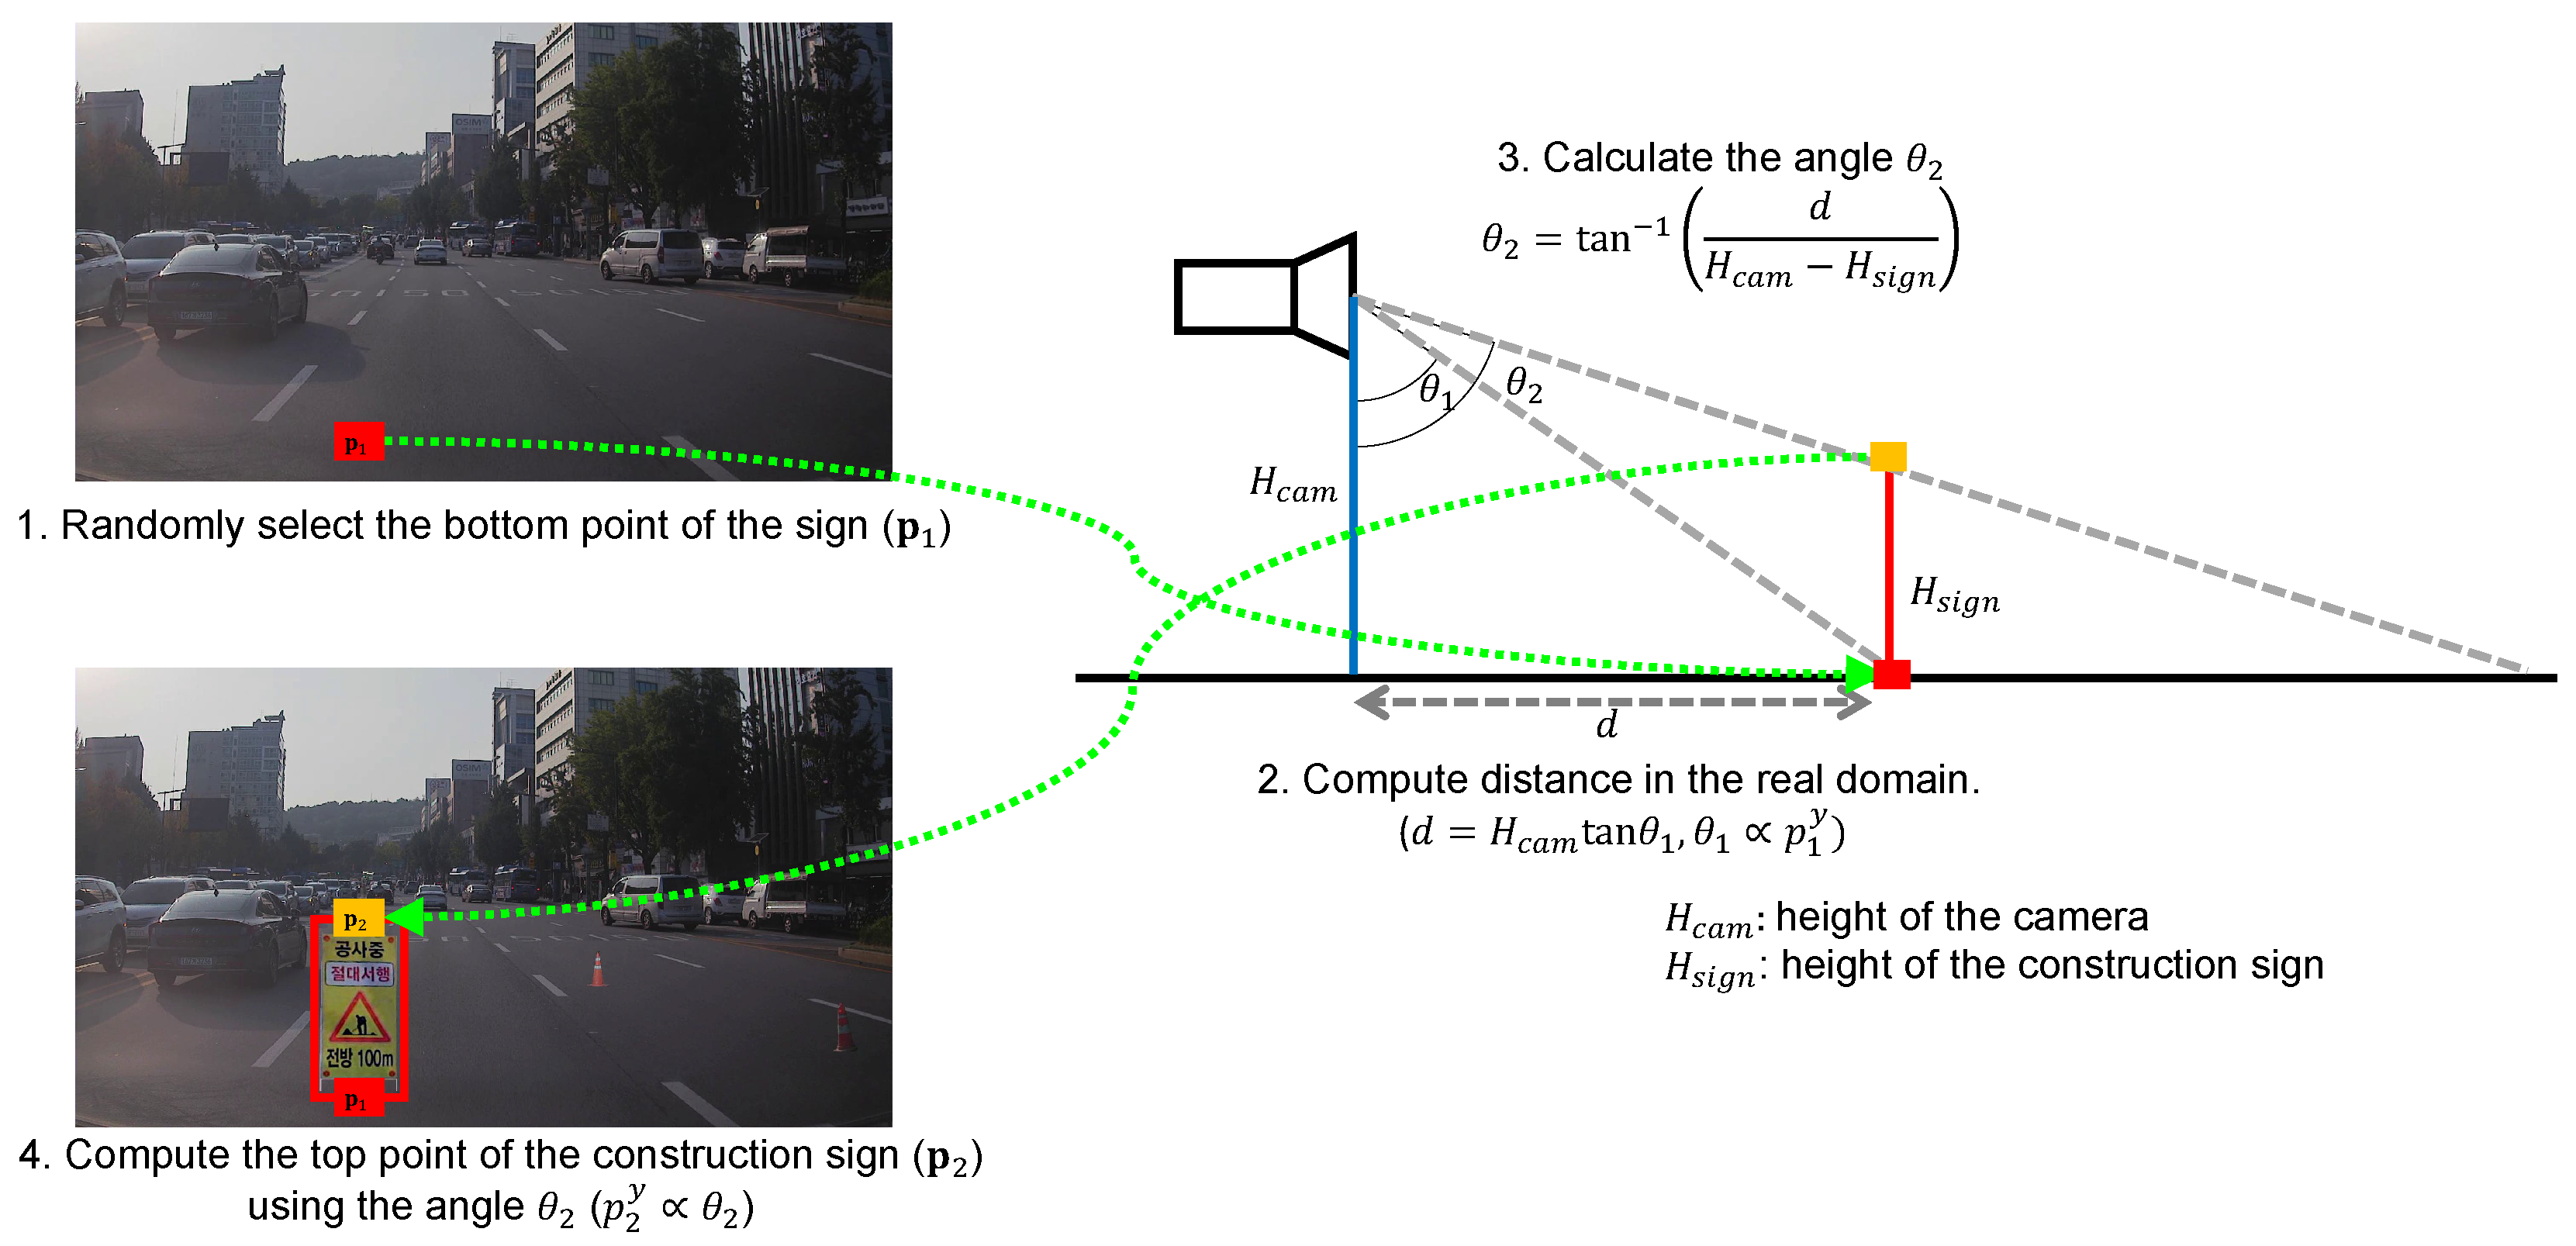
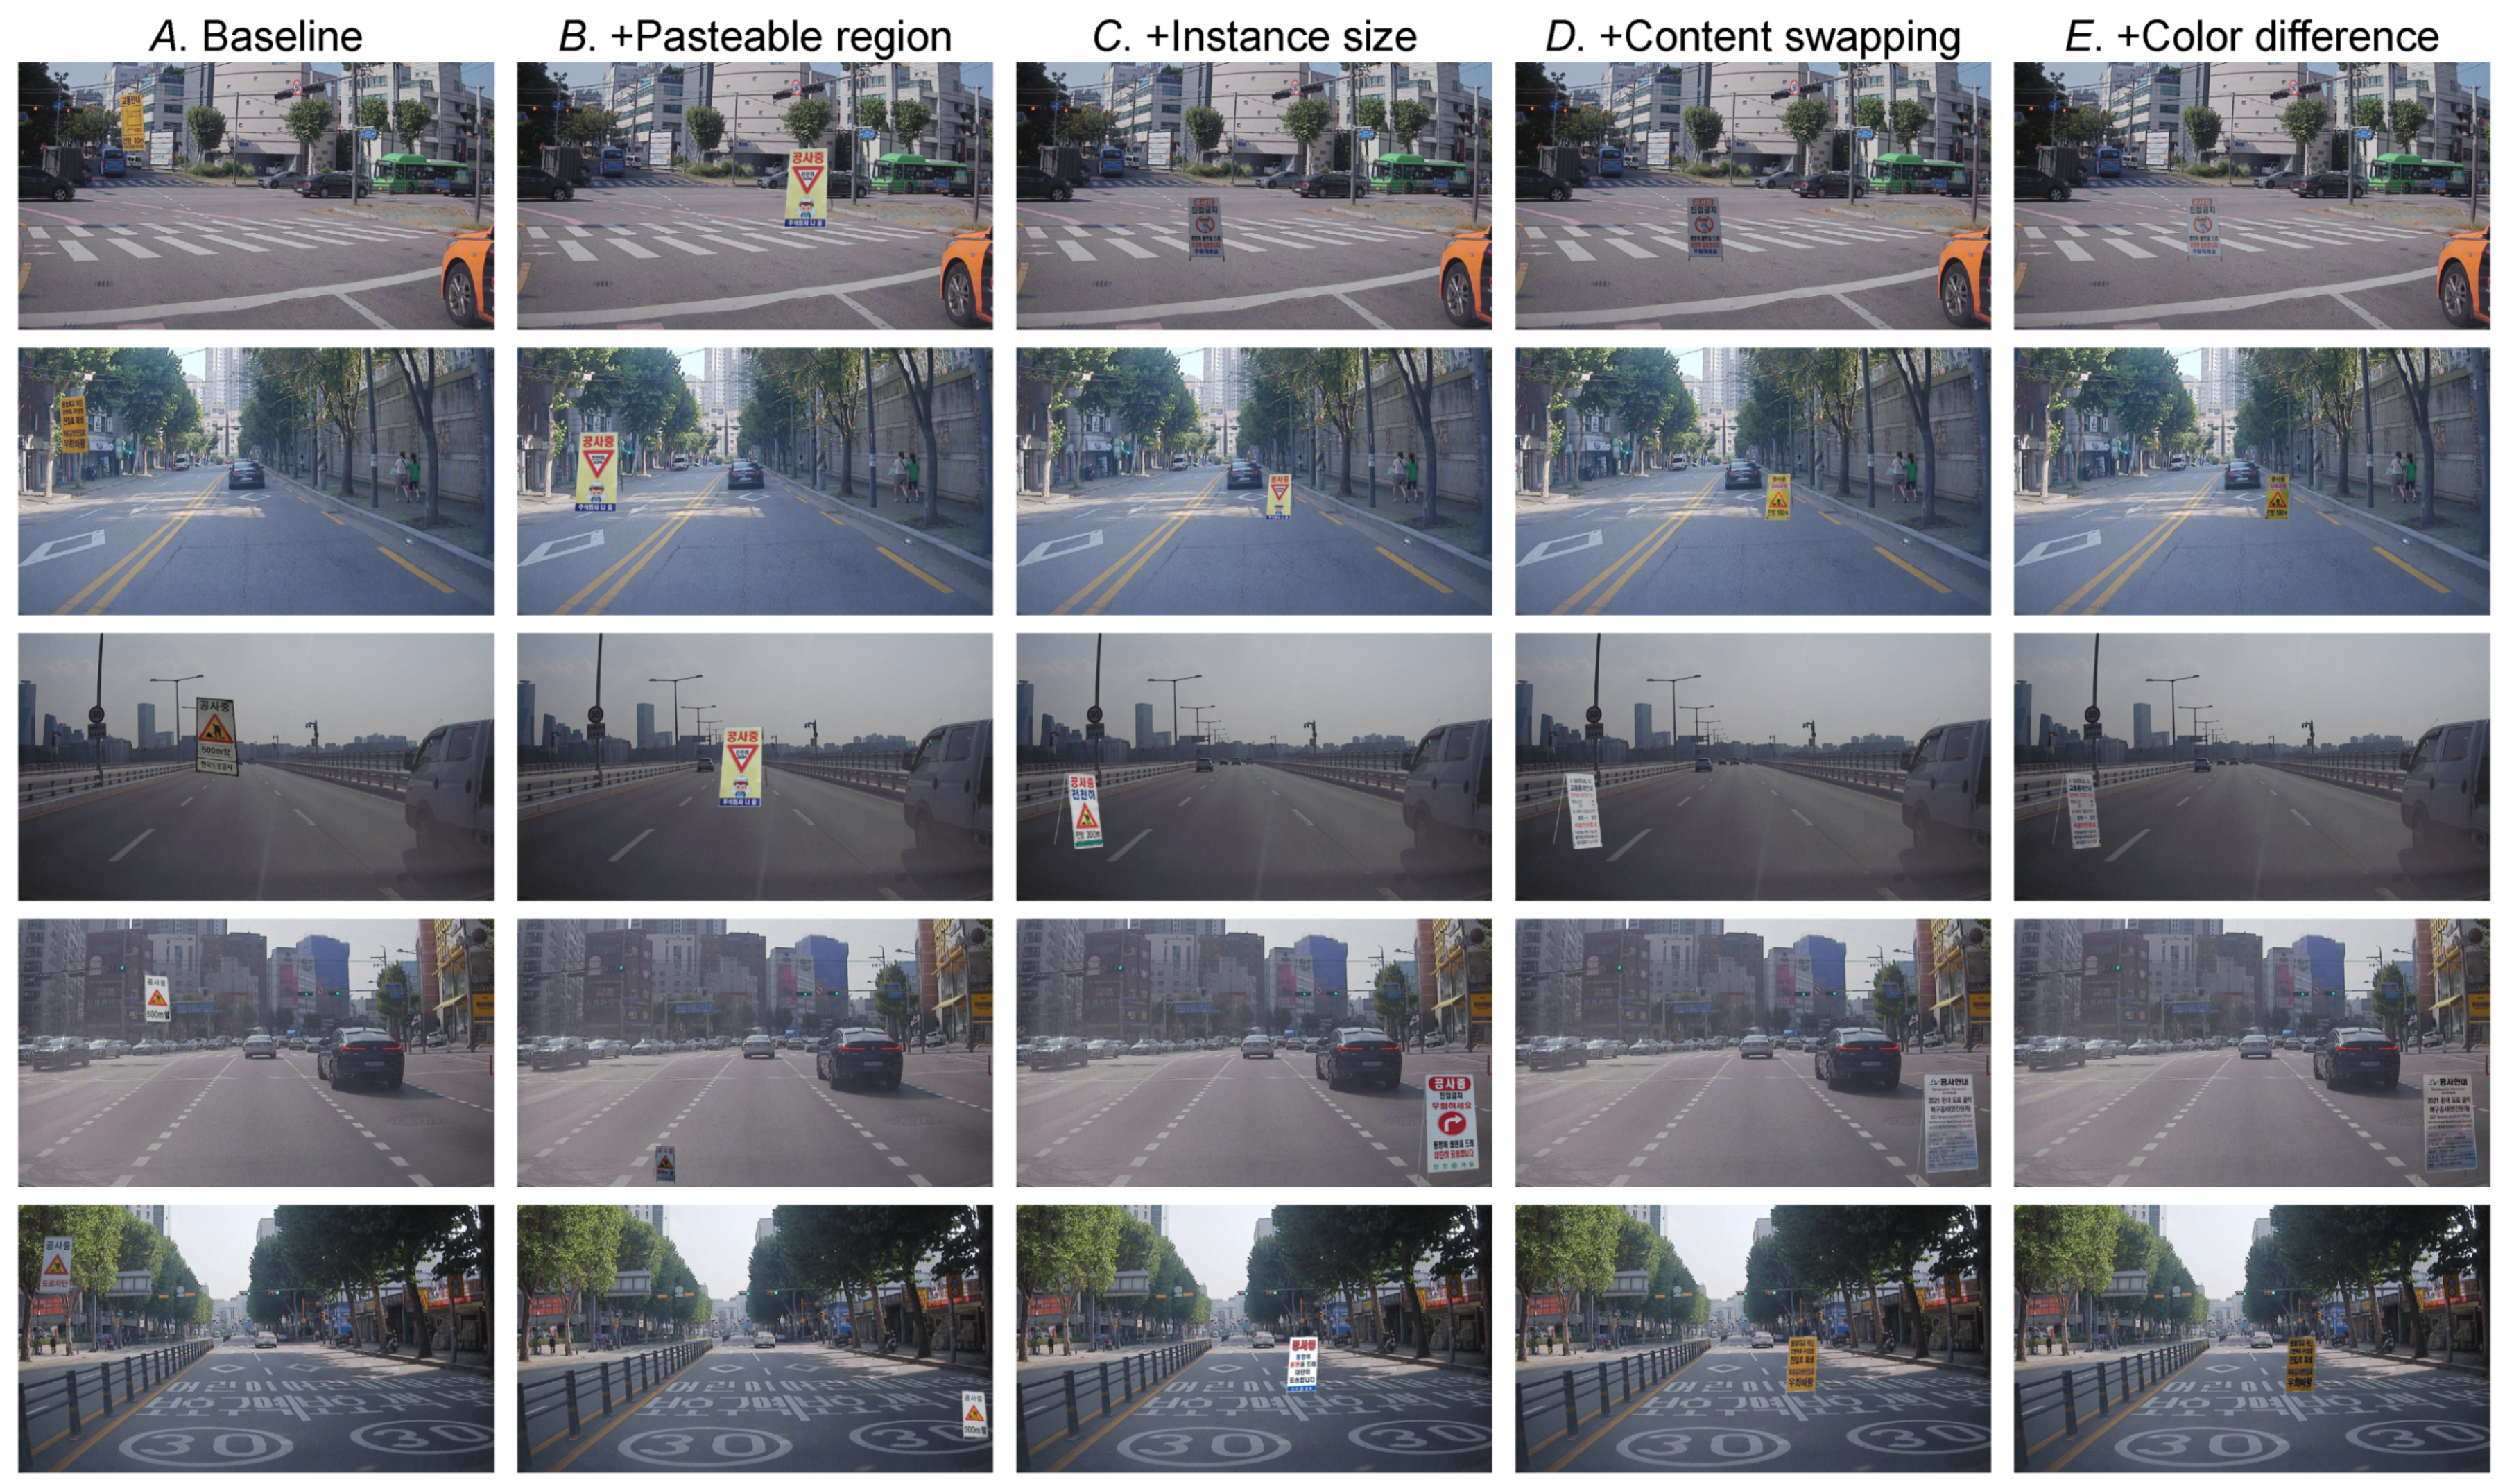
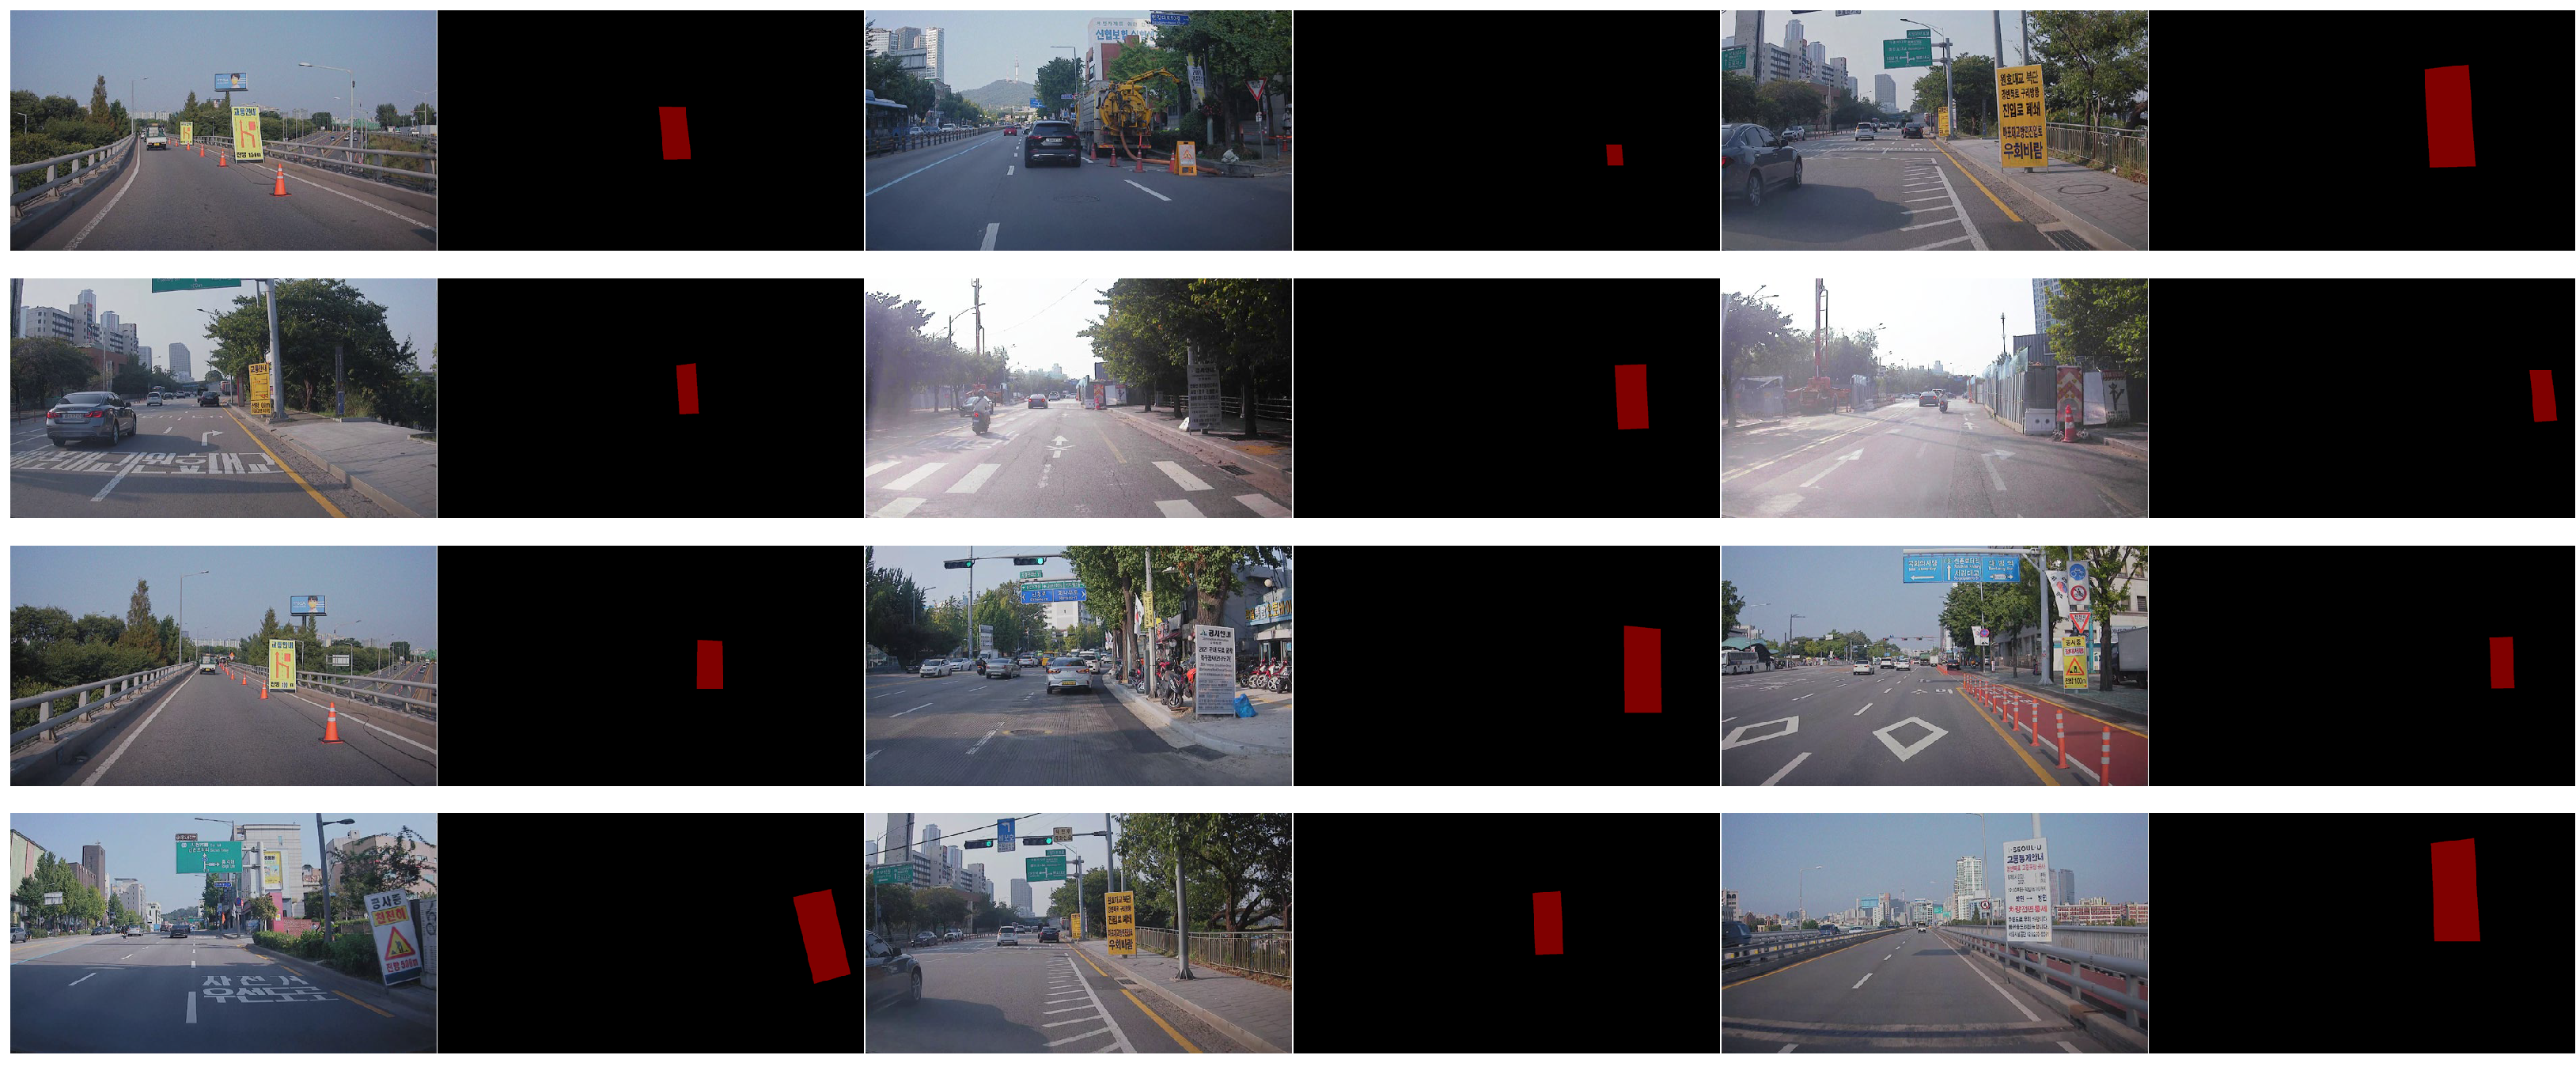
3.5. Cut-and-Paste with Realistic Transformations
3.5.1. Pasteable Region
3.5.2. Instance Size
3.5.3. Color Difference
4. Experiments
4.1. Implementation Details
4.2. Quantitative Results
4.3. Grad-CAM Result
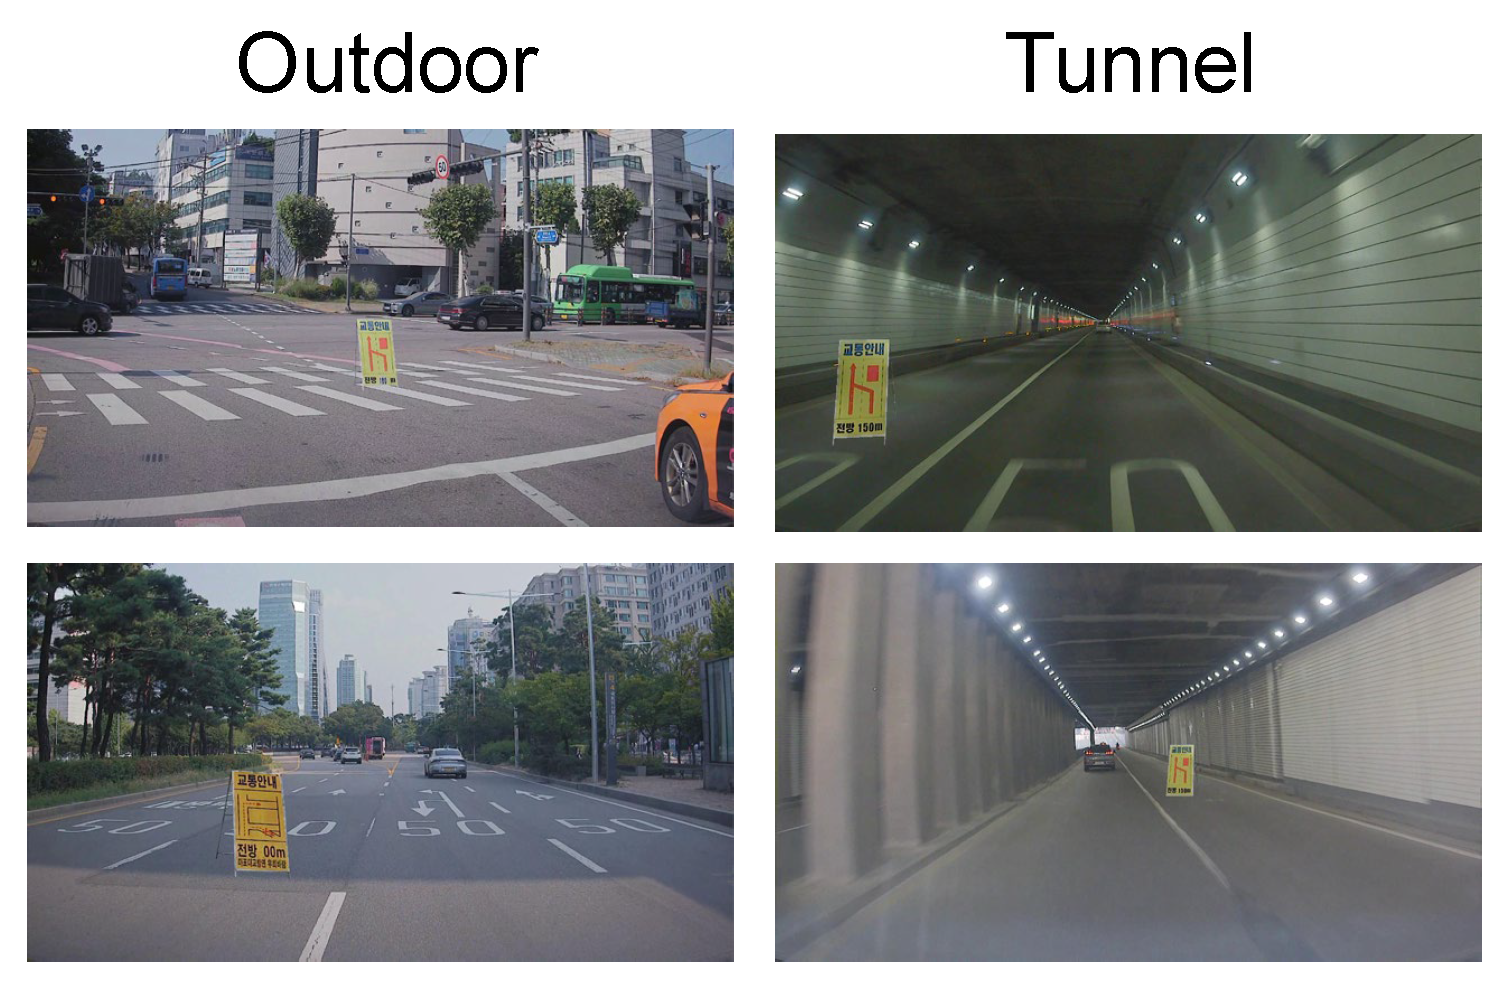
4.4. Effect of Daylight
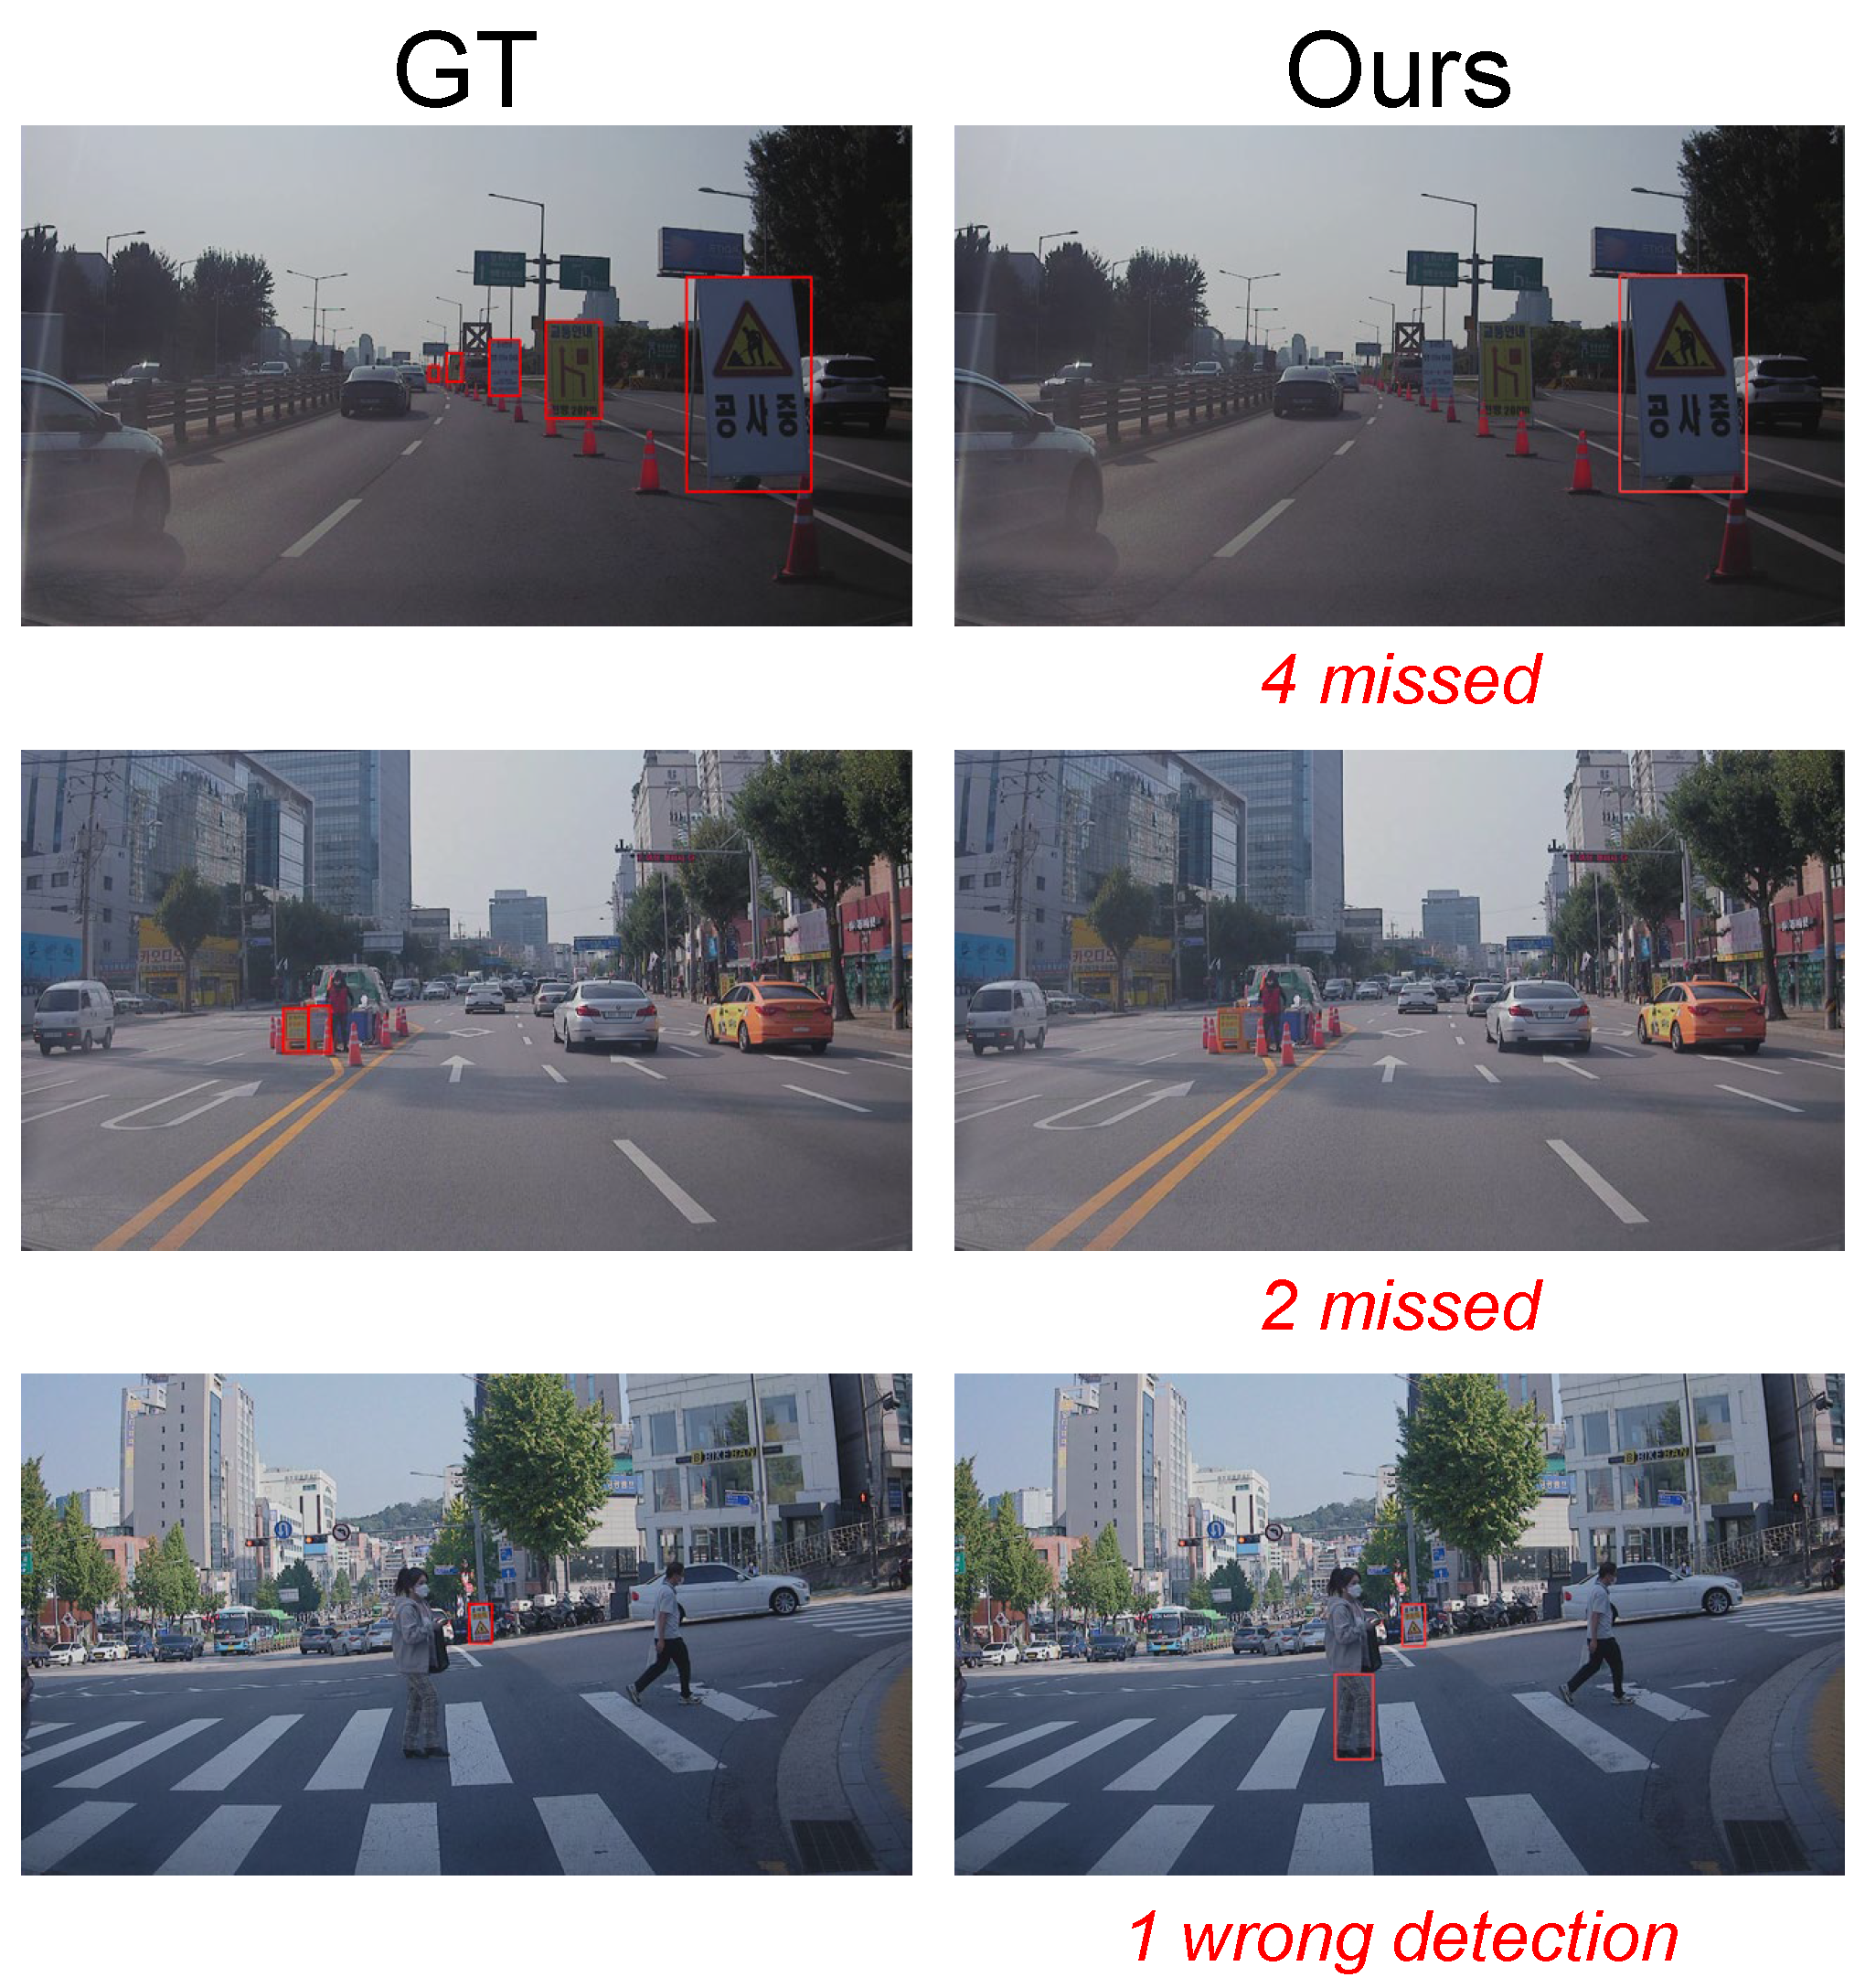
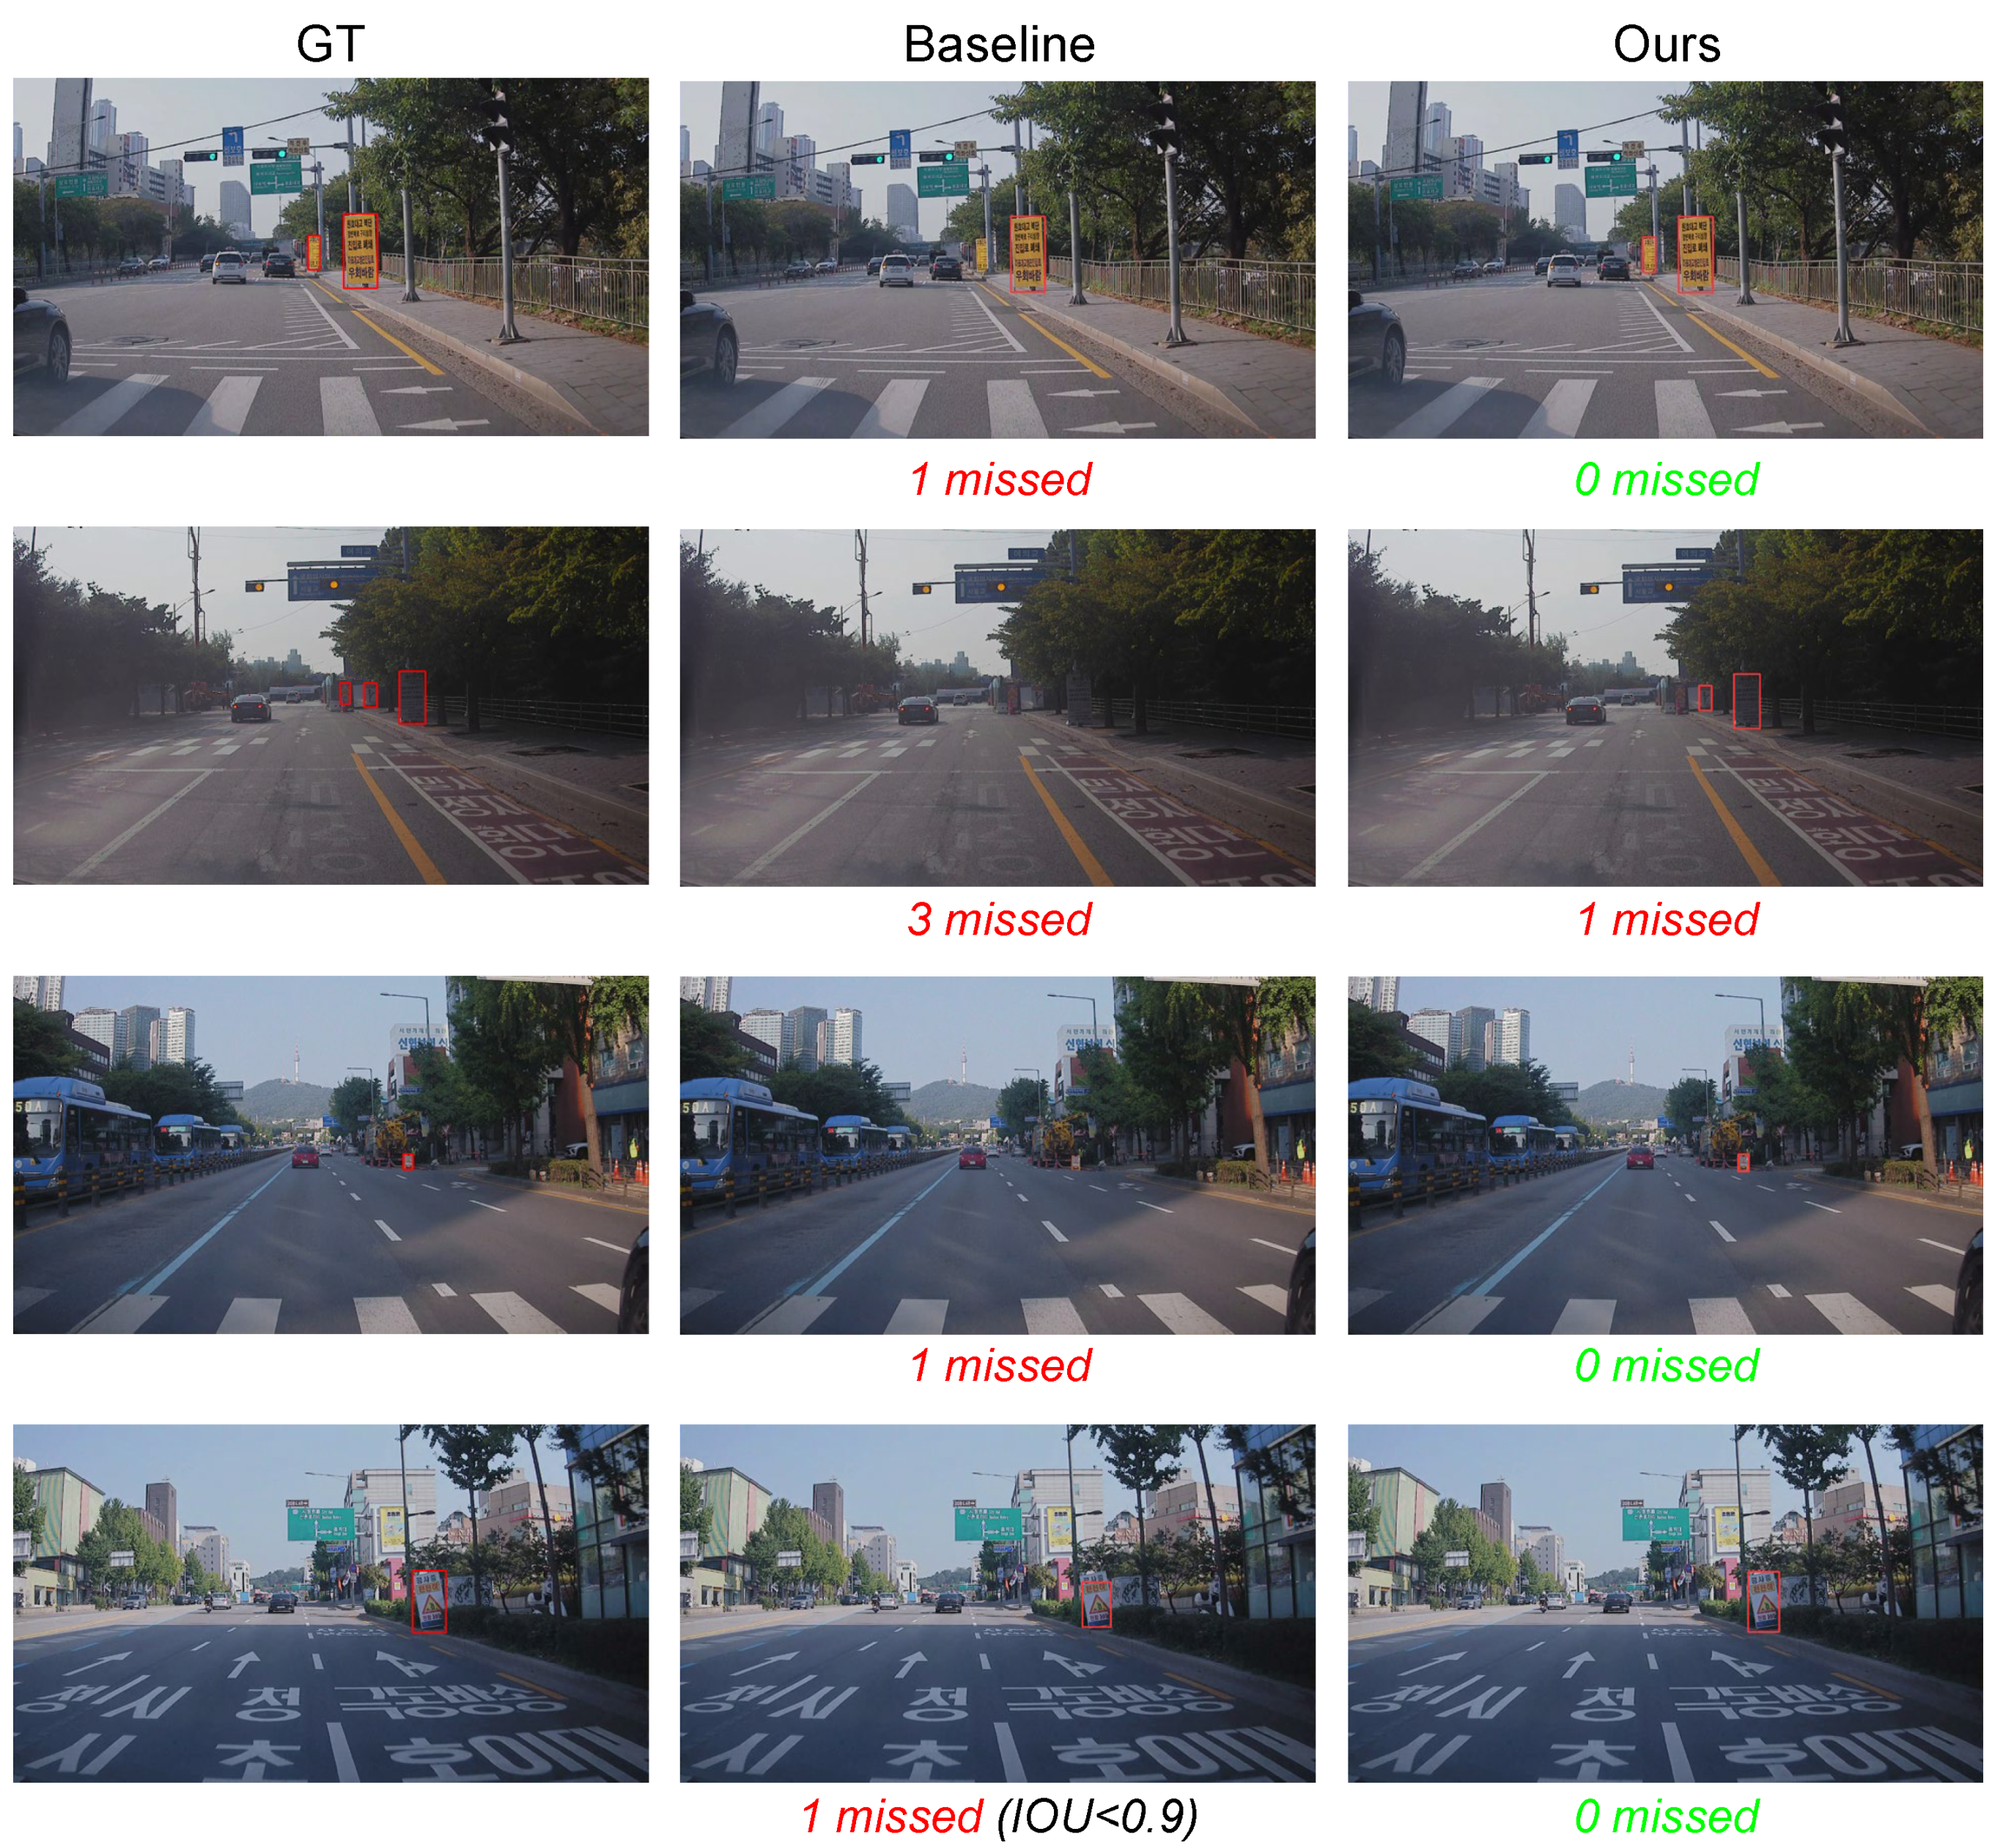
4.5. Qualitative Analysis
5. Conclusions
Author Contributions
Funding
Institutional Review Board Statement
Informed Consent Statement
Data Availability Statement
Conflicts of Interest
References
- Redmon, J.; Farhadi, A. YOLOv3: An Incremental Improvement. arXiv 2018, arXiv:1804.02767. [Google Scholar]
- Ahmed, M.; Hashmi, K.A.; Pagani, A.; Liwicki, M.; Stricker, D.; Afzal, M.Z. Survey and Performance Analysis of Deep Learning Based Object Detection in Challenging Environments. Sensors 2021, 21, 5116. [Google Scholar] [CrossRef] [PubMed]
- Zhao, H.; Zhou, Y.; Zhang, L.; Peng, Y.; Hu, X.; Peng, H.; Cai, X. Mixed YOLOv3-LITE: A Lightweight Real-Time Object Detection Method. Sensors 2020, 20, 1861. [Google Scholar] [CrossRef] [PubMed] [Green Version]
- Charouh, Z.; Ezzouhri, A.; Ghogho, M.; Guennoun, Z. A Resource-Efficient CNN-Based Method for Moving Vehicle Detection. Sensors 2022, 22, 1193. [Google Scholar] [CrossRef] [PubMed]
- Miller, D.; Sünderhauf, N.; Milford, M.; Dayoub, F. Uncertainty for Identifying Open-Set Errors in Visual Object Detection. IEEE Robot. Autom. Lett. 2021, 7, 215–222. [Google Scholar] [CrossRef]
- Jiang, L.; Nie, W.; Zhu, J.; Gao, X.; Lei, B. Lightweight object detection network model suitable for indoor mobile robots. J. Mech. Sci. Technol. 2022, 36, 907–920. [Google Scholar] [CrossRef]
- Yun, W.H.; Kim, T.; Lee, J.; Kim, J.; Kim, J. Cut-and-Paste Dataset Generation for Balancing Domain Gaps in Object Instance Detection. IEEE Access 2021, 9, 14319–14329. [Google Scholar] [CrossRef]
- Lee, S.; Hyun, J.; Seong, H.; Kim, E. Unsupervised Domain Adaptation for Semantic Segmentation by Content Transfer. In Proceedings of the Thirty-Fifth AAAI Conference on Artificial Intelligence, virtual, 2–9 February 2021. [Google Scholar]
- Eversberg, L.; Lambrecht, J. Generating Images with Physics-Based Rendering for an Industrial Object Detection Task: Realism versus Domain Randomization. Sensors 2021, 21, 7901. [Google Scholar] [CrossRef] [PubMed]
- Prince, S.; Bergevin, R. Road sign detection and recognition using perceptual grouping. In Proceedings of the International Symposium on Automotive Technology & Automation, Florence, Italy, 16–19June 1997. [Google Scholar]
- De La Escalera, A.; Moreno, L.E.; Salichs, M.A.; Armingol, J.M. Road Traffic Sign Detection and Classification. IEEE Trans. Ind. Electron. 1997, 44, 848–859. [Google Scholar] [CrossRef] [Green Version]
- Fang, C.Y.; Chen, S.W.; Fuh, C.S. Road-Sign Detection and Tracking. IEEE Trans. Veh. Technol. 2003, 52, 1329–1341. [Google Scholar] [CrossRef]
- Shadeed, W.; Abu-Al-Nadi, D.I.; Mismar, M.J. Road traffic sign detection in color images. In Proceedings of the 10th IEEE International Conference on Electronics, Circuits and Systems, 2003. ICECS 2003. Proceedings of the 2003, Sharjah, United Arab Emirates, 14–17 December 2003; Volume 2, pp. 890–893. [Google Scholar]
- Loy, G.; Barnes, N. Fast shape-based road sign detection for a driver assistance system. In Proceedings of the 2004 IEEE/RSJ International Conference on Intelligent Robots and Systems (IROS)(IEEE Cat. No. 04CH37566), Sendai, Japan, 28 September–2 October 2004; Volume 1, pp. 70–75. [Google Scholar]
- Bahlmann, C.; Zhu, Y.; Ramesh, V.; Pellkofer, M.; Koehler, T. A system for traffic sign detection, tracking, and recognition using color, shape, and motion information. In Proceedings of the EE Proceedings. Intelligent Vehicles Symposium, Las Vegas, NV, USA, 6–8 June 2005; pp. 255–260. [Google Scholar]
- Shao, F.; Wang, X.; Meng, F.; Rui, T.; Wang, D.; Tang, J. Real-time traffic sign detection and recognition method based on simplified Gabor wavelets and CNNs. Sensors 2018, 18, 3192. [Google Scholar] [CrossRef] [PubMed] [Green Version]
- Cao, J.; Song, C.; Peng, S.; Xiao, F.; Song, S. Improved traffic sign detection and recognition algorithm for intelligent vehicles. Sensors 2019, 19, 4021. [Google Scholar] [CrossRef] [PubMed] [Green Version]
- Zhang, J.; Xie, Z.; Sun, J.; Zou, X.; Wang, J. A cascaded R-CNN with multiscale attention and imbalanced samples for traffic sign detection. IEEE Access 2020, 8, 29742–29754. [Google Scholar] [CrossRef]
- Liu, Y.; Peng, J.; Xue, J.H.; Chen, Y.; Fu, Z.H. TSingNet: Scale-aware and context-rich feature learning for traffic sign detection and recognition in the wild. Neurocomputing 2021, 447, 10–22. [Google Scholar] [CrossRef]
- Ahmed, S.; Kamal, U.; Hasan, M.K. DFR-TSD: A deep learning based framework for robust traffic sign detection under challenging weather conditions. IEEE Trans. Intell. Transp. Syst. 2021, 1–13. [Google Scholar] [CrossRef]
- Zeng, H. Real-Time Traffic Sign Detection Based on Improved YOLO V3. In Proceedings of the 11th International Conference on Computer Engineering and Networks, Beijing, China, 9–11 December 2022; pp. 167–172. [Google Scholar]
- Frolov, V.; Faizov, B.; Shakhuro, V.; Sanzharov, V.; Konushin, A.; Galaktionov, V.; Voloboy, A. Image Synthesis Pipeline for CNN-Based Sensing Systems. Sensors 2022, 22, 2080. [Google Scholar] [CrossRef] [PubMed]
- Ranftl, R.; Lasinger, K.; Hafner, D.; Schindler, K.; Koltun, V. Towards Robust Monocular Depth Estimation: Mixing Datasets for Zero-shot Cross-dataset Transfer. IEEE Trans. Pattern Anal. Mach. Intell. 2020, 44, 1623–1637. [Google Scholar] [CrossRef] [PubMed]
- Wu, H.; Zheng, S.; Zhang, J.; Huang, K. Gp-gan: Towards realistic high-resolution image blending. In Proceedings of the ACM Multimedia 2019 Conference, Nice, France, 21–25 October 2019; pp. 2487–2495. [Google Scholar]
- Redmon, J.; Farhadi, A. YOLO9000: Better, faster, stronger. In Proceedings of the 2017 IEEE Conference on Computer Vision and Pattern Recognition, Honolulu, HI, USA, 22–25 July 2017; pp. 7263–7271. [Google Scholar]
- Ren, S.; He, K.; Girshick, R.; Sun, J. Faster r-cnn: Towards real-time object detection with region proposal networks. NIPS 2015, 28, 91–99. [Google Scholar] [CrossRef] [PubMed] [Green Version]
- Lin, T.Y.; Dollár, P.; Girshick, R.; He, K.; Hariharan, B.; Belongie, S. Feature pyramid networks for object detection. In Proceedings of the 2017 IEEE Conference on Computer Vision and Pattern Recognition, Honolulu, HI, USA, 22–25 July 2017; pp. 2117–2125. [Google Scholar]
- Lin, T.Y.; Goyal, P.; Girshick, R.; He, K.; Dollár, P. Focal loss for dense object detection. In Proceedings of the 2017 IEEE International Conference on Computer Vision, Venice, Italy, 22–29 October 2017; pp. 2980–2988. [Google Scholar]
- Selvaraju, R.R.; Cogswell, M.; Das, A.; Vedantam, R.; Parikh, D.; Batra, D. Grad-CAM: Visual Explanations from Deep Networks via Gradient-Based Localization. Int. J. Comput. Vis. 2020, 128, 336–359. [Google Scholar] [CrossRef] [Green Version]
- Shrivastava, A.; Gupta, A.; Girshick, R. Training region-based object detectors with online hard example mining. In Proceedings of the 6 IEEE Conference on Computer Vision and Pattern Recognition, Negas, NV, USA, 27–30 June 2016; pp. 761–769. [Google Scholar]
- Lee, S.; Seong, H.; Lee, S.; Kim, E. Correlation Verification for Image Retrieval. In Proceedings of the 2022 Conference on Computer Vision and Pattern Recognition, New Orleans, LA, USA, 19–24 June 2022. [Google Scholar]
- Zhou, K.; Yang, Y.; Qiao, Y.; Xiang, T. Domain Generalization with MixStyle. In Proceedings of the 9th International Conference on Learning Representations, Virtual, 3–7 May 2021. [Google Scholar]
- Lee, S.; Seong, H.; Lee, S.; Kim, E. WildNet: Learning Domain Generalized Semantic Segmentation from the Wild. In Proceedings of the 2022 Conference on Computer Vision and Pattern Recognition, New Orleans, LA, USA, 19–24 June 2022. [Google Scholar]


| Method | AP | AP50 |
|---|---|---|
| A. Baseline (cut-and-paste) | 60.53 | 75.84 |
| B. + Pasteable region | 62.74 | 77.30 |
| C. + Instance size | 65.57 | 82.44 |
| D. + Content swapping | 68.51 | 82.73 |
| E. + Color difference | 70.36 | 84.98 |
| Instance Size | AP | AP50 |
|---|---|---|
| Fixed | 62.74 | 77.30 |
| Random [7] | 65.14 | 80.12 |
| Ours | 65.57 | 82.44 |
| Method | YOLOv3-Tiny (DarkNet-19) | YOLOv3 (DarkNet-53) | ||
|---|---|---|---|---|
| AP | AP50 | AP | AP50 | |
| Baseline | 53.40 | 70.67 | 60.53 | 75.84 |
| Proposed | 54.95 | 75.57 | 70.36 | 84.98 |
| Split | YOLOv3-Tiny (DarkNet-19) | YOLOv3 (DarkNet-53) | ||
|---|---|---|---|---|
| AP | AP50 | AP | AP50 | |
| Outdoor | 56.34 | 76.81 | 69.32 | 84.88 |
| Tunnel | 16.20 | 32.29 | 39.91 | 55.53 |
Publisher’s Note: MDPI stays neutral with regard to jurisdictional claims in published maps and institutional affiliations. |
© 2022 by the authors. Licensee MDPI, Basel, Switzerland. This article is an open access article distributed under the terms and conditions of the Creative Commons Attribution (CC BY) license (https://creativecommons.org/licenses/by/4.0/).
Share and Cite
Seong, H.; Baik, S.; Lee, Y.; Lee, S.; Kim, E. Content Swapping: A New Image Synthesis for Construction Sign Detection in Autonomous Vehicles. Sensors 2022, 22, 3494. https://doi.org/10.3390/s22093494
Seong H, Baik S, Lee Y, Lee S, Kim E. Content Swapping: A New Image Synthesis for Construction Sign Detection in Autonomous Vehicles. Sensors. 2022; 22(9):3494. https://doi.org/10.3390/s22093494
Chicago/Turabian StyleSeong, Hongje, Seunghyun Baik, Youngjo Lee, Suhyeon Lee, and Euntai Kim. 2022. "Content Swapping: A New Image Synthesis for Construction Sign Detection in Autonomous Vehicles" Sensors 22, no. 9: 3494. https://doi.org/10.3390/s22093494
APA StyleSeong, H., Baik, S., Lee, Y., Lee, S., & Kim, E. (2022). Content Swapping: A New Image Synthesis for Construction Sign Detection in Autonomous Vehicles. Sensors, 22(9), 3494. https://doi.org/10.3390/s22093494