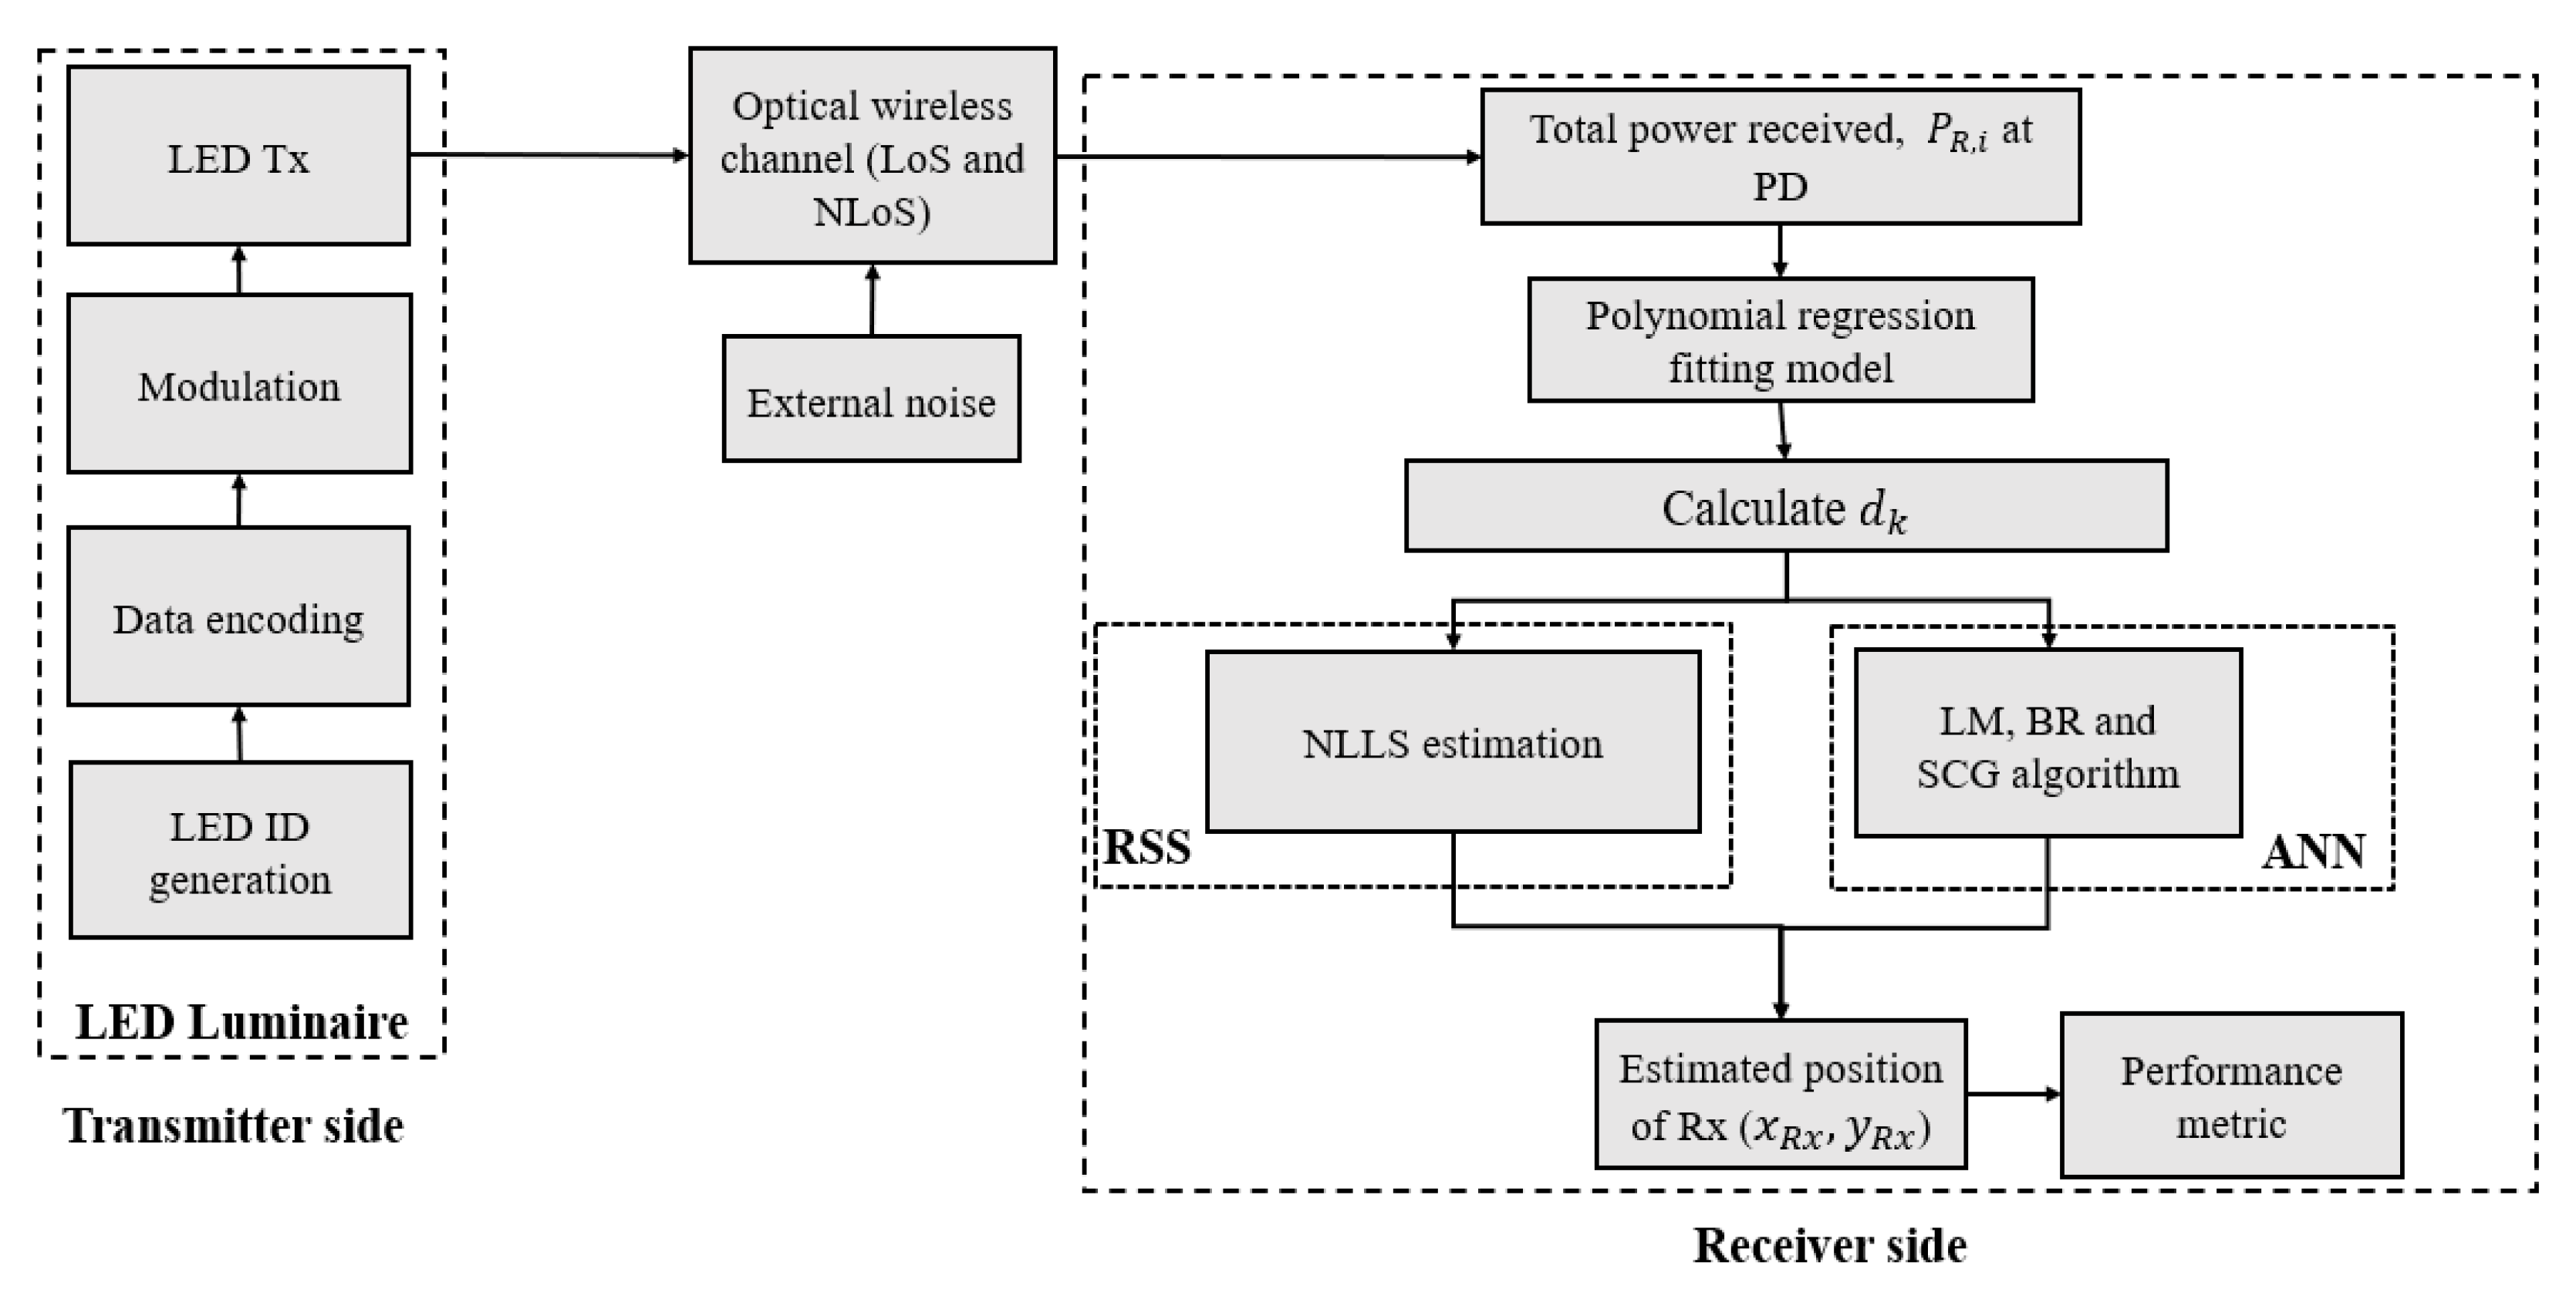
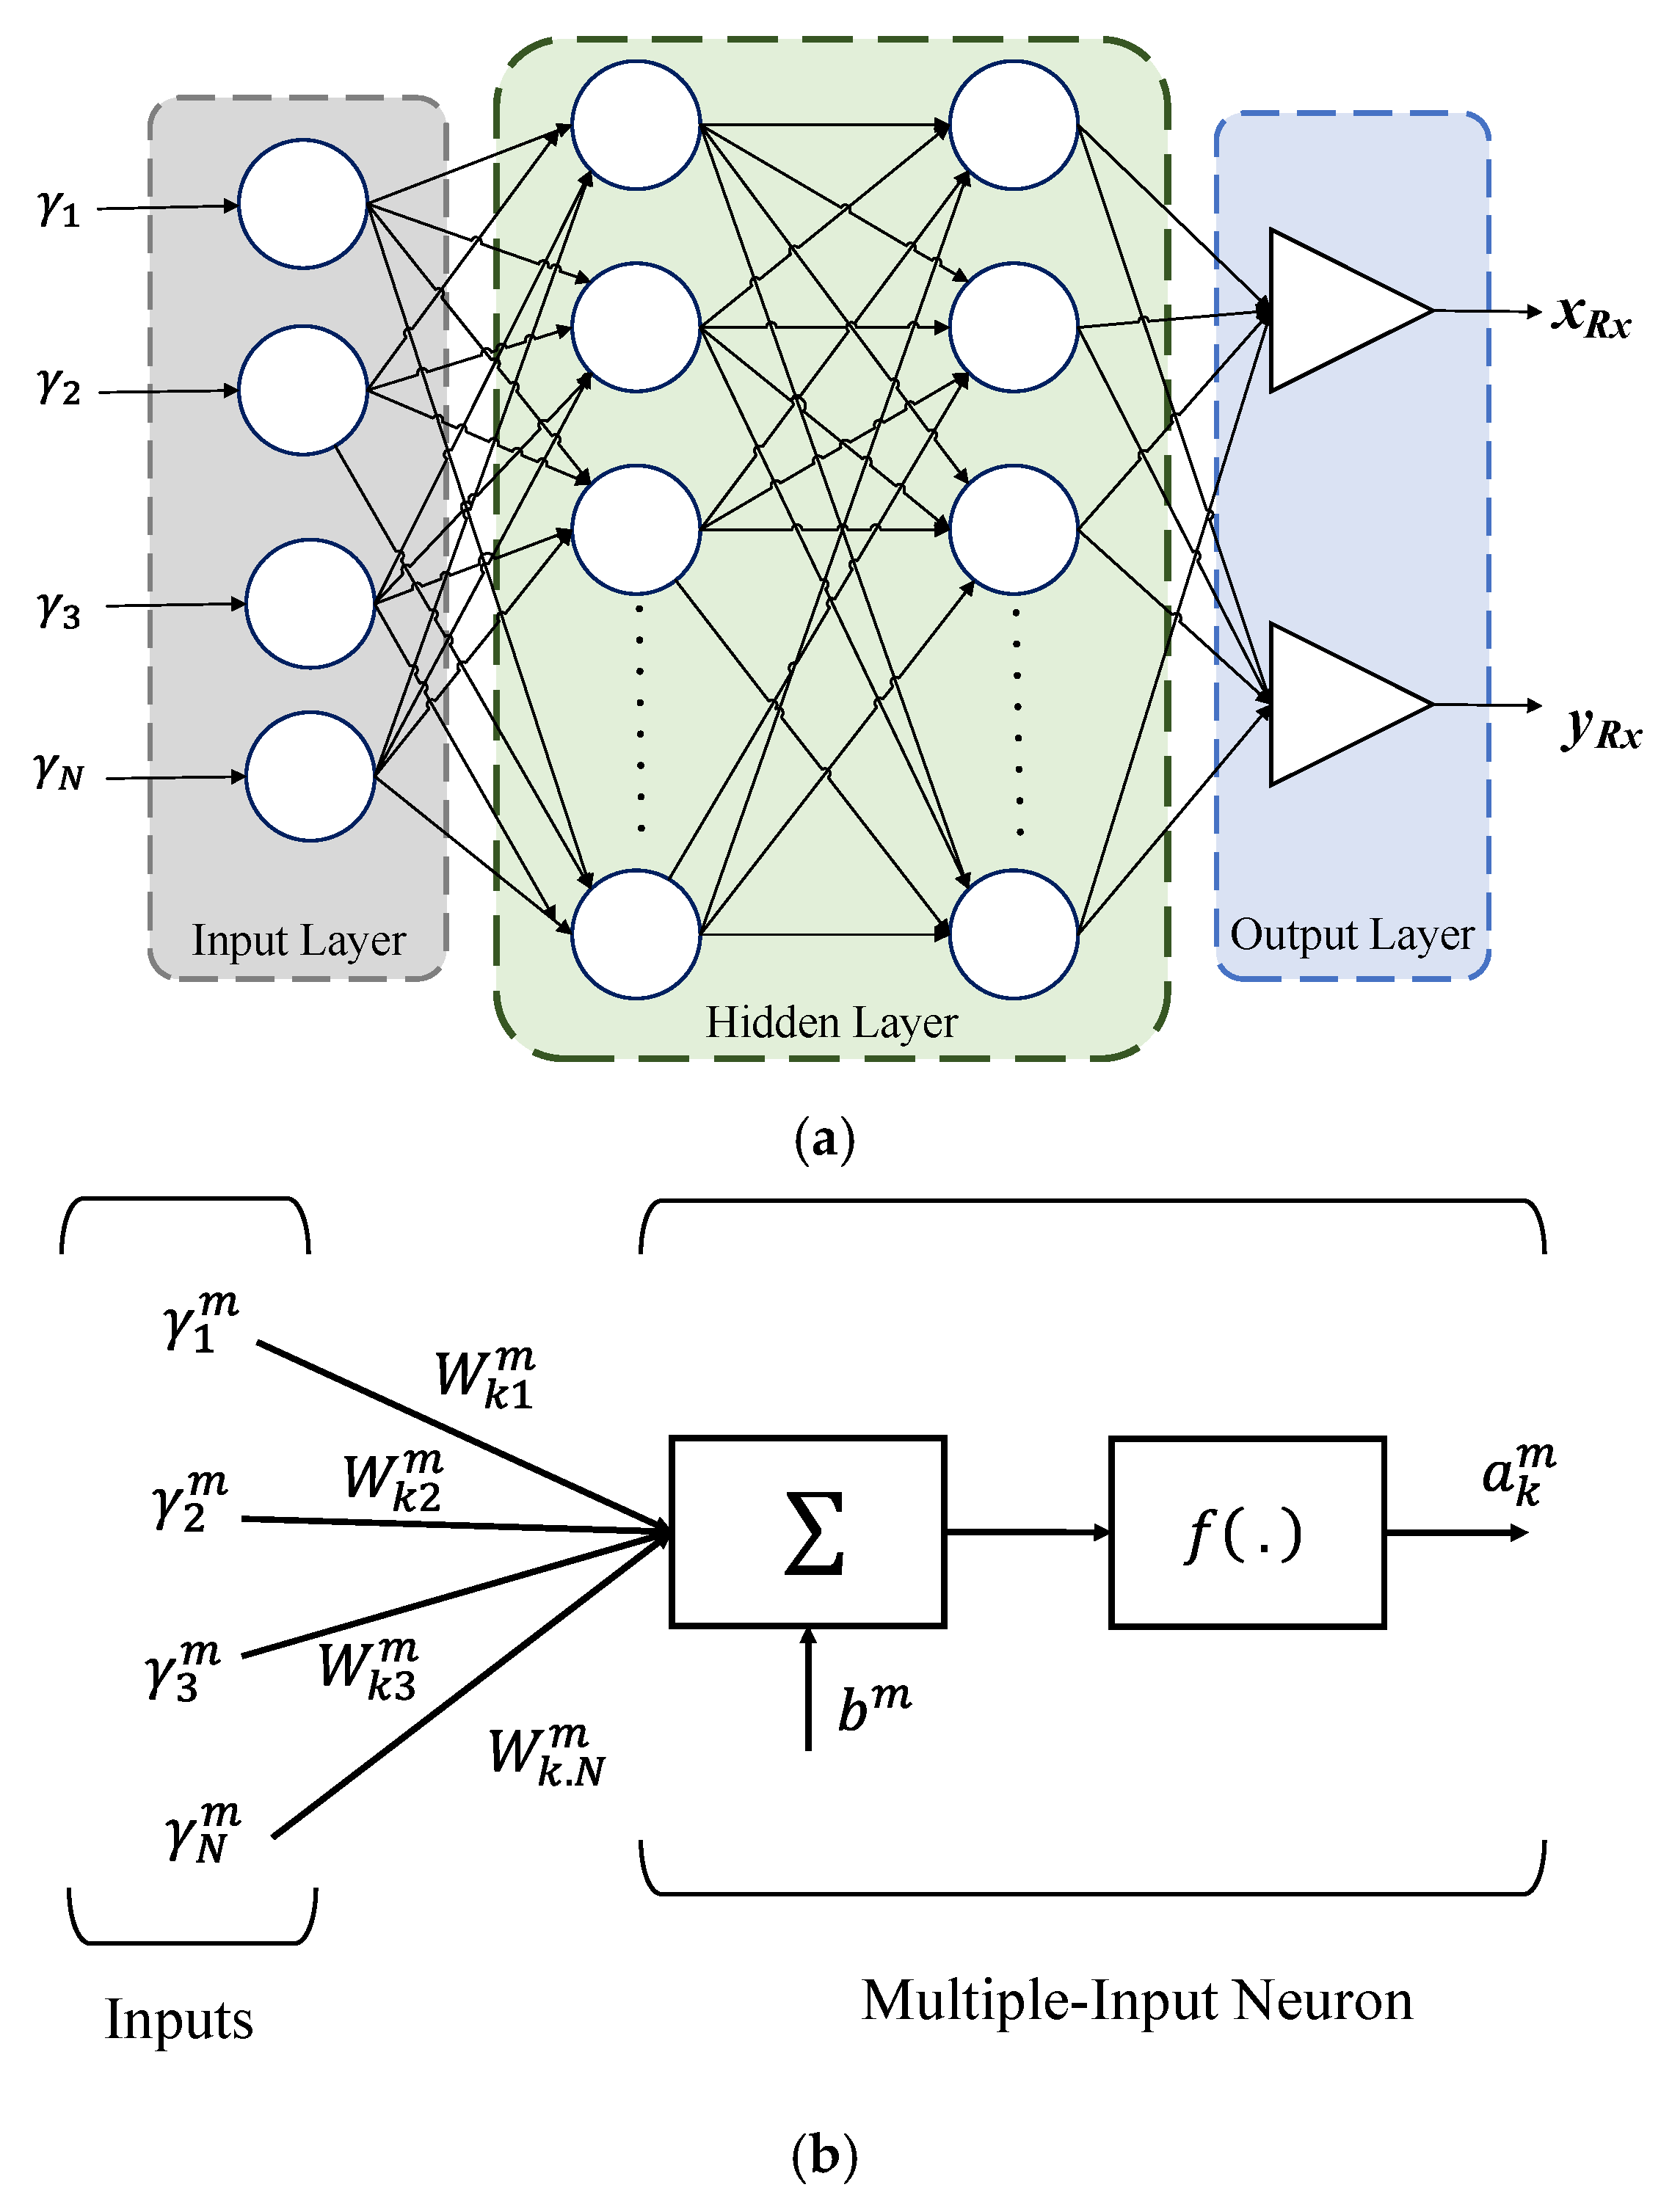
The Usage of ANN for Regression Analysis in Visible Light Positioning Systems
Abstract
1. Introduction
2. VLP System Modelling
2.1. System Model
2.2. Estimation Algorithms
3. The Concept of Neural Network
3.1. Use of ANN for Regression
3.2. ANN Training Methods
3.2.1. Levenberg–Marquardt Algorithm
3.2.2. Bayesian Regularization Algorithm
3.2.3. Scaled Conjugate Gradient Algorithm
4. Results and Discussion
4.1. VLP Error Performance
4.2. Selection of the Training Algorithm and Number of Neurons in the HL
4.3. Impact of Epochs and Noise Performance on the VLP System
4.4. Impact of Different Training Dataset Sizes on the VLP System
5. Conclusions
Author Contributions
Funding
Institutional Review Board Statement
Informed Consent Statement
Conflicts of Interest
Abbreviations
| Short Form | Description |
|---|---|
| ANN | Artificial neural network |
| AOA | Angle of arrival |
| BR | Bayesian regularization |
| FOV | Field of view |
| HLs | Hidden layers |
| HPA | Half-power angle |
| LEDs | Light-emitting diodes |
| LLS | Linear least square |
| LM | Levenberg-Marquardt |
| LoS | Line of sight |
| NLLS | Nonlinear least square |
| NLoS | Non-line of sight |
| OOK | On-off keying |
| PD | Photodiode |
| RF | Radio frequency |
| RSS | Received signal strength |
| Rx | Receiver |
| SCG | Scaled conjugate gradient |
| SNR | Signal to noise ratio |
| TOA | Time of arrival |
| Txs | Transmitters |
| VLC | Visible light communication |
| VLP | Visible light positioning |
References
- Kaplan, E.D.; Hegarty, C.J. Understanding GPS: Principles and Applications; Artech House: Boston, MA, USA, 1996. [Google Scholar]
- Zhuang, Y.; El-Sheimy, N. Tightly-Coupled Integration of WiFi and MEMS Sensors on Handheld Devices for Indoor Pedestrian Navigation. IEEE Sens. J. 2016, 16, 224–234. [Google Scholar] [CrossRef]
- Nieminen, J.; Gomez, C.; Isomaki, M.; Savolainen, T.; Patil, B.; Shelby, Z.; Xi, M.; Oller, J. Networking Solutions for Connecting Bluetooth Low Energy Enabled Machines to the Internet of Things. IEEE Netw. 2014, 28, 83–90. [Google Scholar] [CrossRef]
- Priyantha, N.B.; Miu, A.K.L.; Balakrishnan, H.; Teller, S. The Cricket Compass for Context-Aware Mobile Applications. In Proceedings of the 7th Annual International Conference on Mobile Computing and Networking, Rome, Italy, 16–21 July 2001; Association for Computing Machinery: New York, NY, USA, 2001; pp. 1–14. [Google Scholar]
- Liu, H.; Darabi, H.; Banerjee, P.; Liu, J. Survey of Wireless Indoor Positioning Techniques and Systems. IEEE Trans. Syst. Man Cybern. Part C Appl. Rev. 2007, 37, 1067–1080. [Google Scholar] [CrossRef]
- Hsu, C.-W.; Liu, S.; Lu, F.; Chow, C.-W.; Yeh, C.-H.; Chang, G.-K. Accurate Indoor Visible Light Positioning System Utilizing Machine Learning Technique with Height Tolerance. In Proceedings of the 2018 Optical Fiber Communications Conference and Exposition (OFC), San Diego, CA, USA, 11–15 March 2018. [Google Scholar] [CrossRef]
- Hassan, N.U.L.; Adeel Pasha, M.; Naeem, A.; Jadoon, T.M. Indoor Positioning Using Visible LED Lights: A Survey. ACM Trans. Sens. Netw. 2015, 11, 1–30. [Google Scholar] [CrossRef]
- Do, T.-H.; Yoo, M. An In-Depth Survey of Visible Light Communication Based Positioning Systems. Sensors 2016, 16, 678. [Google Scholar] [CrossRef]
- Yassin, A.; Nasser, Y.; Awad, M.; Al-Dubai, A.; Liu, R.; Yuen, C.; Raulefs, R.; Aboutanios, E. Recent Advances in Indoor Localization: A Survey on Theoretical Approaches and Applications. IEEE Commun. Surv. Tutor. 2017, 19, 1327–1346. [Google Scholar] [CrossRef]
- Luo, J.; Fan, L.; Li, H. Indoor Positioning Systems Based on Visible Light Communication: State of the Art. IEEE Commun. Surv. Tutor. 2017, 19, 2871–2893. [Google Scholar] [CrossRef]
- Wang, K.; Nirmalathas, A.; Lim, C.; Skafidas, E. Optical Wireless-Based Indoor Localization System Employing a Single-Channel Imaging Receiver. J. Lightwave Technol. 2016, 34, 9. [Google Scholar] [CrossRef]
- Kim, H.S.; Kim, D.R.; Yang, S.H.; Son, Y.H.; Han, S.K. An Indoor Visible Light Communication Positioning System Using a RF Carrier Allocation Technique. J. Lightwave Technol. 2013, 31, 134–144. [Google Scholar] [CrossRef]
- Zheng, H.; Xu, Z.; Yu, C.; Gurusamy, M. Indoor Three-Dimensional Positioning Based on Visible Light Communication Using Hamming Filter. Opt. InfoBase Conf. Pap. 2016, 2016, 4–6. [Google Scholar] [CrossRef]
- Xiang Liu, X.L.; Aiying Yang, A.Y.; Yu Wang, Y.W.; Feng, L. Combination of Light-Emitting Diode Positioning Identification and Time-Division Multiplexing Scheme for Indoor Location-Based Service. Chin. Opt. Lett. 2015, 13, 120601–120606. [Google Scholar] [CrossRef]
- Chaudhary, N.; Alves, L.N.; Ghassemblooy, Z. Current Trends on Visible Light Positioning Techniques. In Proceedings of the 2nd West Asian Colloquium on Optical Wireless Communications (WACOWC), Tehran, Iran, 27–28 April 2019; pp. 100–105. [Google Scholar] [CrossRef]
- Plets, D.; Almadani, Y.; Bastiaens, S.; Ijaz, M.; Martens, L.; Joseph, W. Efficient 3D Trilateration Algorithm for Visible Light Positioning. J. Opt. 2019, 21, 05LT01. [Google Scholar] [CrossRef]
- Heqing Huang, H.H.; Aiying Yang, A.Y.; Lihui Feng, L.F.; Guoqiang Ni, G.N.; Guo, P. Artificial Neural-Network-Based Visible Light Positioning Algorithm with a Diffuse Optical Channel. Chin. Opt. Lett. 2017, 15, 050601–050605. [Google Scholar] [CrossRef][Green Version]
- Gu, W.; Aminikashani, M.; Deng, P.; Kavehrad, M. Impact of Multipath Reflections on the Performance of Indoor Visible Light Positioning Systems. J. Lightwave Technol. 2016, 34, 2578–2587. [Google Scholar] [CrossRef]
- Lin, B.; Guo, Q.; Lin, C.; Tang, X.; Zhou, Z.; Ghassemlooy, Z. Experimental Demonstration of an Indoor Positioning System Based on Artificial Neural Network. Opt. Eng. 2019, 58, 1. [Google Scholar] [CrossRef]
- Zhang, H.; Cui, J.; Feng, L.; Yang, A.; Lv, H.; Lin, B.; Huang, H. High-Precision Indoor Visible Light Positioning Using Deep Neural Network Based on the Bayesian Regularization with Sparse Training Point. IEEE Photonics J. 2019, 11, 1–10. [Google Scholar] [CrossRef]
- Zhang, S.; Du, P.; Chen, C.; Zhong, W.-D.; Alphones, A. Robust 3D Indoor VLP System Based on ANN Using Hybrid RSS/PDOA. IEEE Access 2019, 7, 47769–47780. [Google Scholar] [CrossRef]
- Zhang, W.; Kavehrad, M. A 2-D Indoor Localization System Based on Visible Light LED. In Proceedings of the 2012 IEEE Photonics Society Summer Topical Meeting Series, Seattle, WA, USA, 9–11 July 2012; IEEE: Seattle, WA, USA, 2012; pp. 80–81. [Google Scholar]
- Zhou, Z. Indoor Positioning Algorithm Using Light-Emitting Diode Visible Light Communications. Opt. Eng 2012, 51, 085009. [Google Scholar] [CrossRef]
- Aminikashani, M.; Gu, W.; Kavehrad, M. Indoor Location Estimation with Optical-Based OFDM Communications. arXiv 2015, arXiv:1506.07571. [Google Scholar]
- Chaudhary, N.; Alves, L.N.; Ghassemlooy, Z. Impact of Transmitter Positioning and Orientation Uncertainty on RSS-Based Visible Light Positioning Accuracy. Sensors 2021, 21, 3044. [Google Scholar] [CrossRef]
- Chaudhary, N.; Younus, O.I.; Alves, L.N.; Ghassemlooy, Z.; Zvanovec, S.; Le-Minh, H. An Indoor Visible Light Positioning System Using Tilted LEDs with High Accuracy. Sensors 2021, 21, 920. [Google Scholar] [CrossRef] [PubMed]
- Komine, T.; Nakagawa, M. Fundamental Analysis for Visible-Light Communication System Using LED Lights. IEEE Trans. Consum. Electron. 2004, 50, 100–107. [Google Scholar] [CrossRef]
- Pandey, O.J.; Sharan, R.; Hegde, R.M. Localization in Wireless Sensor Networks Using Visible Light in Non-Line of Sight Conditions. Wirel. Pers. Commun. 2017, 97, 6519–6539. [Google Scholar] [CrossRef]
- Uysal, M.; Baykas, T.; Jungnickel, V. IEEE 802.11bb Reference Channel Models for Indoor Environments; IEEE: Piscataway, NJ, USA, 2018; p. 60. [Google Scholar]
- Chaudhary, N.; Alves, L.N.; Ghassemblooy, Z. Feasibility Study of Reverse Trilateration Strategy with a Single Tx for VLP. In Proceedings of the 2nd West Asian Colloquium on Optical Wireless Communications (WACOWC), Tehran, Iran, 27–28 April 2019; pp. 121–126. [Google Scholar]
- Ghassemlooy, Z.; Popoola, W.; Rajbhandari, S. Optical Wireless Communications System and Channel Modelling with MATLAB®, 2nd ed.; CRC Press: Boca Raton, FL, USA, 2019. [Google Scholar]
- Shawky, S.; El-Shimy, M.A.; El-Sahn, Z.A.; Rizk, M.R.M.; Aly, M.H. Improved VLC-Based Indoor Positioning System Using a Regression Approach with Conventional RSS Techniques. In Proceedings of the 13th International Wireless Communications and Mobile Computing Conference, IWCMC 2017, Valencia, Spain, 26–30 June 2017; pp. 904–909. [Google Scholar] [CrossRef]
- Chaudhary, N.; Alves, L.N.; Ghassemlooy, Z. Impact of Transmitter Positioning Uncertainty on RSS-Based Visible Light Positioning Accuracy. In Proceedings of the 12th IEEE/IET International Symposium on Communication Systems, Networks and Digital Signal Processing-CSNDSP, Porto, Portugal, 20–22 July 2020. [Google Scholar]
- Hagan, M.T.; Demuth, H.B.; Beale, M. Neural Network Design; PWS Publishing Co.: Boston, MA, USA, 1997. [Google Scholar]
- Nwankpa, C.; Ijomah, W.; Gachagan, A.; Marshall, S. Activation Functions: Comparison of Trends in Practice and Research for Deep Learning. arXiv 2018, arXiv:1811.03378. [Google Scholar]
- Shiquan, W.; Fang, W. Computation of a Trust Region Step. Acta Math. Appl. Sin. 1991, 7, 354–362. [Google Scholar] [CrossRef]
- Lera, G.; Pinzolas, M. Neighborhood Based Levenberg-Marquardt Algorithm for Neural Network Training. IEEE Trans. Neural Netw. 2002, 13, 1200–1203. [Google Scholar] [CrossRef]
- Møller, M.F. A Scaled Conjugate Gradient Algorithm for Fast Supervised Learning. Neural Netw. 1993, 6, 525–533. [Google Scholar] [CrossRef]


| Notation | Definition |
|---|---|
| Positioning error | |
| ht | Height of the Tx |
| hr | Height of the Rx |
| m | Lambertian mode |
| Total received power from the ith Tx | |
| Received power from the ith Tx due to the path loss | |
| Received power from ith Tx due to NLoS path | |
| Additive white Gaussian noise | |
| Distance between the ith Tx and the Rx | |
| The irradiance angle from the ith Tx to the Rx | |
| φ | Incident angle |
| Photodiode responsivity | |
| Transmitted power from the ith Tx | |
| Ts | Transmittance function |
| g | Concentrator gain of the Rx |
| Area of the photodetector | |
| The horizontal distance from the ith Tx to the Rx | |
| h | The difference in height between the Tx and Rx, i.e., (ht− hr) |
| The distances, receiving incident angle, and the irradiance angle between the ith Tx and the reflective area, respectively | |
| The distances, receiving incident angle, and the irradiance angle between the reflective area and the Rx, respectively | |
| ρ | The reflectance factor depending on the material of the reflective surface |
| Reflectance area | |
| Coefficients of the polynomial model for the order polynomial | |
| The estimated position of the Rx | |
| Averaged squared error | |
| The estimated position of the Rx. | |
| Weight | |
| The vector containing all the network weights and biases for the neuron i.e., | |
| The network output for the kth neuron | |
| The target output of the network for the kth neuron | |
| Learning rate | |
| Maximum number of layers | |
| Bias vector | |
| m | Number of layers |
| k | Number of neurons |
| Input vector, | |
| N | Total number of inputs |
| Number of inputs | |
| Error matrix | |
| Sensitivity matrix | |
| Least mean square error function | |
| F | Mean square error |
| Jacobian matrix | |
| A scalar | |
| I | Identity matrix |
| Squared error | |
| Sum of squared weights | |
| Regularization parameters | |
| Effective number of parameters | |
| Hessian matrix | |
| Total number of parameters (weights and biases) of the network | |
| The trace of the inverse of Hessian matrix | |
| Quadratic approximation of the error function, | |
| The set of non-zero weight vectors | |
| Second-order information | |
| A Scalar | |
| Comparison parameter | |
| Percentage of the confidence interval | |
| Quantile function | |
| Minimum positioning error | |
| Step size |
| Dataset A | Dataset B | |
|---|---|---|
| Grid size | 60 × 60 | 100 × 100 |
| Total number of sample | 18,000 | 50,000 |
| Parameter | Value |
|---|---|
| Room size | 6 × 6 × 3 m3 |
| Locations of the Txs | |
| , , , | (−1.7, −1.7, 3), |
| , , , | (−1.7, 1.7, 3), |
| , , , | (1.7, −1.7, 3), |
| , , ) | (1.7, 1.7, 3) |
| Area of PD | 10−4 m2 |
| Half-power angle (HPA) | 70° |
| Responsivity of PD | 0.5 A/W |
| Field of view (FOV) | 75° |
| Transmitted power | 1 W |
| Reflection coefficient | 0.7 |
| Activation function | Sigmoid, linear |
| Number of neurons in the input layer | 4 |
| Number of neurons in the hidden layer | 2–36 |
| Number of neurons in the output layer | 2 |
| Number of hidden layers | 2 |
| Percentage of train to test | 0.8 |
| Algorithms | Neurons in HL 1 | Neurons in HL 2 | |
|---|---|---|---|
| LM | 0.11 | 36 | 36 |
| BR | 0.06 | 32 | 28 |
| BR | RSS with NLLS | |
|---|---|---|
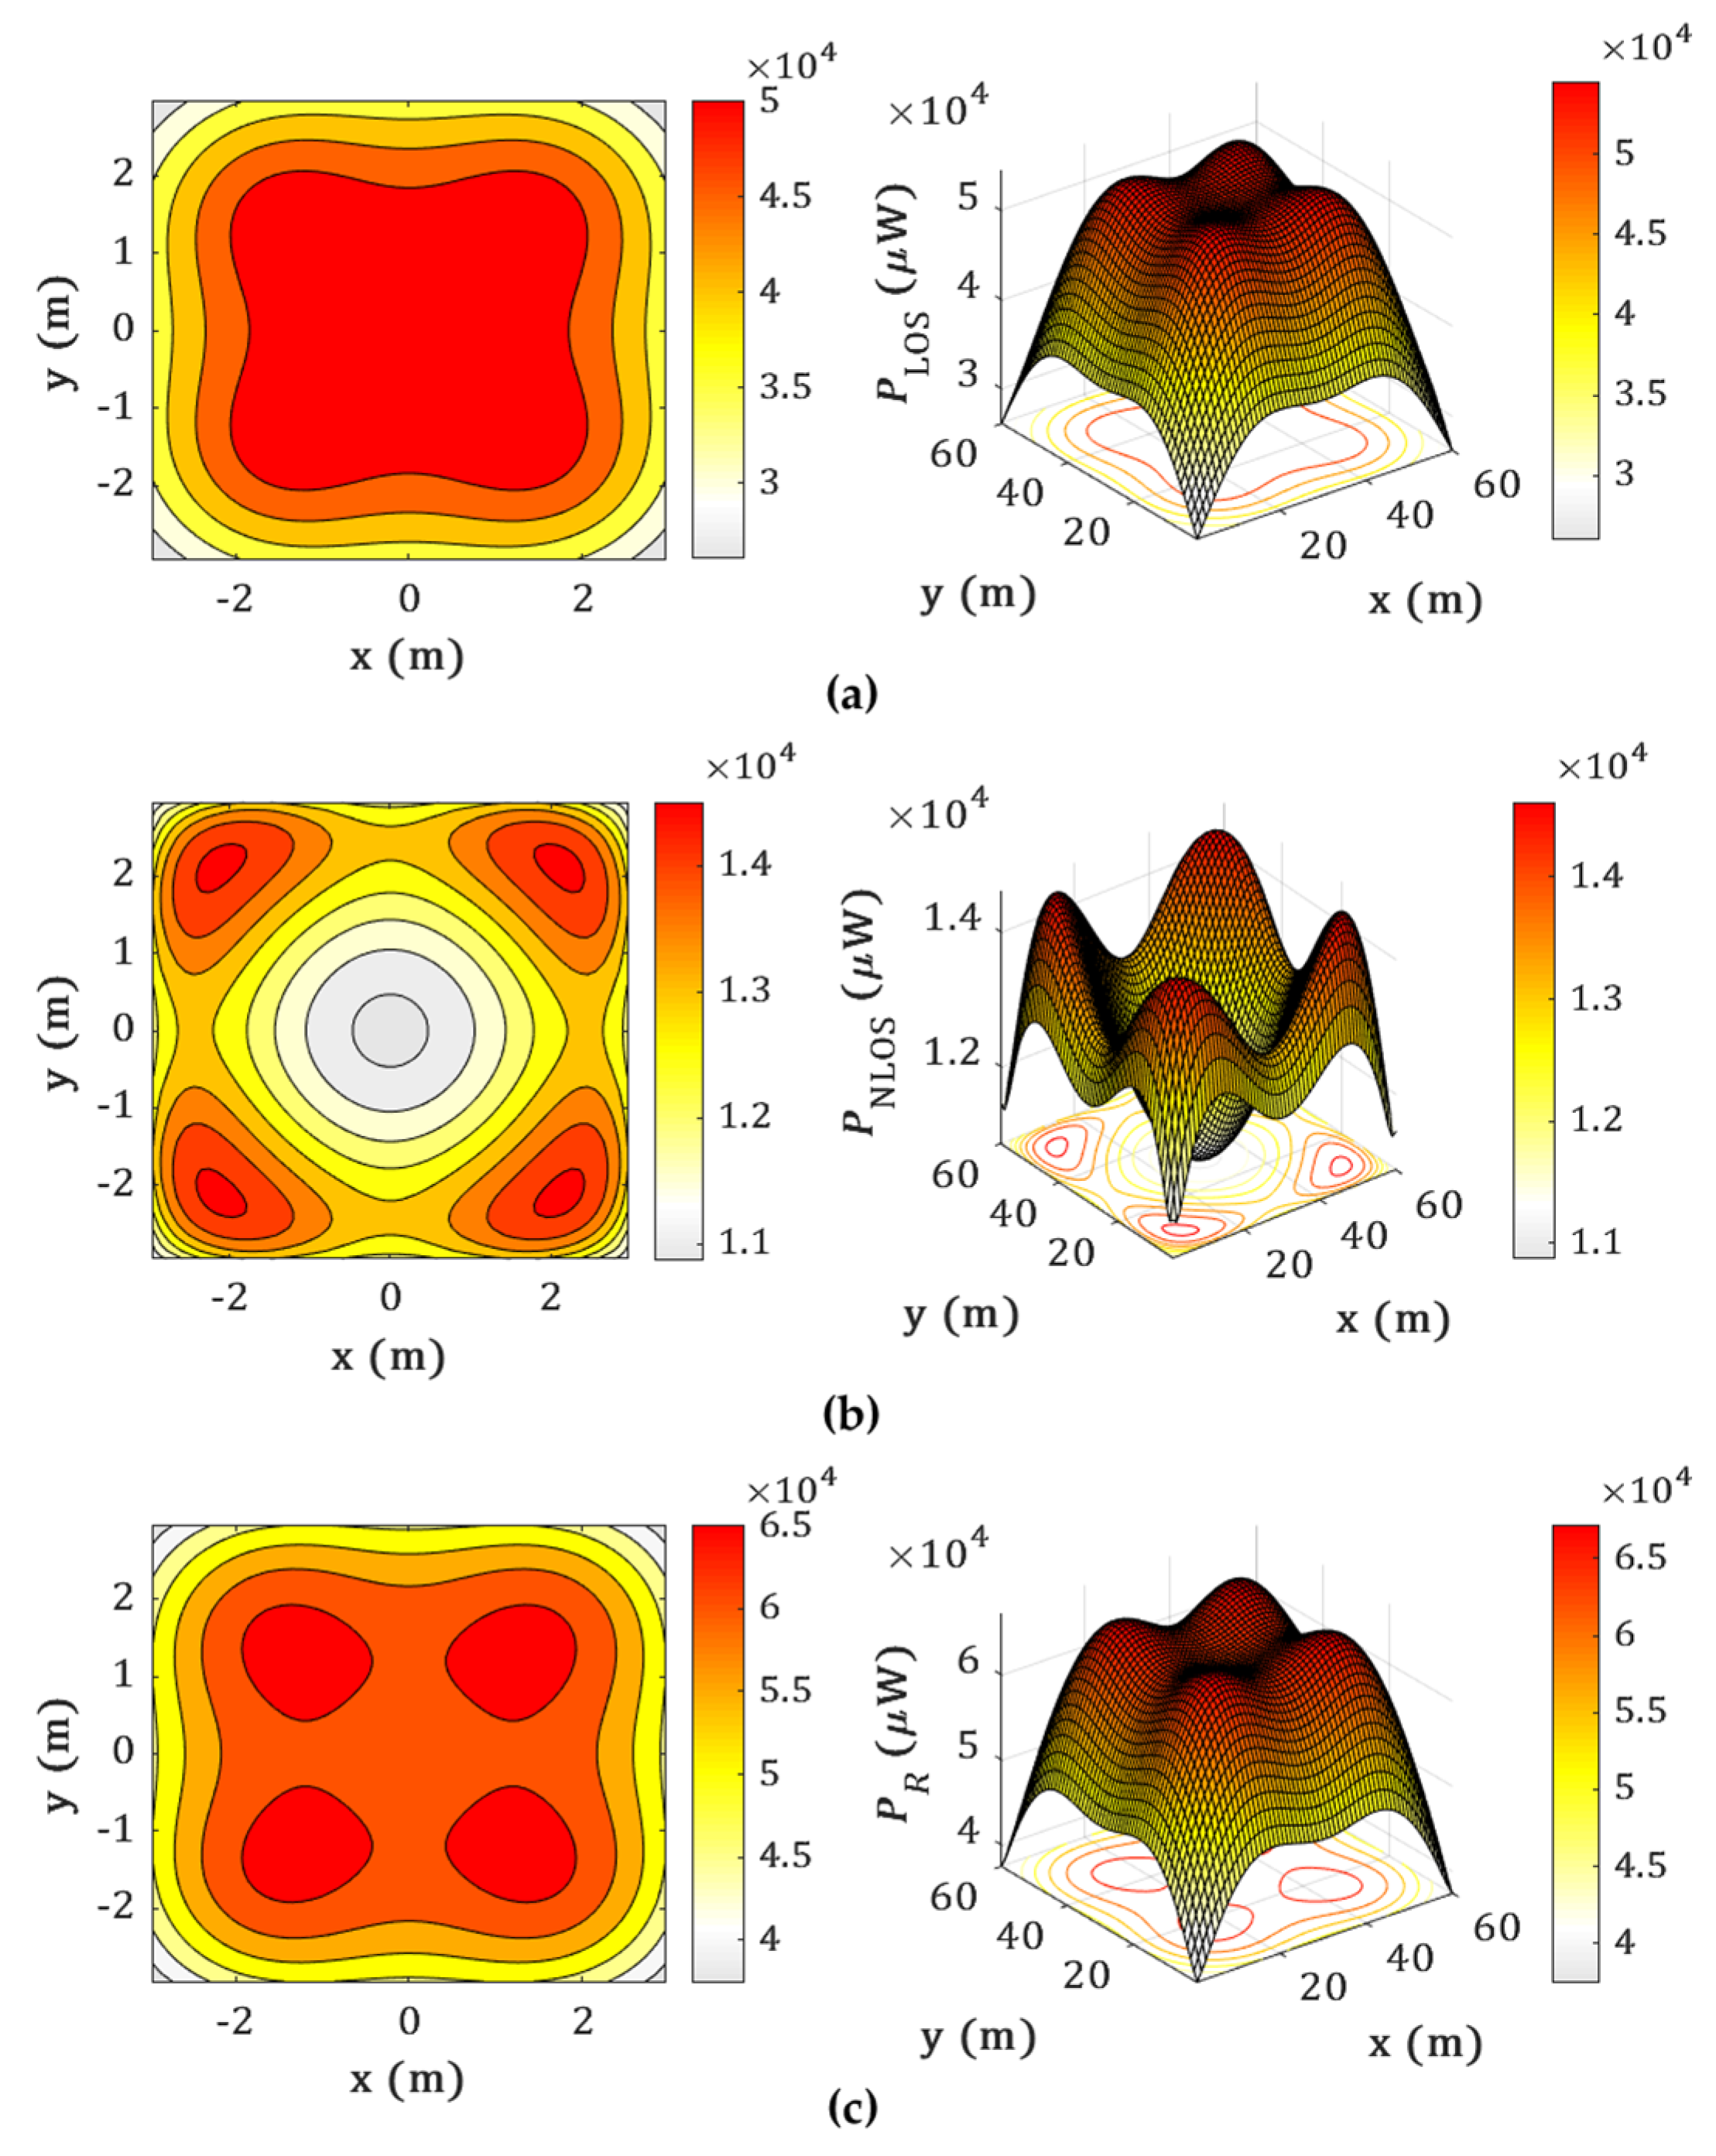
| Max. PR (µW) | 6.7 × 10⁴ | 6.7 × 10⁴ |
| Min. PR (µW) | 3.6 × 10⁴ | 3.6 × 10⁴ |
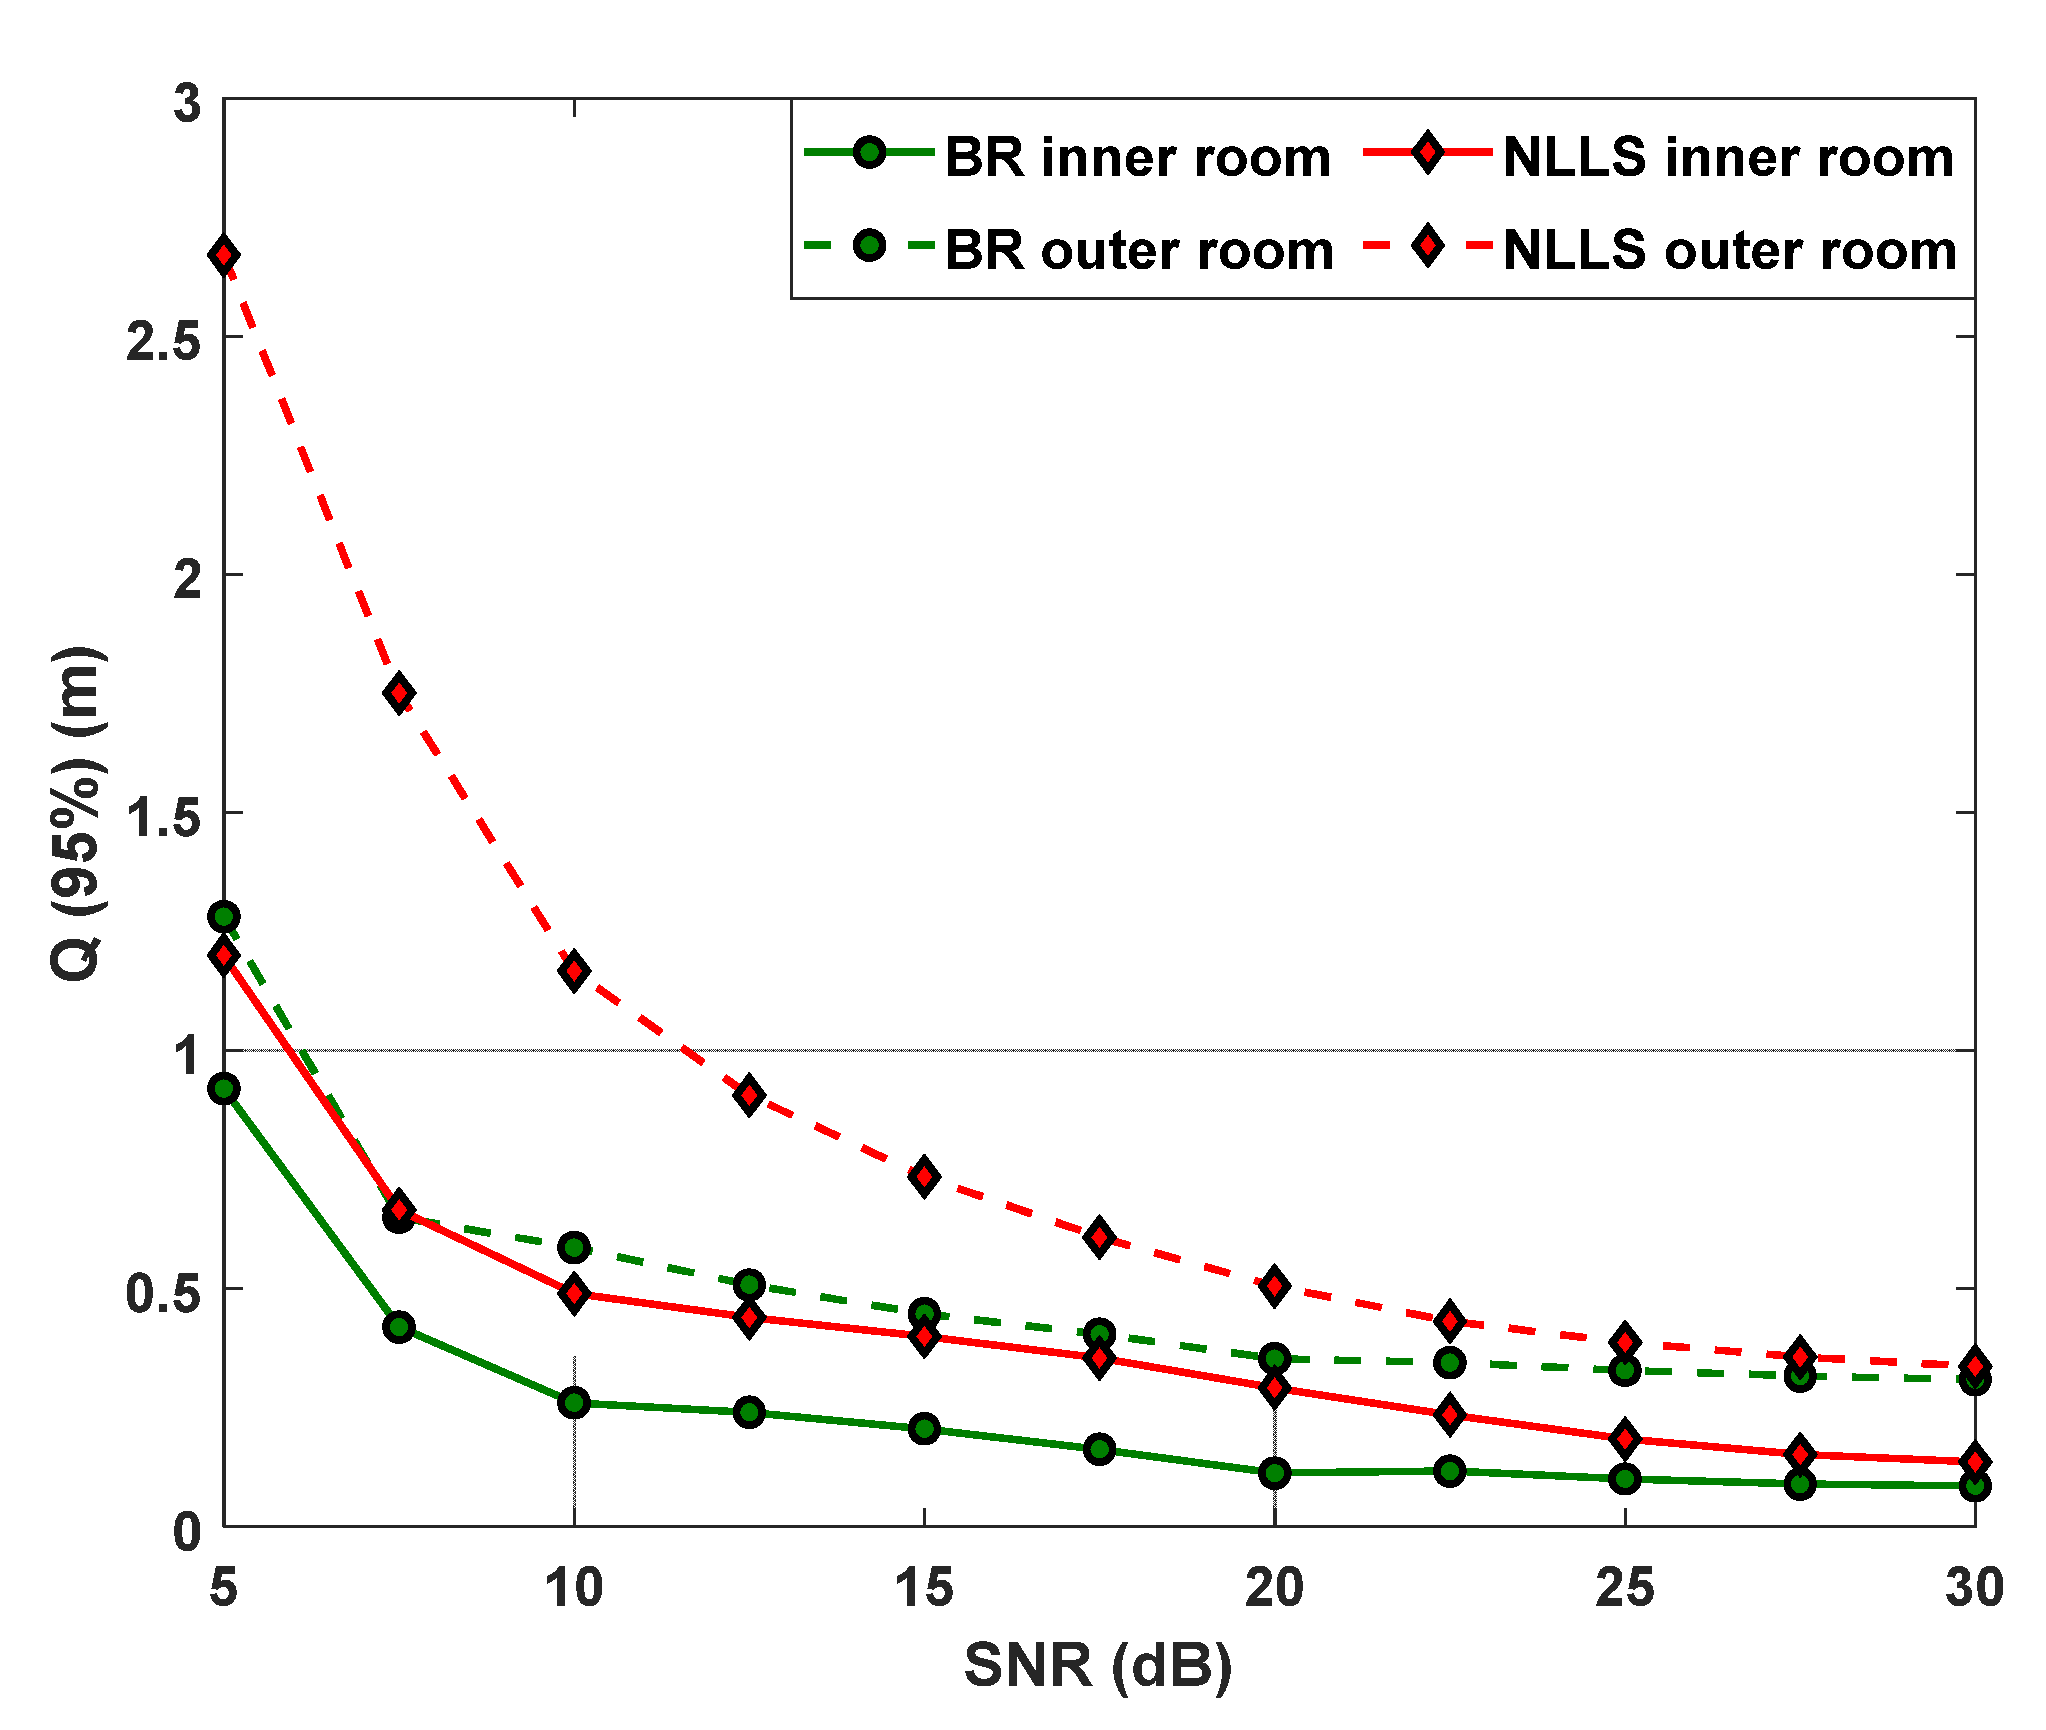
| Max. at 20 dB (m) | 0.89 | 1.29 |
| Min. at 20 dB (m) | 16 × 10−4 | 18 × 10−4 |
| Max. at 25 dB (m) | 0.71 | 0.72 |
| Min. at 25 dB (m) | 6.1 × 10⁻⁴ | 15 × 10−4 |
| Max. at 30 dB (m) | 0.54 | 0.67 |
| Min. at 30 dB (m) | 5.4 × 10⁻⁴ | 4.6 × 10⁻⁴ |
Publisher’s Note: MDPI stays neutral with regard to jurisdictional claims in published maps and institutional affiliations. |
© 2022 by the authors. Licensee MDPI, Basel, Switzerland. This article is an open access article distributed under the terms and conditions of the Creative Commons Attribution (CC BY) license (https://creativecommons.org/licenses/by/4.0/).
Share and Cite
Chaudhary, N.; Younus, O.I.; Alves, L.N.; Ghassemlooy, Z.; Zvanovec, S. The Usage of ANN for Regression Analysis in Visible Light Positioning Systems. Sensors 2022, 22, 2879. https://doi.org/10.3390/s22082879
Chaudhary N, Younus OI, Alves LN, Ghassemlooy Z, Zvanovec S. The Usage of ANN for Regression Analysis in Visible Light Positioning Systems. Sensors. 2022; 22(8):2879. https://doi.org/10.3390/s22082879
Chicago/Turabian StyleChaudhary, Neha, Othman Isam Younus, Luis Nero Alves, Zabih Ghassemlooy, and Stanislav Zvanovec. 2022. "The Usage of ANN for Regression Analysis in Visible Light Positioning Systems" Sensors 22, no. 8: 2879. https://doi.org/10.3390/s22082879
APA StyleChaudhary, N., Younus, O. I., Alves, L. N., Ghassemlooy, Z., & Zvanovec, S. (2022). The Usage of ANN for Regression Analysis in Visible Light Positioning Systems. Sensors, 22(8), 2879. https://doi.org/10.3390/s22082879


