
Simultaneous EEG-fMRI: What Have We Learned and What Does the Future Hold?

Abstract
1. Introduction
2. Measurement Principles
2.1. EEG
2.2. fMRI
2.3. Combining EEG and fMRI
3. Challenges
3.1. Safety
3.2. Data Quality
3.2.1. EEG Data Quality in the MR Environment
3.2.2. MRI Data Quality in the Presence of an EEG System
3.3. Data Integration
4. Applications of EEG-fMRI
4.1. What Can We Measure Using EEG-fMRI?
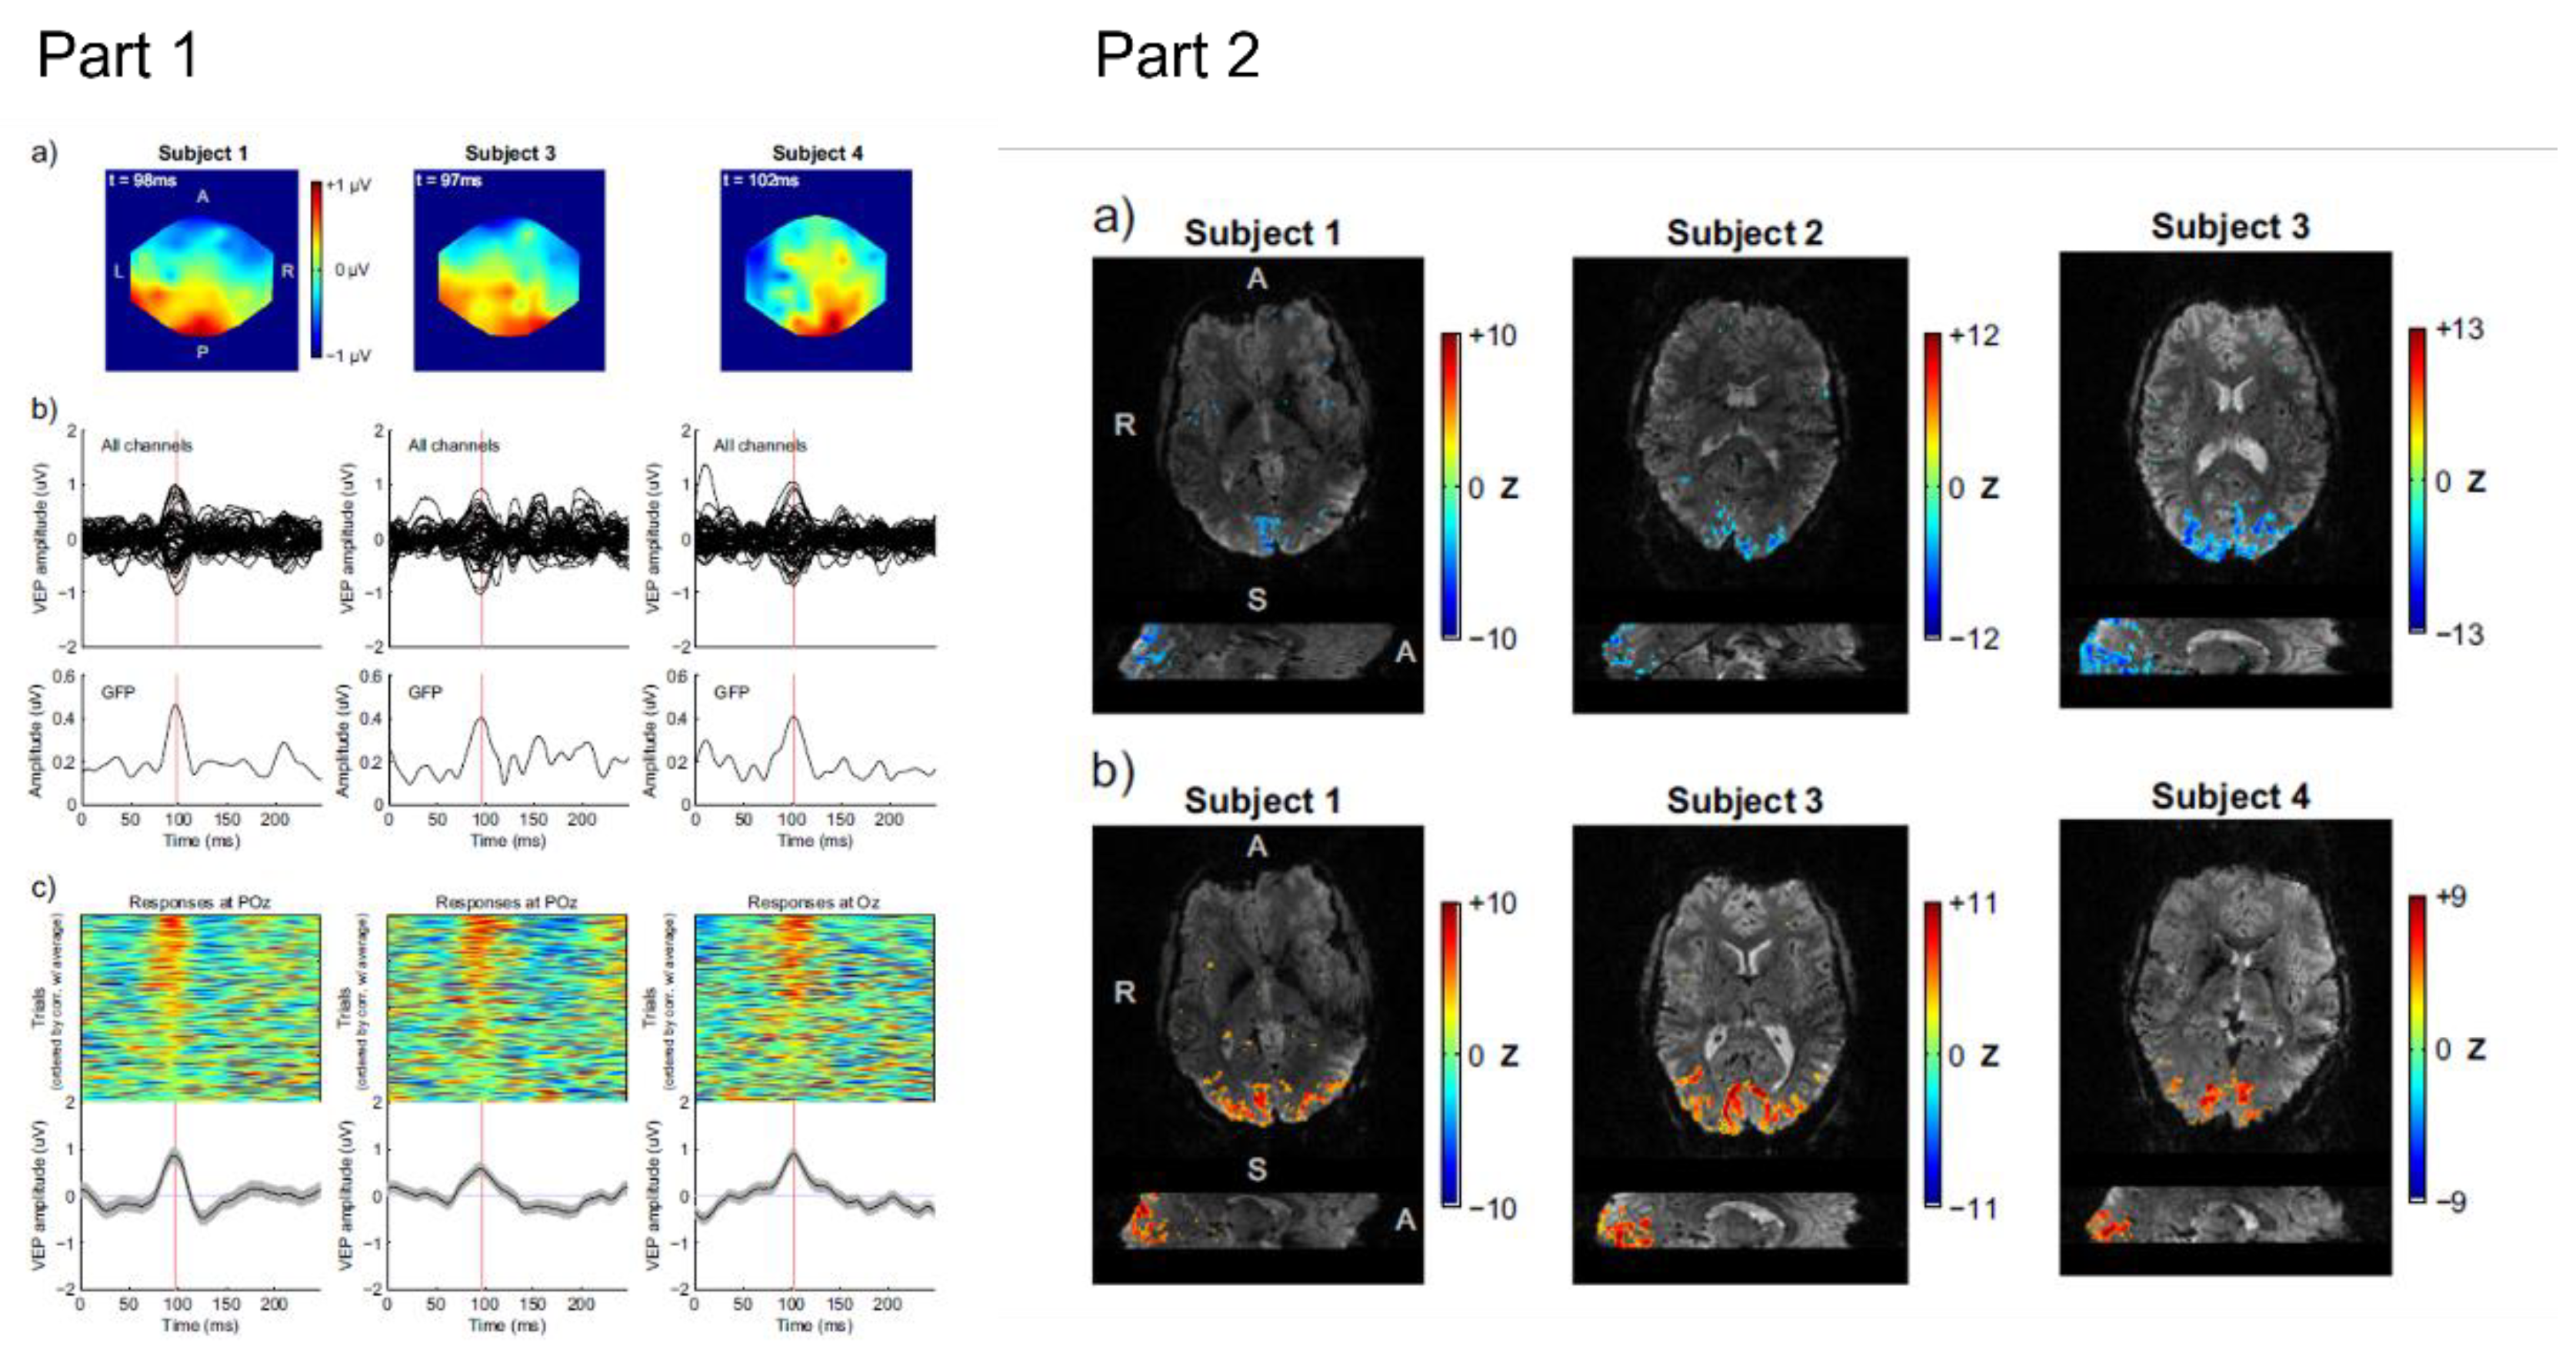
4.2. Event-Related Responses
4.3. EEG Frequency Content
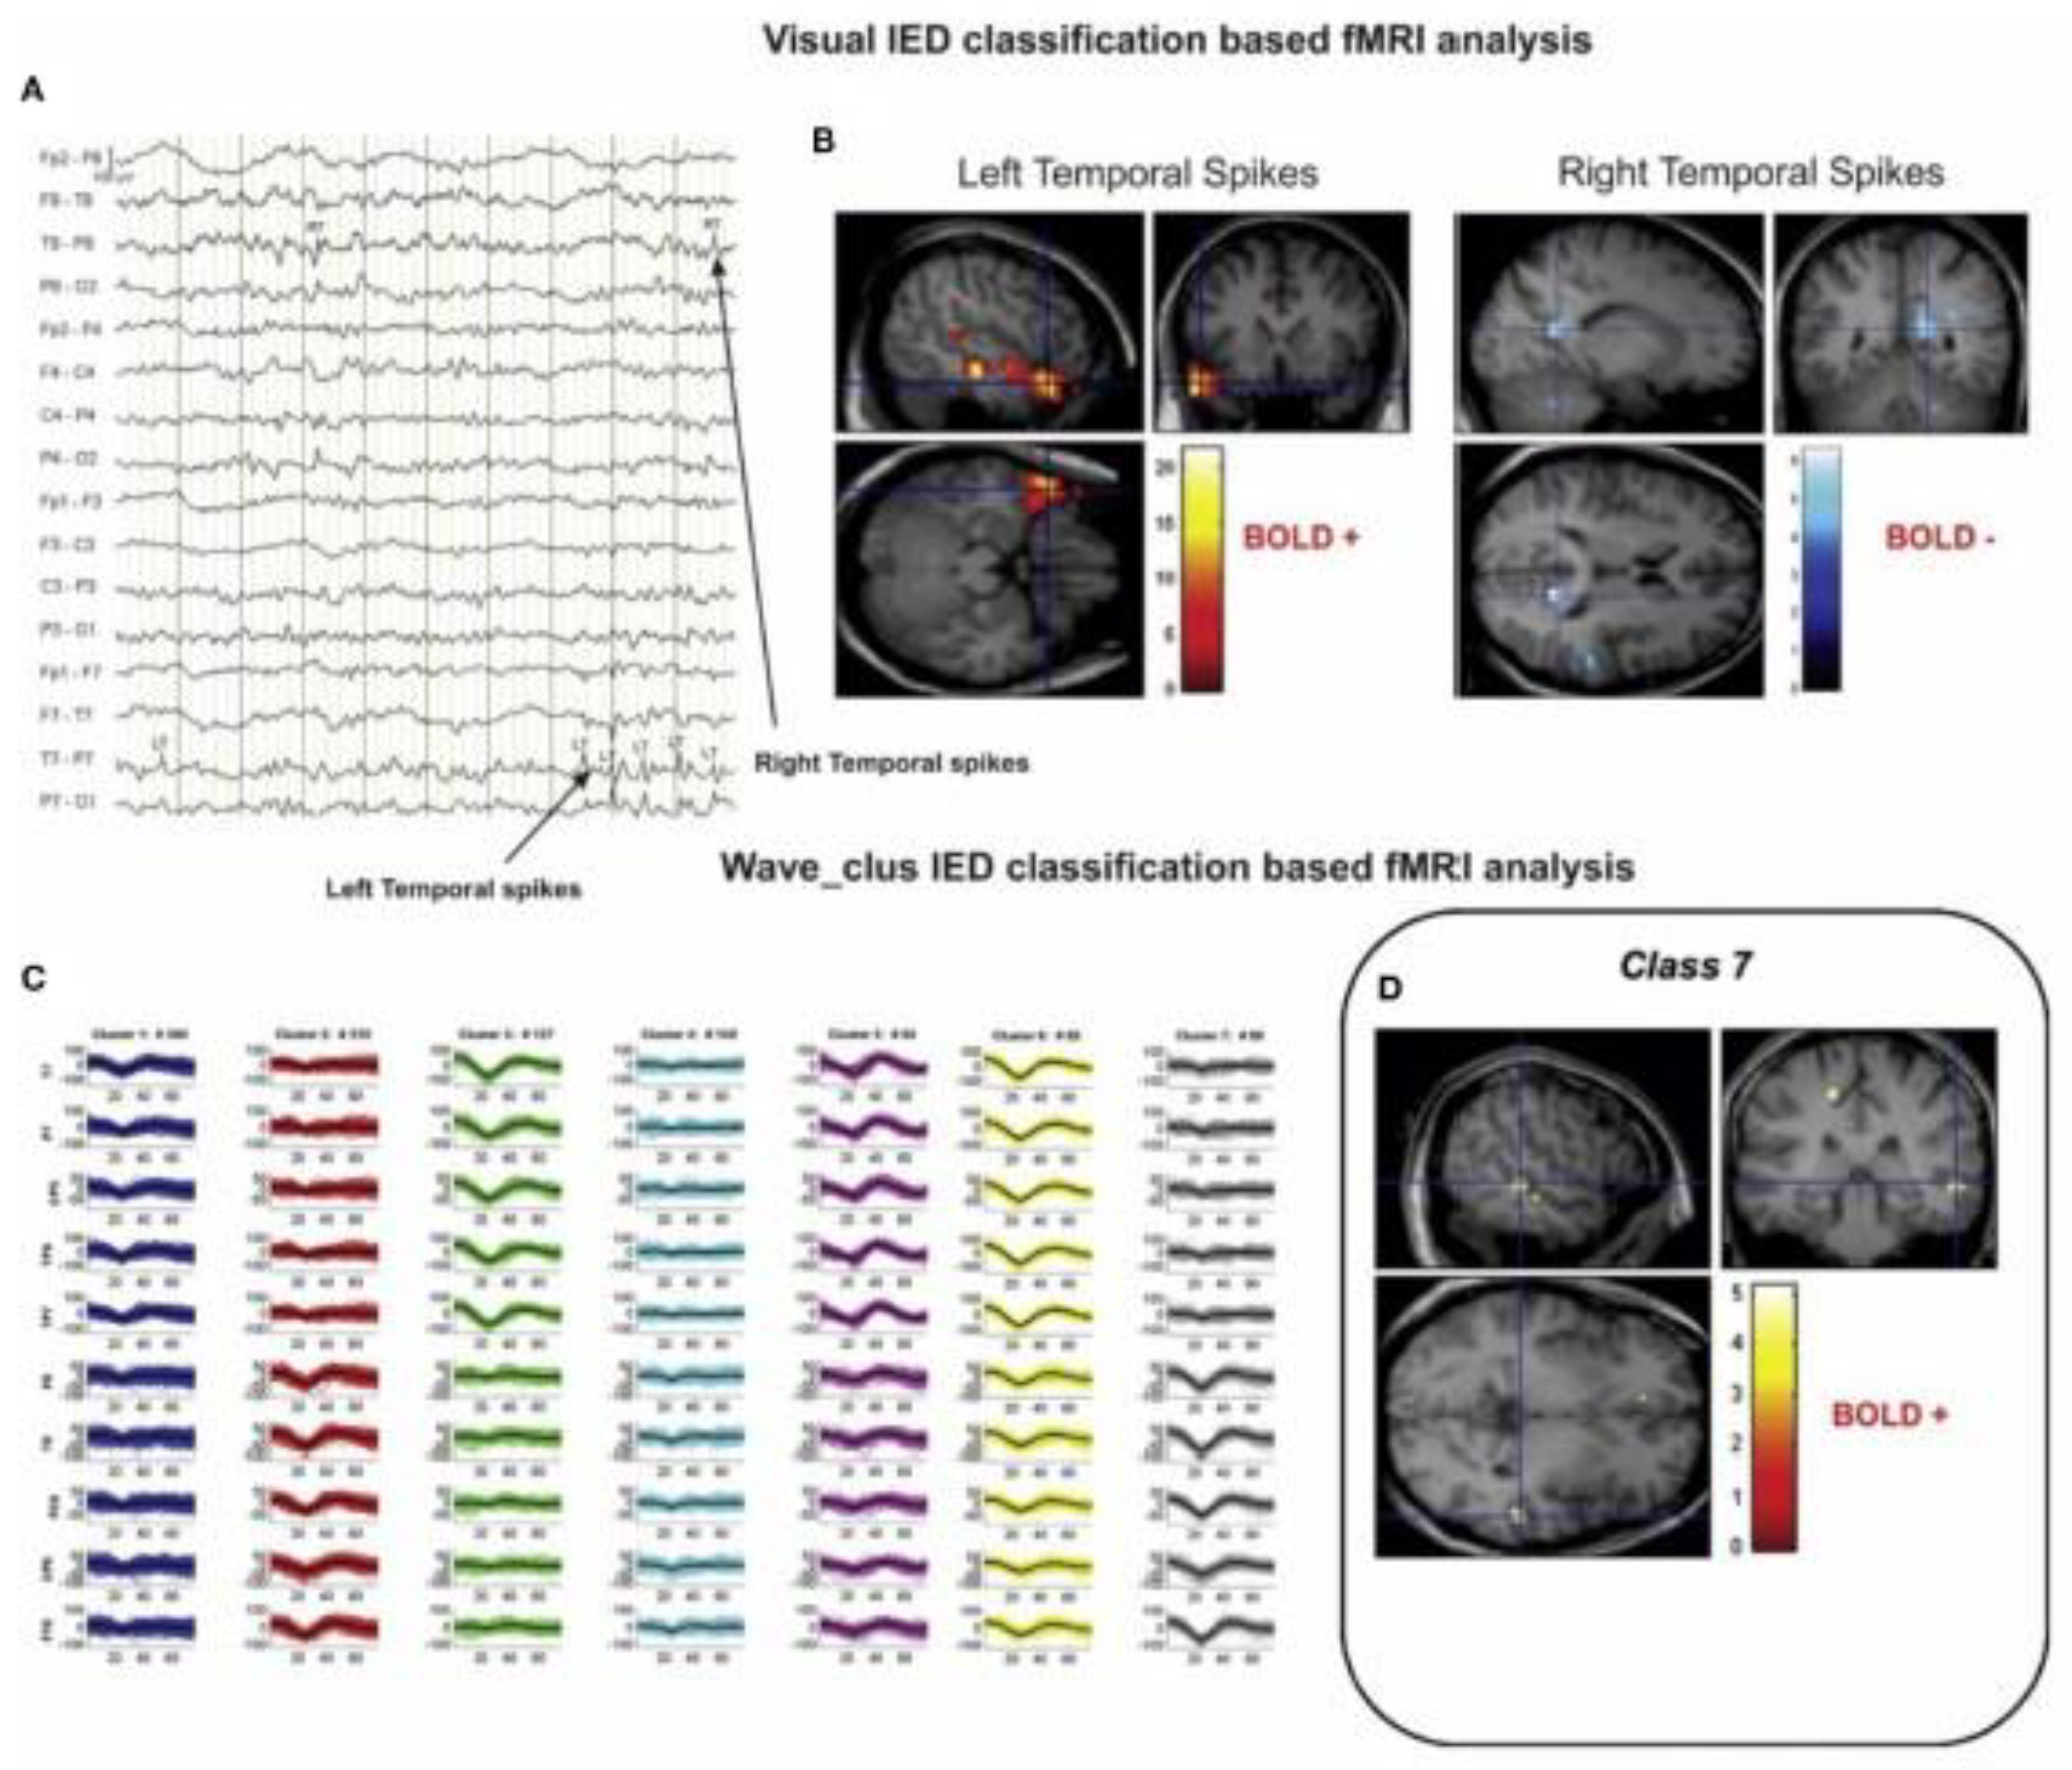
4.4. Epilepsy
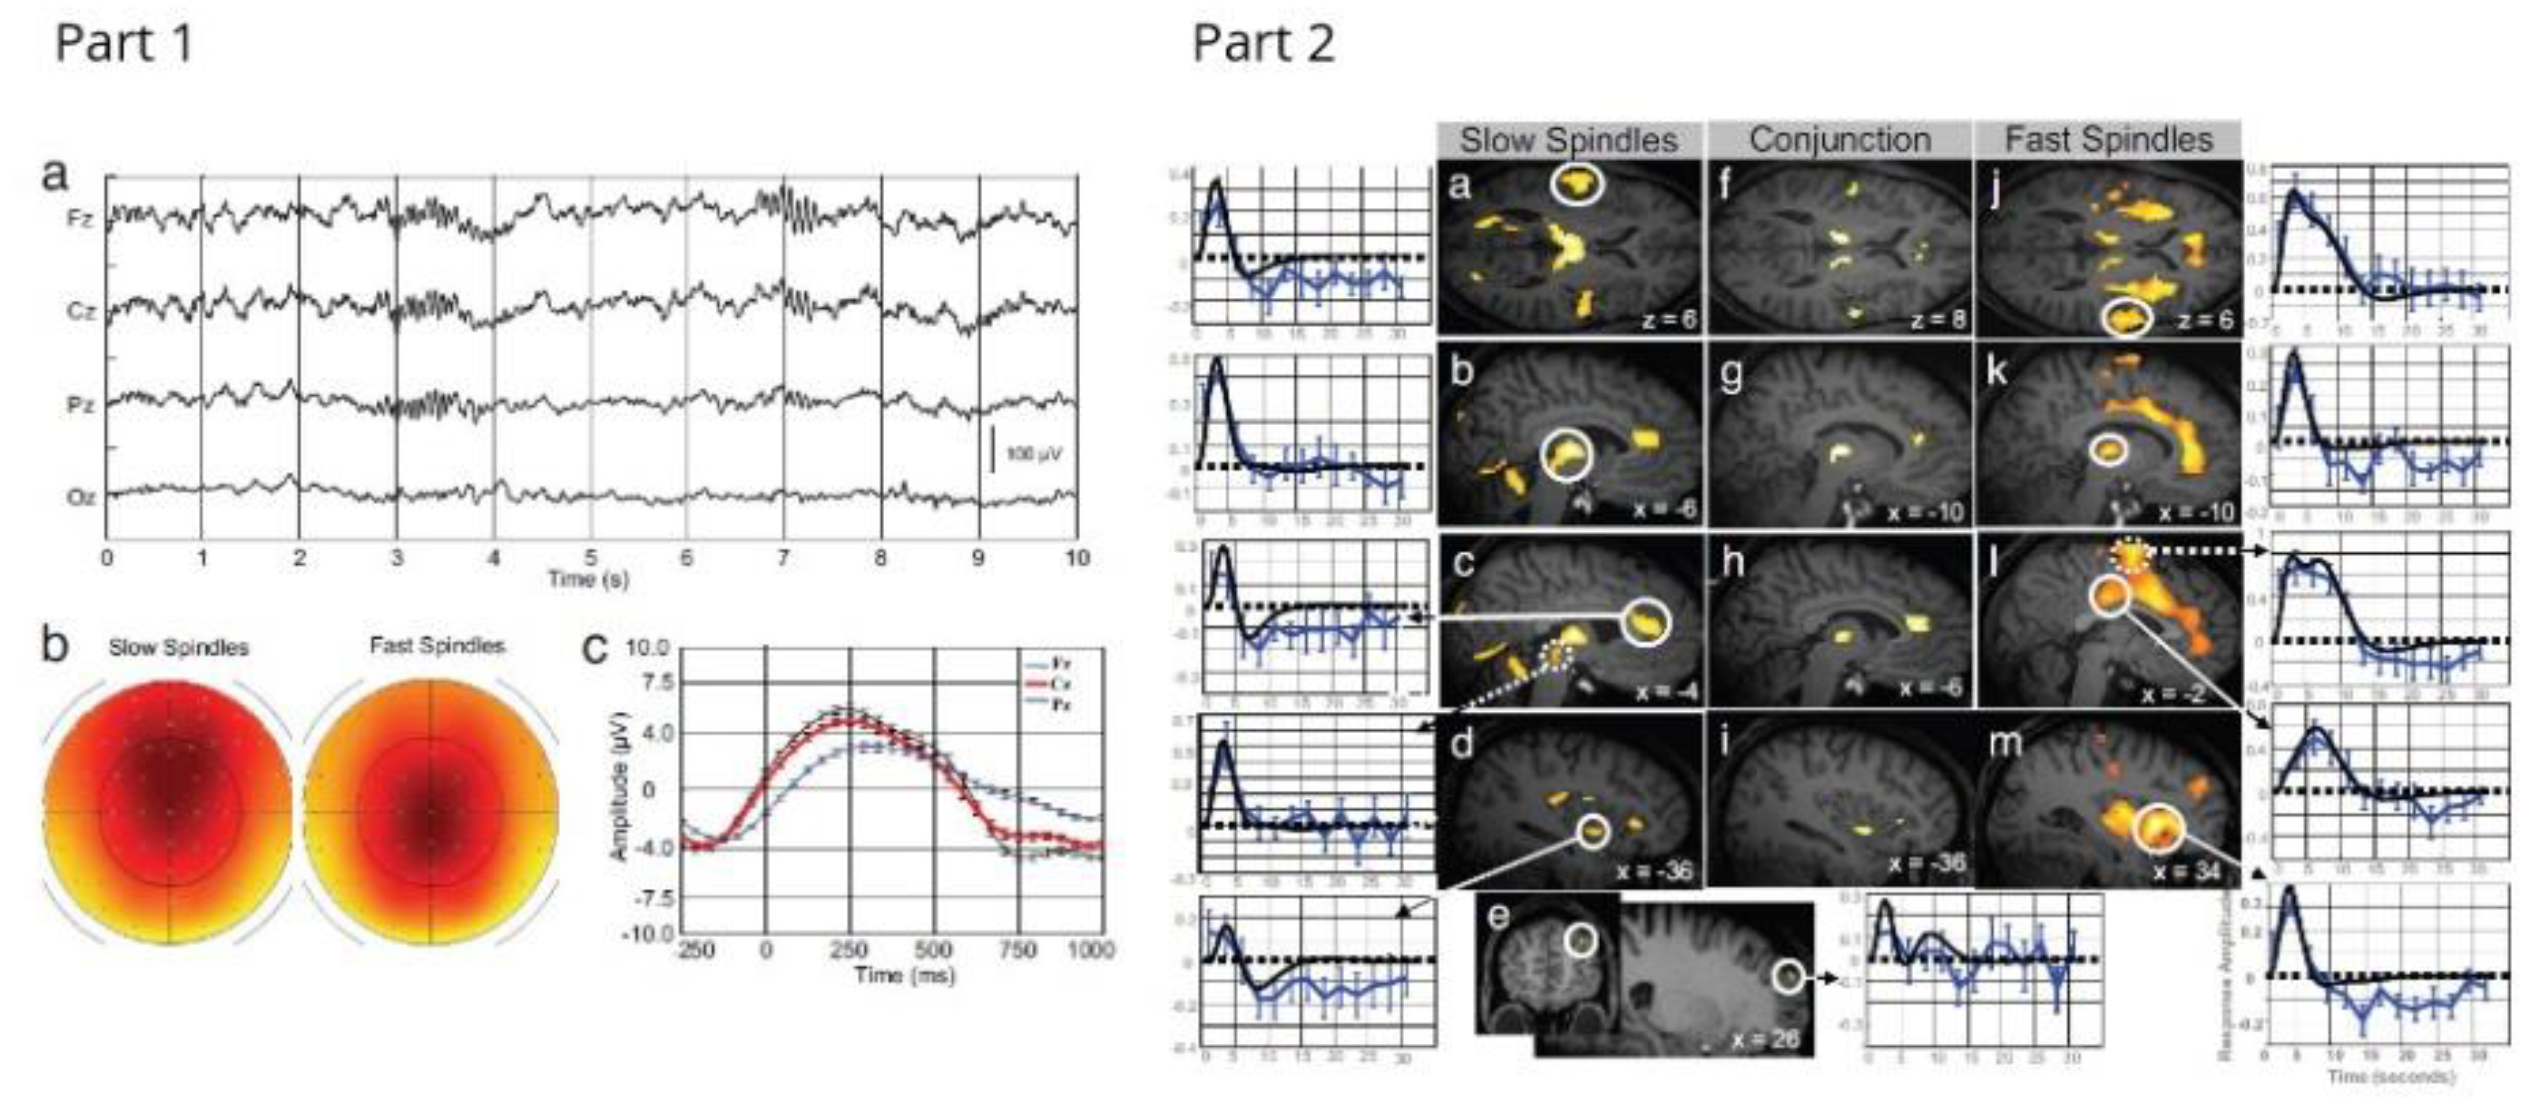
4.5. Sleep
5. Emerging Fields for EEG-fMRI
5.1. Neurofeedback
5.2. Ultra-High Field EEG-fMRI
5.3. Low Field EEG-MRI
5.4. EEG-fMRI and Concurrent Brain Stimulation
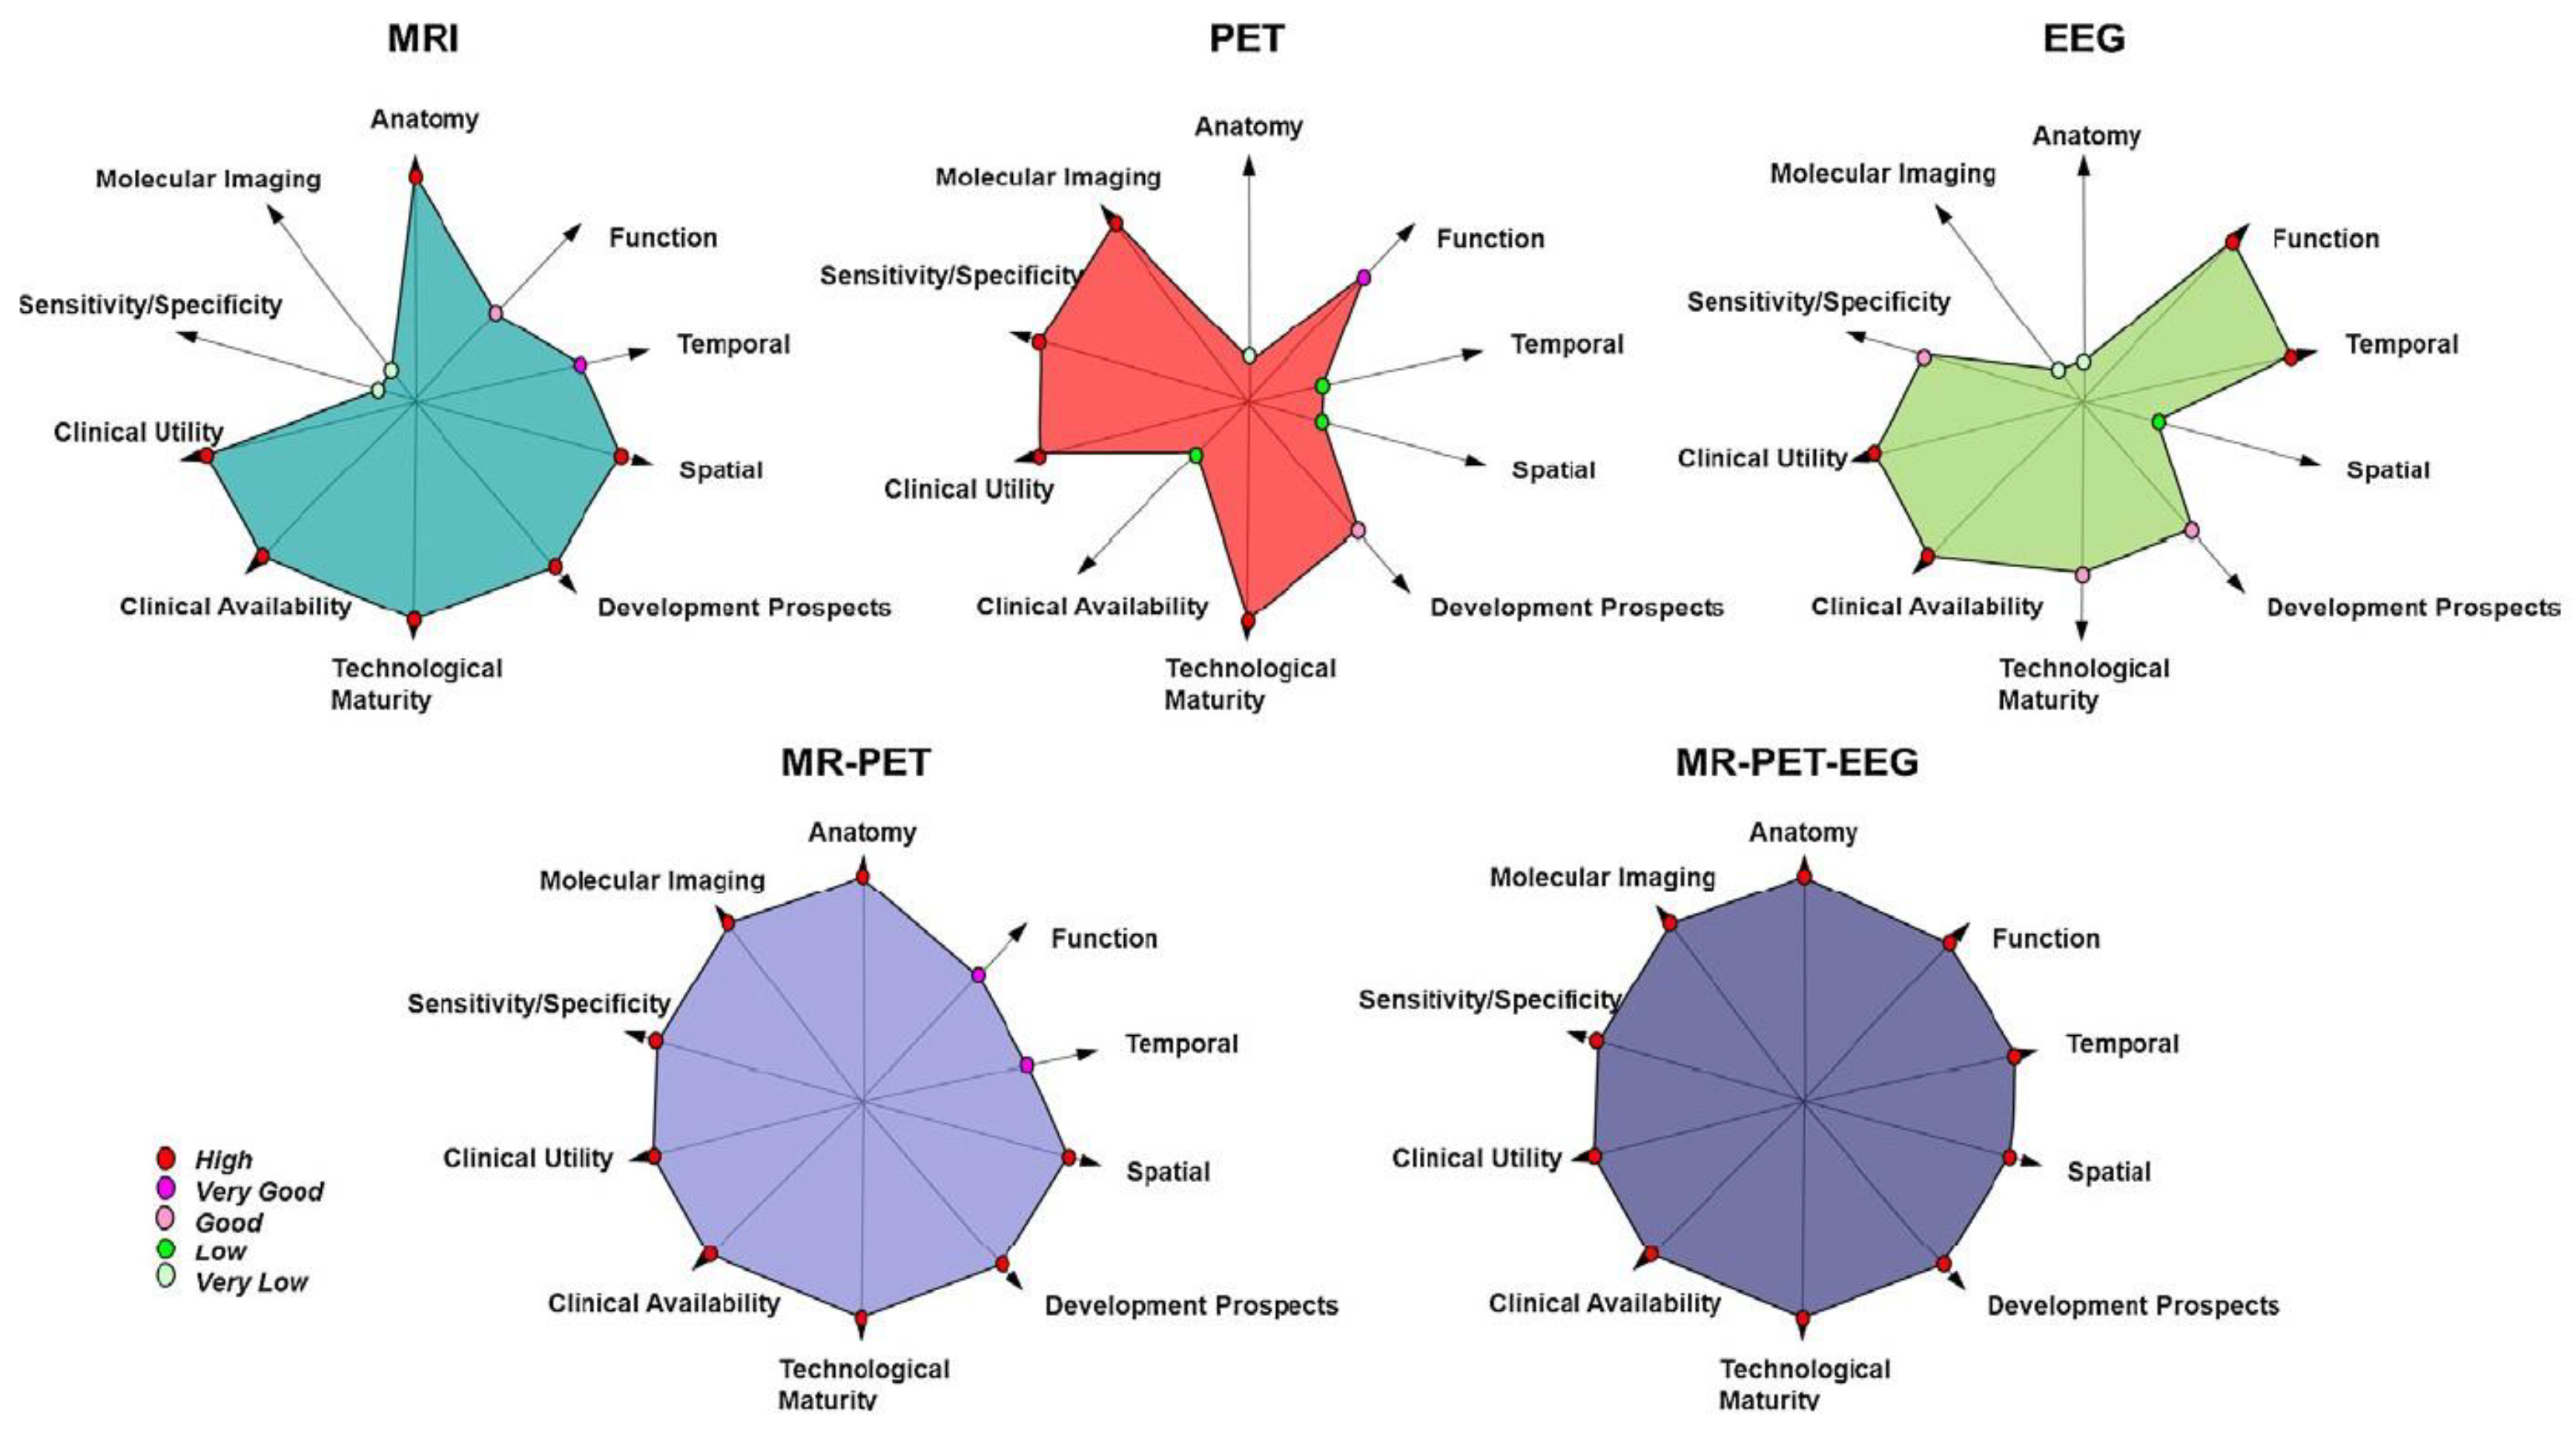
5.5. Trimodal Imaging: EEG-fMRI in Combination with PET

| Additional Method/Combination | Reference | Clinical Application | Main Finding |
|---|---|---|---|
| Study population/focus of study is a clinical group or specific disorder | |||
| EEG-fMRI + Neurofeedback | [143] | Post traumatic stress disorder (PTSD) | The experimental group showed a significant reduction in PTSD severity and comorbid depression severity after the neurofeedback training. |
| [142] | Major depressive disorder (MDD) | During EEG-fMRI neurofeedback, MDD patients were able to significantly increase frontal alpha and beta asymmetry and increase functional connectivity in target fMRI measures. The MDD participants showed significant mood improvements, including reductions in state depression, anxiety, confusion, and total mood disturbance, and increase in state happiness after the neurofeedback training. | |
| [140] | Stroke | Patients successfully upregulated the activity of target motor areas; however, the effects were dependent on the stroke characteristics and motor impairment severity. | |
| EEG-fMRI-PET | [164] | Disorders of consciousness | Combining these methods provided multiple markers of consciousness under the same measurement conditions, thus enabling a more accurate clinical diagnosis and better estimation of prognosis in a condition that can be difficult to accurately categorise. |
| [165] | Diseases that affect glutamatergic neurotransmission (e.g., schizophrenia and dementia) | Task-induced changes in glutamatergic neuro-transmission using the mis-matched negativity (MMN) paradigm were found showing that EEG-fMRI-PET is a useful approach for investigating the role of glutamatergic neurotransmission in healthy participants and in patients with disorders such as schizophrenia and dementia. | |
| Potential clinical applications | |||
| EEG-fMRI TMS | [158] | Cognitive deficiencies | The combination of brain imaging and neuromodulation techniques can reveal causal dependencies between oscillatory mechanisms and functional connectivity. This opens exciting possibilities for research into the dynamics of cognitive circuits. |
| EEG-fMRI tACS | [159] | Disorders where disrupted connectivity | The tACS of the alpha source in the occipitoparietal cortex augmented the alpha oscillations and strengthened BOLD and alpha-frequency oscillatory connectivity. This supports the idea that the intrinsic connectivity networks have an electrophysiological origin underpinning them and clearly shows the benefits of neuronal and haemodynamic measurements in response to the same stimulation. |
| EEG-fMRI + additional MR measures (CSF) | [135] | Sleep disorders | CSF dynamics are interlinked with neural and haemodynamic rhythms, specifically that slow neural activity is followed by brain-wide pulsations in blood volume and CSF flow. This suggests that EEG slow waves may also be linked to the restorative effects of sleep. |
6. Conclusions
Funding
Institutional Review Board Statement
Informed Consent Statement
Data Availability Statement
Acknowledgments
Conflicts of Interest
References
- Padmanabhan, P.; Nedumaran, A.M.; Mishra, S.; Pandarinathan, G.; Archunan, G.; Gulyás, B. The Advents of Hybrid Imaging Modalities: A New Era in Neuroimaging Applications. Adv. Biosyst. 2017, 1, e1700019. [Google Scholar] [CrossRef] [PubMed]
- Michel, C.M.; Murray, M.M. Towards the utilization of EEG as a brain imaging tool. Neuroimage 2012, 61, 371–385. [Google Scholar] [CrossRef]
- Michel, C.M.; Murray, M.M.; Lantz, G.; Gonzalez, S.; Spinelli, L.; Grave de Peralta, R. EEG source imaging. Clin. Neurophysiol. 2004, 115, 2195–2222. [Google Scholar] [CrossRef]
- Berger, H. Electroencephalogram in humans. Arch. Für Psychiatr. Und Nervenkrankh. 1929, 87, 527–570. [Google Scholar] [CrossRef]
- Ogawa, S.; Lee, T.M.; Nayak, A.S.; Glynn, P. Oxygenation-sensitive contrast in magnetic resonance image of rodent brain at high magnetic fields. Magn. Reson. Med. 1990, 14, 68–78. [Google Scholar] [CrossRef]
- Huettel, S.A.; Song, A.W.; McCarthy, G. Functional Magnetic Resonance Imaging, 2nd ed.; Sinauer Assicaites Inc.: Sunderland, MA, USA, 2008. [Google Scholar]
- Logothetis, N.K.; Pauls, J.; Augath, M.; Trinath, T.; Oeltermann, A. Neurophysiological investigation of the basis of the fMRI signal. Nature 2001, 412, 150–157. [Google Scholar] [CrossRef]
- Herrmann, C.S.; Debener, S. Simultaneous recording of EEG and BOLD responses: A historical perspective. Int. J. Psychophysiol. Off. J. Int. Organ. Psychophysiol. 2008, 67, 161–168. [Google Scholar] [CrossRef]
- Scrivener, C.L. When Is Simultaneous Recording Necessary? A Guide for Researchers Considering Combined EEG-fMRI. Front. Neurosci. 2021, 15, 636424. [Google Scholar] [CrossRef] [PubMed]
- Stevens, T.K.; Ives, J.R.; Klassen, L.M.; Bartha, R. MR compatibility of EEG scalp electrodes at 4 tesla. J. Magn. Reson. Imaging 2007, 25, 872–877. [Google Scholar] [CrossRef]
- Lemieux, L.; Allen, P.J.; Franconi, F.; Symms, M.R.; Fish, D.R. Recording of EEG during fMRI experiments: Patient safety. Magn. Reson. Med. 1997, 38, 943–952. [Google Scholar] [CrossRef]
- Graf, H.; Steidle, G.; Schick, F. Heating of metallic implants and instruments induced by gradient switching in a 1.5-Tesla whole-body unit. J. Magn. Reson. Imaging 2007, 26, 1328–1333. [Google Scholar] [CrossRef] [PubMed]
- Angelone, L.M.; Potthast, A.; Segonne, F.; Iwaki, S.; Belliveau, J.W.; Bonmassar, G. Metallic electrodes and leads in simultaneous EEG-MRI: Specific absorption rate (SAR) simulation studies. Bioelectromagnetics 2004, 25, 285–295. [Google Scholar] [CrossRef] [PubMed]
- Hawsawi, H.B.; Carmichael, D.W.; Lemieux, L. Safety of Simultaneous Scalp or Intracranial EEG during MRI: A Review. Front. Phys. 2017, 5, 42. [Google Scholar] [CrossRef]
- Angelone, L.M.; Vasios, C.E.; Wiggins, G.; Purdon, P.L.; Bonmassar, G. On the effect of resistive EEG electrodes and leads during 7 T MRI: Simulation and temperature measurement studies. Magn. Reson. Imaging 2006, 24, 801–812. [Google Scholar] [CrossRef] [PubMed]
- Vasios, C.E.; Angelone, L.M.; Purdon, P.L.; Ahveninen, J.; Belliveau, J.W.; Bonmassar, G. EEG/(f)MRI measurements at 7 Tesla using a new EEG cap (“InkCap”). Neuroimage 2006, 33, 1082–1092. [Google Scholar] [CrossRef] [PubMed]
- Carmichael, D.W.; Thornton, J.S.; Rodionov, R.; Thornton, R.; McEvoy, A.W.; Ordidge, R.J.; Allen, P.J.; Lemieux, L. Feasibility of simultaneous intracranial EEG-fMRI in humans: A safety study. Neuroimage 2010, 49, 379–390. [Google Scholar] [CrossRef] [PubMed]
- Noth, U.; Laufs, H.; Stoermer, R.; Deichmann, R. Simultaneous electroencephalography-functional MRI at 3 T: An analysis of safety risks imposed by performing anatomical reference scans with the EEG equipment in place. J. Magn. Reson. Imaging 2012, 35, 561–571. [Google Scholar] [CrossRef] [PubMed]
- Egan, M.K.; Larsen, R.; Wirsich, J.; Sutton, B.P.; Sadaghiani, S. Safety and data quality of EEG recorded simultaneously with multi-band fMRI. PLoS ONE 2021, 16, e0238485. [Google Scholar] [CrossRef]
- Uji, M.; Wilson, R.; Francis, S.T.; Mullinger, K.J.; Mayhew, S.D. Exploring the advantages of multiband fMRI with simultaneous EEG to investigate coupling between gamma frequency neural activity and the BOLD response in humans. Hum. Brain Mapp. 2018, 39, 1673–1687. [Google Scholar] [CrossRef]
- Atefi, S.R.; Serano, P.; Poulsen, C.; Angelone, L.M.; Bonmassar, G. Numerical and Experimental Analysis of Radiofrequency-Induced Heating Versus Lead Conductivity During EEG-MRI at 3 T. IEEE Trans. Electromagn. Compat. 2019, 61, 852–859. [Google Scholar] [CrossRef]
- Jorge, J.; Grouiller, F.; Ipek, O.; Stoermer, R.; Michel, C.M.; Figueiredo, P.; van der Zwaag, W.; Gruetter, R. Simultaneous EEG-fMRI at ultra-high field: Artifact prevention and safety assessment. Neuroimage 2015, 105, 132–144. [Google Scholar] [CrossRef] [PubMed]
- Bullock, M.; Jackson, G.D.; Abbott, D.F. Artifact Reduction in Simultaneous EEG-fMRI: A Systematic Review of Methods and Contemporary Usage. Front. Neurol. 2021, 12, 193. [Google Scholar] [CrossRef] [PubMed]
- Allen, P.J.; Polizzi, G.; Krakow, K.; Fish, D.R.; Lemieux, L. Identification of EEG events in the MR scanner: The problem of pulse artifact and a method for its subtraction. Neuroimage 1998, 8, 229–239. [Google Scholar] [CrossRef] [PubMed]
- Scheeringa, R.; Koopmans, P.J.; van Mourik, T.; Jensen, O.; Norris, D.G. The relationship between oscillatory EEG activity and the laminar-specific BOLD signal. Proc. Natl. Acad. Sci. USA 2016, 113, 6761–6766. [Google Scholar] [CrossRef] [PubMed]
- Krakow, K.; Woermann, F.G.; Symms, M.R.; Allen, P.J.; Lemieux, L.; Barker, G.J.; Duncan, J.S.; Fish, D.R. EEG-triggered functional MRI of interictal epileptiform activity in patients with partial seizures. Brain 1999, 122 Pt 9, 1679–1688. [Google Scholar] [CrossRef] [PubMed][Green Version]
- Chowdhury, M.E.; Mullinger, K.J.; Bowtell, R. Simultaneous EEG-fMRI: Evaluating the effect of the cabling configuration on the gradient artefact. Phys. Med. Biol. 2015, 60, N241–N250. [Google Scholar] [CrossRef] [PubMed]
- Assecondi, S.; Lavallee, C.; Ferrari, P.; Jovicich, J. Length matters: Improved high field EEG-fMRI recordings using shorter EEG cables. J. Neurosci. Methods 2016, 269, 74–87. [Google Scholar] [CrossRef]
- Anami, K.; Mori, T.; Tanaka, F.; Kawagoe, Y.; Okamoto, J.; Yarita, M.; Ohnishi, T.; Yumoto, M.; Matsuda, H.; Saitoh, O. Stepping stone sampling for retrieving artifact-free electroencephalogram during functional magnetic resonance imaging. Neuroimage 2003, 19, 281–295. [Google Scholar] [CrossRef]
- Allen, P.J. EEG Instrumentation and Safety. In EEG-fMRI: Physiological Basis, Technique, and Applications; Mulert, C., Lemieux, L., Eds.; Springer: Berlin/Heidelberg, Germany, 2010; pp. 115–152. [Google Scholar]
- Allen, P.J.; Josephs, O.; Turner, R. A method for removing imaging artifact from continuous EEG recorded during functional MRI. Neuroimage 2000, 12, 230–239. [Google Scholar] [CrossRef]
- Mandelkow, H.; Halder, P.; Boesiger, P.; Brandeis, D. Synchronization facilitates removal of MRI artefacts from concurrent EEG recordings and increases usable bandwidth. Neuroimage 2006, 32, 1120–1126. [Google Scholar] [CrossRef] [PubMed]
- Mullinger, K.J.; Morgan, P.S.; Bowtell, R.W. Improved artifact correction for combined electroencephalography/functional MRI by means of synchronization and use of vectorcardiogram recordings. J. Magn. Reson. Imaging 2008, 27, 607–616. [Google Scholar] [CrossRef] [PubMed]
- Grouiller, F.; Vercueil, L.; Krainik, A.; Segebarth, C.; Kahane, P.; David, O. A comparative study of different artefact removal algorithms for EEG signals acquired during functional MRI. Neuroimage 2007, 38, 124–137. [Google Scholar] [CrossRef] [PubMed][Green Version]
- Maziero, D.; Velasco, T.R.; Hunt, N.; Payne, E.; Lemieux, L.; Salmon, C.E.G.; Carmichael, D.W. Towards motion insensitive EEG-fMRI: Correcting motion-induced voltages and gradient artefact instability in EEG using an fMRI prospective motion correction (PMC) system. Neuroimage 2016, 138, 13–27. [Google Scholar] [CrossRef] [PubMed]
- Moosmann, M.; Schönfelder, V.H.; Specht, K.; Scheeringa, R.; Nordby, H.; Hugdahl, K. Realignment parameter-informed artefact correction for simultaneous EEG-fMRI recordings. Neuroimage 2009, 45, 1144–1150. [Google Scholar] [CrossRef] [PubMed]
- Huang, C.H.; Ju, M.S.; Lin, C.C. A robust algorithm for removing artifacts in EEG recorded during FMRI/EEG study. Comput. Biol. Med. 2012, 42, 458–467. [Google Scholar] [CrossRef] [PubMed]
- Freyer, F.; Becker, R.; Anami, K.; Curio, G.; Villringer, A.; Ritter, P. Ultrahigh-frequency EEG during fMRI: Pushing the limits of imaging-artifact correction. Neuroimage 2009, 48, 94–108. [Google Scholar] [CrossRef] [PubMed]
- Niazy, R.K.; Beckmann, C.F.; Iannetti, G.D.; Brady, J.M.; Smith, S.M. Removal of FMRI environment artifacts from EEG data using optimal basis sets. Neuroimage 2005, 28, 720–737. [Google Scholar] [CrossRef] [PubMed]
- Acharjee, P.P.; Phlypo, R.; Wu, L.; Calhoun, V.D.; Adali, T. Independent Vector Analysis for Gradient Artifact Removal in Concurrent EEG-fMRI Data. IEEE Trans. Biomed. Eng. 2015, 62, 1750–1758. [Google Scholar] [CrossRef]
- Brookes, M.J.; Mullinger, K.J.; Stevenson, C.M.; Morris, P.G.; Bowtell, R. Simultaneous EEG source localisation and artifact rejection during concurrent fMRI by means of spatial filtering. Neuroimage 2008, 40, 1090–1104. [Google Scholar] [CrossRef]
- Mullinger, K.J.; Havenhand, J.; Bowtell, R. Identifying the sources of the pulse artefact in EEG recordings made inside an MR scanner. Neuroimage 2013, 71, 75–83. [Google Scholar] [CrossRef] [PubMed]
- Yan, W.X.; Mullinger, K.J.; Geirsdottir, G.B.; Bowtell, R. Physical modeling of pulse artefact sources in simultaneous EEG/fMRI. Hum. Brain Mapp. 2010, 31, 604–620. [Google Scholar] [CrossRef] [PubMed]
- Debener, S.; Mullinger, K.J.; Niazy, R.K.; Bowtell, R.W. Properties of the ballistocardiogram artefact as revealed by EEG recordings at 1.5, 3 and 7 T static magnetic field strength. Int. J. Psychophysiol. Off. J. Int. Organ. Psychophysiol. 2008, 67, 189–199. [Google Scholar] [CrossRef] [PubMed]
- Neuner, I.; Warbrick, T.; Arrubla, J.; Felder, J.; Celik, A.; Reske, M.; Boers, F.; Shah, N.J. EEG acquisition in ultra-high static magnetic fields up to 9.4 T. Neuroimage 2013, 68, 214–220. [Google Scholar] [CrossRef] [PubMed]
- Jorge, J.; Bouloc, C.; Bréchet, L.; Michel, C.M.; Gruetter, R. Investigating the variability of cardiac pulse artifacts across heartbeats in simultaneous EEG-fMRI recordings: A 7T study. Neuroimage 2019, 191, 21–35. [Google Scholar] [CrossRef]
- Assecondi, S.; Hallez, H.; Staelens, S.; Bianchi, A.M.; Huiskamp, G.M.; Lemahieu, I. Removal of the ballistocardiographic artifact from EEG-fMRI data: A canonical correlation approach. Phys. Med. Biol. 2009, 54, 1673–1689. [Google Scholar] [CrossRef] [PubMed]
- Krishnaswamy, P.; Bonmassar, G.; Poulsen, C.; Pierce, E.T.; Purdon, P.L.; Brown, E.N. Reference-free removal of EEG-fMRI ballistocardiogram artifacts with harmonic regression. Neuroimage 2016, 128, 398–412. [Google Scholar] [CrossRef] [PubMed][Green Version]
- Bénar, C.; Aghakhani, Y.; Wang, Y.; Izenberg, A.; Al-Asmi, A.; Dubeau, F.; Gotman, J. Quality of EEG in simultaneous EEG-fMRI for epilepsy. Clin. Neurophysiol. 2003, 114, 569–580. [Google Scholar] [CrossRef]
- Debener, S.; Strobel, A.; Sorger, B.; Peters, J.; Kranczioch, C.; Engel, A.K.; Goebel, R. Improved quality of auditory event-related potentials recorded simultaneously with 3-T fMRI: Removal of the ballistocardiogram artefact. Neuroimage 2007, 34, 587–597. [Google Scholar] [CrossRef]
- Vanderperren, K.; De Vos, M.; Ramautar, J.R.; Novitskiy, N.; Mennes, M.; Assecondi, S.; Vanrumste, B.; Stiers, P.; Van den Bergh, B.R.; Wagemans, J.; et al. Removal of BCG artifacts from EEG recordings inside the MR scanner: A comparison of methodological and validation-related aspects. Neuroimage 2010, 50, 920–934. [Google Scholar] [CrossRef]
- Mullinger, K.; Brookes, M.; Stevenson, C.; Morgan, P.; Bowtell, R. Exploring the feasibility of simultaneous electroencephalography/functional magnetic resonance imaging at 7 T. Magn. Reson. Imaging 2008, 26, 968–977. [Google Scholar] [CrossRef]
- Rothlübbers, S.; Relvas, V.; Leal, A.; Murta, T.; Lemieux, L.; Figueiredo, P. Characterisation and reduction of the EEG artefact caused by the helium cooling pump in the MR environment: Validation in epilepsy patient data. Brain Topogr. 2015, 28, 208–220. [Google Scholar] [CrossRef] [PubMed]
- Nierhaus, T.; Gundlach, C.; Goltz, D.; Thiel, S.D.; Pleger, B.; Villringer, A. Internal ventilation system of MR scanners induces specific EEG artifact during simultaneous EEG-fMRI. Neuroimage 2013, 74, 70–76. [Google Scholar] [CrossRef] [PubMed]
- Bonmassar, G.; Purdon, P.L.; Jääskeläinen, I.P.; Chiappa, K.; Solo, V.; Brown, E.N.; Belliveau, J.W. Motion and ballistocardiogram artifact removal for interleaved recording of EEG and EPs during MRI. Neuroimage 2002, 16, 1127–1141. [Google Scholar] [CrossRef] [PubMed]
- Abbott, D.F.; Masterton, R.A.; Archer, J.S.; Fleming, S.W.; Warren, A.E.; Jackson, G.D. Constructing Carbon Fiber Motion-Detection Loops for Simultaneous EEG-fMRI. Front. Neurol. 2014, 5, 260. [Google Scholar] [CrossRef] [PubMed]
- Jorge, J.; Grouiller, F.; Gruetter, R.; van der Zwaag, W.; Figueiredo, P. Towards high-quality simultaneous EEG-fMRI at 7 T: Detection and reduction of EEG artifacts due to head motion. Neuroimage 2015, 120, 143–153. [Google Scholar] [CrossRef] [PubMed]
- Masterton, R.A.; Abbott, D.F.; Fleming, S.W.; Jackson, G.D. Measurement and reduction of motion and ballistocardiogram artefacts from simultaneous EEG and fMRI recordings. Neuroimage 2007, 37, 202–211. [Google Scholar] [CrossRef] [PubMed]
- Chowdhury, M.E.; Mullinger, K.J.; Glover, P.; Bowtell, R. Reference layer artefact subtraction (RLAS): A novel method of minimizing EEG artefacts during simultaneous fMRI. Neuroimage 2014, 84, 307–319. [Google Scholar] [CrossRef] [PubMed]
- Steyrl, D.; Krausz, G.; Koschutnig, K.; Edlinger, G.; Müller-Putz, G.R. Reference layer adaptive filtering (RLAF) for EEG artifact reduction in simultaneous EEG-fMRI. J. Neural. Eng. 2017, 14, 026003. [Google Scholar] [CrossRef]
- Maziero, D.; Stenger, V.A.; Carmichael, D.W. Unified Retrospective EEG Motion Educated Artefact Suppression for EEG-fMRI to Suppress Magnetic Field Gradient Artefacts During Motion. Brain Topogr. 2021, 34, 745–761. [Google Scholar] [CrossRef]
- Daniel, A.J.; Smith, J.A.; Spencer, G.S.; Jorge, J.; Bowtell, R.; Mullinger, K.J. Exploring the relative efficacy of motion artefact correction techniques for EEG data acquired during simultaneous fMRI. Hum. Brain Mapp. 2019, 40, 578–596. [Google Scholar] [CrossRef]
- van der Meer, J.N.; Pampel, A.; Van Someren, E.J.W.; Ramautar, J.R.; van der Werf, Y.D.; Gomez-Herrero, G.; Lepsien, J.; Hellrung, L.; Hinrichs, H.; Möller, H.E.; et al. Carbon-wire loop based artifact correction outperforms post-processing EEG/fMRI corrections—A validation of a real-time simultaneous EEG/fMRI correction method. Neuroimage 2016, 125, 880–894. [Google Scholar] [CrossRef] [PubMed]
- Mullinger, K.; Debener, S.; Coxon, R.; Bowtell, R. Effects of simultaneous EEG recording on MRI data quality at 1.5, 3 and 7 tesla. Int. J. Psychophysiol. Off. J. Int. Organ. Psychophysiol. 2008, 67, 178–188. [Google Scholar] [CrossRef] [PubMed]
- Krakow, K.; Allen, P.J.; Symms, M.R.; Lemieux, L.; Josephs, O.; Fish, D.R. EEG recording during fMRI experiments: Image quality. Hum. Brain Mapp. 2000, 10, 10–15. [Google Scholar] [CrossRef]
- Jeong, H.; Bonmassar, G. Numerical estimation of the B1 transmit field distortion in a copper EEG trace comparison with the thin-film based resistive trace “NeoNet”. In Proceedings of the 2021 43rd Annual International Conference of the IEEE Engineering in Medicine & Biology Society (EMBC), Guadalajara, Mexico, 1–5 November 2021; pp. 4099–4103. [Google Scholar] [CrossRef] [PubMed]
- Scarff, C.J.; Reynolds, A.; Goodyear, B.G.; Ponton, C.W.; Dort, J.C.; Eggermont, J.J. Simultaneous 3-T fMRI and high-density recording of human auditory evoked potentials. Neuroimage 2004, 23, 1129–1142. [Google Scholar] [CrossRef] [PubMed]
- Horovitz, S.G.; Rossion, B.; Skudlarski, P.; Gore, J.C. Parametric design and correlational analyses help integrating fMRI and electrophysiological data during face processing. Neuroimage 2004, 22, 1587–1595. [Google Scholar] [CrossRef] [PubMed]
- Mulert, C.; Jäger, L.; Schmitt, R.; Bussfeld, P.; Pogarell, O.; Möller, H.J.; Juckel, G.; Hegerl, U. Integration of fMRI and simultaneous EEG: Towards a comprehensive understanding of localization and time-course of brain activity in target detection. Neuroimage 2004, 22, 83–94. [Google Scholar] [CrossRef] [PubMed]
- Huster, R.J.; Debener, S.; Eichele, T.; Herrmann, C.S. Methods for simultaneous EEG-fMRI: An introductory review. J. Neurosci. 2012, 32, 6053–6060. [Google Scholar] [CrossRef] [PubMed]
- Jorge, J.; van der Zwaag, W.; Figueiredo, P. EEG-fMRI integration for the study of human brain function. Neuroimage 2014, 102 Pt 1, 24–34. [Google Scholar] [CrossRef]
- Abreu, R.; Leal, A.; Figueiredo, P. EEG-Informed fMRI: A Review of Data Analysis Methods. Front. Hum. Neurosci. 2018, 12, 29. [Google Scholar] [CrossRef]
- Daunizeau, J.; Grova, C.; Marrelec, G.; Mattout, J.; Jbabdi, S.; Pélégrini-Issac, M.; Lina, J.M.; Benali, H. Symmetrical event-related EEG/fMRI information fusion in a variational Bayesian framework. Neuroimage 2007, 36, 69–87. [Google Scholar] [CrossRef]
- Valdes-Sosa, P.A.; Sanchez-Bornot, J.M.; Sotero, R.C.; Iturria-Medina, Y.; Aleman-Gomez, Y.; Bosch-Bayard, J.; Carbonell, F.; Ozaki, T. Model driven EEG/fMRI fusion of brain oscillations. Hum. Brain Mapp. 2009, 30, 2701–2721. [Google Scholar] [CrossRef] [PubMed]
- Calhoun, V.D.; Adali, T.; Pearlson, G.D.; Kiehl, K.A. Neuronal chronometry of target detection: Fusion of hemodynamic and event-related potential data. Neuroimage 2006, 30, 544–553. [Google Scholar] [CrossRef] [PubMed]
- Calhoun, V.D.; Liu, J.; Adali, T. A review of group ICA for fMRI data and ICA for joint inference of imaging, genetic, and ERP data. Neuroimage 2009, 45, S163–S172. [Google Scholar] [CrossRef] [PubMed]
- Ostwald, D.; Porcaro, C.; Bagshaw, A.P. An information theoretic approach to EEG-fMRI integration of visually evoked responses. Neuroimage 2010, 49, 498–516. [Google Scholar] [CrossRef]
- Ostwald, D.; Porcaro, C.; Bagshaw, A.P. Voxel-wise information theoretic EEG-fMRI feature integration. Neuroimage 2011, 55, 1270–1286. [Google Scholar] [CrossRef] [PubMed]
- De Martino, F.; Valente, G.; de Borst, A.W.; Esposito, F.; Roebroeck, A.; Goebel, R.; Formisano, E. Multimodal imaging: An evaluation of univariate and multivariate methods for simultaneous EEG/fMRI. Magn. Reson. Imaging 2010, 28, 1104–1112. [Google Scholar] [CrossRef] [PubMed]
- De Martino, F.; de Borst, A.W.; Valente, G.; Goebel, R.; Formisano, E. Predicting EEG single trial responses with simultaneous fMRI and relevance vector machine regression. Neuroimage 2011, 56, 826–836. [Google Scholar] [CrossRef] [PubMed]
- Laufs, H.; Kleinschmidt, A.; Beyerle, A.; Eger, E.; Salek-Haddadi, A.; Preibisch, C.; Krakow, K. EEG-correlated fMRI of human alpha activity. Neuroimage 2003, 19, 1463–1476. [Google Scholar] [CrossRef]
- Debener, S.; Ullsperger, M.; Siegel, M.; Fiehler, K.; von Cramon, D.Y.; Engel, A.K. Trial-by-trial coupling of concurrent electroencephalogram and functional magnetic resonance imaging identifies the dynamics of performance monitoring. J. Neurosci. 2005, 25, 11730–11737. [Google Scholar] [CrossRef]
- Babiloni, F.; Carducci, F.; Cincotti, F.; Del Gratta, C.; Roberti, G.M.; Romani, G.L.; Rossini, P.M.; Babiloni, C. Integration of high resolution EEG and functional magnetic resonance in the study of human movement-related potentials. Methods Inf. Med. 2000, 39, 179–182. [Google Scholar]
- Ou, W.; Nummenmaa, A.; Ahveninen, J.; Belliveau, J.W.; Hämäläinen, M.S.; Golland, P. Multimodal functional imaging using fMRI-informed regional EEG/MEG source estimation. Neuroimage 2010, 52, 97–108. [Google Scholar] [CrossRef]
- Goebel, R.; Esposito, F. The Added value of EEG-fMRI in Imaging Neuroscience. In EEG-fMRI: Physiological Basis, Technique, and Applications; Mulert, C., Lemieux, L., Eds.; Springer: Berlin/Heidelberg, Germany, 2010; pp. 97–112. [Google Scholar]
- Babiloni, F.; Babiloni, C.; Carducci, F.; Del Gratta, C.; Romani, G.L.; Rossini, P.M.; Cincotti, F. Cortical source estimate of combined high resolution EEG and fMRI data related to voluntary movements. Methods Inf. Med. 2002, 41, 443–450. [Google Scholar] [CrossRef]
- Liu, Z.; Zhang, N.; Chen, W.; He, B. Mapping the bilateral visual integration by EEG and fMRI. Neuroimage 2009, 46, 989–997. [Google Scholar] [CrossRef]
- Niedermeyer, E.; Lopes Da Silva, F.H. Electroencephalography: Basic Principles, Clinical Applications, and Related Fields, 6th ed.; Wolters Kluwer Health: Philadelphia, PA, USA, 2005. [Google Scholar]
- Luck, S.J. An Introduction to the Event-Related Potential Technique; MIT Press: Cambridge, MA, USA, 2005. [Google Scholar]
- Soares, J.M.; Magalhães, R.; Moreira, P.S.; Sousa, A.; Ganz, E.; Sampaio, A.; Alves, V.; Marques, P.; Sousa, N. A Hitchhiker’s Guide to Functional Magnetic Resonance Imaging. Front. Neurosci. 2016, 10, 515. [Google Scholar] [CrossRef]
- Laufs, H.; Daunizeau, J.; Carmichael, D.W.; Kleinschmidt, A. Recent advances in recording electrophysiological data simultaneously with magnetic resonance imaging. Neuroimage 2008, 40, 515–528. [Google Scholar] [CrossRef]
- Bonmassar, G.; Anami, K.; Ives, J.; Belliveau, J.W. Visual evoked potential (VEP) measured by simultaneous 64-channel EEG and 3T fMRI. Neuroreport 1999, 10, 1893–1897. [Google Scholar] [CrossRef]
- Debener, S.; Ullsperger, M.; Siegel, M.; Engel, A.K. Single-trial EEG-fMRI reveals the dynamics of cognitive function. Trends Cogn. Sci. 2006, 10, 558–563. [Google Scholar] [CrossRef]
- Eichele, T.; Specht, K.; Moosmann, M.; Jongsma, M.L.; Quiroga, R.Q.; Nordby, H.; Hugdahl, K. Assessing the spatiotemporal evolution of neuronal activation with single-trial event-related potentials and functional MRI. Proc. Natl. Acad. Sci. USA 2005, 102, 17798–17803. [Google Scholar] [CrossRef]
- Neuner, I.; Mauler, J.; Arrubla, J.; Kops, E.R.; Tellmann, L.; Scheins, J.; Herzog, H.; Langen, K.J.; Shah, J. Simultaneous trimodal MR-PET-EEG imaging for the investigation of resting state networks in humans. EJNMMI Phys. 2015, 2, A71. [Google Scholar] [CrossRef][Green Version]
- Warbrick, T.; Reske, M.; Shah, N.J. Do EEG paradigms work in fMRI? Varying task demands in the visual oddball paradigm: Implications for task design and results interpretation. Neuroimage 2013, 77, 177–185. [Google Scholar] [CrossRef]
- Warbrick, T.; Arrubla, J.; Boers, F.; Neuner, I.; Shah, N.J. Attention to detail: Why considering task demands is essential for single-trial analysis of BOLD correlates of the visual P1 and N1. J. Cogn. Neurosci. 2014, 26, 529–542. [Google Scholar] [CrossRef]
- Goldman, R.I.; Stern, J.M.; Engel, J., Jr.; Cohen, M.S. Simultaneous EEG and fMRI of the alpha rhythm. Neuroreport 2002, 13, 2487–2492. [Google Scholar] [CrossRef]
- Laufs, H.; Holt, J.L.; Elfont, R.; Krams, M.; Paul, J.S.; Krakow, K.; Kleinschmidt, A. Where the BOLD signal goes when alpha EEG leaves. Neuroimage 2006, 31, 1408–1418. [Google Scholar] [CrossRef]
- Mayhew, S.D.; Ostwald, D.; Porcaro, C.; Bagshaw, A.P. Spontaneous EEG alpha oscillation interacts with positive and negative BOLD responses in the visual-auditory cortices and default-mode network. Neuroimage 2013, 76, 362–372. [Google Scholar] [CrossRef]
- Scheeringa, R.; Fries, P.; Petersson, K.M.; Oostenveld, R.; Grothe, I.; Norris, D.G.; Hagoort, P.; Bastiaansen, M.C. Neuronal dynamics underlying high- and low-frequency EEG oscillations contribute independently to the human BOLD signal. Neuron 2011, 69, 572–583. [Google Scholar] [CrossRef]
- Ives, J.R.; Warach, S.; Schmitt, F.; Edelman, R.R.; Schomer, D.L. Monitoring the patient’s EEG during echo planar MRI. Electroencephalogr. Clin. Neurophysiol. 1993, 87, 417–420. [Google Scholar] [CrossRef]
- Gotman, J.; Grova, C.; Bagshaw, A.; Kobayashi, E.; Aghakhani, Y.; Dubeau, F. Generalized epileptic discharges show thalamocortical activation and suspension of the default state of the brain. Proc. Natl. Acad. Sci. USA 2005, 102, 15236–15240. [Google Scholar] [CrossRef]
- LeVan, P.; Tyvaert, L.; Gotman, J. Modulation by EEG features of BOLD responses to interictal epileptiform discharges. Neuroimage 2010, 50, 15–26. [Google Scholar] [CrossRef][Green Version]
- Khoo, H.M.; von Ellenrieder, N.; Zazubovits, N.; He, D.; Dubeau, F.; Gotman, J. The spike onset zone: The region where epileptic spikes start and from where they propagate. Neurology 2018, 91, e666–e674. [Google Scholar] [CrossRef]
- Sadjadi, S.M.; Ebrahimzadeh, E.; Shams, M.; Seraji, M.; Soltanian-Zadeh, H. Localization of Epileptic Foci Based on Simultaneous EEG-fMRI Data. Front. Neurol. 2021, 12, 645594. [Google Scholar] [CrossRef]
- van Graan, L.A.; Lemieux, L.; Chaudhary, U.J. Methods and utility of EEG-fMRI in epilepsy. Quant. Imaging Med. Surg. 2015, 5, 300–312. [Google Scholar] [CrossRef]
- Bénar, C.G.; Grova, C.; Kobayashi, E.; Bagshaw, A.P.; Aghakhani, Y.; Dubeau, F.; Gotman, J. EEG-fMRI of epileptic spikes: Concordance with EEG source localization and intracranial EEG. Neuroimage 2006, 30, 1161–1170. [Google Scholar] [CrossRef]
- Shamshiri, E.A.; Sheybani, L.; Vulliemoz, S. The Role of EEG-fMRI in Studying Cognitive Network Alterations in Epilepsy. Front. Neurol. 2019, 10, 1033. [Google Scholar] [CrossRef]
- Murta, T.; Leite, M.; Carmichael, D.W.; Figueiredo, P.; Lemieux, L. Electrophysiological correlates of the BOLD signal for EEG-informed fMRI. Hum. Brain Mapp. 2015, 36, 391–414. [Google Scholar] [CrossRef]
- Chaudhary, U.J.; Duncan, J.S.; Lemieux, L. Mapping hemodynamic correlates of seizures using fMRI: A review. Hum. Brain Mapp. 2013, 34, 447–466. [Google Scholar] [CrossRef]
- Bagshaw, A.P.; Aghakhani, Y.; Bénar, C.G.; Kobayashi, E.; Hawco, C.; Dubeau, F.; Pike, G.B.; Gotman, J. EEG-fMRI of focal epileptic spikes: Analysis with multiple haemodynamic functions and comparison with gadolinium-enhanced MR angiograms. Hum. Brain Mapp. 2004, 22, 179–192. [Google Scholar] [CrossRef]
- van Houdt, P.J.; de Munck, J.C.; Leijten, F.S.S.; Huiskamp, G.J.M.; Colon, A.J.; Boon, P.; Ossenblok, P.P.W. EEG-fMRI correlation patterns in the presurgical evaluation of focal epilepsy: A comparison with electrocorticographic data and surgical outcome measures. Neuroimage 2013, 75, 238–248. [Google Scholar] [CrossRef]
- Carmichael, D.W.; Thornton, J.S.; Rodionov, R.; Thornton, R.; McEvoy, A.; Allen, P.J.; Lemieux, L. Safety of localizing epilepsy monitoring intracranial electroencephalograph electrodes using MRI: Radiofrequency-induced heating. J. Magn. Reson. Imaging 2008, 28, 1233–1244. [Google Scholar] [CrossRef]
- Markoula, S.; Chaudhary, U.J.; Perani, S.; De Ciantis, A.; Yadee, T.; Duncan, J.S.; Diehl, B.; McEvoy, A.W.; Lemieux, L. The impact of mapping interictal discharges using EEG-fMRI on the epilepsy presurgical clinical decision making process: A prospective study. Seizure 2018, 61, 30–37. [Google Scholar] [CrossRef]
- Hermann, B.; Seidenberg, M.; Jones, J. The neurobehavioural comorbidities of epilepsy: Can a natural history be developed? Lancet Neurol. 2008, 7, 151–160. [Google Scholar] [CrossRef]
- Laufs, H.; Hamandi, K.; Salek-Haddadi, A.; Kleinschmidt, A.K.; Duncan, J.S.; Lemieux, L. Temporal lobe interictal epileptic discharges affect cerebral activity in “default mode” brain regions. Hum. Brain Mapp. 2007, 28, 1023–1032. [Google Scholar] [CrossRef]
- Yang, T.; Luo, C.; Li, Q.; Guo, Z.; Liu, L.; Gong, Q.; Yao, D.; Zhou, D. Altered resting-state connectivity during interictal generalized spike-wave discharges in drug-naïve childhood absence epilepsy. Hum. Brain Mapp. 2013, 34, 1761–1767. [Google Scholar] [CrossRef]
- Shamshiri, E.A.; Tierney, T.M.; Centeno, M.; St Pier, K.; Pressler, R.M.; Sharp, D.J.; Perani, S.; Cross, J.H.; Carmichael, D.W. Interictal activity is an important contributor to abnormal intrinsic network connectivity in paediatric focal epilepsy. Hum. Brain Mapp. 2017, 38, 221–236. [Google Scholar] [CrossRef]
- Grouiller, F.; Thornton, R.C.; Groening, K.; Spinelli, L.; Duncan, J.S.; Schaller, K.; Siniatchkin, M.; Lemieux, L.; Seeck, M.; Michel, C.M.; et al. With or without spikes: Localization of focal epileptic activity by simultaneous electroencephalography and functional magnetic resonance imaging. Brain 2011, 134, 2867–2886. [Google Scholar] [CrossRef]
- Ebrahimzadeh, E.; Soltanian-Zadeh, H.; Araabi, B.N.; Fesharaki, S.S.H.; Habibabadi, J.M. Component-related BOLD response to localize epileptic focus using simultaneous EEG-fMRI recordings at 3T. J. Neurosci. Methods 2019, 322, 34–49. [Google Scholar] [CrossRef]
- Ebrahimzadeh, E.; Shams, M.; Seraji, M.; Sadjadi, S.M.; Rajabion, L.; Soltanian-Zadeh, H. Localizing Epileptic Foci Using Simultaneous EEG-fMRI Recording: Template Component Cross-Correlation. Front. Neurol. 2021, 12, 695997. [Google Scholar] [CrossRef]
- Rechtschaffen, K.; Kales, A. A Manual of Standardized Terminology, Techniques and Scoring System for Sleep Stages of Human Subjects; NIH: Washington, DC, USA, 1968.
- Rundo, J.V.; Downey, R., 3rd. Polysomnography. Handb. Clin. Neurol. 2019, 160, 381–392. [Google Scholar] [CrossRef]
- Laufs, H.; Walker, M.C.; Lund, T.E. ‘Brain activation and hypothalamic functional connectivity during human non-rapid eye movement sleep: An EEG/fMRI study’—Its limitations and an alternative approach. Brain 2007, 130, e75. [Google Scholar] [CrossRef]
- Tamaki, M.; Watanabe, T.; Sasaki, Y. Coregistration of magnetic resonance spectroscopy and polysomnography for sleep analysis in human subjects. STAR Protoc. 2021, 2, 100974. [Google Scholar] [CrossRef]
- Kaufmann, C.; Wehrle, R.; Wetter, T.C.; Holsboer, F.; Auer, D.P.; Pollmächer, T.; Czisch, M. Brain activation and hypothalamic functional connectivity during human non-rapid eye movement sleep: An EEG/fMRI study. Brain 2006, 129, 655–667. [Google Scholar] [CrossRef]
- Kokkinos, V.; Vulliémoz, S.; Koupparis, A.M.; Koutroumanidis, M.; Kostopoulos, G.K.; Lemieux, L.; Garganis, K. A hemodynamic network involving the insula, the cingulate, and the basal forebrain correlates with EEG synchronization phases of sleep instability. Sleep 2019, 42, zsy259. [Google Scholar] [CrossRef]
- Schabus, M.; Dang-Vu, T.T.; Albouy, G.; Balteau, E.; Boly, M.; Carrier, J.; Darsaud, A.; Degueldre, C.; Desseilles, M.; Gais, S.; et al. Hemodynamic cerebral correlates of sleep spindles during human non-rapid eye movement sleep. Proc. Natl. Acad. Sci. USA 2007, 104, 13164–13169. [Google Scholar] [CrossRef]
- Hale, J.R.; White, T.P.; Mayhew, S.D.; Wilson, R.S.; Rollings, D.T.; Khalsa, S.; Arvanitis, T.N.; Bagshaw, A.P. Altered thalamocortical and intra-thalamic functional connectivity during light sleep compared with wake. Neuroimage 2016, 125, 657–667. [Google Scholar] [CrossRef]
- Bagshaw, A.P.; Hale, J.R.; Campos, B.M.; Rollings, D.T.; Wilson, R.S.; Alvim, M.K.M.; Coan, A.C.; Cendes, F. Sleep onset uncovers thalamic abnormalities in patients with idiopathic generalised epilepsy. Neuroimage Clin. 2017, 16, 52–57. [Google Scholar] [CrossRef]
- Zou, G.; Li, Y.; Liu, J.; Zhou, S.; Xu, J.; Qin, L.; Shao, Y.; Yao, P.; Sun, H.; Zou, Q.; et al. Altered thalamic connectivity in insomnia disorder during wakefulness and sleep. Hum. Brain Mapp. 2021, 42, 259–270. [Google Scholar] [CrossRef]
- Fang, Z.; Ray, L.B.; Owen, A.M.; Fogel, S.M. Brain Activation Time-Locked to Sleep Spindles Associated With Human Cognitive Abilities. Front. Neurosci. 2019, 13, 46. [Google Scholar] [CrossRef]
- Jegou, A.; Schabus, M.; Gosseries, O.; Dahmen, B.; Albouy, G.; Desseilles, M.; Sterpenich, V.; Phillips, C.; Maquet, P.; Grova, C.; et al. Cortical reactivations during sleep spindles following declarative learning. Neuroimage 2019, 195, 104–112. [Google Scholar] [CrossRef]
- Fultz, N.E.; Bonmassar, G.; Setsompop, K.; Stickgold, R.A.; Rosen, B.R.; Polimeni, J.R.; Lewis, L.D. Coupled electrophysiological, hemodynamic, and cerebrospinal fluid oscillations in human sleep. Science 2019, 366, 628–631. [Google Scholar] [CrossRef]
- Micoulaud-Franchi, J.A.; McGonigal, A.; Lopez, R.; Daudet, C.; Kotwas, I.; Bartolomei, F. Electroencephalographic neurofeedback: Level of evidence in mental and brain disorders and suggestions for good clinical practice. Neurophysiol. Clin. 2015, 45, 423–433. [Google Scholar] [CrossRef]
- Thibault, R.T.; MacPherson, A.; Lifshitz, M.; Roth, R.R.; Raz, A. Neurofeedback with fMRI: A critical systematic review. Neuroimage 2018, 172, 786–807. [Google Scholar] [CrossRef]
- Mano, M.; Lécuyer, A.; Bannier, E.; Perronnet, L.; Noorzadeh, S.; Barillot, C. How to Build a Hybrid Neurofeedback Platform Combining EEG and fMRI. Front. Neurosci. 2017, 11, 140. [Google Scholar] [CrossRef]
- Zotev, V.; Phillips, R.; Yuan, H.; Misaki, M.; Bodurka, J. Self-regulation of human brain activity using simultaneous real-time fMRI and EEG neurofeedback. Neuroimage 2014, 85 Pt 3, 985–995. [Google Scholar] [CrossRef]
- Lioi, G.; Butet, S.; Fleury, M.; Bannier, E.; Lécuyer, A.; Bonan, I.; Barillot, C. A Multi-Target Motor Imagery Training Using Bimodal EEG-fMRI Neurofeedback: A Pilot Study in Chronic Stroke Patients. Front. Hum. Neurosci. 2020, 14, 37. [Google Scholar] [CrossRef]
- Perronnet, L.; Lécuyer, A.; Mano, M.; Bannier, E.; Lotte, F.; Clerc, M.; Barillot, C. Unimodal Versus Bimodal EEG-fMRI Neurofeedback of a Motor Imagery Task. Front. Hum. Neurosci. 2017, 11, 193. [Google Scholar] [CrossRef]
- Zotev, V.; Bodurka, J. Effects of simultaneous real-time fMRI and EEG neurofeedback in major depressive disorder evaluated with brain electromagnetic tomography. Neuroimage Clin. 2020, 28, 102459. [Google Scholar] [CrossRef]
- Zotev, V.; Phillips, R.; Misaki, M.; Wong, C.K.; Wurfel, B.E.; Krueger, F.; Feldner, M.; Bodurka, J. Real-time fMRI neurofeedback training of the amygdala activity with simultaneous EEG in veterans with combat-related PTSD. Neuroimage Clin. 2018, 19, 106–121. [Google Scholar] [CrossRef]
- Ladd, M.E.; Bachert, P.; Meyerspeer, M.; Moser, E.; Nagel, A.M.; Norris, D.G.; Schmitter, S.; Speck, O.; Straub, S.; Zaiss, M. Pros and cons of ultra-high-field MRI/MRS for human application. Prog. Nucl. Magn. Reson. Spectrosc. 2018, 109, 1–50. [Google Scholar] [CrossRef]
- Abreu, R.; Leite, M.; Jorge, J.; Grouiller, F.; van der Zwaag, W.; Leal, A.; Figueiredo, P. Ballistocardiogram artifact correction taking into account physiological signal preservation in simultaneous EEG-fMRI. Neuroimage 2016, 135, 45–63. [Google Scholar] [CrossRef]
- Meyer, M.C.; Scheeringa, R.; Webb, A.G.; Petridou, N.; Kraff, O.; Norris, D.G. Adapted cabling of an EEG cap improves simultaneous measurement of EEG and fMRI at 7T. J. Neurosci. Methods 2020, 331, 108518. [Google Scholar] [CrossRef]
- Abbasi, O.; Dammers, J.; Arrubla, J.; Warbrick, T.; Butz, M.; Neuner, I.; Shah, N.J. Time-frequency analysis of resting state and evoked EEG data recorded at higher magnetic fields up to 9.4 T. J. Neurosci. Methods 2015, 255, 1–11. [Google Scholar] [CrossRef] [PubMed]
- Arrubla, J.; Neuner, I.; Hahn, D.; Boers, F.; Shah, N.J. Recording visual evoked potentials and auditory evoked P300 at 9.4T static magnetic field. PLoS ONE 2013, 8, e62915. [Google Scholar] [CrossRef] [PubMed]
- Brookes, M.J.; Vrba, J.; Mullinger, K.J.; Geirsdottir, G.B.; Yan, W.X.; Stevenson, C.M.; Bowtell, R.; Morris, P.G. Source localisation in concurrent EEG/fMRI: Applications at 7T. Neuroimage 2009, 45, 440–452. [Google Scholar] [CrossRef] [PubMed]
- Lewis, L.D.; Bonmassar, G.; Setsompop, K.; Stickgold, R.A.; Rosen, B.R.; Polimeni, J.R. Identifying focal thalamic activity underlying sleep and wake states through EEG-fMRI at 7 Tesla. In Proceedings of the ISMRM, Montreal, QC, Canada, 11–16 May 2019. [Google Scholar]
- Grouiller, F.; Jorge, J.; Pittau, F.; van der Zwaag, W.; Iannotti, G.R.; Michel, C.M.; Vulliemoz, S.; Vargas, M.I.; Lazeyras, F. Presurgical brain mapping in epilepsy using simultaneous EEG and functional MRI at ultra-high field: Feasibility and first results. Magma 2016, 29, 605–616. [Google Scholar] [CrossRef] [PubMed]
- Wirsich, J.; Jorge, J.; Iannotti, G.R.; Shamshiri, E.A.; Grouiller, F.; Abreu, R.; Lazeyras, F.; Giraud, A.L.; Gruetter, R.; Sadaghiani, S.; et al. The relationship between EEG and fMRI connectomes is reproducible across simultaneous EEG-fMRI studies from 1.5T to 7T. Neuroimage 2021, 231, 117864. [Google Scholar] [CrossRef]
- Kumar, V.J.; Buckenmaier, K.; Warbrick, T.; Wehrle, R.; Pohmann, R.; Scheffler, K. EEG-fMRI at 9.4T: The safety assessment and effect on B0, B1 and fMRI scans in a phantom. In Proceedings of the 2020 ISMRM & SMRT Virtual Conference & Exhibition, Online, 8–14 August 2020. [Google Scholar]
- Sheth, K.N.; Mazurek, M.H.; Yuen, M.M.; Cahn, B.A.; Shah, J.T.; Ward, A.; Kim, J.A.; Gilmore, E.J.; Falcone, G.J.; Petersen, N.; et al. Assessment of Brain Injury Using Portable, Low-Field Magnetic Resonance Imaging at the Bedside of Critically Ill Patients. JAMA Neurol. 2020, 78, 41–47. [Google Scholar] [CrossRef]
- Sheth, K.N.; Yuen, M.M.; Mazurek, M.H.; Cahn, B.A.; Prabhat, A.M.; Salehi, S.; Shah, J.T.; By, S.; Welch, E.B.; Sofka, M.; et al. Bedside detection of intracranial midline shift using portable magnetic resonance imaging. Sci. Rep. 2022, 12, 67. [Google Scholar] [CrossRef]
- Janssens, S.E.W.; Sack, A.T. Spontaneous Fluctuations in Oscillatory Brain State Cause Differences in Transcranial Magnetic Stimulation Effects Within and Between Individuals. Front. Hum. Neurosci. 2021, 15, 802244. [Google Scholar] [CrossRef]
- Peters, J.C.; Reithler, J.; Schuhmann, T.; de Graaf, T.; Uludag, K.; Goebel, R.; Sack, A.T. On the feasibility of concurrent human TMS-EEG-fMRI measurements. J. Neurophysiol. 2013, 109, 1214–1227. [Google Scholar] [CrossRef]
- Peters, J.C.; Reithler, J.; Graaf, T.A.; Schuhmann, T.; Goebel, R.; Sack, A.T. Concurrent human TMS-EEG-fMRI enables monitoring of oscillatory brain state-dependent gating of cortico-subcortical network activity. Commun. Biol. 2020, 3, 40. [Google Scholar] [CrossRef]
- Clancy, K.J.; Andrzejewski, J.A.; You, Y.; Rosenberg, J.T.; Ding, M.; Li, W. Transcranial stimulation of alpha oscillations up-regulates the default mode network. Proc. Natl. Acad. Sci. USA 2022, 119, e2110868119. [Google Scholar] [CrossRef] [PubMed]
- Shah, N.J.; Oros-Peusquens, A.M.; Arrubla, J.; Zhang, K.; Warbrick, T.; Mauler, J.; Vahedipour, K.; Romanzetti, S.; Felder, J.; Celik, A.; et al. Advances in multimodal neuroimaging: Hybrid MR-PET and MR-PET-EEG at 3 T and 9.4 T. J. Magn. Reson. 2013, 229, 101–115. [Google Scholar] [CrossRef] [PubMed]
- Shah, N.J.; Arrubla, J.; Rajkumar, R.; Farrher, E.; Mauler, J.; Kops, E.R.; Tellmann, L.; Scheins, J.; Boers, F.; Dammers, J.; et al. Multimodal Fingerprints of Resting State Networks as assessed by Simultaneous Trimodal MR-PET-EEG Imaging. Sci. Rep. 2017, 7, 6452. [Google Scholar] [CrossRef] [PubMed]
- Grouiller, F.; Delattre, B.M.; Pittau, F.; Heinzer, S.; Lazeyras, F.; Spinelli, L.; Iannotti, G.R.; Seeck, M.; Ratib, O.; Vargas, M.I.; et al. All-in-one interictal presurgical imaging in patients with epilepsy: Single-session EEG/PET/(f)MRI. Eur. J. Nucl. Med. Mol. Imaging 2015, 42, 1133–1143. [Google Scholar] [CrossRef] [PubMed]
- Rajkumar, R.; Rota Kops, E.; Mauler, J.; Tellmann, L.; Lerche, C.; Herzog, H.; Shah, N.J.; Neuner, I. Simultaneous trimodal PET-MR-EEG imaging: Do EEG caps generate artefacts in PET images? PLoS ONE 2017, 12, e0184743. [Google Scholar] [CrossRef] [PubMed]
- Golkowski, D.; Merz, K.; Mlynarcik, C.; Kiel, T.; Schorr, B.; Lopez-Rolon, A.; Lukas, M.; Jordan, D.; Bender, A.; Ilg, R. Simultaneous EEG-PET-fMRI measurements in disorders of consciousness: An exploratory study on diagnosis and prognosis. J. Neurol. 2017, 264, 1986–1995. [Google Scholar] [CrossRef]
- Régio Brambilla, C.; Veselinović, T.; Rajkumar, R.; Mauler, J.; Matusch, A.; Ruch, A.; Orth, L.; Ramkiran, S.; Sbaihat, H.; Kaulen, N.; et al. mGluR5 binding changes during a mismatch negativity task in a multimodal protocol with [(11)C]ABP688 PET/MR-EEG. Transl. Psychiatry 2022, 12, 6. [Google Scholar] [CrossRef]


Publisher’s Note: MDPI stays neutral with regard to jurisdictional claims in published maps and institutional affiliations. |
© 2022 by the author. Licensee MDPI, Basel, Switzerland. This article is an open access article distributed under the terms and conditions of the Creative Commons Attribution (CC BY) license (https://creativecommons.org/licenses/by/4.0/).
Share and Cite
Warbrick, T. Simultaneous EEG-fMRI: What Have We Learned and What Does the Future Hold? Sensors 2022, 22, 2262. https://doi.org/10.3390/s22062262
Warbrick T. Simultaneous EEG-fMRI: What Have We Learned and What Does the Future Hold? Sensors. 2022; 22(6):2262. https://doi.org/10.3390/s22062262
Chicago/Turabian StyleWarbrick, Tracy. 2022. "Simultaneous EEG-fMRI: What Have We Learned and What Does the Future Hold?" Sensors 22, no. 6: 2262. https://doi.org/10.3390/s22062262
APA StyleWarbrick, T. (2022). Simultaneous EEG-fMRI: What Have We Learned and What Does the Future Hold? Sensors, 22(6), 2262. https://doi.org/10.3390/s22062262