
Cluster Analysis and Discriminant Analysis for Determining Post-Earthquake Road Recovery Patterns †


Abstract
:1. Introduction
2. Materials and Methods
2.1. Vehicle Tracking Map
2.2. System
2.2.1. Hardware
2.2.2. Software
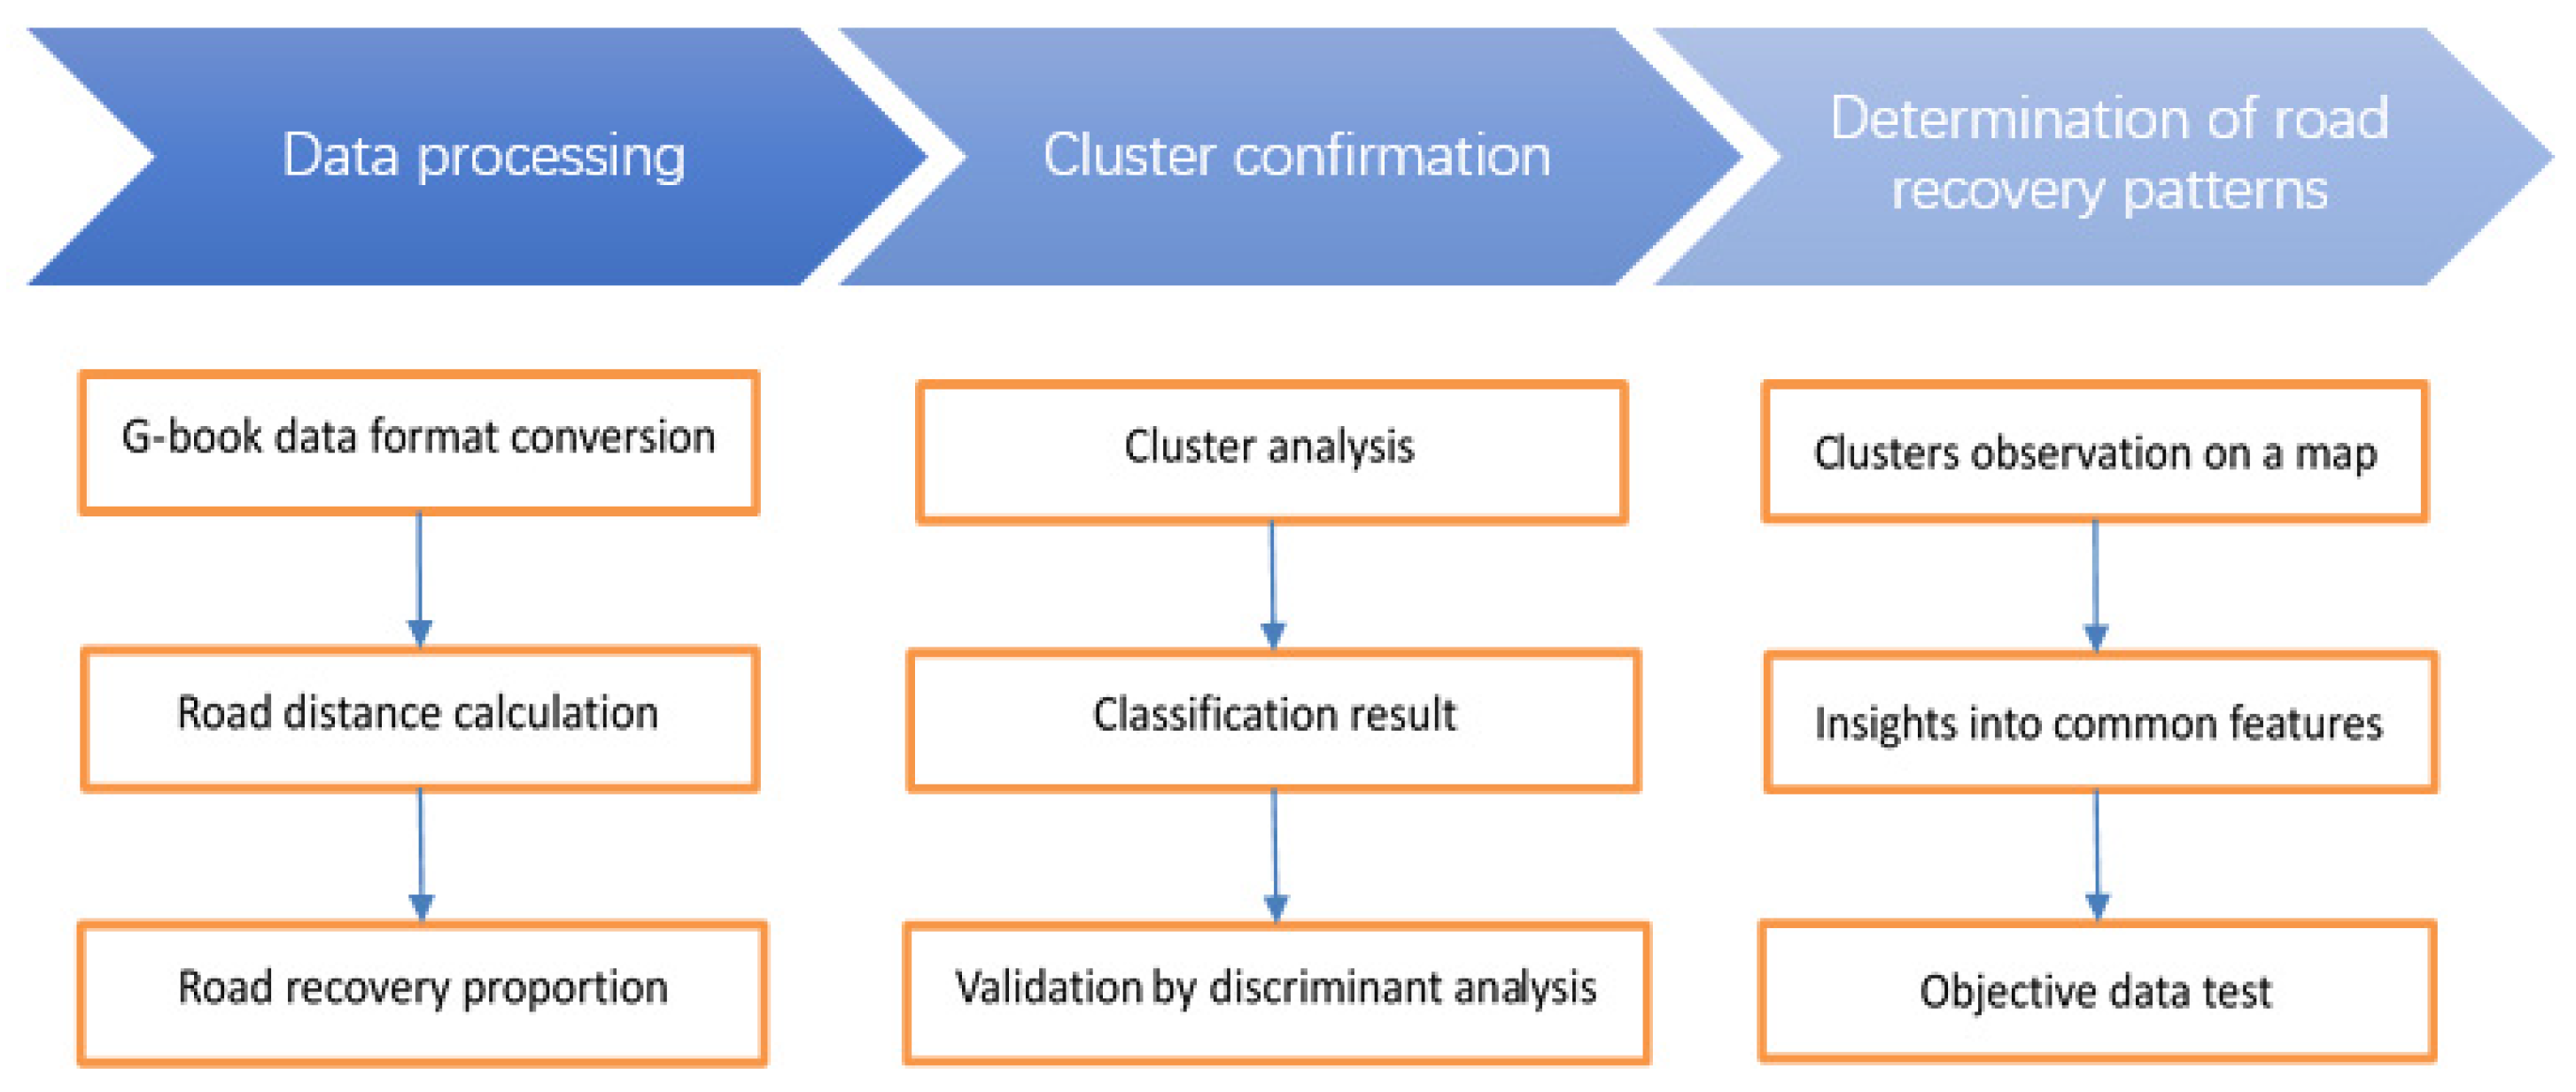
2.3. Data Processing
- (1)
- The vehicle tracking maps constructed from the G-BOOK telematics data were provided in the Google Maps KMZ format. For our analysis, we first converted the KMZ files into SHP files (i.e., shape files), which are compatible with ArcGIS using the “ogr2ogr” function [22] on the Linux operating system [23].The data coordinates were converted from the terrestrial latitude and longitude into the x and y coordinates in a rectangular coordinate system.
- (2)
- After merging the daily data into weekly data and removing duplicates, we were able to calculate the exact available road distance for a given week.
- (3)
- Next, we calculated the proportion of the cumulative distance up to the specified date and considered the cumulative distance up to 30 September 2011, to be 100%.
2.4. Cluster Analysis
2.5. Discriminant Analysis for Validation of the Cluster Analysis Results
2.5.1. Canonical Discriminant Analysis
2.5.2. Canonical Discriminant Function Determination
3. Results
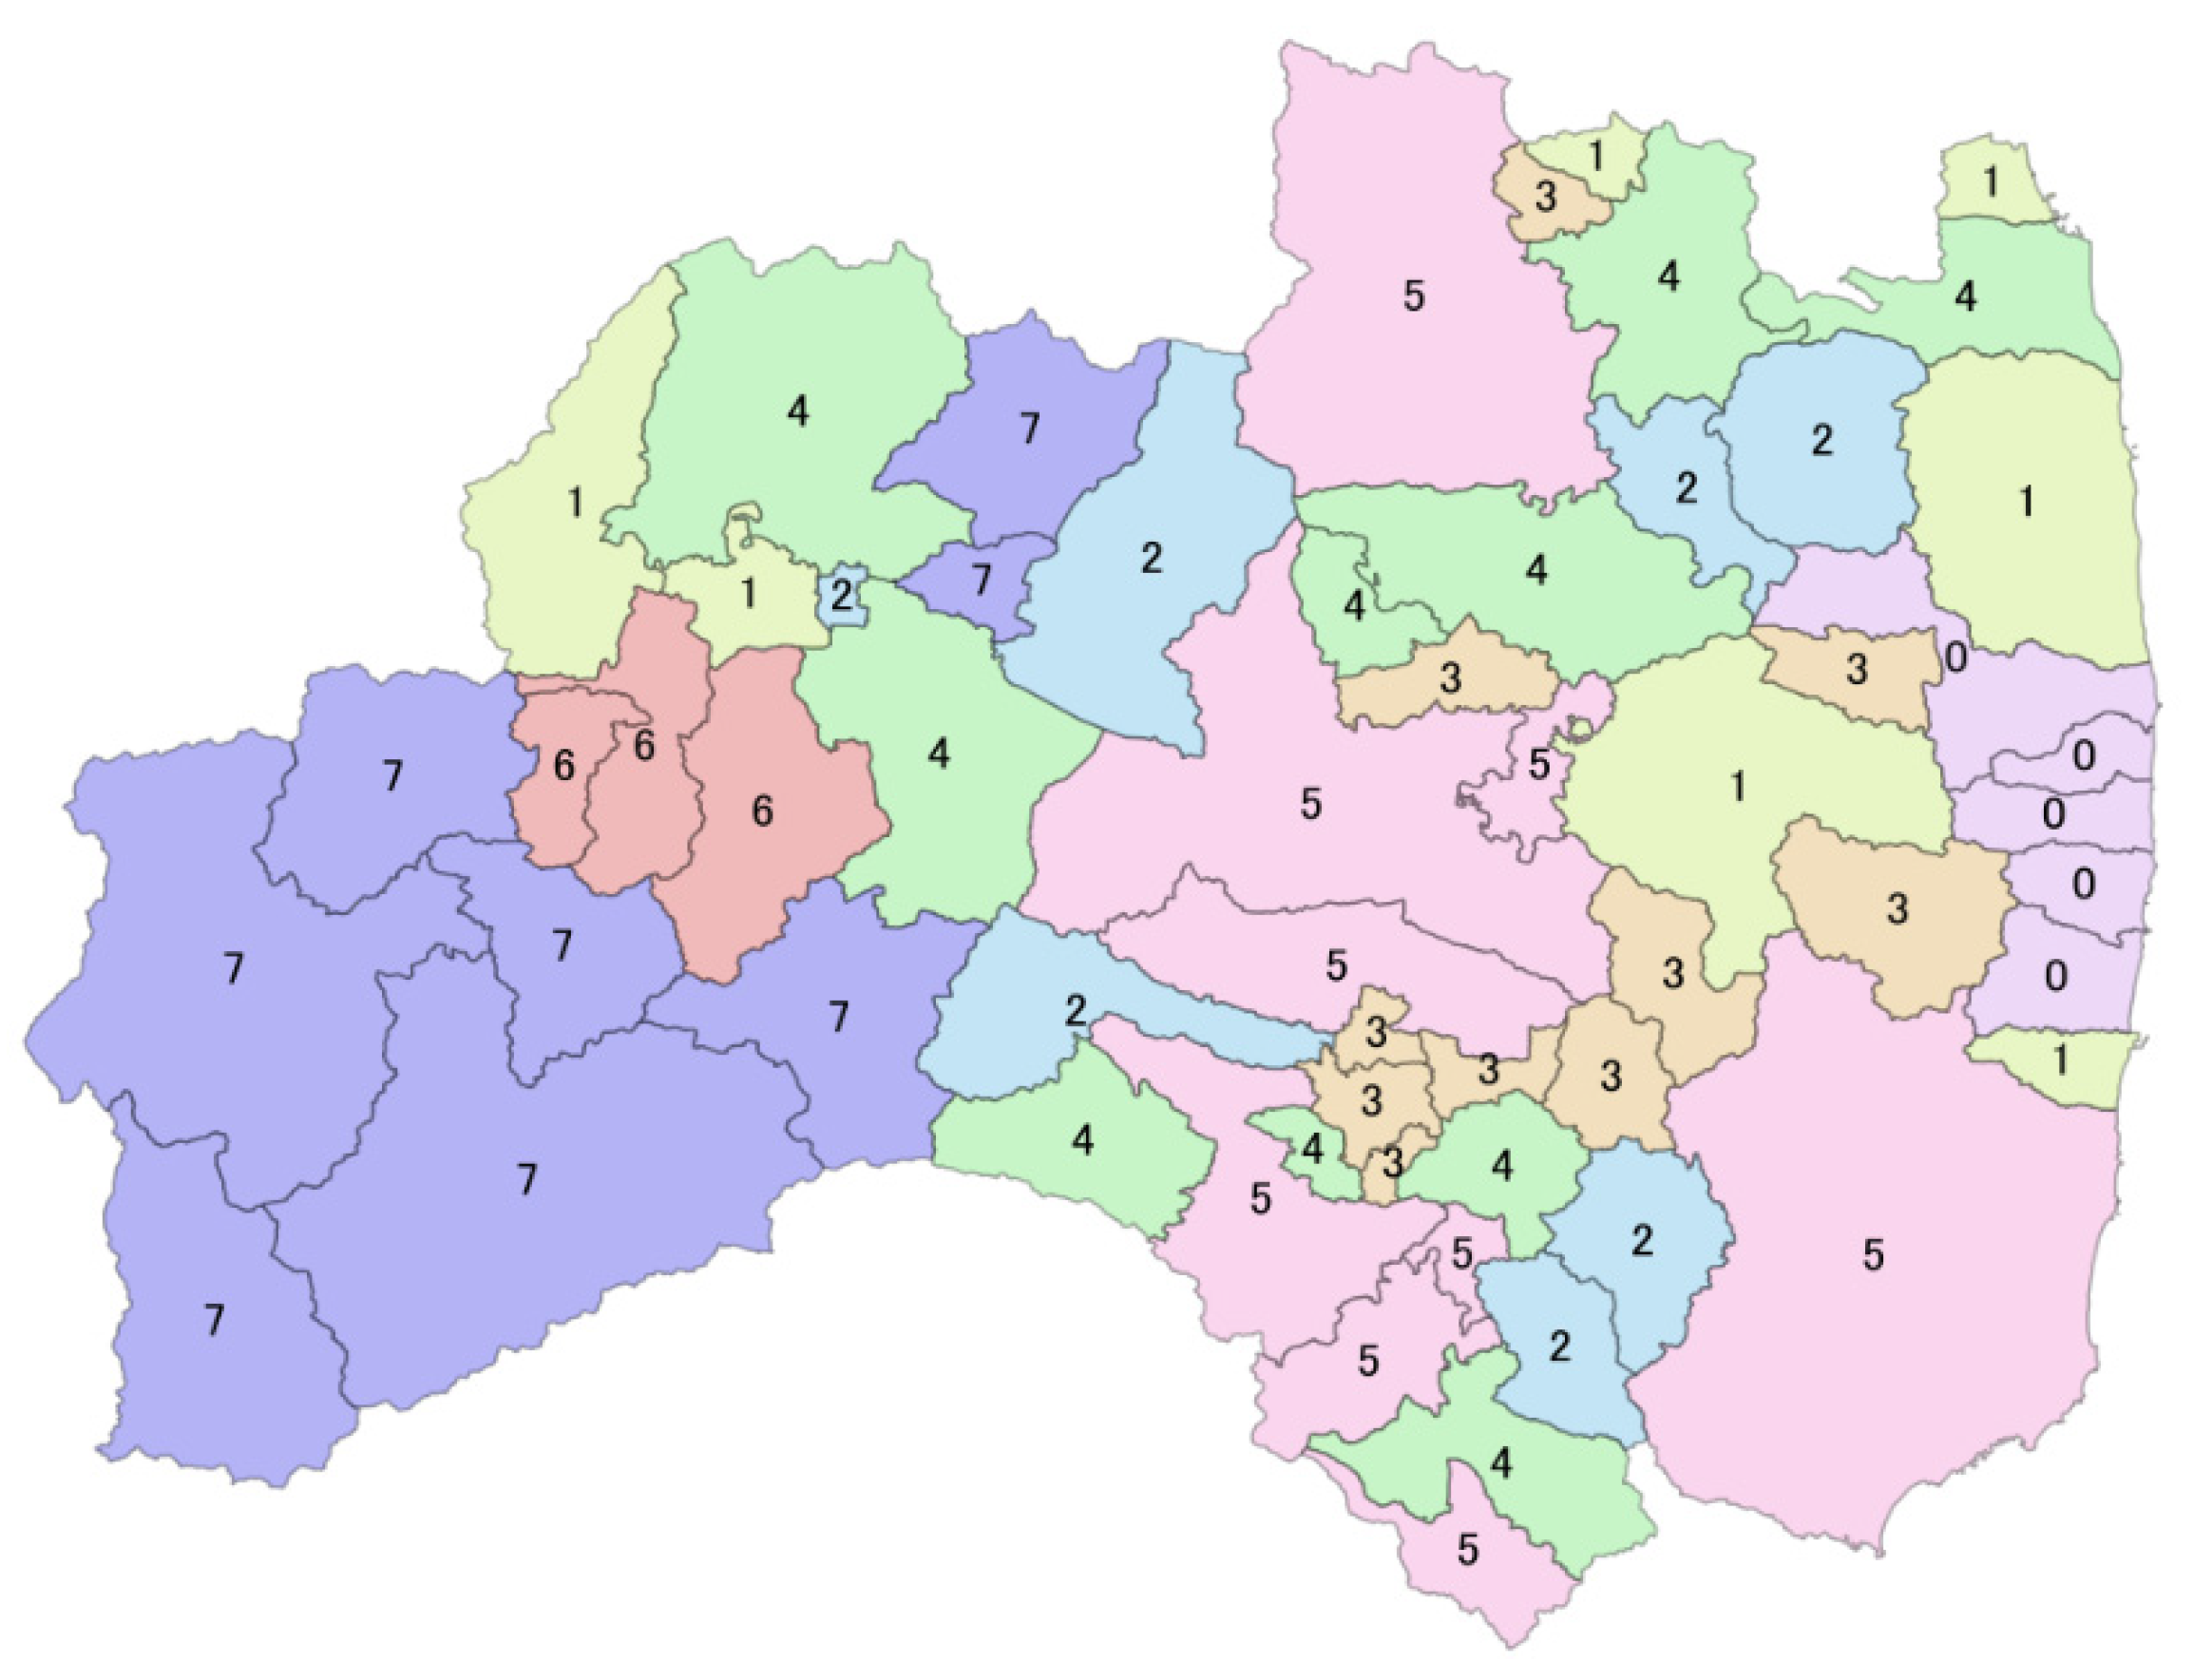
3.1. The Cluster Analysis Results
3.2. Validated Results of Discriminant Analysis on Classification
3.2.1. Standardized Canonical Discriminant Function
3.2.2. Unstandardized Canonical Discriminant
0.356 × X8 − 0.190 × X9 − 0.001 × X10 − 14.3
0.171 × X8 + 0.169 × X9 + 0.119 × X10 − 1.76
4. Discussion
4.1. Data Collection on Factors Affecting Road Recovery
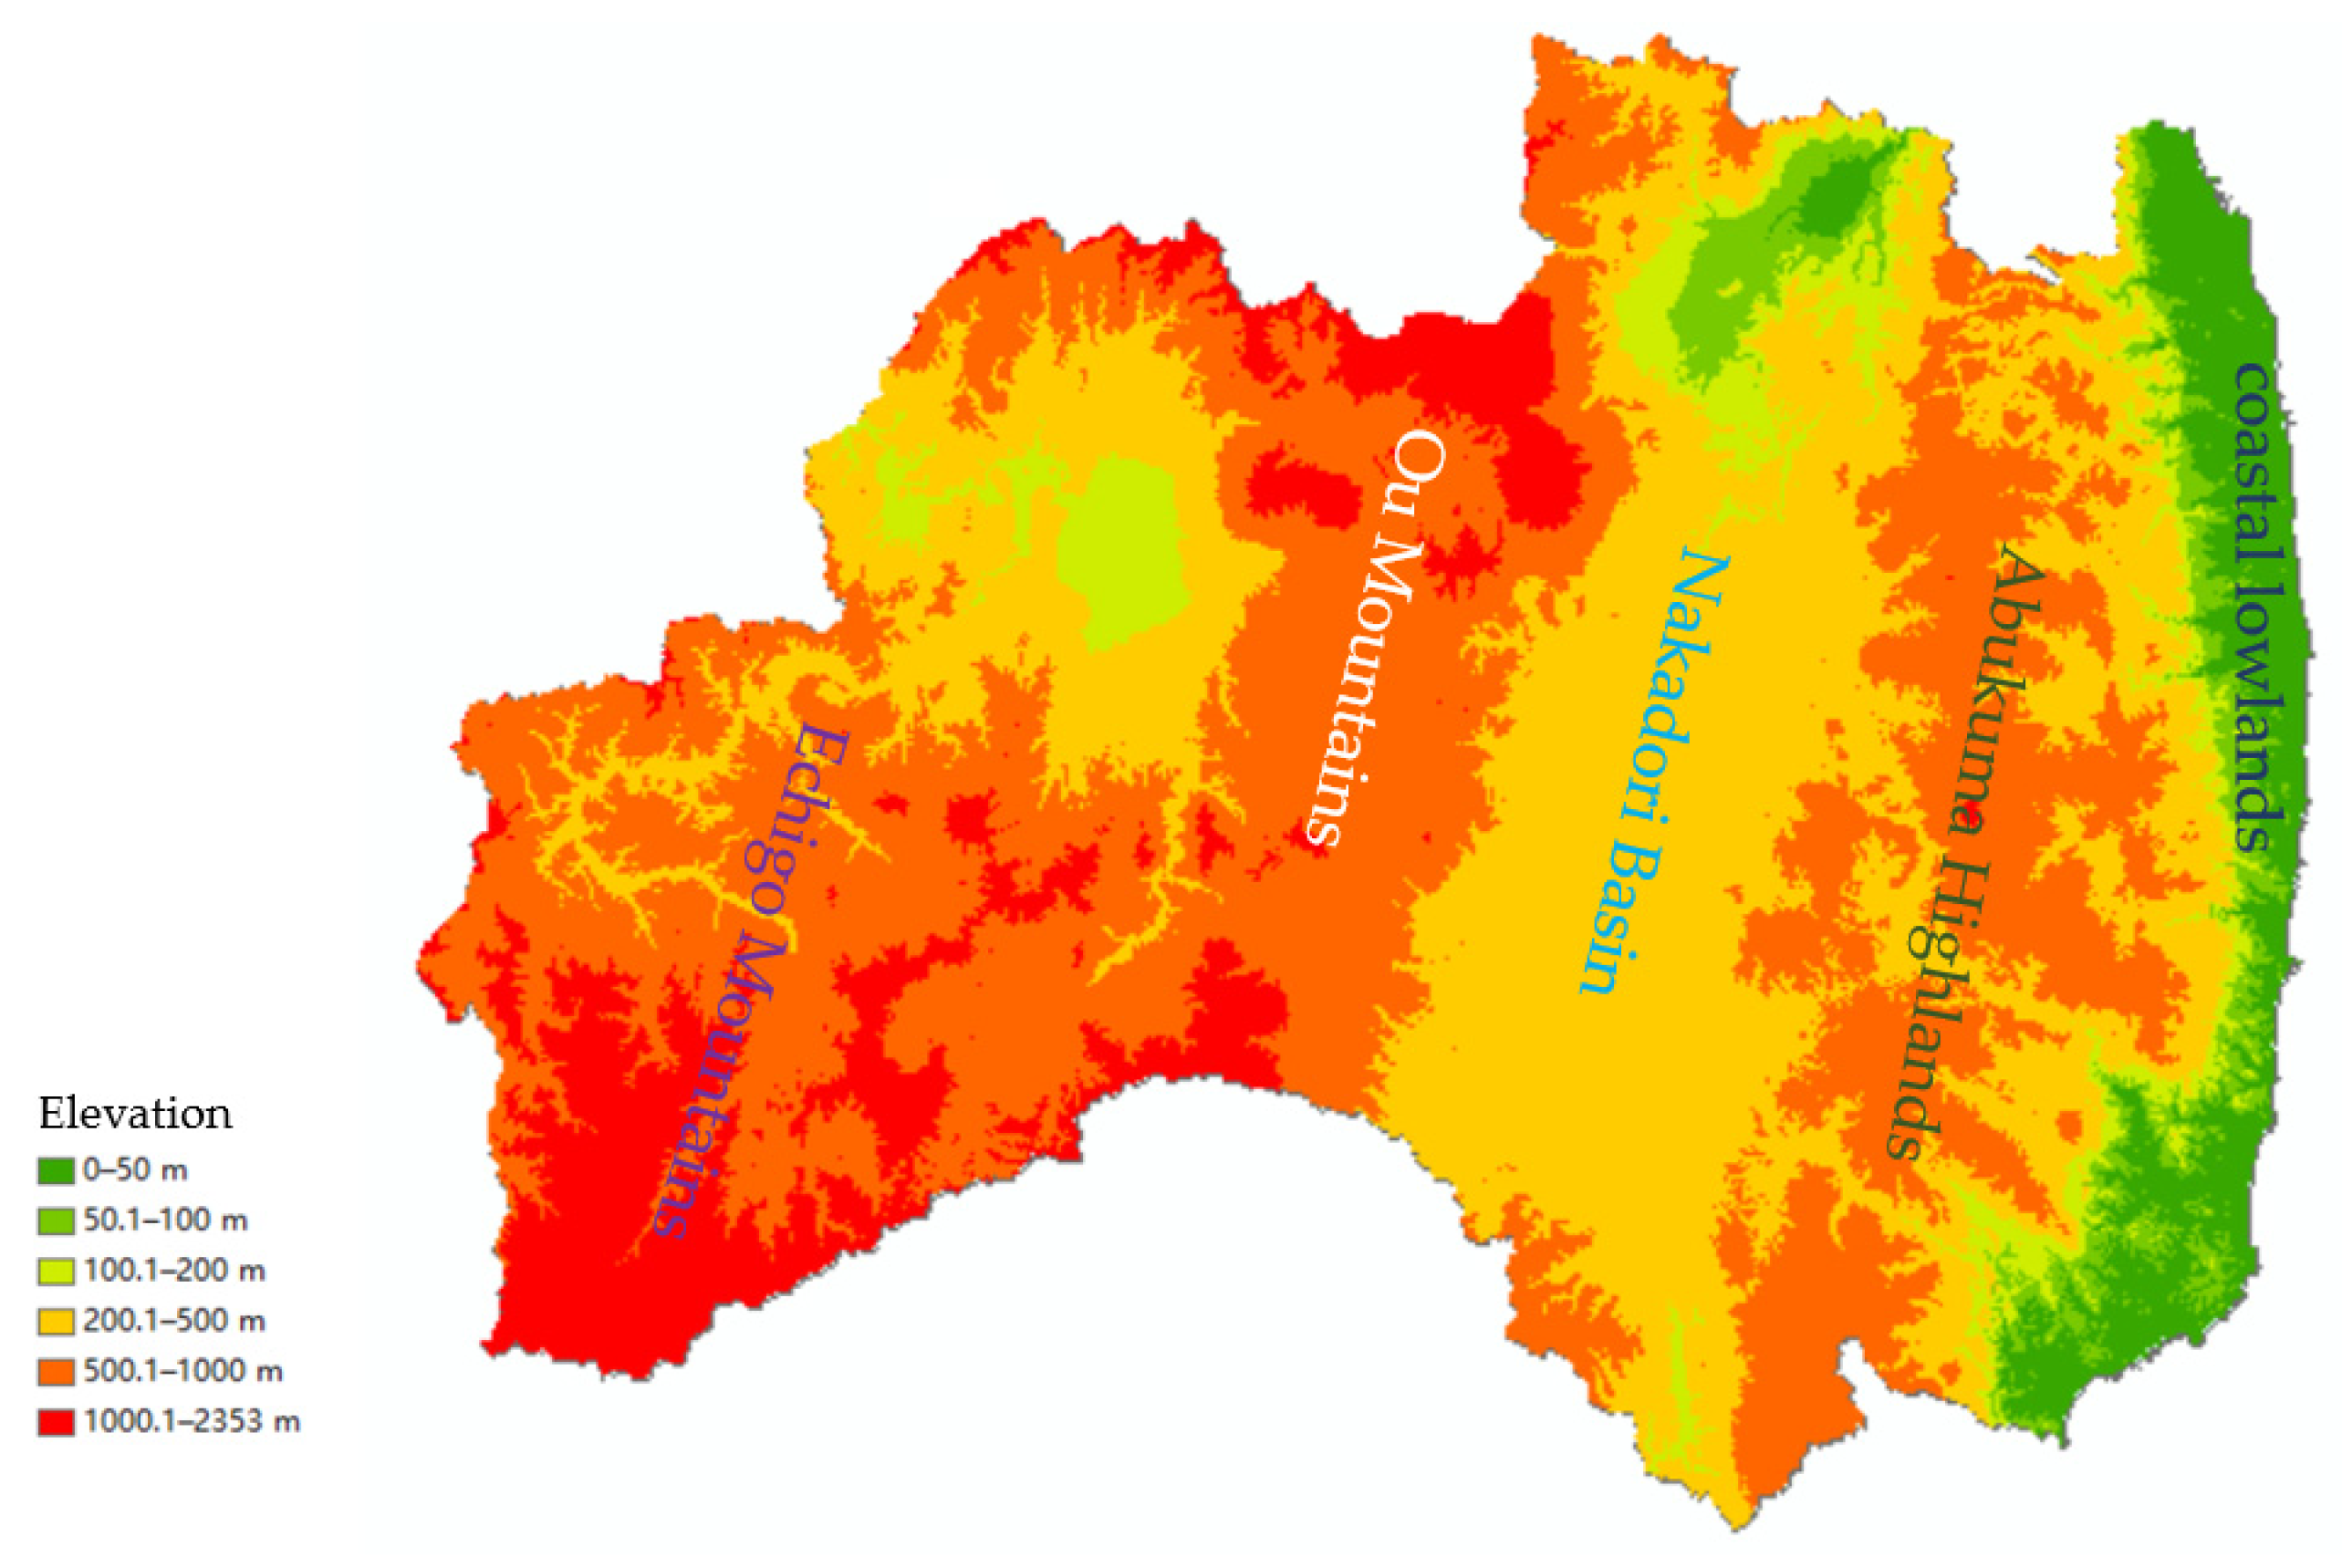
4.1.1. Geographic Location and Topography
- The 2011 Digital Road Map data in the SHP file only provide the latitude and longitude and are generally saved as x and y attributes in the geometry. We used the “add z value” function of GIS to add the digital elevation model (DEM) data [29] to the z values of the road data.
- The road data are stored in intervals in the SHP file’s properties. We calculated the average of the z values (i.e., the average elevation) of the roads in intervals and saved them together in the attribute table.
- We calculated the distance of roads with an average elevation of less than 50 m, 50 to 100 m, 100 to 200 m, 200 to 500 m, and more than 500 m for each municipality and then calculated the percentage of road length at each elevation compared to the total road length of the municipality.
4.1.2. Population Density
4.1.3. Damage
4.1.4. Road Importance
4.1.5. Road Density
4.1.6. Snow
4.2. Pearson Correlation Analysis
5. Conclusions
Author Contributions
Funding
Institutional Review Board Statement
Informed Consent Statement
Data Availability Statement
Acknowledgments
Conflicts of Interest
References
- Mori, N.; Takahashi, T. The 2011 Tohoku Earthquake Tsunami Joint Survey Group: Results of Tsunami Surveys. Coast. Eng. J. 2012, 54, 1250001. Available online: http://www.coastal.jp/tsunami2011/index.php?Field (accessed on 12 April 2018).
- Tohoku Regional Development Bureau, Ministry of Land, Infrastructure, Transport, and Tourism. Information Related to the Tohoku Earthquake, “Operation Combs’ Teeth”; Tohoku Regional Development Bureau, Ministry of Land, Infrastructure, Transport, and Tourism: Yamanashi, Japan, 2011; Available online: http://infra-archive311.jp/s-kushinoha.html (accessed on 13 December 2019).
- Tokyo Electric Power Company Holdings. Progress and Lessons Learnt from the Fukushima Daiichi Nuclear Power Station Accident. Available online: https://www.tepco.co.jp/nu/fukushima-np/outline/ (accessed on 12 April 2018).
- Hada, Y.; Suzuki, T.; Shimora, H.; Meguro, K.; Kodama, N. Issues and Future Prospect on Practical Use of Probe Vehicle Data for Disaster Reduction—Provision of the for Disaster Reduction—Provision of the Vehicle Tracking Map in the 2007 Niigata-Ken Chuetsu-Oki Earthquake. J. Jpn. Assoc. Earthq. Eng. 2009, 9, 148–159. Available online: http://www.jaee.gr.jp/stack/submit-j/v09n02/090211paper.pdf (accessed on 12 April 2018). (In Japanese).
- ITS JAPAN Traffic Information Map. Available online: https://www.its-jp.org/saigai/ (accessed on 13 December 2019).
- Shouro, N.; Hiroki, K. Spatio-Temporal Analysis of Traffic Volumes on Highway Networks—Comparison of the Great East Japan Earthquake Disaster and the Great Hanshin-Awaji Earthquake Disaster; Civil Engineering Society: Tokyo, Japan, 2013; Volume 69, pp. I_121–I_133. (In Japanese) [Google Scholar]
- Kishida, M. The Great East Japan Earthquake: Damage and Restoration on Expressway. Concr. J. 2012, 50, 45–48. [Google Scholar] [CrossRef]
- Komori, H.; Endo, N. Road Distance Traveled by Vehicles Following the 2011 Tohoku Earthquake, Calculated by G-BOOK Telematics Data. In Proceedings of the 9th International Conference on Signal-Image Technology & Internet-Based Systems, SITIS 9, Kyoto, Japan, 2–5 December 2013; pp. 870–874. [Google Scholar]
- Endo, N.; Komori, H. Analysis of Vehicle Tracking Maps in Iwate Prefecture Following the 2011 Tohoku Earthquake. Lecture Notes in Engineering and Computer Science. In Proceedings of the International MultiConference of Engineers and Computer Scientists 2015 (IMECS 2015), Hong Kong, China, 18–20 March 2015; pp. 124–128. [Google Scholar]
- Endo, N.; Komori, H. Regional Difference on Road Recovery in Iwate Prefecture Following the 2011 Tohoku Earthquake. Lecture Notes in Engineering and Computer Science. In Proceedings of the World Congress on Engineering and Computer Science 2015, WCECS 2015, Berkeley, CA, USA, 21–23 October 2015; pp. 162–167. [Google Scholar]
- Endo, N.; Komori, H. Municipal Difference on Road Recovery in Iwate Prefecture Following the 2011 Tohoku Earthquake. In IAENG Transactions on Engineering Sciences—Special Issue for the International Association of Engineers Conferences, San Francisco, CA, USA, 21–23 October 2015; World Scientific: Singapore, 2016; pp. 226–235. [Google Scholar] [CrossRef]
- Endo, N.; Komori, H. Regional Differences in Iwate Prefecture Road Usage Recovery Following the 2011 Tohoku Earthquake, Transactions on Engineering Technologies—World Congress on Engineering and Computer Science 2015; Springer: Berlin/Heidelberg, Germany, 2017; pp. 219–231. [Google Scholar] [CrossRef]
- Endo, N. Road Usage Recovery in Miyagi Prefecture Following the 2011 Tohoku Earthquake, IAENG Transactions on Engineering Sciences—Special Issue for the International Association of Engineers Conferences 2016, Singapore, 5–7 January 2016; World Scientific: Singapore, 2017; pp. 111–125. [Google Scholar] [CrossRef]
- Wu, J.; Endo, N. Regional Differences in Fukushima Prefecture Road Recovery Following the 2011 Tohoku Earthquake, Lecture Notes in Engineering and Computer Science. In Proceedings of the International Multi Conference of Engineers and Computer Scientists 2019, Hong Kong, China, 13–15 March 2019; pp. 164–169. [Google Scholar]
- Wu, J.; Endo, N. Road Usage Recovery in Fukushima Prefecture Following the 2011 Tohoku Earthquake, IAENG Transactions on Engineering Sciences—Special Issue for the International Association of Engineers Conferences 2019, Hong Kong, China, 13–15 March 2019; World Scientific: Singapore, 2020; pp. 48–62. [Google Scholar] [CrossRef]
- Information on 59 Municipalities in Fukushima Prefecture. Available online: https://www.pref.fukushima.lg.jp/site/iju-tokyo/city-town-vill.html (accessed on 12 April 2018).
- Wu, J.; Endo, N.; Saito, M. Cluster Analysis for Studying Road Recovery of Fukushima Prefecture Following the 2011 Tohoku Earthquake, Lecture Notes in Engineering and Computer Science. In Proceedings of the World Congress on Engineering 2021, London, UK, 7–9 July 2021; pp. 107–112. [Google Scholar]
- Wu, J.; Endo, N.; Saito, M. Cluster Analysis for Investigating Road Recovery in Fukushima Prefecture Following the 2011 Tohoku Earthquake. Eng. Lett. 2021, 29, 1636–1642. [Google Scholar]
- TOYOTA CONNECTED Big Data, Passable Road Map. Available online: https://www.toyotaconnected.co.jp/service/bigdata.html (accessed on 13 December 2019).
- Official Website of QGIS, A Free and Open Source Geographic Information System. Available online: http://www.qgis.org/en/site/ (accessed on 13 December 2019).
- Official Website of IBM SPSS Statistics. Available online: https://www.ibm.com/products/spss-statistics (accessed on 13 December 2019).
- Official Website of GDAL: ogr2ogr. Available online: https://gdal.org/programs/ogr2ogr.html (accessed on 13 December 2019).
- Official Website of Vine Linux. Available online: https://www.vinelinux.org/ (accessed on 13 December 2019). (In Japanese).
- Edwards, A.W.; Cavalli-Sforza, L.L. A Method for Cluster Analysis. Biometrics 1965, 21, 362–375. [Google Scholar] [CrossRef] [PubMed]
- Ward, J.H., Jr. Hierarchical Grouping to Optimize an Objective Function. J. Am. Stat. Assoc. 1963, 58, 236–244. [Google Scholar] [CrossRef]
- Klecka, W.R.; Iversen, G.R.; Klecka, W.R. Discriminant Analysis; Sage: New York, NY, USA, 1980; Volume 19. [Google Scholar]
- Ministry of Land, Infrastructure, Transport, and Tourism: Information on Winter Closure Routes in the Tohoku Region. Available online: https://www.thr.mlit.go.jp/road/koutsu/heisa/index.html (accessed on 13 June 2021).
- Digital Road Map. Available online: https://www.drm.jp/database/ (accessed on 10 July 2021).
- Conservation GIS-Consortium Japan, GIS Data Download, Dem Data. Available online: http://cgisj.jp/download_type_list.php (accessed on 13 June 2021).
- Statistics Bureau Japan. Available online: https://www.stat.go.jp/data/index.html (accessed on 13 June 2021).
- Japan Meteorological Agency Seismic Intensity Table. Available online: https://www.jma.go.jp/jma/kishou/know/shindo/kaisetsu.html (accessed on 15 September 2021).
- Japan Meteorological Agency, Seismic intensity of the 2011 off the Pacific Coast of Tohoku Earthquake. Available online: https://www.data.jma.go.jp/svd/eqev/data/2011_03_11_tohoku/index.html (accessed on 15 September 2021).


| Cluster | Municipality | Mar.—3 w | Mar.—4 w | Apr.—1 w | Apr.—2 w | Apr.—3 w | Apr.—4 w | May | Jun. | Jul. | Aug. | Sep. |
|---|---|---|---|---|---|---|---|---|---|---|---|---|
| 1 | Hirono-machi | 38 | 69 | 71 | 88 | 92 | 93 | 97 | 98 | 99 | 100 | 100 |
| 1 | Minamisoma-shi | 34 | 71 | 83 | 89 | 93 | 93 | 95 | 97 | 98 | 99 | 100 |
| 1 | Shinchi-machi | 44 | 64 | 77 | 86 | 88 | 94 | 97 | 98 | 98 | 99 | 100 |
| 1 | Kunimi-machi | 33 | 71 | 79 | 88 | 89 | 89 | 98 | 98 | 98 | 98 | 100 |
| 1 | Tamura-shi | 43 | 71 | 80 | 87 | 91 | 94 | 96 | 96 | 98 | 99 | 100 |
| 1 | Aizubange-machi | 41 | 69 | 81 | 85 | 89 | 92 | 96 | 97 | 97 | 100 | 100 |
| 1 | Nishiaizu-machi | 39 | 67 | 81 | 88 | 88 | 88 | 99 | 100 | 100 | 100 | 100 |
| 2 | Iitate-mura | 55 | 63 | 67 | 76 | 82 | 86 | 93 | 93 | 100 | 100 | 100 |
| 2 | Kawamata-machi | 56 | 71 | 71 | 76 | 85 | 90 | 95 | 96 | 98 | 100 | 100 |
| 2 | Tenei-mura | 49 | 63 | 72 | 76 | 80 | 85 | 97 | 97 | 98 | 99 | 100 |
| 2 | Furudono-machi | 57 | 58 | 59 | 73 | 86 | 93 | 93 | 93 | 99 | 100 | 100 |
| 2 | Samegawa-mura | 72 | 72 | 73 | 76 | 78 | 95 | 98 | 98 | 98 | 100 | 100 |
| 2 | Inawashiro-machi | 52 | 68 | 71 | 72 | 77 | 85 | 95 | 97 | 98 | 100 | 100 |
| 2 | Yugawa-mura | 59 | 68 | 69 | 78 | 78 | 83 | 89 | 96 | 96 | 98 | 100 |
| 3 | Katsurao-mura | 60 | 74 | 96 | 100 | 100 | 100 | 100 | 100 | 100 | 100 | 100 |
| 3 | Kawauchi-mura | 40 | 95 | 98 | 98 | 99 | 99 | 99 | 99 | 100 | 100 | 100 |
| 3 | Kori-machi | 57 | 86 | 93 | 95 | 96 | 96 | 100 | 100 | 100 | 100 | 100 |
| 3 | Kagamiishi-machi | 57 | 85 | 89 | 95 | 98 | 98 | 98 | 98 | 99 | 100 | 100 |
| 3 | Motomiya-shi | 69 | 87 | 93 | 95 | 97 | 98 | 99 | 99 | 100 | 100 | 100 |
| 3 | Ono-machi | 51 | 88 | 95 | 95 | 97 | 97 | 98 | 98 | 98 | 98 | 100 |
| 3 | Hirata-mura | 57 | 82 | 90 | 95 | 96 | 96 | 97 | 97 | 100 | 100 | 100 |
| 3 | Nakajima-mura | 58 | 81 | 88 | 92 | 97 | 97 | 97 | 97 | 98 | 98 | 100 |
| 3 | Tamakawa-mura | 52 | 78 | 85 | 93 | 98 | 100 | 100 | 100 | 100 | 100 | 100 |
| 3 | Yabuki-machi | 63 | 90 | 91 | 94 | 96 | 98 | 98 | 100 | 100 | 100 | 100 |
| 4 | Soma-shi | 54 | 77 | 84 | 86 | 92 | 95 | 96 | 96 | 96 | 99 | 100 |
| 4 | Date-shi | 55 | 71 | 81 | 88 | 93 | 95 | 96 | 97 | 98 | 100 | 100 |
| 4 | Nihonmatsu-shi | 59 | 75 | 80 | 84 | 87 | 91 | 94 | 95 | 97 | 99 | 100 |
| 4 | Otama-mura | 46 | 75 | 84 | 89 | 91 | 93 | 94 | 94 | 94 | 100 | 100 |
| 4 | Hanawa-machi | 60 | 65 | 75 | 85 | 87 | 88 | 88 | 88 | 88 | 88 | 100 |
| 4 | Ishikawa-machi | 57 | 69 | 89 | 92 | 93 | 97 | 97 | 97 | 100 | 100 | 100 |
| 4 | Izumizaki-mura | 55 | 78 | 87 | 89 | 91 | 95 | 96 | 97 | 99 | 100 | 100 |
| 4 | Nishigo-mura | 53 | 71 | 82 | 91 | 92 | 99 | 100 | 100 | 100 | 100 | 100 |
| 4 | Aizuwakamatsu-shi | 55 | 69 | 80 | 83 | 86 | 92 | 95 | 97 | 98 | 100 | 100 |
| 4 | Kitakata-shi | 55 | 61 | 74 | 86 | 91 | 92 | 94 | 95 | 97 | 98 | 100 |
| 5 | Iwaki-shi | 60 | 81 | 88 | 90 | 93 | 95 | 97 | 98 | 99 | 99 | 100 |
| 5 | Fukushima-shi | 66 | 80 | 85 | 88 | 90 | 95 | 96 | 98 | 99 | 99 | 100 |
| 5 | Koriyama-shi | 66 | 84 | 89 | 91 | 94 | 96 | 97 | 98 | 99 | 99 | 100 |
| 5 | Miharu-machi | 60 | 80 | 83 | 85 | 90 | 97 | 99 | 99 | 100 | 100 | 100 |
| 5 | Sukagawa-shi | 64 | 80 | 85 | 90 | 92 | 95 | 97 | 97 | 98 | 100 | 100 |
| 5 | Asakawa-machi | 67 | 76 | 79 | 86 | 95 | 98 | 99 | 99 | 99 | 99 | 100 |
| 5 | Shirakawa-shi | 67 | 80 | 86 | 89 | 92 | 92 | 97 | 98 | 99 | 99 | 100 |
| 5 | Tanagura-machi | 82 | 86 | 89 | 94 | 98 | 98 | 99 | 99 | 100 | 100 | 100 |
| 5 | Yamatsuri-machi | 81 | 83 | 90 | 93 | 93 | 93 | 93 | 100 | 100 | 100 | 100 |
| 6 | Aizumisato-machi | 39 | 51 | 71 | 75 | 81 | 93 | 93 | 96 | 98 | 99 | 100 |
| 6 | Mishima-machi | 16 | 54 | 80 | 80 | 82 | 82 | 84 | 98 | 98 | 98 | 100 |
| 6 | Yanaizu-machi | 29 | 50 | 87 | 92 | 92 | 94 | 98 | 100 | 100 | 100 | 100 |
| 7 | Bandai-machi | 28 | 52 | 56 | 59 | 59 | 70 | 95 | 97 | 98 | 98 | 100 |
| 7 | Kaneyama-machi | 0 | 13 | 61 | 61 | 64 | 64 | 65 | 97 | 100 | 100 | 100 |
| 7 | Kitashiobara-mura | 39 | 44 | 48 | 54 | 71 | 82 | 97 | 98 | 98 | 98 | 100 |
| 7 | Showa-mura | 0 | 33 | 46 | 47 | 70 | 73 | 95 | 95 | 95 | 95 | 100 |
| 7 | Hinoemata-mura | 0 | 0 | 0 | 0 | 0 | 31 | 61 | 100 | 100 | 100 | 100 |
| 7 | Minamiaizu-machi | 32 | 47 | 59 | 64 | 64 | 77 | 84 | 88 | 99 | 99 | 100 |
| 7 | Shimogo-machi | 41 | 57 | 59 | 62 | 75 | 85 | 93 | 94 | 99 | 99 | 100 |
| 7 | Tadami-machi | 4 | 4 | 27 | 38 | 53 | 55 | 78 | 90 | 94 | 95 | 100 |
| Function | Eigenvalue | % of Variance | Cumulative % | Canonical Correlation |
|---|---|---|---|---|
| 1 | 8.366 a | 65.6 | 65.6 | 0.945 |
| 2 | 2.648 a | 20.8 | 86.3 | 0.852 |
| 3 | 1.002 a | 7.9 | 94.2 | 0.707 |
| 4 | 0.630 a | 4.9 | 99.1 | 0.622 |
| 5 | 0.074 a | 0.6 | 99.7 | 0.262 |
| 6 | 0.042 a | 0.3 | 100.0 | 0.202 |
| Test of Function(s) | Wilks’ Lambda | Chi-Square | df | Sig. |
|---|---|---|---|---|
| 1 | 0.008 | 214.775 | 60 | 0.000 |
| 2 | 0.075 | 115.227 | 45 | 0.000 |
| 3 | 0.274 | 57.634 | 32 | 0.004 |
| 4 | 0.548 | 26.743 | 21 | 0.180 |
| 5 | 0.894 | 5.010 | 12 | 0.958 |
| 6 | 0.959 | 1.851 | 5 | 0.869 |
| Cluster | Mar.—3 w | Mar.—4 w | Apr.—1 w | Apr.—2 w | Apr.—3 w | Apr.—4 w | May | Jun. | Jul. | Aug. | Sep. |
|---|---|---|---|---|---|---|---|---|---|---|---|
| 1 | 39 | 69 | 79 | 87 | 90 | 92 | 97 | 98 | 98 | 99 | 100 |
| 2 | 57 | 66 | 69 | 75 | 81 | 88 | 94 | 96 | 98 | 100 | 100 |
| 3 | 56 | 85 | 92 | 95 | 97 | 98 | 99 | 99 | 99 | 100 | 100 |
| 4 | 55 | 71 | 82 | 87 | 90 | 94 | 95 | 96 | 97 | 98 | 100 |
| 5 | 68 | 81 | 86 | 90 | 93 | 95 | 97 | 98 | 99 | 100 | 100 |
| 6 | 28 | 52 | 79 | 82 | 85 | 90 | 92 | 98 | 99 | 99 | 100 |
| 7 | 18 | 31 | 45 | 48 | 57 | 67 | 84 | 95 | 98 | 98 | 100 |
| Independent Variable | Function | |
|---|---|---|
| 1 | 2 | |
| Mar.—3 w | 0.377 | 1.30 |
| Mar.—4 w | 1.00 | 0.127 |
| Apr.—1 w | −1.12 | 1.20 |
| Apr.—2 w | 1.29 | −2.85 |
| Apr.—3 w | 0.607 | 2.54 |
| Apr.—4 w | −0.396 | −2.00 |
| May | −0.870 | 0.055 |
| June | 0.836 | −0.402 |
| July | −0.374 | 0.333 |
| August | −0.003 | 0.228 |
| Independent Variable | Function | |
|---|---|---|
| 1 | 2 | |
| Mar.—3 w | 0.569 * | 0.433 |
| Mar.—4 w | 0.664 * | 0.010 |
| Apr.—1 w | 0.576 * | −0.260 |
| Apr.—2 w | 0.617 * | −0.314 |
| Apr.—3 w | 0.477 * | −0.208 |
| Apr.—4 w | 0.476 * | −0.171 |
| May | 0.287 | −0.082 |
| June | 0.180 | −0.084 |
| July | 0.067 | 0.014 |
| August | 0.086 | 0.030 |
| Independent Variable | Function | ||
|---|---|---|---|
| 1 | 2 | ||
| Mar.—3 w | X1 | 0.039 | 0.136 |
| Mar.—4 w | X2 | 0.104 | 0.013 |
| Apr.—1 w | X3 | −0.123 | 0.131 |
| Apr.—2 w | X4 | 0.148 | −0.329 |
| Apr.—3 w | X5 | 0.063 | 0.263 |
| Apr.—4 w | X6 | −0.053 | −0.270 |
| May | X7 | −0.144 | 0.009 |
| June | X8 | 0.356 | −0.171 |
| July | X9 | −0.190 | 0.169 |
| August | X10 | −0.001 | 0.119 |
| (Constant) | −14.3 | −1.76 | |
| Cluster | Function | |
|---|---|---|
| 1 | 2 | |
| 1 | 0.336 | −2.33 |
| 2 | −0.367 | 1.58 |
| 3 | 2.39 | −0.412 |
| 4 | 0.702 | −0.346 |
| 5 | 2.41 | 1.78 |
| 6 | −2.15 | −3.27 |
| 7 | −5.74 | 0.824 |
| Cluster | Predicted Group Membership | Total | ||||||||
|---|---|---|---|---|---|---|---|---|---|---|
| 1 | 2 | 3 | 4 | 5 | 6 | 7 | ||||
| Original | Count | 1 | 6 | 0 | 0 | 1 | 0 | 0 | 0 | 7 |
| 2 | 0 | 6 | 0 | 1 | 0 | 0 | 0 | 7 | ||
| 3 | 0 | 0 | 9 | 0 | 1 | 0 | 0 | 10 | ||
| 4 | 1 | 0 | 0 | 9 | 0 | 0 | 0 | 10 | ||
| 5 | 0 | 0 | 0 | 0 | 9 | 0 | 0 | 9 | ||
| 6 | 0 | 0 | 0 | 0 | 0 | 3 | 0 | 3 | ||
| 7 | 0 | 0 | 0 | 0 | 0 | 0 | 8 | 8 | ||
| % | 1 | 85.7 | 0.0 | 0.0 | 14.3 | 0.0 | 0.0 | 0.0 | 100.0 | |
| 2 | 0.0 | 85.7 | 0.0 | 14.3 | 0.0 | 0.0 | 0.0 | 100.0 | ||
| 3 | 0.0 | 0.0 | 90.0 | 0.0 | 10.0 | 0.0 | 0.0 | 100.0 | ||
| 4 | 10.0 | 0.0 | 0.0 | 90.0 | 0.0 | 0.0 | 0.0 | 100.0 | ||
| 5 | 0.0 | 0.0 | 0.0 | 0.0 | 100.0 | 0.0 | 0.0 | 100.0 | ||
| 6 | 0.0 | 0.0 | 0.0 | 0.0 | 0.0 | 100.0 | 0.0 | 100.0 | ||
| 7 | 0.0 | 0.0 | 0.0 | 0.0 | 0.0 | 0.0 | 100.0 | 100.0 | ||
| Cluster | Elevations | ||||
|---|---|---|---|---|---|
| <50 m | 50–100 m | 100–200 m | 200–500 m | >500 m | |
| Pearson Correlation | −0.265 | −0.232 | −0.291 | 0.150 | 0.311 |
| Sig. | 0.053 | 0.091 | 0.033 | 0.279 | 0.022 |
| Cluster | Road Importance | Road Density | Population Density | Measured Seismic Intensities | Road Closure Rate Due to Snow |
|---|---|---|---|---|---|
| Pearson Correlation | 0.417 | −0.416 | −0.190 | −0.637 | 0.729 |
| Sig. | 0.002 | 0.002 | 0.169 | 0.000 | 0.000 |
| Cluster | Elevations | ||||
|---|---|---|---|---|---|
| <50 m | 50–100 m | 100–200 m | 200–500 m | >500 m | |
| Pearson Correlation | −0.370 | 0.129 | 0.222 | 0.402 | 0.204 |
| Sig. | 0.020 | 0.435 | 0.174 | 0.011 | 0.214 |
| Cluster | Road Importance | Road Density | Population Density | Measured Seismic Intensities | Road Closure Rate Due to Snow |
|---|---|---|---|---|---|
| Pearson Correlation | 0.365 | −0.242 | −0.163 | −0.081 | 0.145 |
| Sig. | 0.022 | 0.137 | 0.321 | 0.624 | 0.380 |
Publisher’s Note: MDPI stays neutral with regard to jurisdictional claims in published maps and institutional affiliations. |
© 2022 by the authors. Licensee MDPI, Basel, Switzerland. This article is an open access article distributed under the terms and conditions of the Creative Commons Attribution (CC BY) license (https://creativecommons.org/licenses/by/4.0/).
Share and Cite
Wu, J.; Saito, M.; Endo, N. Cluster Analysis and Discriminant Analysis for Determining Post-Earthquake Road Recovery Patterns. Sensors 2022, 22, 2213. https://doi.org/10.3390/s22062213
Wu J, Saito M, Endo N. Cluster Analysis and Discriminant Analysis for Determining Post-Earthquake Road Recovery Patterns. Sensors. 2022; 22(6):2213. https://doi.org/10.3390/s22062213
Chicago/Turabian StyleWu, Jieling, Mitsugu Saito, and Noriaki Endo. 2022. "Cluster Analysis and Discriminant Analysis for Determining Post-Earthquake Road Recovery Patterns" Sensors 22, no. 6: 2213. https://doi.org/10.3390/s22062213
APA StyleWu, J., Saito, M., & Endo, N. (2022). Cluster Analysis and Discriminant Analysis for Determining Post-Earthquake Road Recovery Patterns. Sensors, 22(6), 2213. https://doi.org/10.3390/s22062213