
Plate Load Tests on an Unsaturated Sand–Kaolin Mixture with Varying Water Table


Abstract
:1. Introduction
2. Test Soil
3. Plate Load Test
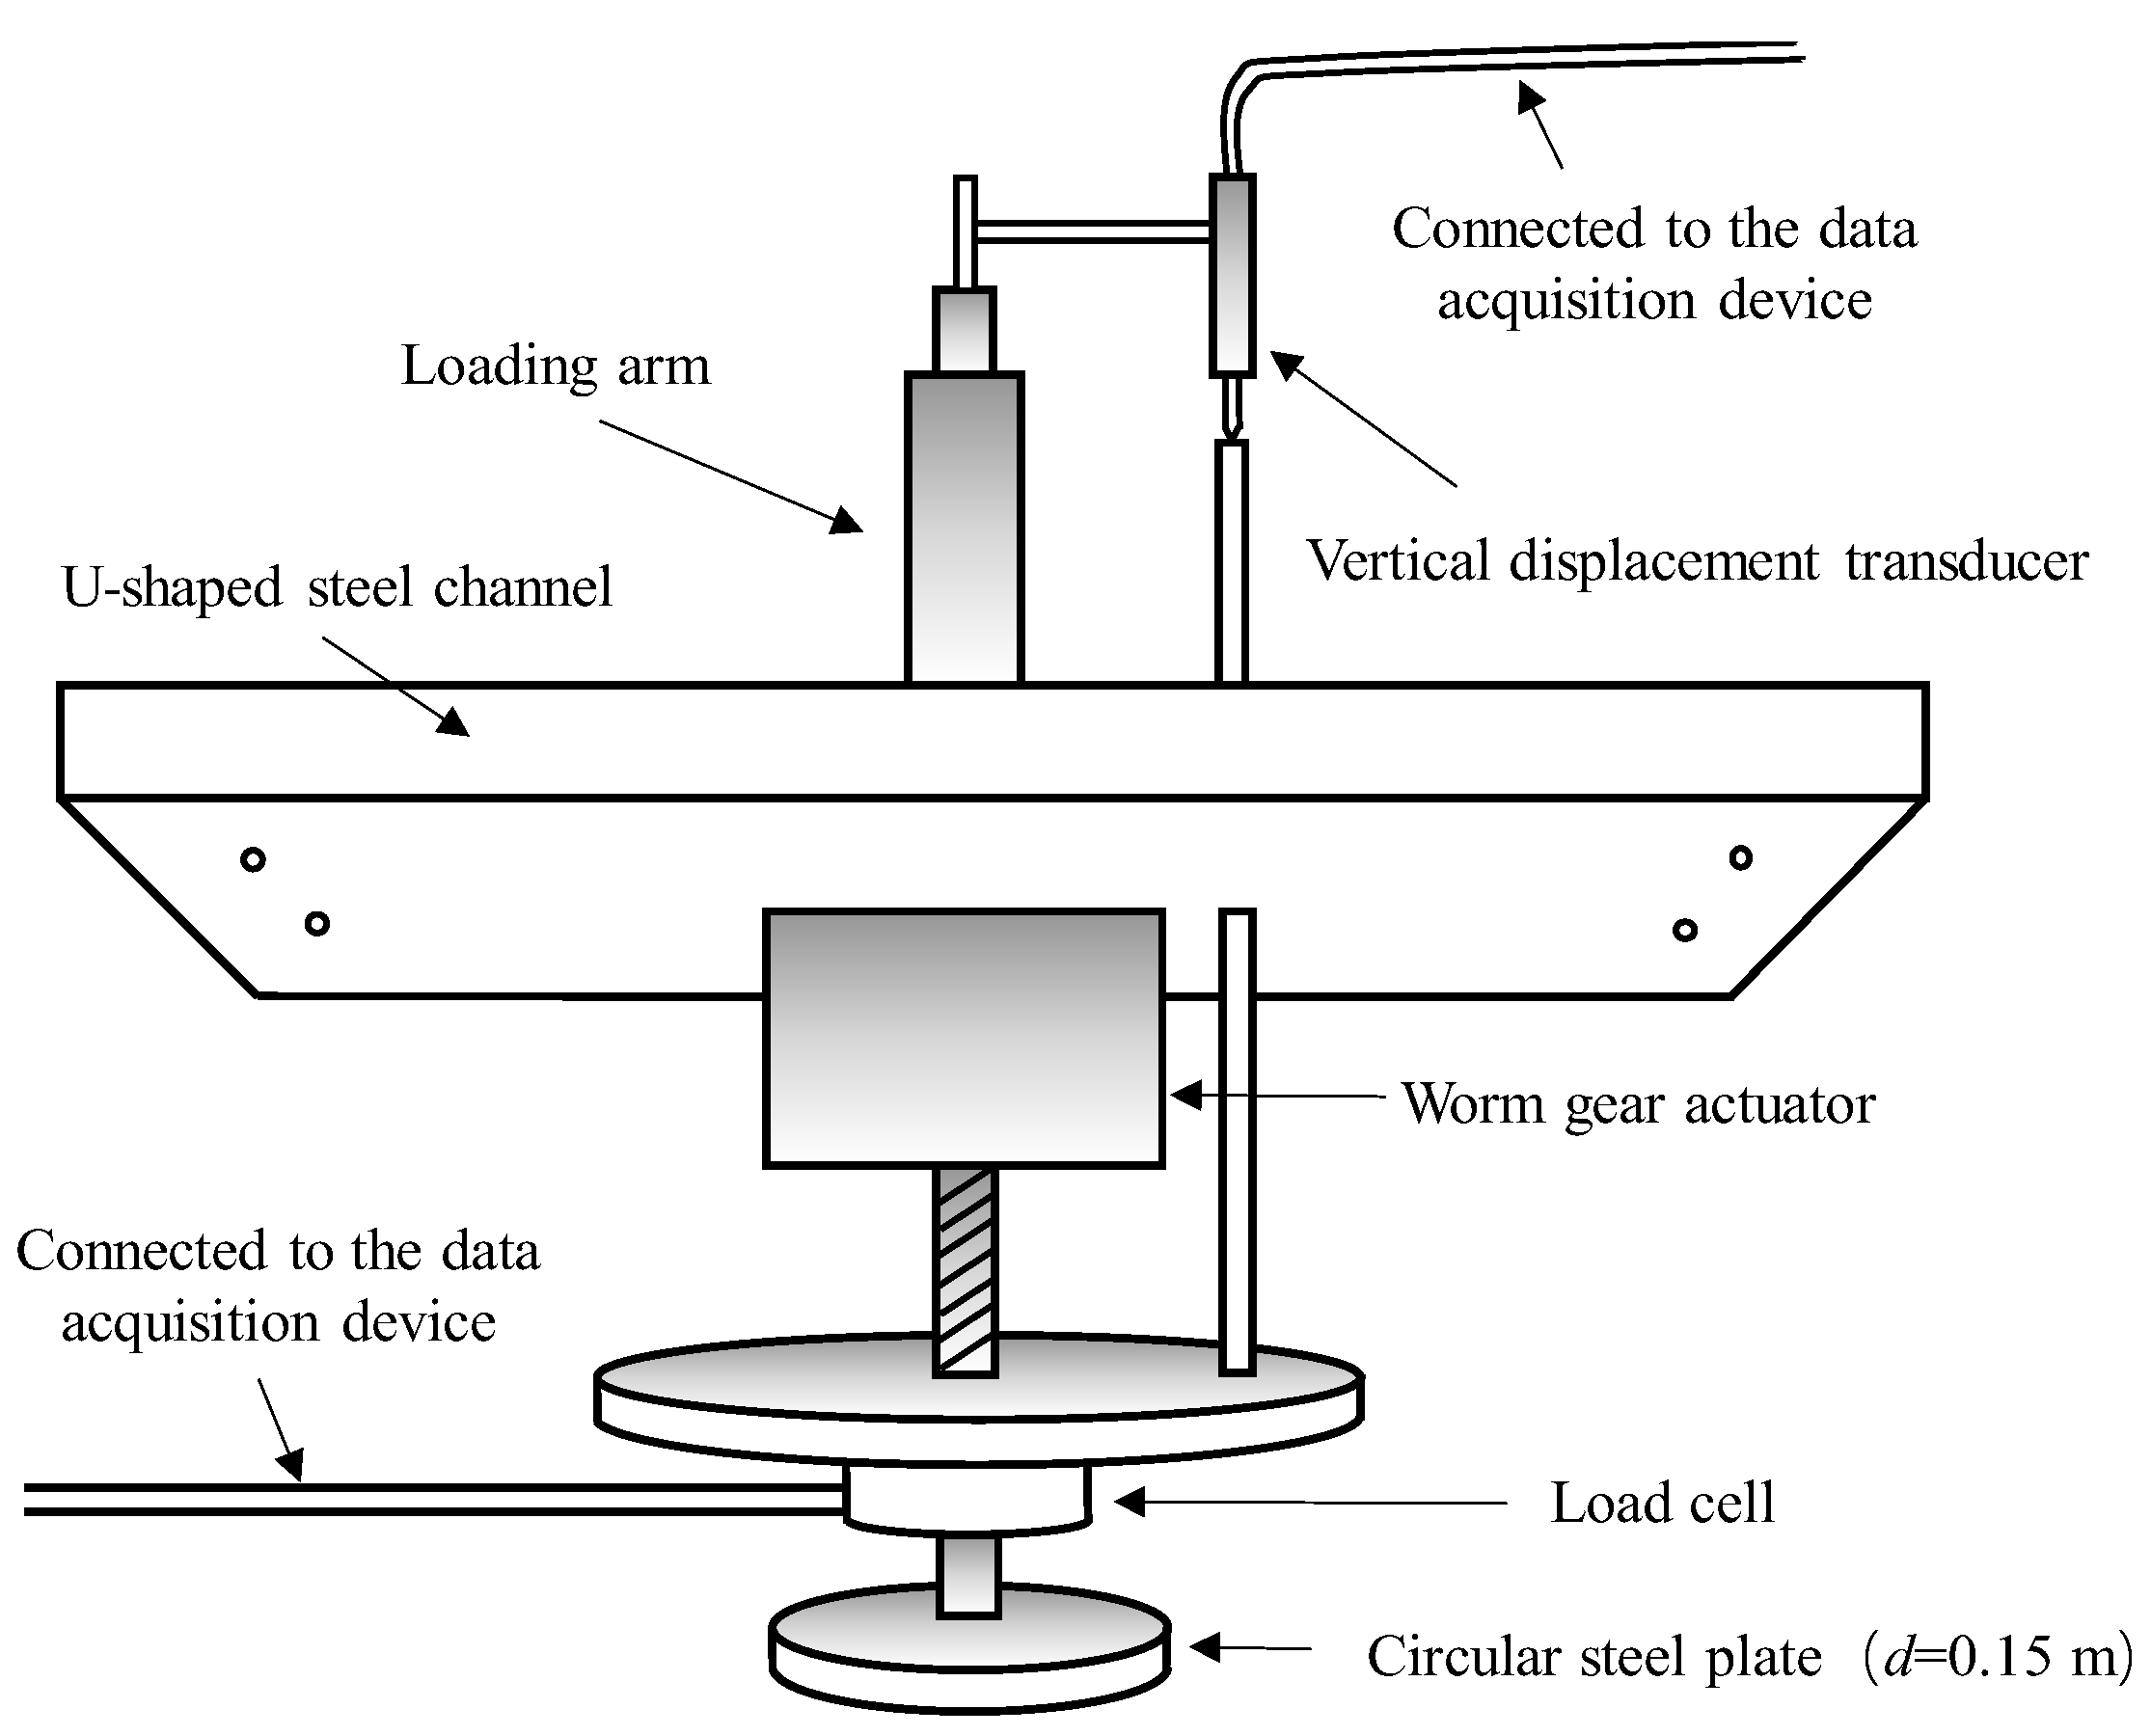
3.1. Test Apparatus
3.2. Sample Preparation
3.3. Test Program
4. Plate Load Test Results
5. Interpretation of PLT Results Considering Influences of Suction and Water Table
5.1. Influence of Suction on the Bearing Capacity
5.2. Effect of Water Table on the Bearing Capacity
5.3. Effect of Hydraulic Loading History on the Bearing Capacity
5.4. Interpretation Using Bearing Capacity Equations
6. Conclusions
Author Contributions
Funding
Conflicts of Interest
References
- Wuttke, F.; Kafle, B.; Lins, Y.; Schanz, T. Macroelement for statically loaded shallow strip foundation resting on unsaturated soil. Int. J. Geomech. 2013, 13, 557–564. [Google Scholar] [CrossRef]
- Oh, W.T.; Vanapalli, S.K. Interpretation of the bearing capacity of unsaturated fine-grained soil using the modified effective and the modified total stress approaches. Int. J. Geomech. 2013, 13, 769–778. [Google Scholar] [CrossRef]
- Tang, Y.; Vo, T.; Taiebat, H.A.; Russell, A.R. Influences of suction on plate load tests on unsaturated silty sands. J. Geotech. Geoenviron. Eng. 2018, 144, 04018043. [Google Scholar] [CrossRef]
- Garakani, A.A.; Sadeghi, H.; Saheb, S.; Lamei, A. Bearing capacity of shallow foundations on unsaturated soils: Analytical approach with 3d numerical simulations and experimental validations. Int. J. Geomech. 2020, 20, 04019181. [Google Scholar] [CrossRef]
- Zhang, C.; Yan, Q.; Zhao, J.; Wang, J. Formulation of ultimate bearing capacity for strip foundations based on the Meyerhof theory and unsaturated soil mechanics. Comput. Geotech. 2020, 126, 103734. [Google Scholar] [CrossRef]
- Costa, Y.D.; Cintra, J.C.; Zornberg, J.G. Influence of matric suction on the results of plate load tests performed on a lateritic soil deposit. Geotech. Test. J. 2003, 26, 219–226. [Google Scholar]
- Xu, Y. Bearing capacity of unsaturated expansive soils. Geotech. Geol. Eng. 2004, 22, 611–625. [Google Scholar] [CrossRef]
- Rojas, J.C.; Salinas, L.M.; Sejas, C. Plate-load tests on an unsaturated lean clay. In Experimental Unsaturated Soil Mechanics; Springer: Berlin/Heidelberg, Germany, 2007; pp. 445–452. [Google Scholar]
- Al-Shayea, N.A. The combined effect of clay and moisture content on the behavior of remolded unsaturated soils. Eng. Geol. 2001, 62, 319–342. [Google Scholar] [CrossRef]
- Konrad, J.M.; Lebeau, M. Capillary-based effective stress formulation for predicting shear strength of unsaturated soils. Can. Geotech. J. 2015, 52, 2067–2076. [Google Scholar] [CrossRef] [Green Version]
- Kasyap, S.S.; Senetakis, K. A micromechanical experimental study of kaolinite-coated sand grains. Tribol. Int. 2018, 126, 206–217. [Google Scholar] [CrossRef]
- Sandeep, C.S.; Senetakis, K. Grain-scale mechanics of quartz sand under normal and tangential loading. Tribol. Int. 2018, 117, 261–271. [Google Scholar] [CrossRef]
- Sandeep, C.S.; Marzulli, V.; Cafaro, F.; Senetakis, K.; Pöschel, T. Micromechanical behavior of DNA-1A lunar regolith simulant in comparison to Ottawa sand. J. Geophys. Res.-Sol. Earth 2019, 124, 8077–8100. [Google Scholar] [CrossRef]
- Vo, T.; Russell, A.R. Bearing capacity of strip footings on unsaturated soils by the slip line theory. Comput. Geotech. 2016, 74, 122–131. [Google Scholar] [CrossRef] [Green Version]
- Vahedifard, F.; Robinson, J.D. Unified method for estimating the ultimate bearing capacity of shallow foundations in variably saturated soils under steady flow. J. Geotech. Geoenviron. Eng. 2016, 142, 04015095. [Google Scholar] [CrossRef]
- ASTM D4253-16; Standard Test Methods for Maximum Index Density and Unit Weight of Soils Using a Vibratory Table. American Society for Testing and Materials: West Conshohocken, PA, USA, 2016.
- ASTM D4254-16; Standard Test Methods for Minimum Index Density and Unit Weight of Soils and Calculation of Relative Density. American Society for Testing and Materials: West Conshohocken, PA, USA, 2016.
- Russell, A.R.; Buzzi, O. A fractal basis for soil-water characteristics curves with hydraulic hysteresis. Géotechnique 2012, 62, 269–274. [Google Scholar] [CrossRef] [Green Version]
- Russell, A.R. How water retention in fractal soils depends on particle and pore sizes, shapes, volumes and surface areas. Géotechnique 2014, 64, 379–390. [Google Scholar] [CrossRef]
- Vaid, Y.P.; Negusey, D. Preparation of reconstituted sand samples. In Advanced Triaxial Testing of Soil and Rock; American Society for Testing and Materials: Philadelphia, PA, USA, 1988; pp. 405–417. [Google Scholar]
- Vo, T.; Taiebat, H.A.; Russell, A.R. Interaction of a rotating rigid retaining wall with an unsaturated soil in experiments. Géotechnique 2016, 66, 366–377. [Google Scholar] [CrossRef]
- Li, X.; Zhang, L.M.; Fredlund, D.G. Wetting front advancing column test for measuring unsaturated hydraulic conductivity. Can. Geotech. J. 2009, 46, 1431–1445. [Google Scholar] [CrossRef]
- Tang, Y.; Taiebat, H.A.; Russell, A.R. Bearing capacity of shallow foundations in unsaturated soil considering hydraulic hysteresis and three drainage conditions. Int. J. Geomech. 2017, 17, 04016142. [Google Scholar] [CrossRef]
- Khalili, N.; Zargarbashi, S. Influence of hydraulic hysteresis on effective stress in unsaturated soils. Géotechnique 2010, 60, 729–734. [Google Scholar] [CrossRef]
- Poulos, H.G.; Davis, E.H. Elastic Solutions for Soil and Rock Mechanics; Wiley: New York, NY, USA, 1974. [Google Scholar]
- Martin, C.M. User Guide for ABC-Analysis of Bearing Capacity; University of Oxford: Oxford, UK, 2014. [Google Scholar]


| Test | Condition | Water Table | Measured qu (kPa) | Calculated qu Using Equation (5) (kPa) |
|---|---|---|---|---|
| SATD | Saturated | Soil surface | 593 | 602 |
| DRY-H | Unsaturated drying | At a height of 240 mm | 1180 | 1218 |
| DRY-L | Unsaturated drying | Soil-gravel interface | 2095 | 1878 |
| SATW | Saturated | Soil surface | 617 | 602 |
| WET-H | Unsaturated wetting | At a height of 240 mm | 879 | 885 |
| WET-L | Unsaturated wetting | Soil-gravel interface | 1103 | 927 |
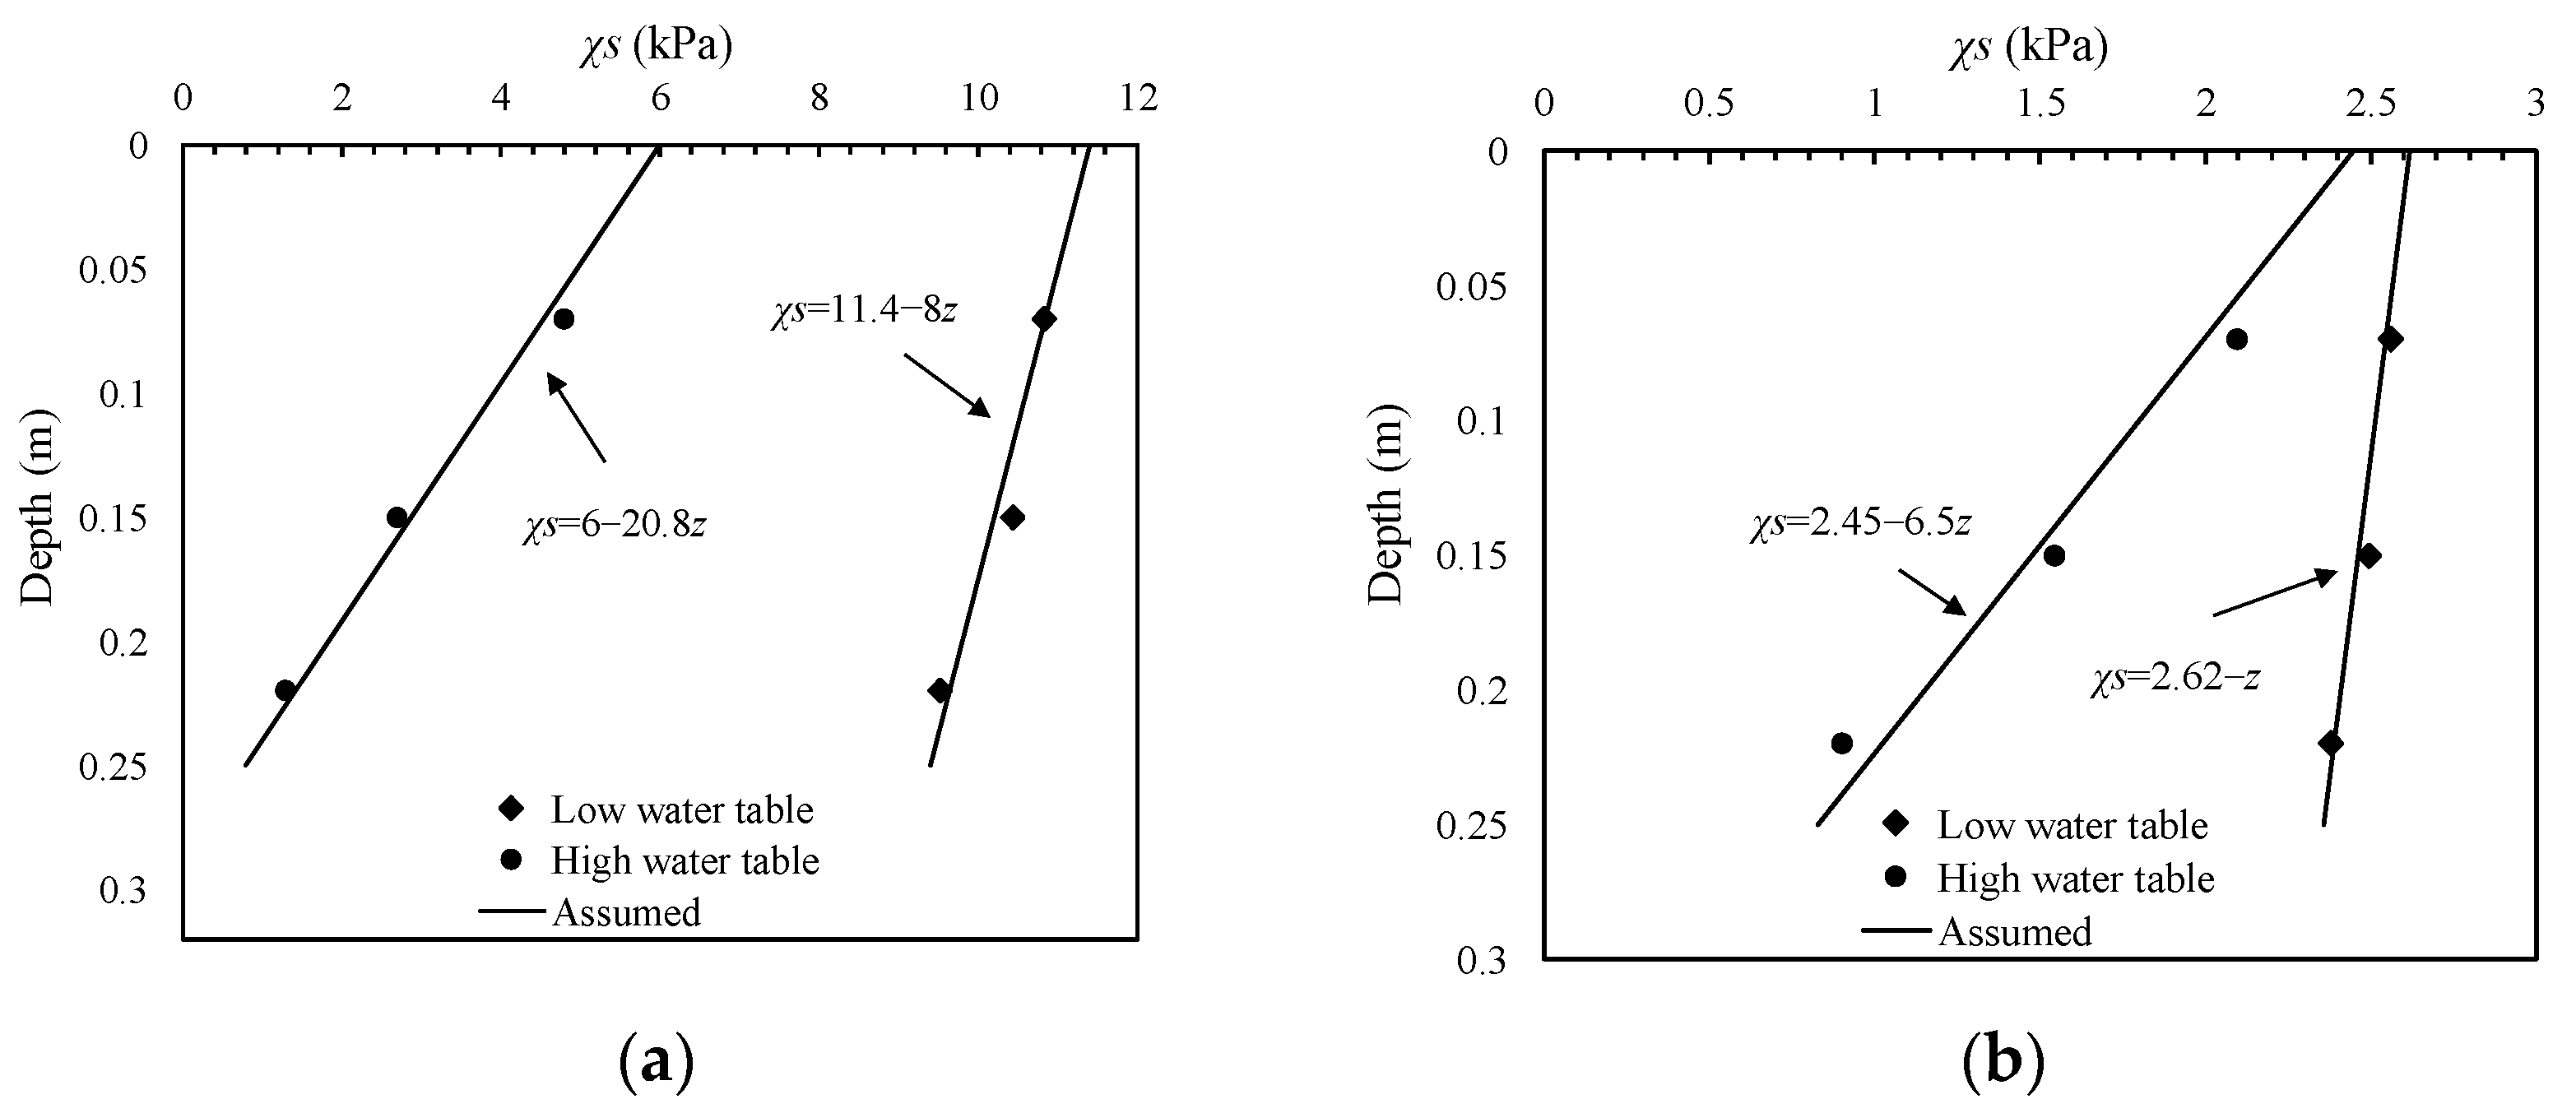
| Test | Depth (m) | Volumetric Water Content | Sr | s (kPa) | Calculated χs (kPa) |
|---|---|---|---|---|---|
| DRY-H | 0.07 | 0.27 | 0.91 | 6.0, 6.1 | 4.78 |
| 0.15 | 0.29 | 0.98 | 3.1 | 2.70 | |
| 0.22 | 0.30 | 1 | 1.3 | 1.29 | |
| DRY-L | 0.07 | 0.21 | 0.71 | 13.4, 13.8 | 10.83 |
| 0.15 | 0.24 | 0.81 | 12.5 | 10.43 | |
| 0.22 | 0.26 | 0.88 | 10.2 | 9.52 | |
| 0.37 | 0.31 | 1 | 2.8 | 2.48 | |
| WET-H | 0.07 | 0.14 | 0.47 | 4.1, 4.2 | 2.10 |
| 0.15 | 0.20 | 0.68 | 2.1 | 1.54 | |
| 0.22 | 0.29 | 0.98 | 0.9 | 0.90 | |
| WET-L | 0.07 | 0.11 | 0.37 | 6.4, 6.6 | 2.56 |
| 0.15 | 0.12 | 0.41 | 6.1 | 2.49 | |
| 0.22 | 0.14 | 0.47 | 5.5 | 2.38 | |
| 0.37 | 0.23 | 0.78 | 1.9 | 1.48 |
Publisher’s Note: MDPI stays neutral with regard to jurisdictional claims in published maps and institutional affiliations. |
© 2022 by the authors. Licensee MDPI, Basel, Switzerland. This article is an open access article distributed under the terms and conditions of the Creative Commons Attribution (CC BY) license (https://creativecommons.org/licenses/by/4.0/).
Share and Cite
Tang, Y.; Chen, C.; Qian, B.; Ren, J.; Guan, Y. Plate Load Tests on an Unsaturated Sand–Kaolin Mixture with Varying Water Table. Sensors 2022, 22, 2161. https://doi.org/10.3390/s22062161
Tang Y, Chen C, Qian B, Ren J, Guan Y. Plate Load Tests on an Unsaturated Sand–Kaolin Mixture with Varying Water Table. Sensors. 2022; 22(6):2161. https://doi.org/10.3390/s22062161
Chicago/Turabian StyleTang, Yi, Chenghao Chen, Bin Qian, Jie Ren, and Yunfei Guan. 2022. "Plate Load Tests on an Unsaturated Sand–Kaolin Mixture with Varying Water Table" Sensors 22, no. 6: 2161. https://doi.org/10.3390/s22062161
APA StyleTang, Y., Chen, C., Qian, B., Ren, J., & Guan, Y. (2022). Plate Load Tests on an Unsaturated Sand–Kaolin Mixture with Varying Water Table. Sensors, 22(6), 2161. https://doi.org/10.3390/s22062161