
Statistical Analysis and Kinematic Assessment of Upper Limb Reaching Task in Parkinson’s Disease

 ,
,  ,
,  ,
, 
 and
and 
Abstract
1. Introduction
2. Materials and Methods
2.1. Kinematic Task and Acquisition
2.2. Preprocessing
2.3. Segmentation
2.4. Kinematic Parameters Estimation
- amplitude: representing the rotation amplitude of the executed submovement, i.e., the angular distance (expressed in degrees as measured through goniometric sensors) travelled by the arm during the execution of a submovement;
- duration: obtained from the difference between the end and start point of the submovement (expressed in seconds);
- mean velocity (v_mean): obtained as the ratio between the amplitude and the duration of the submovement (expressed in degrees per second);
- maximum velocity (v_max): maximum value of the velocity within the submovement (expressed in degrees per second);
- maximum acceleration (a_max): maximum value of the acceleration within the submovement (expressed in degrees per squared second);
- maximum jerk (jerk_max): maximum value of the jerk within the submovement (expressed in degrees per cubic second);
2.5. Statistical Analysis
3. Results
3.1. Signal Processing
3.2. Statistical Analysis and Classification
3.3. Kinematic Parameter Selection
4. Discussion
Future Perspectives of the Study
5. Conclusions
Supplementary Materials
Author Contributions
Funding
Institutional Review Board Statement
Informed Consent Statement
Data Availability Statement
Conflicts of Interest
References
- Farina, E.; Borgnis, F.; Pozzo, T. Mirror Neurons and Their Relationship with Neurodegenerative Disorders. J. Neurosci. Res. 2020, 98, 1070–1094. [Google Scholar] [CrossRef] [PubMed]
- Ruiz-González, D.; Hernández-Martínez, A.; Valenzuela, P.L.; Morales, J.S.; Soriano-Maldonado, A. Effects of Physical Exercise on Plasma Brain-Derived Neurotrophic Factor in Neurodegenerative Disorders: A Systematic Review and Meta-Analysis of Randomized Controlled Trials. Neurosci. Biobehav. Rev. 2021, 128, 394–405. [Google Scholar] [CrossRef] [PubMed]
- Farì, G.; Lunetti, P.; Pignatelli, G.; Raele, M.V.; Cera, A.; Mintrone, G.; Ranieri, M.; Megna, M.; Capobianco, L. The Effect of Physical Exercise on Cognitive Impairment in Neurodegenerative Disease: From Pathophysiology to Clinical and Rehabilitative Aspects. Int. J. Mol. Sci. 2021, 22, 11632. [Google Scholar] [CrossRef] [PubMed]
- Marques-Aleixo, I.; Beleza, J.; Sampaio, A.; Stevanović, J.; Coxito, P.; Gonçalves, I.; Ascensão, A.; Magalhães, J. Preventive and Therapeutic Potential of Physical Exercise in Neurodegenerative Diseases. Antioxid. Redox Signal. 2021, 34, 674–693. [Google Scholar] [CrossRef]
- Adlakha, S.; Chhabra, D.; Shukla, P. Effectiveness of Gamification for the Rehabilitation of Neurodegenerative Disorders. Chaos Solitons Fractals 2020, 140, 110192. [Google Scholar] [CrossRef]
- Nadeau, A.; Lungu, O.; Boré, A.; Plamondon, R.; Duchesne, C.; Robillard, M.-È.; Bobeuf, F.; Lafontaine, A.-L.; Gheysen, F.; Bherer, L.; et al. A 12-Week Cycling Training Regimen Improves Upper Limb Functions in People With Parkinson’s Disease. Front. Hum. Neurosci. 2018, 12, 351. [Google Scholar] [CrossRef]
- Proud, E.L.; Miller, K.J.; Bilney, B.; Balachandran, S.; McGinley, J.L.; Morris, M.E. Evaluation of Measures of Upper Limb Functioning and Disability in People With Parkinson Disease: A Systematic Review. Arch. Phys. Med. Rehabil. 2015, 96, 540–551.e1. [Google Scholar] [CrossRef]
- Lee, K.-S.; Lee, W.-H.; Hwang, S. Modified Constraint-Induced Movement Therapy Improves Fine and Gross Motor Performance of the Upper Limb in Parkinson Disease. Am. J. Phys. Med. Rehabil. 2011, 90, 380–386. [Google Scholar] [CrossRef]
- Nodehi, Z.; Behzadipour, S.; Azad, A.; Soltanzadeh, A.; Taghizadeh, G. The Correlation Between Reach and Grasp Kinematic Measures and Clinical Measures of Manual Dexterity in Patients With Parkinson Disease. Funct. Disabil. J. 2020, 3, 27–34. [Google Scholar] [CrossRef]
- Ferraris, C.; Nerino, R.; Chimienti, A.; Pettiti, G.; Cau, N.; Cimolin, V.; Azzaro, C.; Albani, G.; Priano, L.; Mauro, A. A Self-Managed System for Automated Assessment of UPDRS Upper Limb Tasks in Parkinson’s Disease. Sensors 2018, 18, 3523. [Google Scholar] [CrossRef]
- Bai, L. Time-Frequency Analysis of Upper Limb Motion Based on Inertial Sensors. In Proceedings of the 2021 32nd Irish Signals and Systems Conference (ISSC), Athlone, Ireland, 10–11 June 2021; pp. 1–6. [Google Scholar]
- Abend, W.; Bizzi, E.; Morasso, P. Human Arm Trajectory Formation. Brain J. Neurol. 1982, 105, 331–348. [Google Scholar] [CrossRef]
- Morasso, P. Spatial Control of Arm Movements. Exp. Brain Res. 1981, 42, 223–227. [Google Scholar] [CrossRef]
- Soechting, J.F.; Lacquaniti, F. Invariant Characteristics of a Pointing Movement in Man. J. Neurosci. Off. J. Soc. Neurosci. 1981, 1, 710–720. [Google Scholar] [CrossRef]
- Hogan, N. An Organizing Principle for a Class of Voluntary Movements. J. Neurosci. Off. J. Soc. Neurosci. 1984, 4, 2745–2754. [Google Scholar] [CrossRef]
- Iuppariello, L.; D’Addio, G.; Lanzillo, B.; Balbi, P.; Andreozzi, E.; Improta, G.; Faiella, G.; Cesarelli, M. A Novel Approach to Estimate the Upper Limb Reaching Movement in Three-Dimensional Space. Inform. Med. Unlocked 2019, 15. [Google Scholar] [CrossRef]
- Ricciardi, C.; Amboni, M.; De Santis, C.; Ricciardelli, G.; Improta, G.; D’Addio, G.; Cuoco, S.; Picillo, M.; Barone, P.; Cesarelli, M. Machine Learning Can Detect the Presence of Mild Cognitive Impairment in Patients Affected by Parkinson’s Disease. In Proceedings of the 2020 IEEE International Symposium on Medical Measurements and Applications (MeMeA), Bari, Italy, 1 June–1 July 2020; pp. 1–6. [Google Scholar]
- Iuppariello, L.; Bifulco, P.; Romano, M.; Cesarelli, M.; D’Addio, G. Submovements Composition and Quality Assessment of Reaching Movements in Subjects with Parkinson’s Disease. In Proceedings of the 2015 IEEE International Symposium on Medical Measurements and Applications (MeMeA) Proceedings, Turin, Italy, 7–9 May 2015; pp. 329–334. [Google Scholar]
- Broderick, P.; Horgan, F.; Blake, C.; Ehrensberger, M.; Simpson, D.; Monaghan, K. Mirror Therapy for Improving Lower Limb Motor Function and Mobility after Stroke: A Systematic Review and Meta-Analysis. Gait Posture 2018, 63, 208–220. [Google Scholar] [CrossRef]
- D’Addio, G.; Donisi, L.; Pagano, G.; Improta, G.; Biancardi, A.; Cesarelli, M. Agreement between Opal and G-Walk Wearable Inertial Systems in Gait Analysis on Normal and Pathological Subjects. In Proceedings of the 2019 41st Annual International Conference of the IEEE Engineering in Medicine and Biology Society (EMBC), Berlin, Germany, 23–27 July 2019; pp. 3286–3289. [Google Scholar]
- Labruyère, R.; van Hedel, H.J.A. Strength Training versus Robot-Assisted Gait Training after Incomplete Spinal Cord Injury: A Randomized Pilot Study in Patients Depending on Walking Assistance. J. Neuroeng. Rehabil. 2014, 11, 4. [Google Scholar] [CrossRef]
- Ricciardi, C.; Amboni, M.; De Santis, C.; Improta, G.; Volpe, G.; Iuppariello, L.; Ricciardelli, G.; D’Addio, G.; Vitale, C.; Barone, P.; et al. Using Gait Analysis’ Parameters to Classify Parkinsonism: A Data Mining Approach. Comput. Methods Programs Biomed. 2019, 180, 105033. [Google Scholar] [CrossRef]
- Volpini, M.; Bartenbach, V.; Pinotti, M.; Riener, R. Clinical Evaluation of a Low-Cost Robot for Use in Physiotherapy and Gait Training. J. Rehabil. Assist. Technol. Eng. 2017, 4, 2055668316688410. [Google Scholar] [CrossRef]
- D’Addio, G.; Iuppariello, L.; Romano, M.; Lullo, F.; Pappone, N.; Cesarelli, M. Kinematic Indexes’ Reproducibility of Horizontal Reaching Movements. In Proceedings of the XIII Mediterranean Conference on Medical and Biological Engineering and Computing 2013, Seville, Spain, 25–28 September 2013; Roa Romero, L.M., Ed.; Springer International Publishing: Cham, Switzerland, 2014; pp. 81–84. [Google Scholar]
- D’Addio, G.; Lullo, F.; Pappone, N.; Romano, M.; Iuppariello, L.; Cesarelli, M.; Bifulco, P. Relationships of Kinematics Indexes with Amplitude and Velocity of Upper Arm Reaching Movement. In Proceedings of the 2013 IEEE International Symposium on Medical Measurements and Applications (MeMeA), Gatineau, QC, Canada, 4–5 May 2013; pp. 120–123. [Google Scholar]
- Basteris, A.; Nijenhuis, S.M.; Stienen, A.H.; Buurke, J.H.; Prange, G.B.; Amirabdollahian, F. Training Modalities in Robot-Mediated Upper Limb Rehabilitation in Stroke: A Framework for Classification Based on a Systematic Review. J. Neuroeng. Rehabil. 2014, 11, 111. [Google Scholar] [CrossRef]
- Ang, K.K.; Guan, C.; Chua, K.S.G.; Ang, B.T.; Kuah, C.; Wang, C.; Phua, K.S.; Chin, Z.Y.; Zhang, H. A Clinical Study of Motor Imagery-Based Brain-Computer Interface for Upper Limb Robotic Rehabilitation. In Proceedings of the 2009 Annual International Conference of the IEEE Engineering in Medicine and Biology Society, Minneapolis, MN, USA, 3–6 September 2009; pp. 5981–5984. [Google Scholar]
- Lewandowski, B.; Wudarczyk, S.; Sperzyński, P.; Bałchanowski, J. Prediction of Motion Intentions as a Novel Method of Upper Limb Rehabilitation Support. Sensors 2021, 21, 410. [Google Scholar] [CrossRef]
- Ai, Q.; Liu, Z.; Meng, W.; Liu, Q.; Xie, S.Q. Machine Learning in Robot Assisted Upper Limb Rehabilitation: A Focused Review. IEEE Trans. Cogn. Dev. Syst. 2021, 1. [Google Scholar] [CrossRef]
- Metcalf, A.G.; Gallagher, J.F.; Jackson, A.E.; Levesley, M.C. Multi-Domain Dynamic Modelling of a Low-Cost Upper Limb Rehabilitation Robot. Robotics 2021, 10, 134. [Google Scholar] [CrossRef]
- Zhao, Y.; Liang, C.; Gu, Z.; Zheng, Y.; Wu, Q. A New Design Scheme for Intelligent Upper Limb Rehabilitation Training Robot. Int. J. Environ. Res. Public. Health 2020, 17, 2948. [Google Scholar] [CrossRef]
- Donisi, L.; Pagano, G.; Cesarelli, G.; Coccia, A.; Amitrano, F.; D’Addio, G. Benchmarking between Two Wearable Inertial Systems for Gait Analysis Based on a Different Sensor Placement Using Several Statistical Approaches. Measurement 2021, 173, 108642. [Google Scholar] [CrossRef]
- Ricciardi, C.; Jónsson, H.; Jacob, D.; Improta, G.; Recenti, M.; Gíslason, M.K.; Cesarelli, G.; Esposito, L.; Minutolo, V.; Bifulco, P.; et al. Improving Prosthetic Selection and Predicting BMD from Biometric Measurements in Patients Receiving Total Hip Arthroplasty. Diagnostics 2020, 10, 815. [Google Scholar] [CrossRef]
- Cesarelli, M.; Romano, M.; D’Addio, G.; De Nunzio, A.M.; Pappone, N. Kinematics Patterns of Upper Arm Reaching Movement in Robot-Mediated Therapy. In Proceedings of the 2011 IEEE International Symposium on Medical Measurements and Applications, Bari, Italy, 30–31 May 2011; pp. 465–468. [Google Scholar]
- D’Addio, G.; Cesarelli, M.; Romano, M.; Faiella, G.; Lullo, F.; Pappone, N. Kinematic and EMG Patterns Evaluation of Upper Arm Reaching Movements. In Proceedings of the 2012 4th IEEE RAS EMBS International Conference on Biomedical Robotics and Biomechatronics (BioRob), Rome, Italy, 24–27 June 2012; pp. 1383–1387. [Google Scholar]
- Tacchino, G.; Gandolla, M.; Coelli, S.; Barbieri, R.; Pedrocchi, A.; Bianchi, A.M. EEG Analysis During Active and Assisted Repetitive Movements: Evidence for Differences in Neural Engagement. IEEE Trans. Neural Syst. Rehabil. Eng. 2017, 25, 761–771. [Google Scholar] [CrossRef]
- Carpinella, I.; Cattaneo, D.; Ferrarin, M. Quantitative Assessment of Upper Limb Motor Function in Multiple Sclerosis Using an Instrumented Action Research Arm Test. J. Neuroeng. Rehabil. 2014, 11, 67. [Google Scholar] [CrossRef]
- Bradberry, T.J.; Gentili, R.J.; Contreras-Vidal, J.L. Reconstructing Three-Dimensional Hand Movements from Noninvasive Electroencephalographic Signals. J. Neurosci. 2010, 30, 3432–3437. [Google Scholar] [CrossRef]
- Villatoro, F.R.; Ramos, J.I. On the Method of Modified Equations. III. Numerical Techniques Based on the Second Equivalent Equation for the Euler Forward Difference Method. Appl. Math. Comput. 1999, 103, 179–212. [Google Scholar] [CrossRef]
- Iuppariello, L.; Romano, M.; D’Addio, G.; Bifulco, P.; Pappone, N.; Cesarelli, M. Comparison of Measured and Predicted Reaching Movements with a Robotic Rehabilitation Device. In Proceedings of the 2014 IEEE International Symposium on Medical Measurements and Applications (MeMeA), Lisboa, Portugal, 11–12 June 2014; pp. 1–6. [Google Scholar]
- Cesarelli, M.; Iuppariello, L.; Romano, M.; Bifulco, P.; D’Addio, G. Bioengineering Activities in Proprioceptive and Robotic Rehabilitation at Salvatore Maugeri Foundation. In Proceedings of the 2015 AEIT International Annual Conference (AEIT), Naples, Italy, 14–16 October 2015; pp. 1–3. [Google Scholar]
- Mishra, P.; Pandey, C.M.; Singh, U.; Gupta, A.; Sahu, C.; Keshri, A. Descriptive Statistics and Normality Tests for Statistical Data. Ann. Card. Anaesth. 2019, 22, 67–72. [Google Scholar] [CrossRef] [PubMed]
- Hasmann, S.E.; Berg, D.; Hobert, M.A.; Weiss, D.; Lindemann, U.; Streffer, J.; Liepelt-Scarfone, I.; Maetzler, W. Instrumented Functional Reach Test Differentiates Individuals at High Risk for Parkinson’s Disease from Controls. Front. Aging Neurosci. 2014, 6, 286. [Google Scholar] [CrossRef] [PubMed]
- Parma, V.; Zanatto, D.; Straulino, E.; Scaravilli, T.; Castiello, U. Kinematics of the Reach-to-Grasp Movement in Vascular Parkinsonism: A Comparison with Idiopathic Parkinson’s Disease Patients. Front. Neurol. 2014, 5, 75. [Google Scholar] [CrossRef] [PubMed][Green Version]
- Hu, Z.; Xu, S.; Hao, M.; Xiao, Q.; Lan, N. The Impact of Evoked Cutaneous Afferents on Voluntary Reaching Movement in Patients with Parkinson’s Disease. J. Neural Eng. 2019, 16, 036029. [Google Scholar] [CrossRef]
- Hu, Z.; Hao, M.; Xu, S.; Xiao, Q.; Lan, N. Evaluation of Tremor Interference with Control of Voluntary Reaching Movements in Patients with Parkinson’s Disease. J. Neuroeng. Rehabil. 2019, 16, 38. [Google Scholar] [CrossRef]
- Simo, L.S.; Piovesan, D.; Laczko, J.; Ghez, C.; Scheidt, R.S. Submovements during Reaching Movements after Stroke. In Proceedings of the 2014 36th Annual International Conference of the IEEE Engineering in Medicine and Biology Society, Chicago, IL, USA, 26–30 August 2014; pp. 5357–5360. [Google Scholar] [CrossRef]
- Bateman, A.; Culpan, F.J.; Pickering, A.D.; Powell, J.H.; Scott, O.M.; Greenwood, R.J. The Effect of Aerobic Training on Rehabilitation Outcomes after Recent Severe Brain Injury: A Randomized Controlled Evaluation. Arch. Phys. Med. Rehabil. 2001, 82, 174–182. [Google Scholar] [CrossRef]
- Kelly, J.O.; Kilbreath, S.L.; Davis, G.M.; Zeman, B.; Raymond, J. Cardiorespiratory Fitness and Walking Ability in Subacute Stroke Patients11No Commercial Party Having a Direct Financial Interest in the Results of the Research Supporting This Article Has or Will Confer a Benefit upon the Author(s) or upon Any Organization with Which the Author(s) Is/Are Associated. Arch. Phys. Med. Rehabil. 2003, 84, 1780–1785. [Google Scholar] [CrossRef]
- Petajan, J.H.; Gappmaier, E.; White, A.T.; Spencer, M.K.; Mino, L.; Hicks, R.W. Impact of Aerobic Training on Fitness and Quality of Life in Multiple Sclerosis. Ann. Neurol. 1996, 39, 432–441. [Google Scholar] [CrossRef]
- Garber, C.E.; Friedman, J.H. Effects of Fatigue on Physical Activity and Function in Patients with Parkinson’s Disease. Neurology 2003, 60, 1119–1124. [Google Scholar] [CrossRef]


| ID | Task | Sub-Movement | Description |
|---|---|---|---|
| 1 | horizontal reaching task | middle to outer right | Extension of the right (left) shoulder from the middle position to the outer right (left) position on the horizontal plane |
| 2 | horizontal reaching task | outer right to middle | Flexion of the right (left) shoulder from outer right (left) position to middle position on the horizontal plane |
| 3 | vertical reaching task | middle to top | Elevation from the middle position upwards on the sagittal plane |
| 4 | vertical reaching task | top to middle | Lowering from the top to the middle position on the sagittal plane |
| 5 | horizontal reaching task | middle to outer left | Flexion of the right (left) shoulder from the middle position to the outer left (right) position on the horizontal plane |
| 6 | horizontal reaching task | outer left to middle | Extension of the right (left) shoulder from outer left (right) position to middle position on the horizontal plane |
| 7 | vertical reaching task | middle to bottom | Lowering from the middle position downwards on the sagittal plane |
| 8 | vertical reaching task | bottom to middle | Elevation from the bottom to the middle position on the sagittal plane |
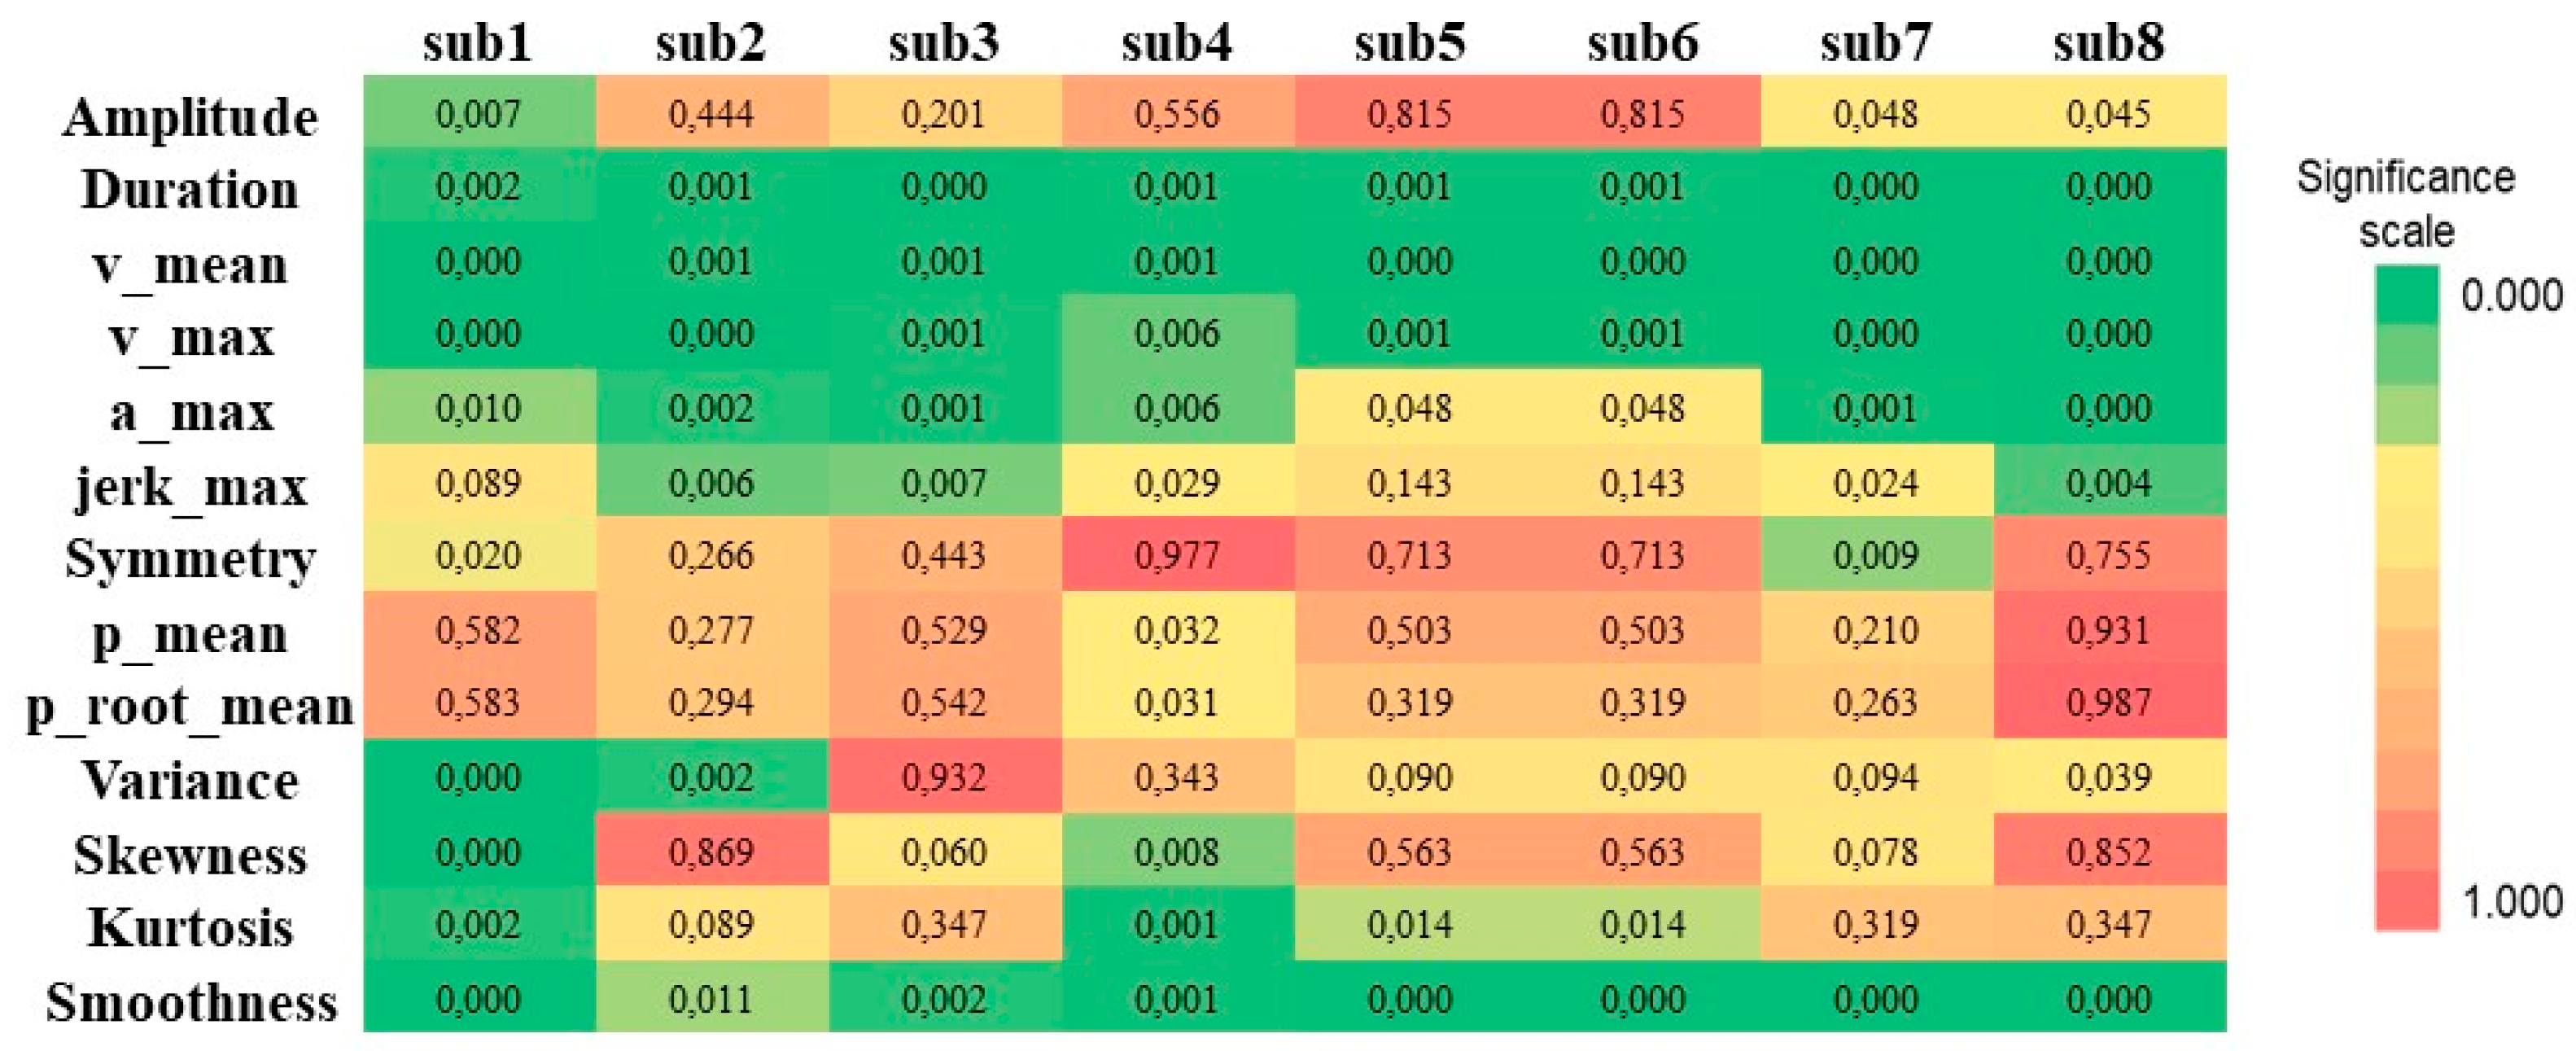
| Submovement 1 Kinematic Parameters | Class | Descriptive Statistics | Mann-Whitney (*) or t (**) Test | |||
|---|---|---|---|---|---|---|
| Mean | Standard Deviation | Median | Interquartile Range | p-Value § | ||
| amplitude | Healthy | 29.25 | 1.815 | 29.00 | 2.750 | 0.007 * |
| Parkinson | 27.08 | 2.644 | 27.00 | 3.000 | ||
| duration | Healthy | 1.519 | 0.151 | 1.486 | 0.220 | 0.002 ** |
| Parkinson | 3.296 | 1.510 | 2.745 | 2.740 | ||
| v_mean | Healthy | 19.50 | 2.276 | 20.00 | 3.750 | 0.000 ** |
| Parkinson | 10.00 | 3.814 | 10.00 | 7.250 | ||
| v_max | Healthy | 35.72 | 5.066 | 36.85 | 7.040 | 0.000 ** |
| Parkinson | 22.65 | 7.609 | 21.43 | 14.340 | ||
| a_max | Healthy | 99.34 | 20.90 | 107.0 | 36.310 | 0.010 * |
| Parkinson | 67.65 | 27.07 | 61.24 | 45.630 | ||
| jerk_max | Healthy | 454.70 | 126.7 | 488.6 | 233.120 | 0.089 ** |
| Parkinson | 349.20 | 162.0 | 317.3 | 204.390 | ||
| symmetry | Healthy | −1.276 | 0.061 | −1.290 | 0.100 | 0.020 ** |
| Parkinson | −1.374 | 0.120 | −1.382 | 0.150 | ||
| p_mean | Healthy | 106.80 | 1.922 | 106.7 | 3.060 | 0.582 ** |
| Parkinson | 107.20 | 1.847 | 107.3 | 1.970 | ||
| p_root_mean | Healthy | 11,411.2 | 411.8 | 11,379.4 | 652.210 | 0.583 ** |
| Parkinson | 11,502.9 | 394.6 | 11,520.2 | 422.530 | ||
| variance | Healthy | 112.4 | 13.66 | 114.2 | 17.440 | 0.000 * |
| Parkinson | 78.64 | 15.97 | 82.97 | 18.780 | ||
| skewness | Healthy | −0.167 | 0.255 | −0.207 | 0.430 | 0.000 ** |
| Parkinson | 0.457 | 0.397 | 0.436 | 0.560 | ||
| kurtosis | Healthy | 1.695 | 0.161 | 1.700 | 0.240 | 0.002 ** |
| Parkinson | 2.337 | 0.545 | 2.251 | 0.460 | ||
| smoothness | Healthy | 34.23 | 0.543 | 33.95 | 1.020 | 0.000 * |
| Parkinson | 37.31 | 1.741 | 36.69 | 3.010 | ||
Publisher’s Note: MDPI stays neutral with regard to jurisdictional claims in published maps and institutional affiliations. |
© 2022 by the authors. Licensee MDPI, Basel, Switzerland. This article is an open access article distributed under the terms and conditions of the Creative Commons Attribution (CC BY) license (https://creativecommons.org/licenses/by/4.0/).
Share and Cite
Ponsiglione, A.M.; Ricciardi, C.; Amato, F.; Cesarelli, M.; Cesarelli, G.; D’Addio, G. Statistical Analysis and Kinematic Assessment of Upper Limb Reaching Task in Parkinson’s Disease. Sensors 2022, 22, 1708. https://doi.org/10.3390/s22051708
Ponsiglione AM, Ricciardi C, Amato F, Cesarelli M, Cesarelli G, D’Addio G. Statistical Analysis and Kinematic Assessment of Upper Limb Reaching Task in Parkinson’s Disease. Sensors. 2022; 22(5):1708. https://doi.org/10.3390/s22051708
Chicago/Turabian StylePonsiglione, Alfonso Maria, Carlo Ricciardi, Francesco Amato, Mario Cesarelli, Giuseppe Cesarelli, and Giovanni D’Addio. 2022. "Statistical Analysis and Kinematic Assessment of Upper Limb Reaching Task in Parkinson’s Disease" Sensors 22, no. 5: 1708. https://doi.org/10.3390/s22051708
APA StylePonsiglione, A. M., Ricciardi, C., Amato, F., Cesarelli, M., Cesarelli, G., & D’Addio, G. (2022). Statistical Analysis and Kinematic Assessment of Upper Limb Reaching Task in Parkinson’s Disease. Sensors, 22(5), 1708. https://doi.org/10.3390/s22051708