
HeadSLAM: Pedestrian SLAM with Head-Mounted Sensors


Abstract
:1. Introduction
2. Methods
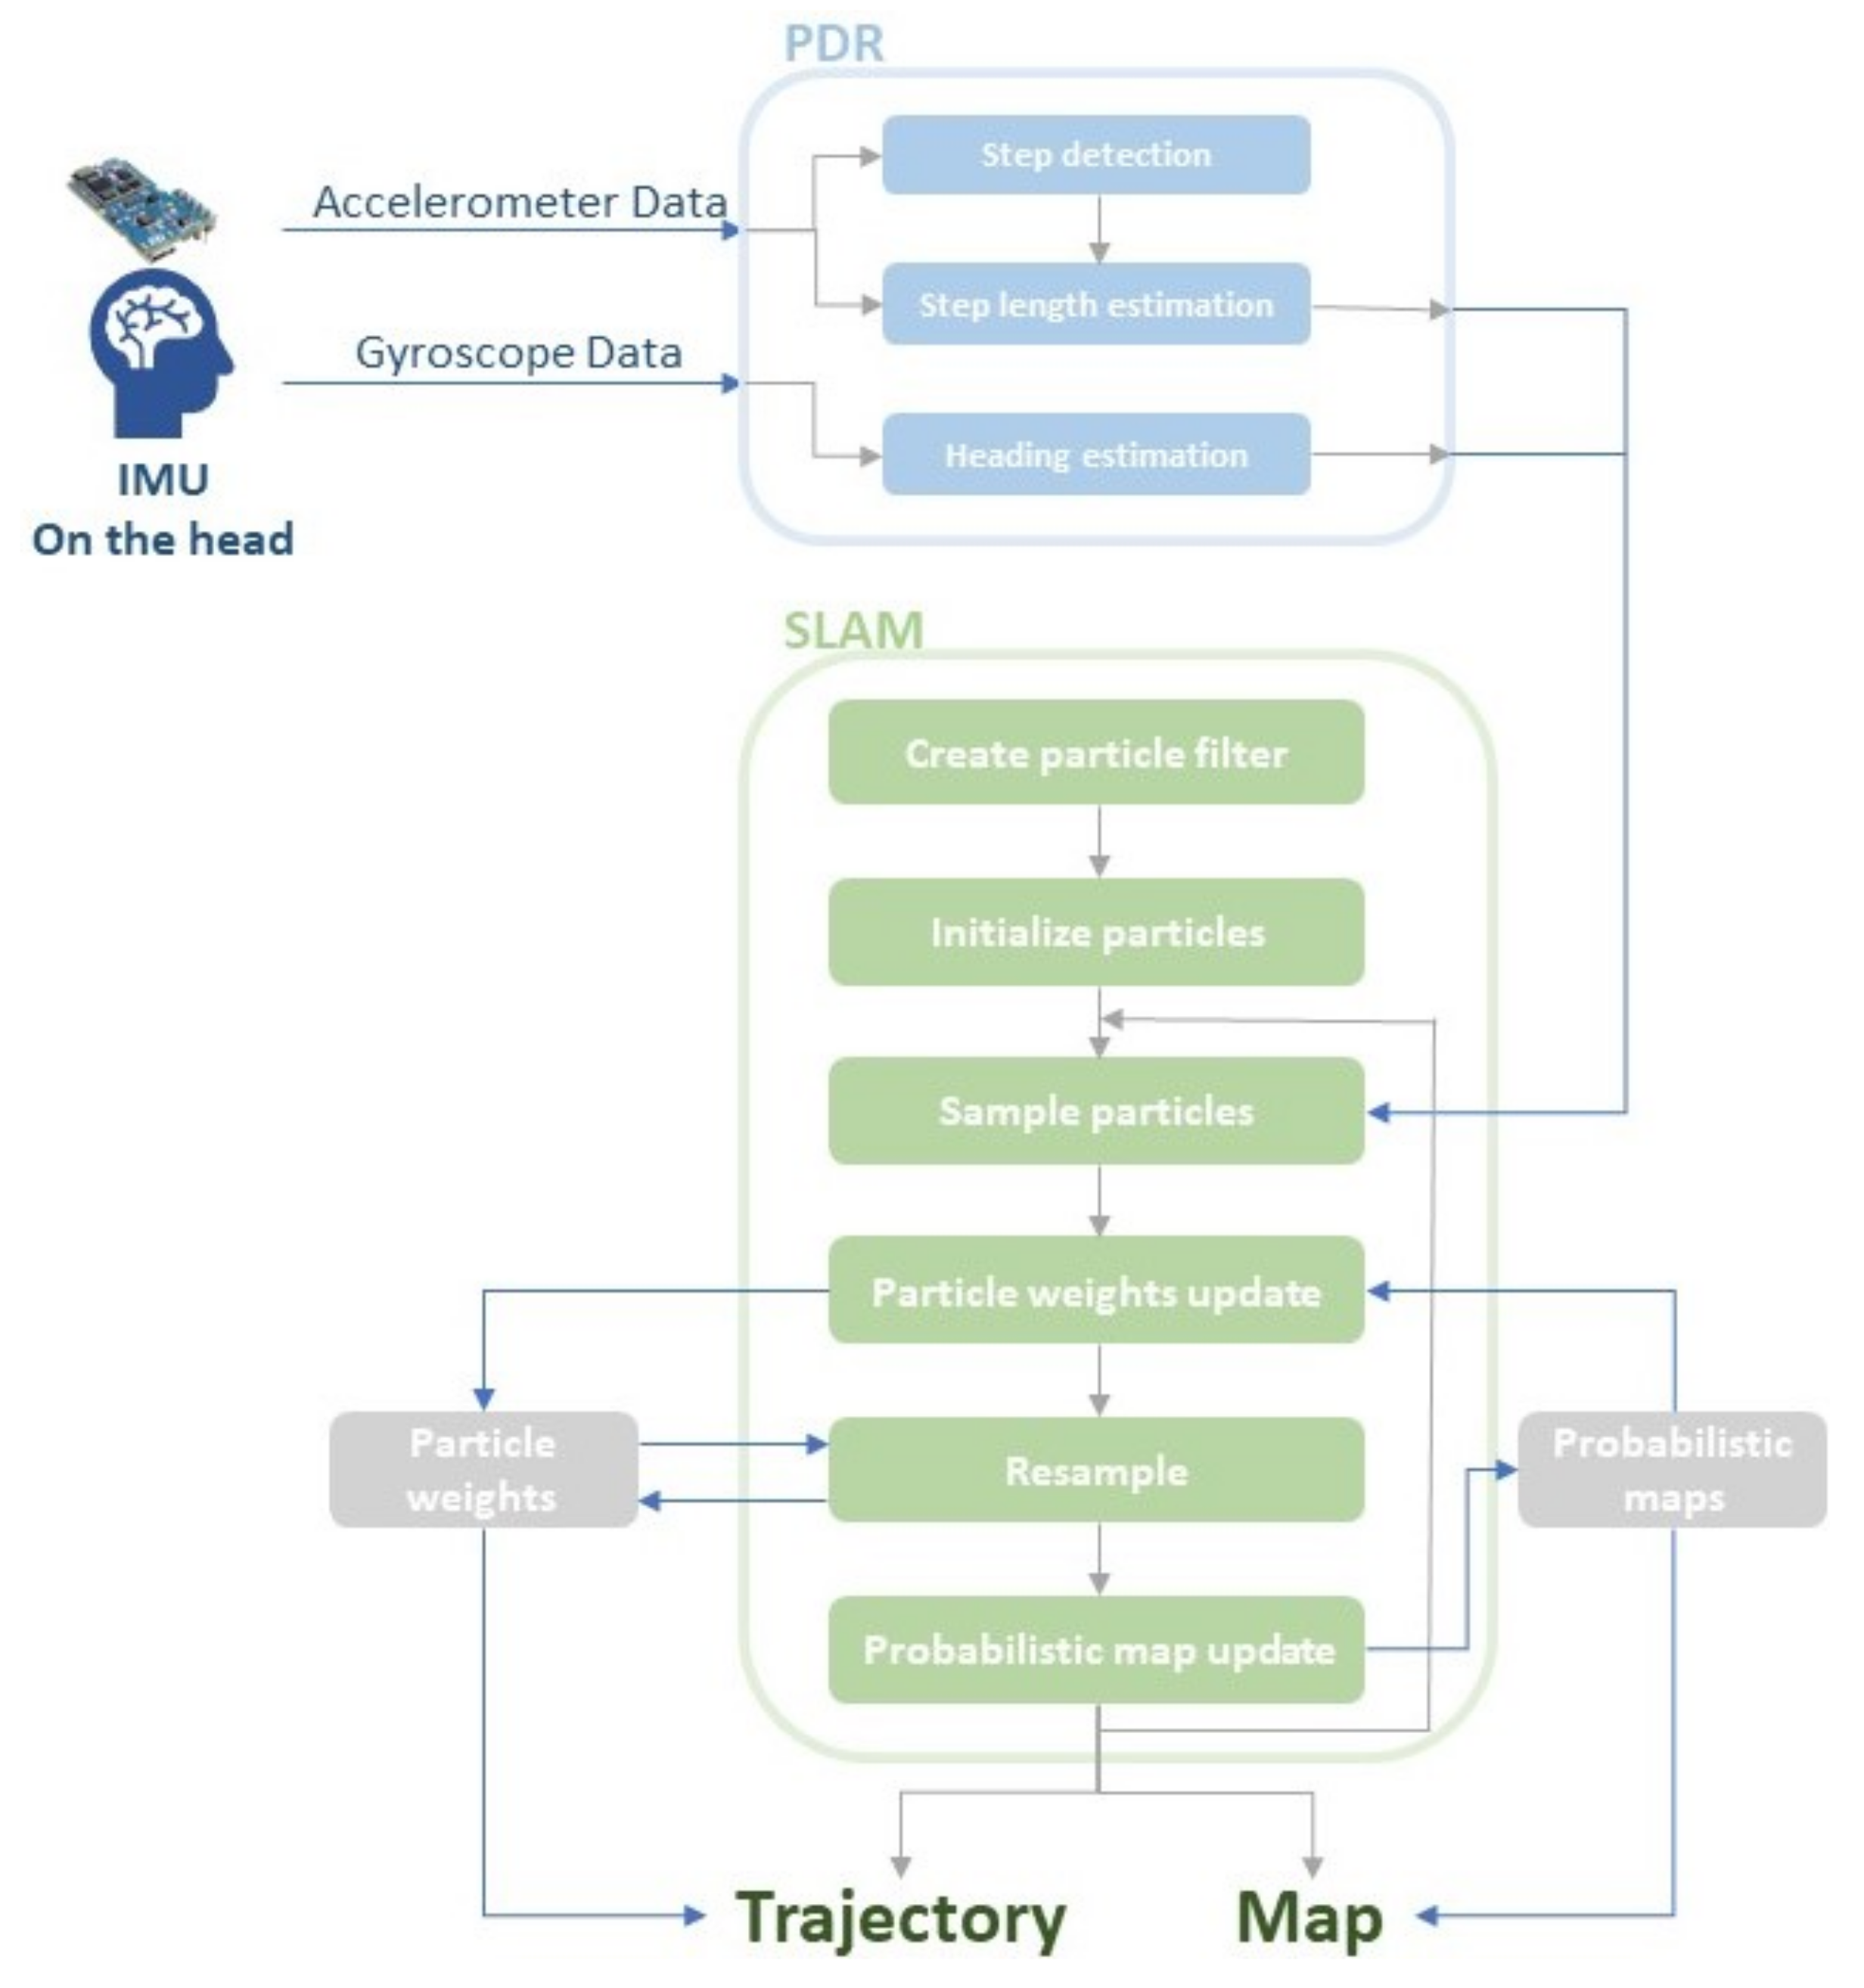
2.1. PDR
2.1.1. Step Detection
2.1.2. Step Length Estimation
2.1.3. Heading Estimation
2.2. HeadSLAM
3. Experimental Conditions
3.1. Data Collection Site
3.2. Participants
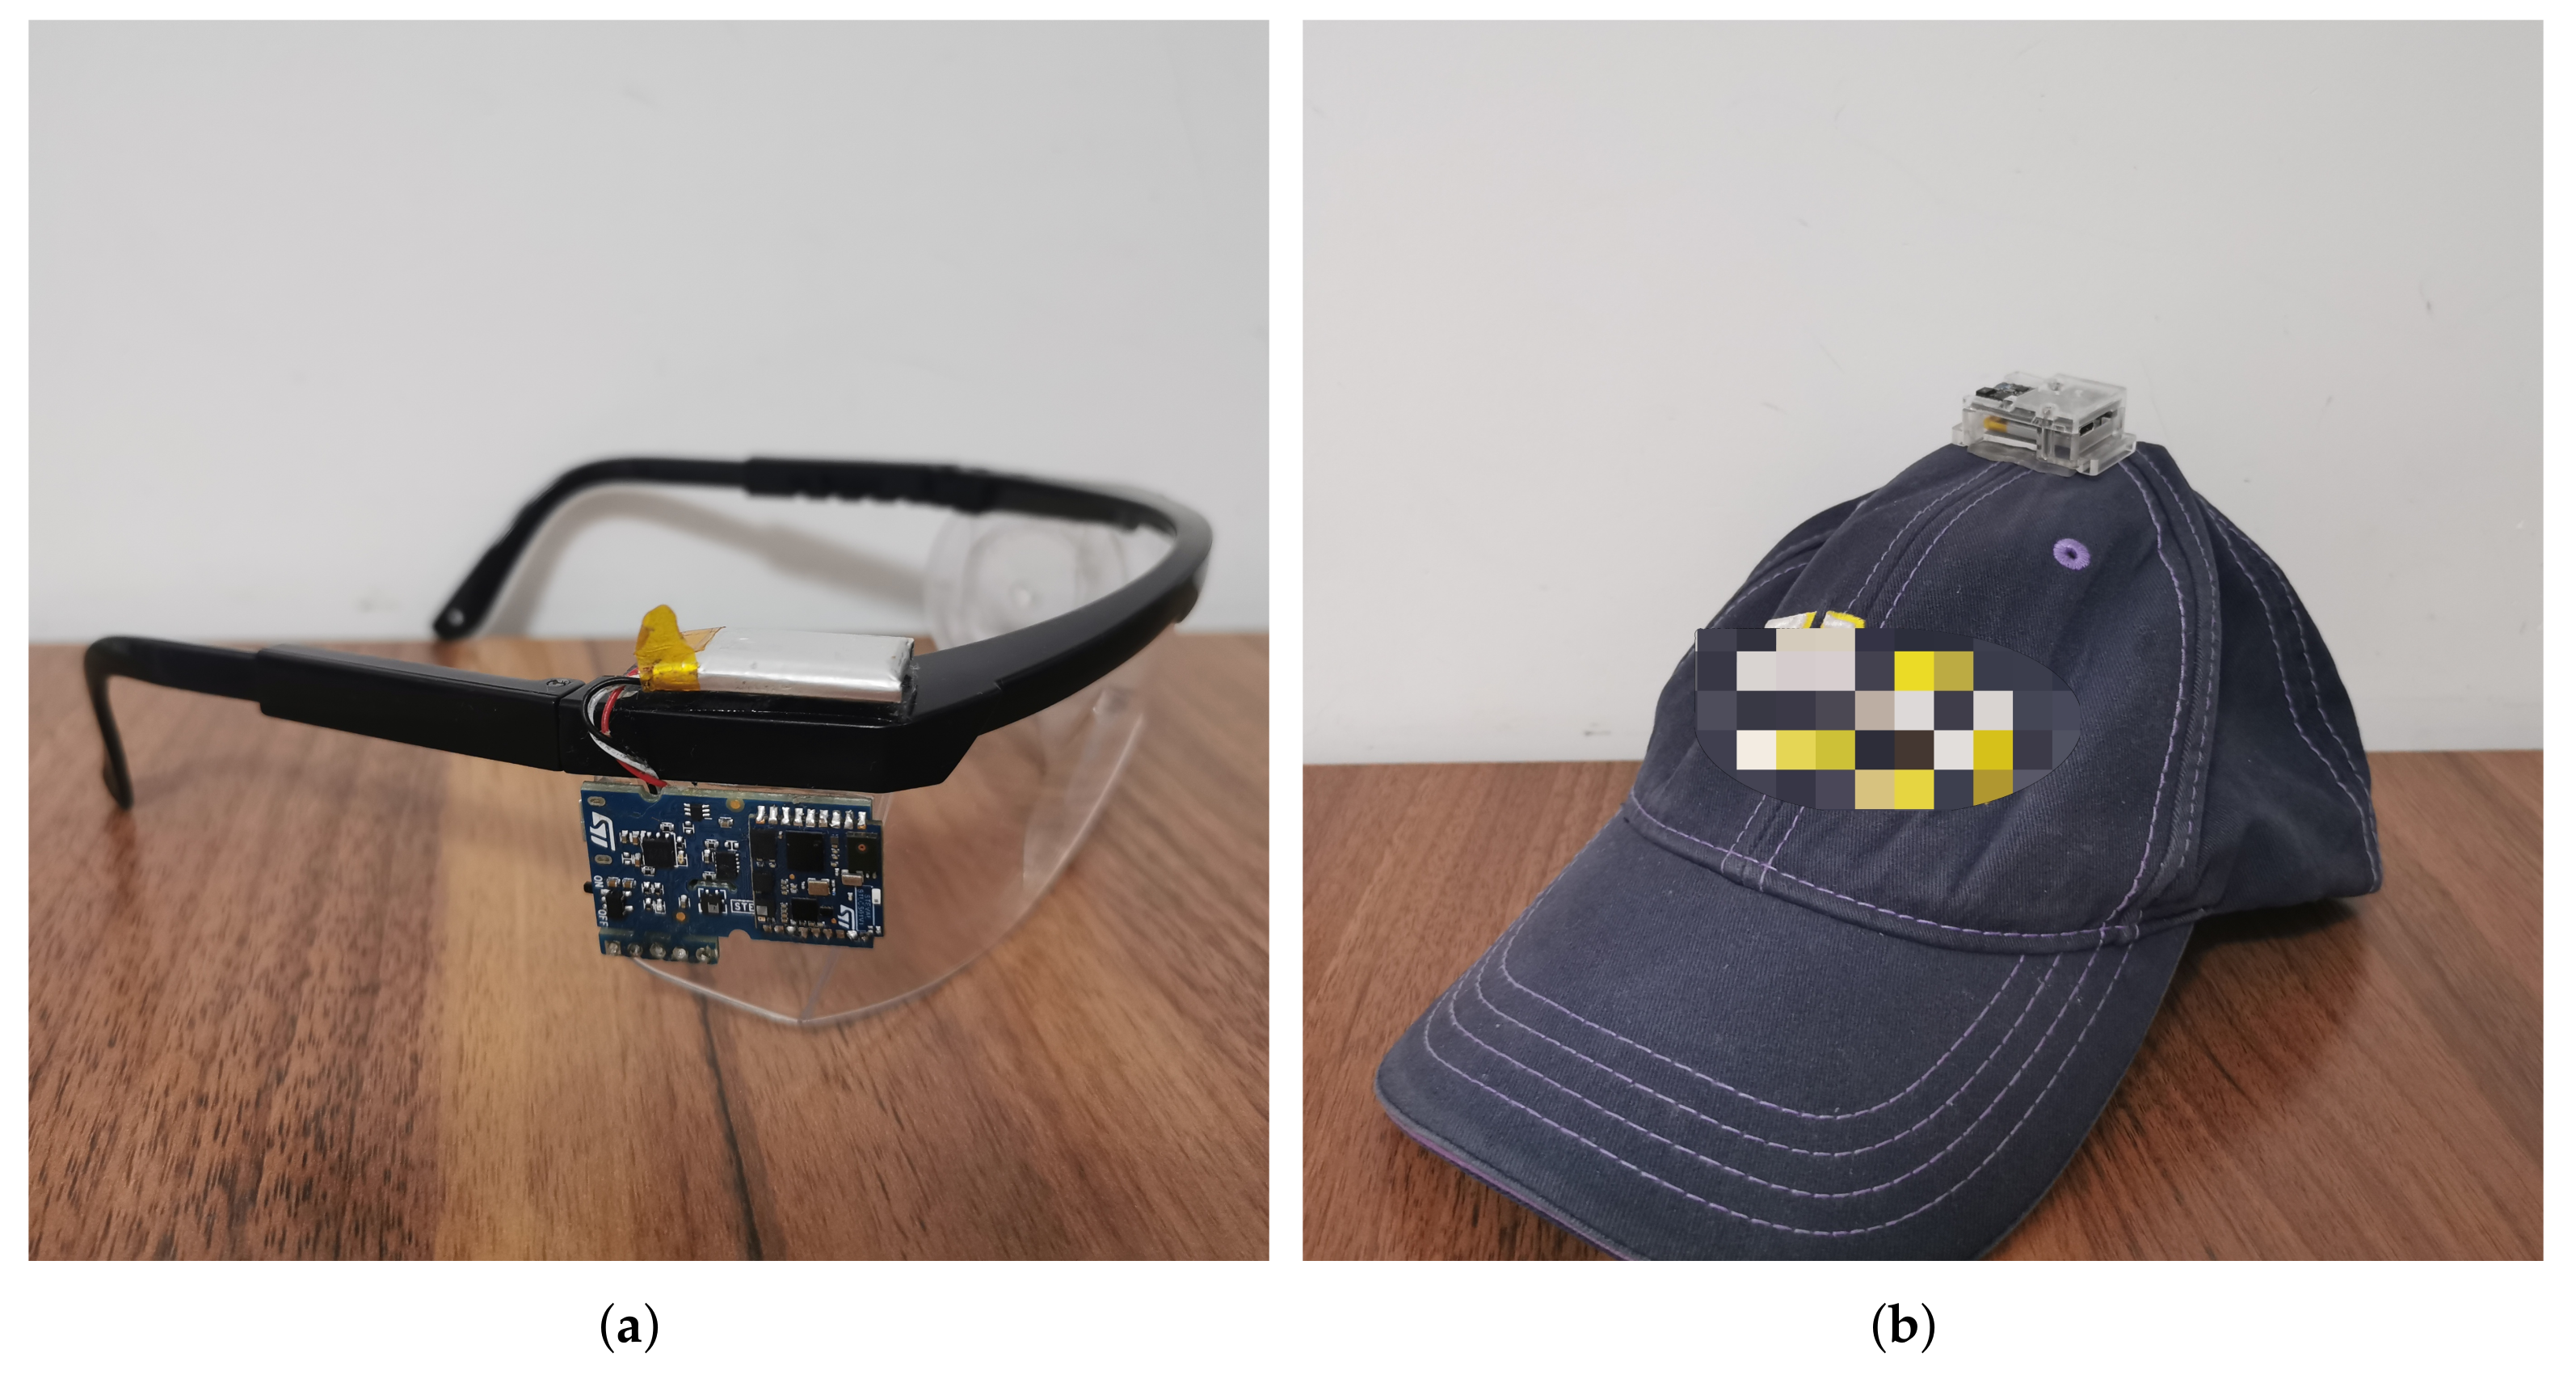
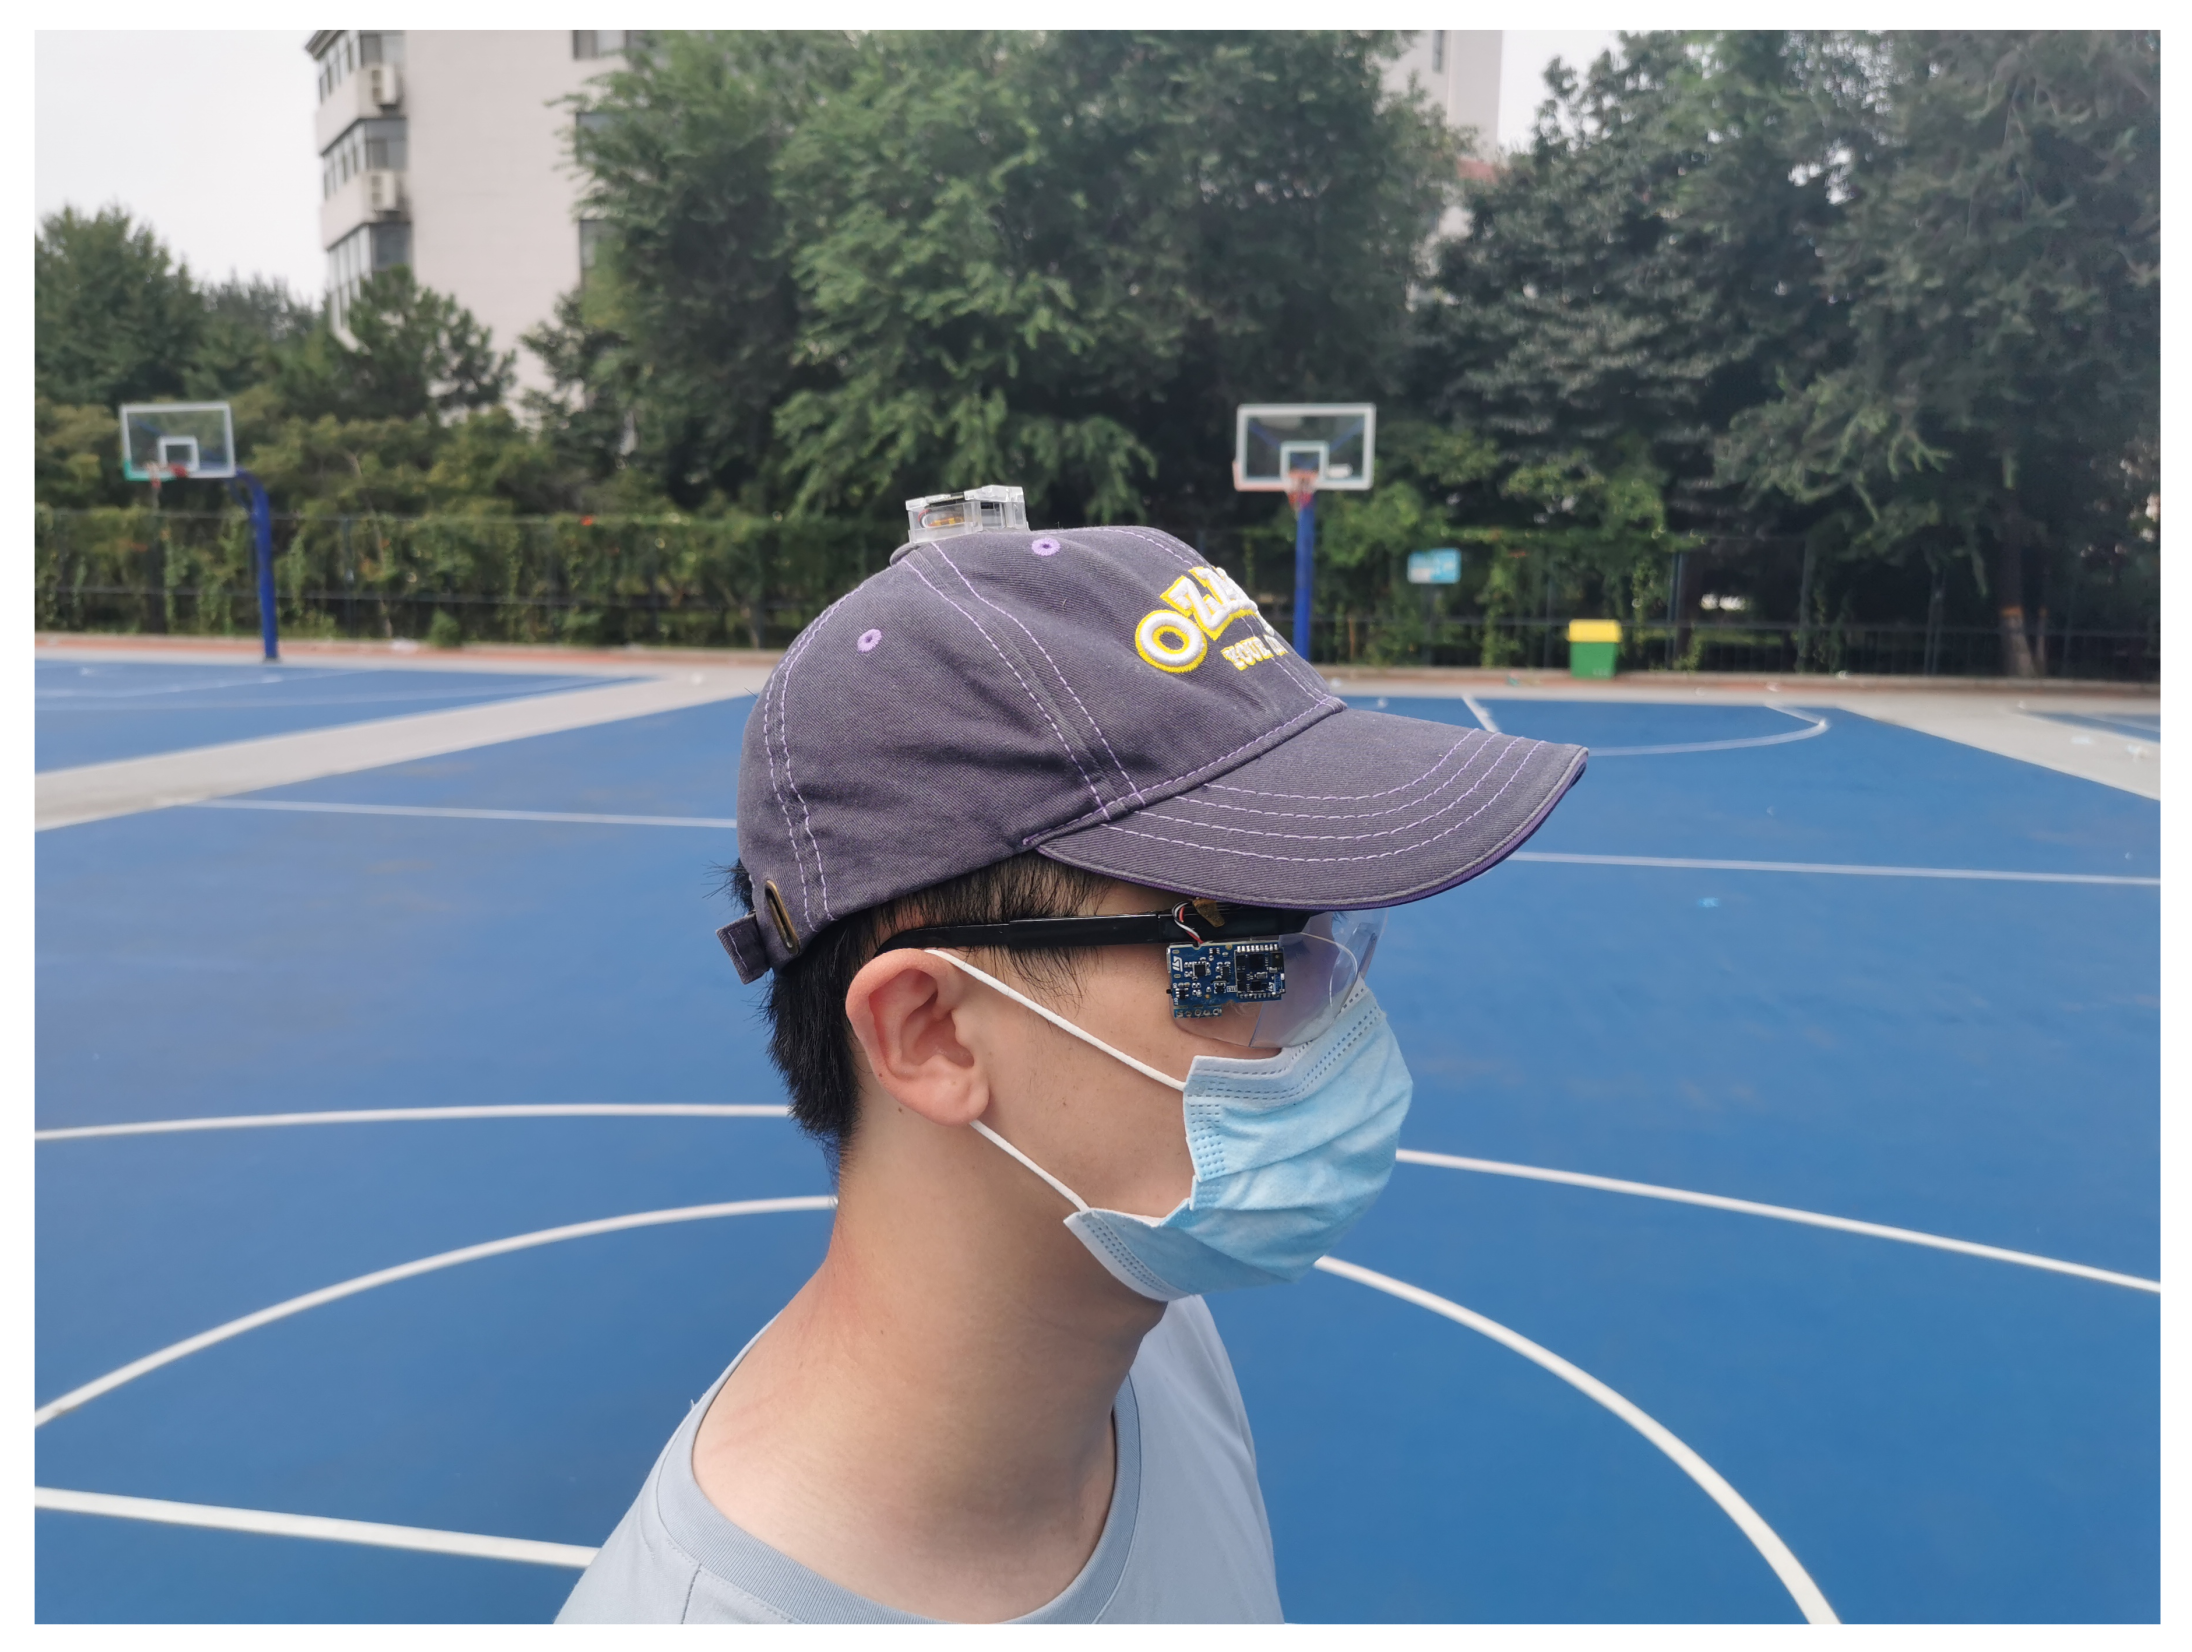
3.3. Devices
3.4. Experimental Setup
3.5. Statistical Analysis
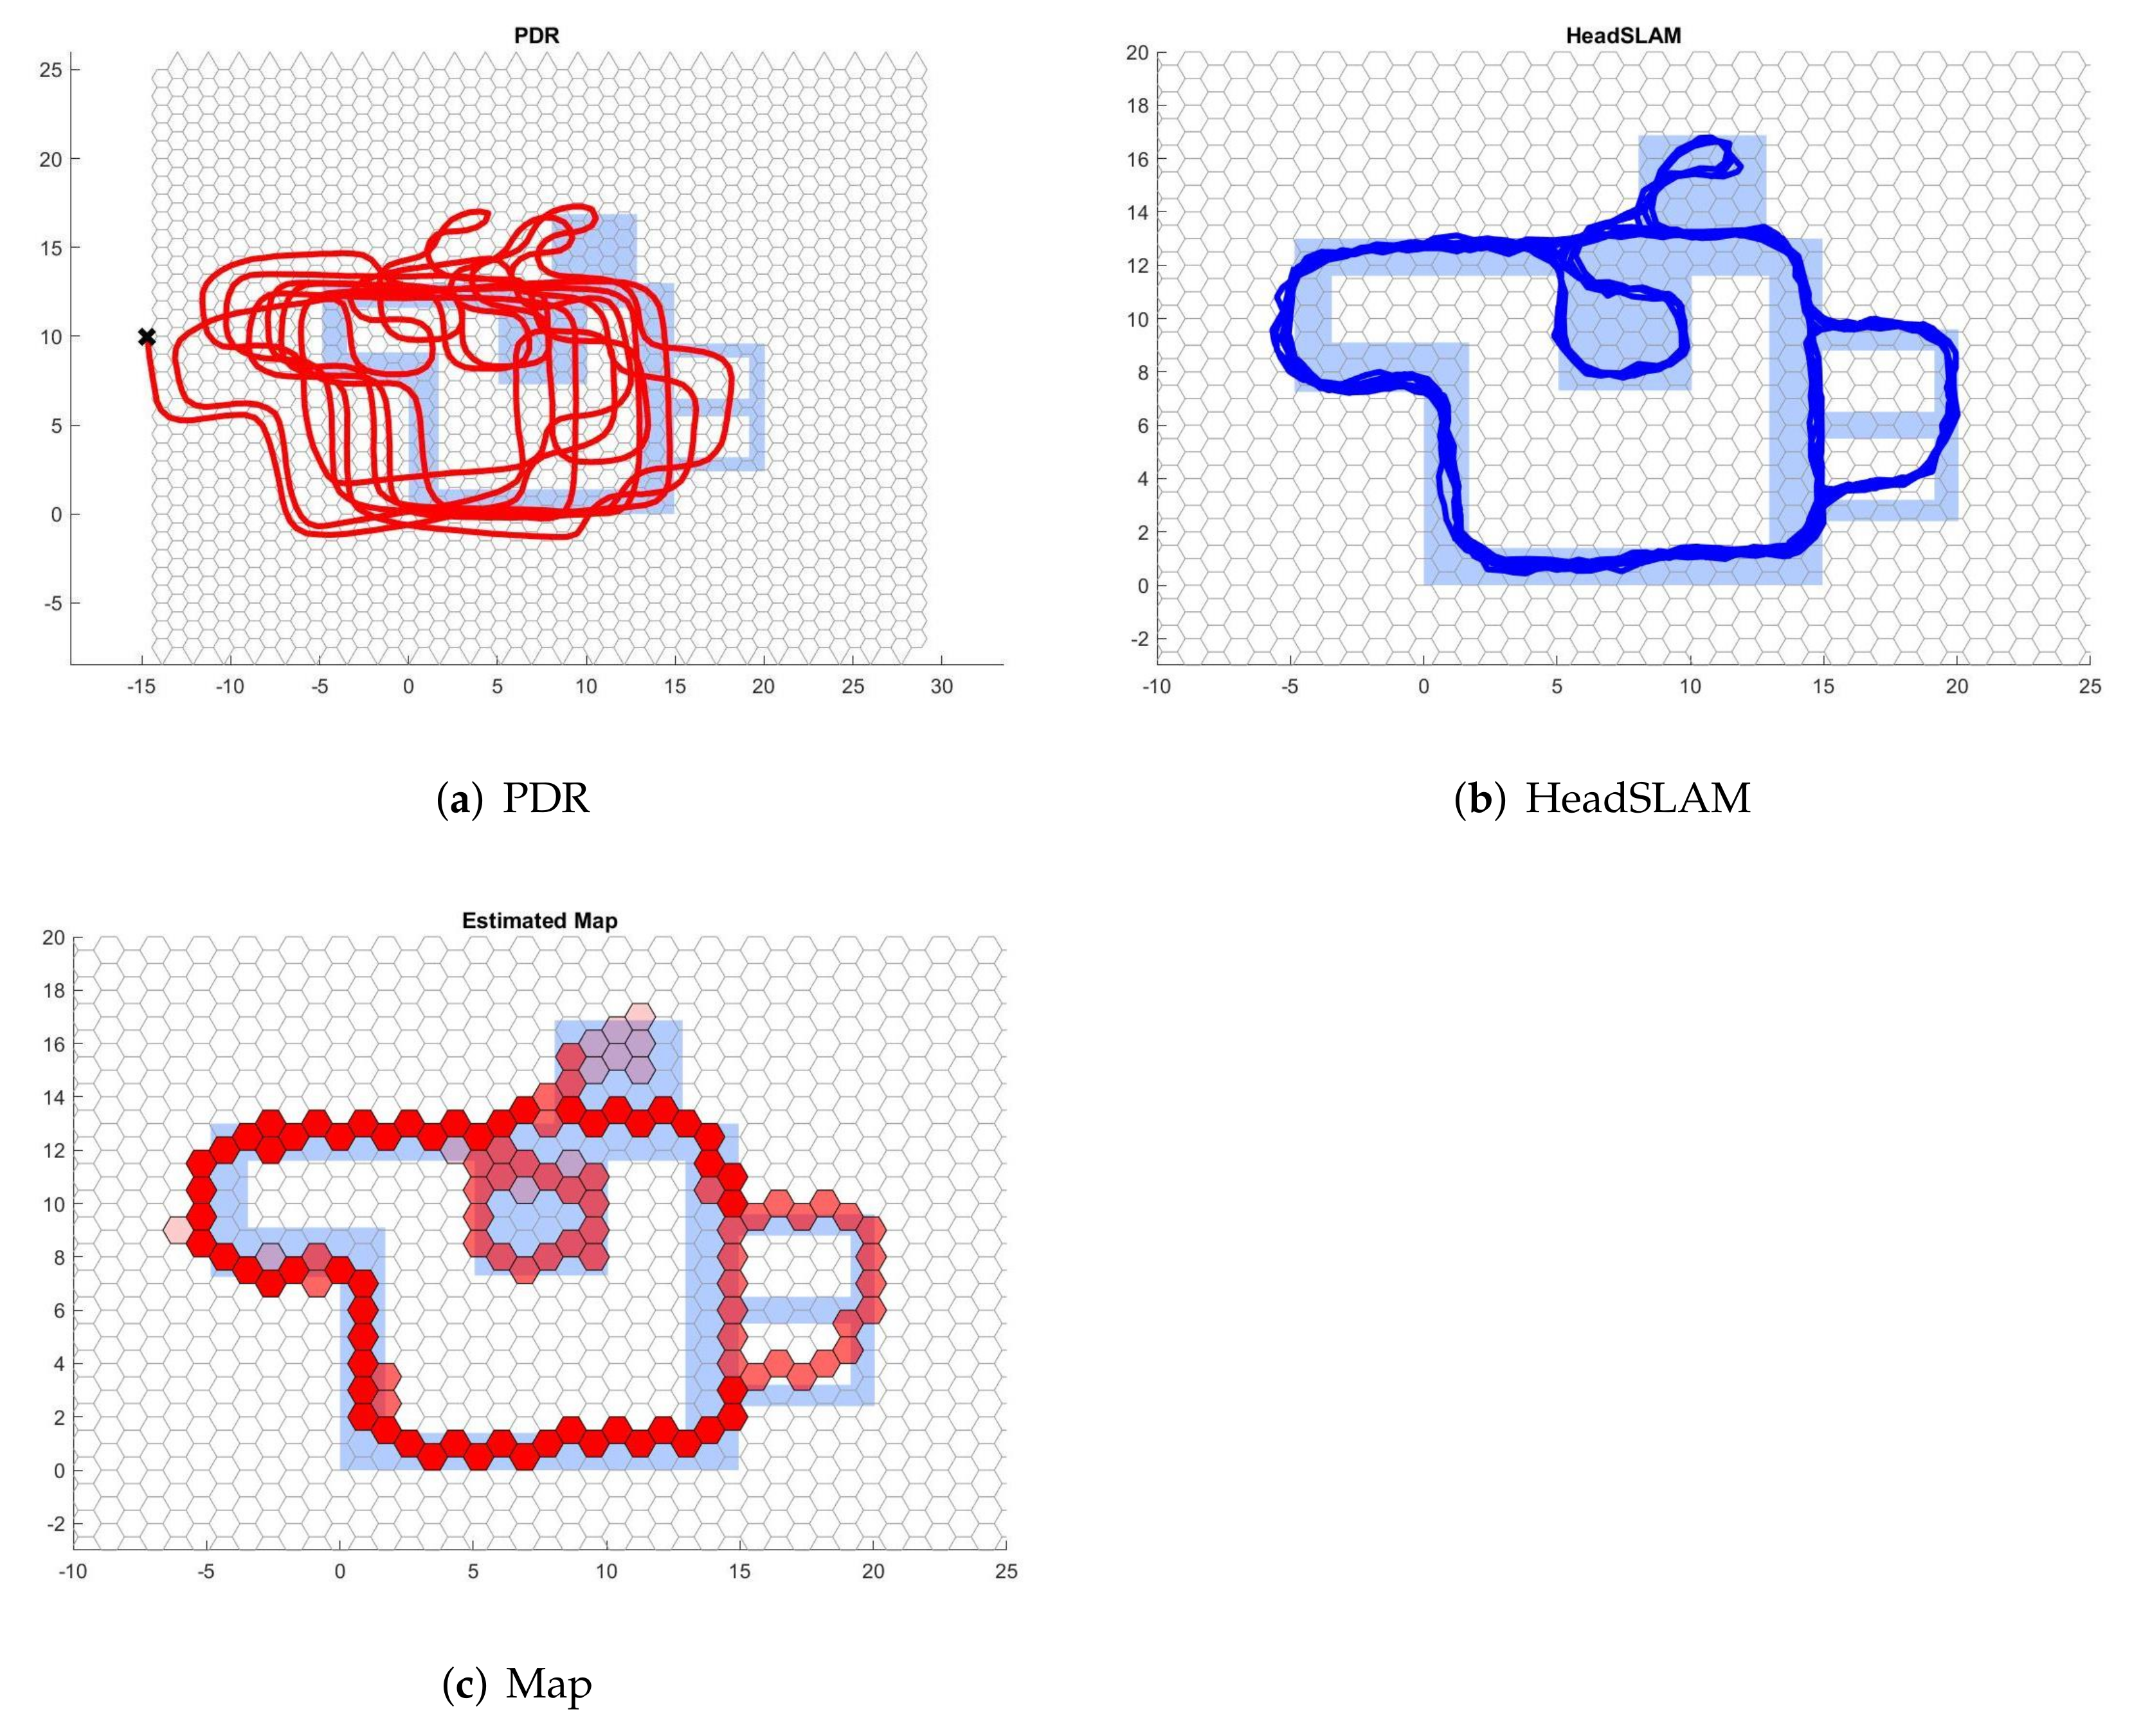
4. Results
5. Discussion
6. Conclusions
Supplementary Materials
Author Contributions
Funding
Institutional Review Board Statement
Informed Consent Statement
Data Availability Statement
Conflicts of Interest
References
- Romme, J.; van den Heuvel, J.H.C.; Dolmans, G.; Selimis, G.; Philips, K.; de Groot, H. Measurement and analysis of UWB radio channel for indoor localization in a hospital environment. In Proceedings of the 2014 IEEE International Conference on Ultra-WideBand (ICUWB), Paris, France, 1–3 September 2014; pp. 274–279. [Google Scholar] [CrossRef]
- Gonçalves Ferreira, A.F.G.; Fernandes, D.M.A.; Catarino, A.P.; Monteiro, J.L. Localization and Positioning Systems for Emergency Responders: A Survey. IEEE Commun. Surv. Tutor. 2017, 19, 2836–2870. [Google Scholar] [CrossRef]
- Pensas, H.; Valtonen, M.; Vanhala, J. Wireless Sensor Networks Energy Optimization Using User Location Information in Smart Homes. In Proceedings of the 2011 International Conference on Broadband and Wireless Computing, Communication and Applications, Barcelona, Spain, 26–28 October 2011; pp. 351–356. [Google Scholar] [CrossRef]
- Tuo, X.; Xie, H. Effectiveness of Acute: Chronic Workload Ratio and Oslo Sports Trauma Research Center Questionnaire on Health Problems in Monitoring Sports Load and Injury of Track and Field Athletes. In Proceedings of the 2021 International Conference on Information Technology and Contemporary Sports (TCS), Guangzhou, China, 15–17 January 2021; pp. 520–523. [Google Scholar] [CrossRef]
- De Almeida e Bueno, L.; Kwong, M.T.; Milnthorpe, W.R.; Cheng, R.; Bergmann, J.H. Applying ubiquitous sensing to estimate perceived exertion based on cardiorespiratory features. Sport. Eng. 2021, 24, 1–9. [Google Scholar]
- Schmidt, G.T. Navigation sensors and systems in GNSS degraded and denied environments 2018: (Or how i learned to stop worrying about GPS). In Proceedings of the 2018 25th Saint Petersburg International Conference on Integrated Navigation Systems (ICINS), St. Petersburg, Russia, 28–30 May 2018; pp. 1–12. [Google Scholar] [CrossRef]
- Zhuang, Y.; El-Sheimy, N. Tightly-Coupled Integration of WiFi and MEMS Sensors on Handheld Devices for Indoor Pedestrian Navigation. IEEE Sens. J. 2016, 16, 224–234. [Google Scholar] [CrossRef]
- Zampella, F.; Jiménez, A.R.; Seco, F. Robust indoor positioning fusing PDR and RF technologies: The RFID and UWB case. In Proceedings of the International Conference on Indoor Positioning and Indoor Navigation, Montbeliard, France, 28–31 October 2013; pp. 1–10. [Google Scholar] [CrossRef]
- Jiménez, A.; Seco, F. Finding objects using UWB or BLE localization technology: A museum-like use case. In Proceedings of the 2017 International Conference on Indoor Positioning and Indoor Navigation (IPIN), Sapporo, Japan, 18–21 September 2017; pp. 1–8. [Google Scholar] [CrossRef]
- Alarifi, A.; Al-Salman, A.; Alsaleh, M.; Alnafessah, A.; Al-Hadhrami, S.; Al-Ammar, M.A.; Al-Khalifa, H.S. Ultra wideband indoor positioning technologies: Analysis and recent advances. Sensors 2016, 16, 707. [Google Scholar] [CrossRef]
- Huang, J.; Fei, Z.; Wang, T.; Wang, X.; Liu, F.; Zhou, H.; Zhang, J.A.; Wei, G. V2X-communication assisted interference minimization for automotive radars. China Commun. 2019, 16, 100–111. [Google Scholar] [CrossRef]
- Wang, T.; Huang, J.; Wang, X.; Wang, S.; Fei, Z. Sum-rate Optimization for Radar and Communication Coexistence. In Proceedings of the 2019 11th International Conference on Wireless Communications and Signal Processing (WCSP), Xi’an, China, 23–25 October 2019; pp. 1–5. [Google Scholar]
- Xing, B.; Zhu, Q.; Pan, F.; Feng, X. Marker-based multi-sensor fusion indoor localization system for micro air vehicles. Sensors 2018, 18, 1706. [Google Scholar] [CrossRef] [Green Version]
- Hou, X.; Bergmann, J. Pedestrian dead reckoning with wearable sensors: A systematic review. IEEE Sens. J. 2020, 21, 143–152. [Google Scholar] [CrossRef]
- Poulose, A.; Eyobu, O.S.; Han, D.S. An indoor position-estimation algorithm using smartphone IMU sensor data. IEEE Access 2019, 7, 11165–11177. [Google Scholar] [CrossRef]
- Foxlin, E. Pedestrian tracking with shoe-mounted inertial sensors. IEEE Comput. Graph. Appl. 2005, 25, 38–46. [Google Scholar] [CrossRef]
- Durrant-Whyte, H.; Bailey, T. Simultaneous localization and mapping: Part I. IEEE Robot. Autom. Mag. 2006, 13, 99–110. [Google Scholar] [CrossRef] [Green Version]
- Mur-Artal, R.; Montiel, J.M.M.; Tardós, J.D. ORB-SLAM: A Versatile and Accurate Monocular SLAM System. IEEE Trans. Robot. 2015, 31, 1147–1163. [Google Scholar] [CrossRef] [Green Version]
- Newman, P.; Cole, D.; Ho, K. Outdoor SLAM using visual appearance and laser ranging. In Proceedings of the 2006 IEEE International Conference on Robotics and Automation, ICRA 2006, Orlando, FL, USA, 15–19 May 2006; pp. 1180–1187. [Google Scholar] [CrossRef]
- Hess, W.; Kohler, D.; Rapp, H.; Andor, D. Real-time loop closure in 2D LIDAR SLAM. In Proceedings of the 2016 IEEE International Conference on Robotics and Automation (ICRA), Stockholm, Sweden, 16–21 May 2016; pp. 1271–1278. [Google Scholar] [CrossRef]
- Ribas, D.; Ridao, P.; Neira, J.; Tardos, J.D. SLAM using an Imaging Sonar for Partially Structured Underwater Environments. In Proceedings of the 2006 IEEE/RSJ International Conference on Intelligent Robots and Systems, Beijing, China, 9–15 October 2006; pp. 5040–5045. [Google Scholar] [CrossRef] [Green Version]
- Angermann, M.; Robertson, P. FootSLAM: Pedestrian simultaneous localization and mapping without exteroceptive sensors—Hitchhiking on human perception and cognition. Proc. IEEE 2012, 100, 1840–1848. [Google Scholar] [CrossRef]
- Kaiser, S.; Diaz, E.M. PocketSLAM based on the principle of the FootSLAM algorithm. In Proceedings of the 2015 International Conference on Localization and GNSS (ICL-GNSS), Gothenburg, Sweden, 22–24 June 2015; pp. 1–5. [Google Scholar] [CrossRef]
- Bergmann, J.H.; Chandaria, V.; McGregor, A. Wearable and implantable sensors: The patient’s perspective. Sensors 2012, 12, 16695–16709. [Google Scholar] [CrossRef] [PubMed] [Green Version]
- Hou, X.; Bergmann, J. A Pedestrian Dead Reckoning Method for Head-Mounted Sensors. Sensors 2020, 20, 6349. [Google Scholar] [CrossRef]
- Weinberg, H. Using the ADXL202 in pedometer and personal navigation applications. Analog Devices AN-602 Appl. Note 2002, 2, 1–6. [Google Scholar]
- Vezočnik, M.; Juric, M.B. Average Step Length Estimation Models’ Evaluation Using Inertial Sensors: A Review. IEEE Sens. J. 2019, 19, 396–403. [Google Scholar] [CrossRef]
- Mahony, R.; Hamel, T.; Pflimlin, J.M. Nonlinear complementary filters on the special orthogonal group. IEEE Trans. Autom. Control 2008, 53, 1203–1218. [Google Scholar] [CrossRef] [Green Version]
- Lenz, J.; Edelstein, S. Magnetic sensors and their applications. IEEE Sens. J. 2006, 6, 631–649. [Google Scholar] [CrossRef]
- Lee, J.S.; Huang, S.M. An Experimental Heuristic Approach to Multi-Pose Pedestrian Dead Reckoning Without Using Magnetometers for Indoor Localization. IEEE Sens. J. 2019, 19, 9532–9542. [Google Scholar] [CrossRef]
- Tian, Y.; Peng, A.; Xu, X.; Zhang, W. A Heading Estimation Algorithm for Wrist Device Assisted by Sequential Geomagnetic Observations. IEEE Sens. J. 2021. [Google Scholar] [CrossRef]
- Montemerlo, M.; Thrun, S.; Koller, D.; Wegbreit, B. FastSLAM: A factored solution to the simultaneous localization and mapping problem. In Proceedings of the AAAI-02 Proceedings, Edmonton, AB, Canada, 28 July–1 August 2002. [Google Scholar]
- Wahlström, J.; Markham, A.; Trigoni, N. FootSLAM Meets Adaptive Thresholding. IEEE Sen. J. 2020, 20, 9351–9358. [Google Scholar] [CrossRef] [Green Version]
- Klein, I.; Asraf, O. StepNet—Deep Learning Approaches for Step Length Estimation. IEEE Access 2020, 8, 85706–85713. [Google Scholar] [CrossRef]


| Subjects | 1 | 2 | 3 | 4 | 5 | 6 | 7 |
|---|---|---|---|---|---|---|---|
| Age | 25 | 20 | 23 | 24 | 49 | 46 | 47 |
| Height (m) | 1.80 | 1.81 | 1.77 | 1.66 | 1.60 | 1.75 | 1.60 |
| Weight (kg) | 80 | 74 | 61 | 58 | 55 | 89 | 62 |
| Gender | M | M | F | F | F | M | F |
| Indoor tests | ✓ | ✓ | ✓ | ✓ | ✓ | ||
| Outdoor tests | ✓ | ✓ | ✓ | ✓ | ✓ |
| Environment | Algorithm | RMSE | Average Absolute Error | Max Absolute Error |
|---|---|---|---|---|
| Indoor | PDR | 2.2943 | 1.4108 | 8.2473 |
| HeadSLAM | 0.3399 | 0.1610 | 1.6597 | |
| Outdoor | PDR | 2.4358 | 1.7712 | 7.6218 |
| HeadSLAM | 0.8343 | 0.6400 | 2.8368 |
Publisher’s Note: MDPI stays neutral with regard to jurisdictional claims in published maps and institutional affiliations. |
© 2022 by the authors. Licensee MDPI, Basel, Switzerland. This article is an open access article distributed under the terms and conditions of the Creative Commons Attribution (CC BY) license (https://creativecommons.org/licenses/by/4.0/).
Share and Cite
Hou, X.; Bergmann, J. HeadSLAM: Pedestrian SLAM with Head-Mounted Sensors. Sensors 2022, 22, 1593. https://doi.org/10.3390/s22041593
Hou X, Bergmann J. HeadSLAM: Pedestrian SLAM with Head-Mounted Sensors. Sensors. 2022; 22(4):1593. https://doi.org/10.3390/s22041593
Chicago/Turabian StyleHou, Xinyu, and Jeroen Bergmann. 2022. "HeadSLAM: Pedestrian SLAM with Head-Mounted Sensors" Sensors 22, no. 4: 1593. https://doi.org/10.3390/s22041593
APA StyleHou, X., & Bergmann, J. (2022). HeadSLAM: Pedestrian SLAM with Head-Mounted Sensors. Sensors, 22(4), 1593. https://doi.org/10.3390/s22041593