
Assessment of Thigh Angular Velocity by an Activity Monitor to Describe Sit-to-Stand Performance


Abstract
:1. Introduction
2. Materials and Methods
2.1. Subjects and Design
2.2. Outcome Parameters and Protocol
2.3. Descriptive Variables
2.4. Statistics
3. Results
4. Discussion
Author Contributions
Funding
Institutional Review Board Statement
Informed Consent Statement
Data Availability Statement
Conflicts of Interest
References
- Rapp, K.; Becker, C.; Cameron, I.D.; König, H.-H.; Büchele, G. Epidemiology of Falls in Residential Aged Care: Analysis of More Than 70,000 Falls from Residents of Bavarian Nursing Homes. J. Am. Med. Dir. Assoc. 2012, 13, 187.e1–187.e6. [Google Scholar] [CrossRef]
- Ejupi, A.; Brodie, A.M.D.; Gschwind, Y.J.; Lord, S.R.; Zagler, W.L.; Delbaere, K. Kinect-Based Five-Times-Sit-to-Stand Test for Clinical and In-Home Assessment of Fall Risk in Older People. Gerontology 2015, 62, 118–124. [Google Scholar] [CrossRef] [PubMed]
- Cruz-Jentoft, A.J.; Bahat, G.; Bauer, J.; Boirie, Y.; Bruyère, O.; Cederholm, T.; Cooper, C.; Landi, F.; Rolland, Y.; Sayer, A.A.; et al. Sarcopenia: Revised European consensus on definition and diagnosis. Age Ageing 2019, 48, 16–31. [Google Scholar] [CrossRef] [PubMed] [Green Version]
- Guralnik, J.M.; Simonsick, E.M.; Ferrucci, L.; Glynn, R.J.; Berkman, L.F.; Blazer, D.G.; Scherr, P.A.; Wallace, R.B. A Short Physical Performance Battery Assessing Lower Extremity Function: Association with Self-Reported Disability and Prediction of Mortality and Nursing Home Admission. J. Gerontol. 1994, 49, M85–M94. [Google Scholar] [CrossRef] [PubMed]
- Smith, T.M.; Hester, G.M.; Ha, P.L.; Olmos, A.A.; Stratton, M.T.; VanDusseldorp, T.A.; Feito, Y.; Dalton, B.E. Sit-to-Stand Kinetics and Correlates of Performance in Young and Older Males. Arch. Gerontol. Geriatr. 2020, 91, 104215. [Google Scholar] [CrossRef]
- Lindemann, U.; Farahmand, P.; Klenk, J.; Blatzonis, K.; Becker, C. Validity of linear encoder measurement of sit-to-stand performance power in older people. Physiotherapy 2015, 101, 298–302. [Google Scholar] [CrossRef]
- Schenkman, M.; Riley, P.; Pieper, C. Sit to stand from progressively lower seat heights—Alterations in angular velocity. Clin. Biomech. 1996, 11, 153–158. [Google Scholar] [CrossRef]
- Chorin, F.; Cornu, C.; Beaune, B.; Frère, J.; Rahmani, A. Sit to stand in elderly fallers vs non-fallers: New insights from force platform and electromyography data. Aging Clin. Exp. Res. 2015, 28, 871–879. [Google Scholar] [CrossRef]
- Zijlstra, A.; Mancini, M.; Lindemann, U.; Chiari, L.; Zijlstra, W. Sit-stand and stand-sit transitions in older adults and patients with Parkinson’s disease: Event detection based on motion sensors versus force plates. J. Neuroeng. Rehabil. 2012, 9, 75. [Google Scholar] [CrossRef] [Green Version]
- Van Ancum, J.M.; van Schooten, K.S.; Jonkman, N.H.; Huijben, B.; van Lummel, R.C.; Meskers, C.G.; Maier, A.B.; Pijnappels, M. Gait speed assessed by a 4-m walk test is not representative of daily-life gait speed in community-dwelling adults. Maturitas 2019, 121, 28–34. [Google Scholar] [CrossRef]
- Zijlstra, W.; Aminian, K. Mobility assessment in older people: New possibilities and challenges. Eur. J. Ageing 2007, 4, 3–12. [Google Scholar] [CrossRef] [Green Version]
- Pozaic, T.; Lindemann, U.; Grebe, A.-K.; Stork, W. Sit-to-Stand Transition Reveals Acute Fall Risk in Activities of Daily Living. IEEE J. Transl. Eng. Health Med. 2016, 4, 27002. [Google Scholar] [CrossRef] [PubMed]
- Parvaneh, S.; Mohler, J.; Toosizadeh, N.; Grewal, G.S.; Najafi, B. Postural Transitions during Activities of Daily Living Could Identify Frailty Status: Application of Wearable Technology to Identify Frailty during Unsupervised Condition. Gerontology 2017, 63, 479–487. [Google Scholar] [CrossRef] [PubMed] [Green Version]
- Adamowicz, L.; Karahanoglu, F.I.; Cicalo, C.; Zhang, H.; Demanuele, C.; Santamaria, M.; Cai, X.; Patel, S. Assessment of Sit-to-Stand Transfers during Daily Life Using an Accelerometer on the Lower Back. Sensors 2020, 20, 6618. [Google Scholar] [CrossRef]
- Pham, M.H.; Warmerdam, E.; Elshehabi, M.; Schlenstedt, C.; Bergeest, L.-M.; Heller, M.; Haertner, L.; Ferreira, J.J.; Berg, D.; Schmidt, G.; et al. Validation of a Lower Back “Wearable”-Based Sit-to-Stand and Stand-to-Sit Algorithm for Patients with Parkinson’s Disease and Older Adults in a Home-Like Environment. Front. Neurol. 2018, 9, 652. [Google Scholar] [CrossRef] [Green Version]
- Pickford, C.G.; Findlow, A.H.; Kerr, A.; Banger, M.; Clarke-Cornwell, A.M.; Hollands, K.L.; Quinn, T.; Granat, M.H. Quantifying sit-to-stand and stand-to-sit transitions in free-living environments using the activPAL thigh-worn activity monitor. Gait Posture 2019, 73, 140–146. [Google Scholar] [CrossRef] [PubMed]
- Mitchell, T.; Borner, K.; Finch, J.; Kerr, J.; Carlson, J.A. Using Activity Monitors to Measure Sit-to-Stand Transitions in Overweight/Obese Youth. Med. Sci. Sports Exerc. 2017, 49, 1592–1598. [Google Scholar] [CrossRef] [PubMed]
- Glenn, J.M.; Gray, M.; Binns, A. Relationship of Sit-to-Stand Lower-Body Power with Functional Fitness Measures among Older Adults with and Without Sarcopenia. J. Geriatr. Phys. Ther. 2017, 40, 42–50. [Google Scholar] [CrossRef]
- Baltasar-Fernandez, I.; Alcazar, J.; Rodriguez-Lopez, C.; Losa-Reyna, J.; Alonso-Seco, M.; Ara, I.; Alegre, L.M. Sit-to-stand muscle power test: Comparison between estimated and force plate-derived mechanical power and their association with physical function in older adults. Exp. Gerontol. 2020, 145, 111213. [Google Scholar] [CrossRef]
- Cheng, Y.Y.; Wei, S.H.; Chen, P.Y.; Tsai, M.W.; Cheng, I.C.; Liu, D.H.; Kao, C.L. Can sit-to-stand lower limb muscle power predict fall status? Gait Posture 2014, 40, 403–407. [Google Scholar] [CrossRef]
- Ejupi, A.; Brodie, A.M.D.; Lord, S.R.; Annegarn, J.; Redmond, S.J.; Delbaere, K. Wavelet-Based Sit-To-Stand Detection and Assessment of Fall Risk in Older People Using a Wearable Pendant Device. IEEE Trans. Biomed. Eng. 2016, 64, 1602–1607. [Google Scholar] [CrossRef] [PubMed]
- Lindemann, U.; Mohr, C.; Machann, J.; Blatzonis, K.; Rapp, K.; Becker, C. Association between Thigh Muscle Volume and Leg Muscle Power in Older Women. PLoS ONE 2016, 11, e0157885. [Google Scholar] [CrossRef] [PubMed]
- Bahat, G.; Kilic, C.; Eris, S.; Karan, M.A. Power Versus Sarcopenia: Associations with Functionality and Physical Performance Measures. J. Nutr. Health Aging 2020, 25, 13–17. [Google Scholar] [CrossRef] [PubMed]
- Thabane, L.; Ma, J.; Chu, R.; Cheng, J.; Ismaila, A.; Rios, L.P.; Robson, R.; Thabane, M.; Giangregorio, L.; Goldsmith, C.H. A tutorial on pilot studies: The what, why and how. BMC Med. Res. Methodol. 2010, 10, 1. [Google Scholar] [CrossRef] [PubMed] [Green Version]
- Lindemann, U.; Claus, H.; Stuber, M.; Augat, P.; Muche, R.; Nikolaus, T.; Becker, C. Measuring power during the sit-to-stand transfer. Eur. J. Appl. Physiol. 2003, 89, 466–470. [Google Scholar] [CrossRef]
- Moe-Nilssen, R. A method for reliability analysis of speed-related repeated measures gait data. Gait Posture 2011, 33, 297–299. [Google Scholar] [CrossRef]
- Lindemann, U.; Najafi, B.; Zijlstra, W.; Hauer, K.; Muche, R.; Becker, C.; Aminian, K. Distance to achieve steady state walking speed in frail elderly persons. Gait Posture 2008, 27, 91–96. [Google Scholar] [CrossRef]
- Groll, D.L.; To, T.; Bombardier, C.; Wright, J.G. The development of a comorbidity index with physical function as the outcome. J. Clin. Epidemiol. 2005, 58, 595–602. [Google Scholar] [CrossRef]
- Hopkins, W.G.; Marshall, S.W.; Batterham, A.M.; Hanin, J. Progressive Statistics for Studies in Sports Medicine and Exercise Science. Med. Sci. Sports Exerc. 2009, 41, 3–13. [Google Scholar] [CrossRef] [Green Version]
- Kampe, K.; Pfeiffer, K.; Lindemann, U.; Schoene, D.; Taraldsen, K.; Rapp, K.; Becker, C.; Klenk, J. Change of physical activity parameters of hip and pelvic fracture patients during inpatient rehabilitation and after discharge: Analysis of global and in-depth parameters. Eur. Rev. Aging Phys. Act. 2021, 18, 9. [Google Scholar] [CrossRef]


| Mean (95% CI) | Minimum–Maximum | |
|---|---|---|
| Age [years] | 55.5 (46.4; 64.6) | 25–92 |
| Body weight [kg] | 71.2 (66.6; 75.8) | 57–91 |
| Body height [cm] | 172.5 (168.4; 176.5) | 1.53–1.85 |
| Body mass index [kg/m2] | 23.9 (22.8; 25.0) | 20.2–28.4 |
| Comorbidity index (0–18) | 1.15 (0.67; 1.63) | 0–3 |
| Habitual gait speed [m/s] | 1.58 (1.41; 1.75) | 0.75–2.29 |
| Mean (95% CI) | Minimum–Maximum | |
|---|---|---|
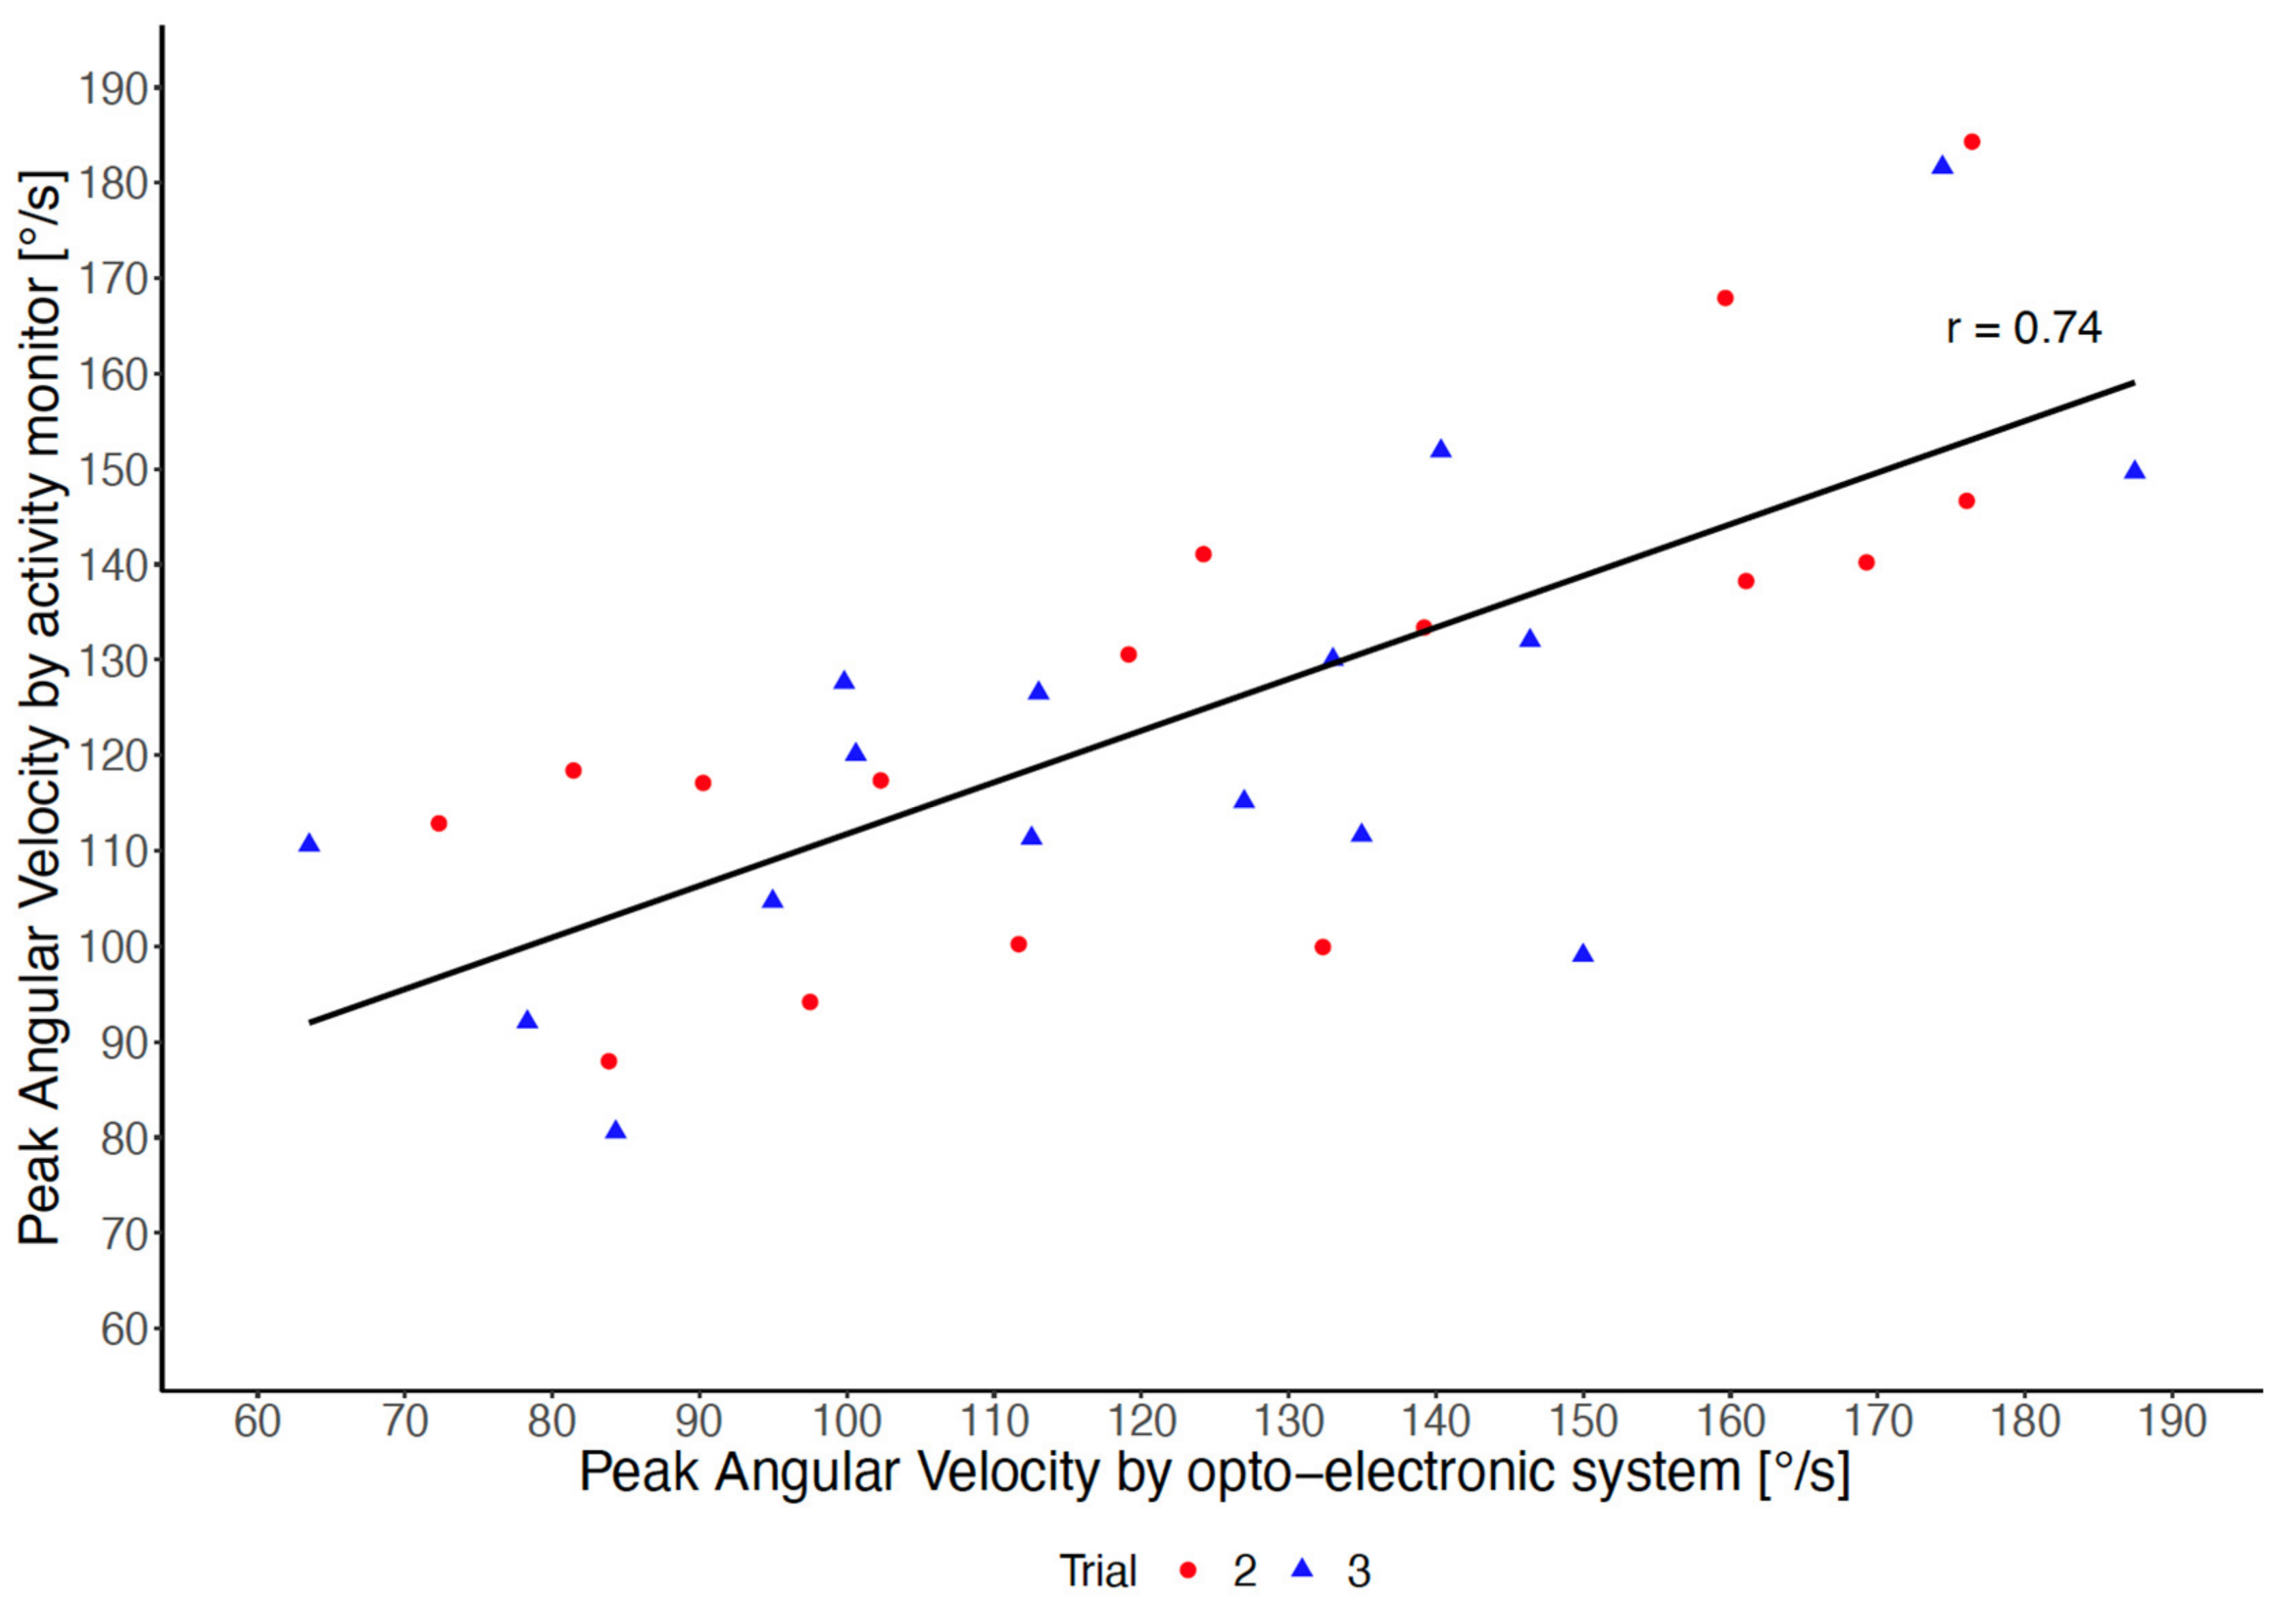
| Peak angular velocity, 2. trial AM [°/s] | 124.6 (110.5; 138.6) | 36.0–184.3 |
| Peak angular velocity, 3. trial AM [°/s] | 121.7 (108.9; 134.6) | 53.6–181.6 |
| Peak angular velocity, 2. trial OES [°/s] * | 124.8 (107.3; 142.2) | 72.3–176.4 |
| Peak angular velocity, 3. trial OES [°/s] * | 121.3 (104.5; 138.1) | 63.5–187.5 |
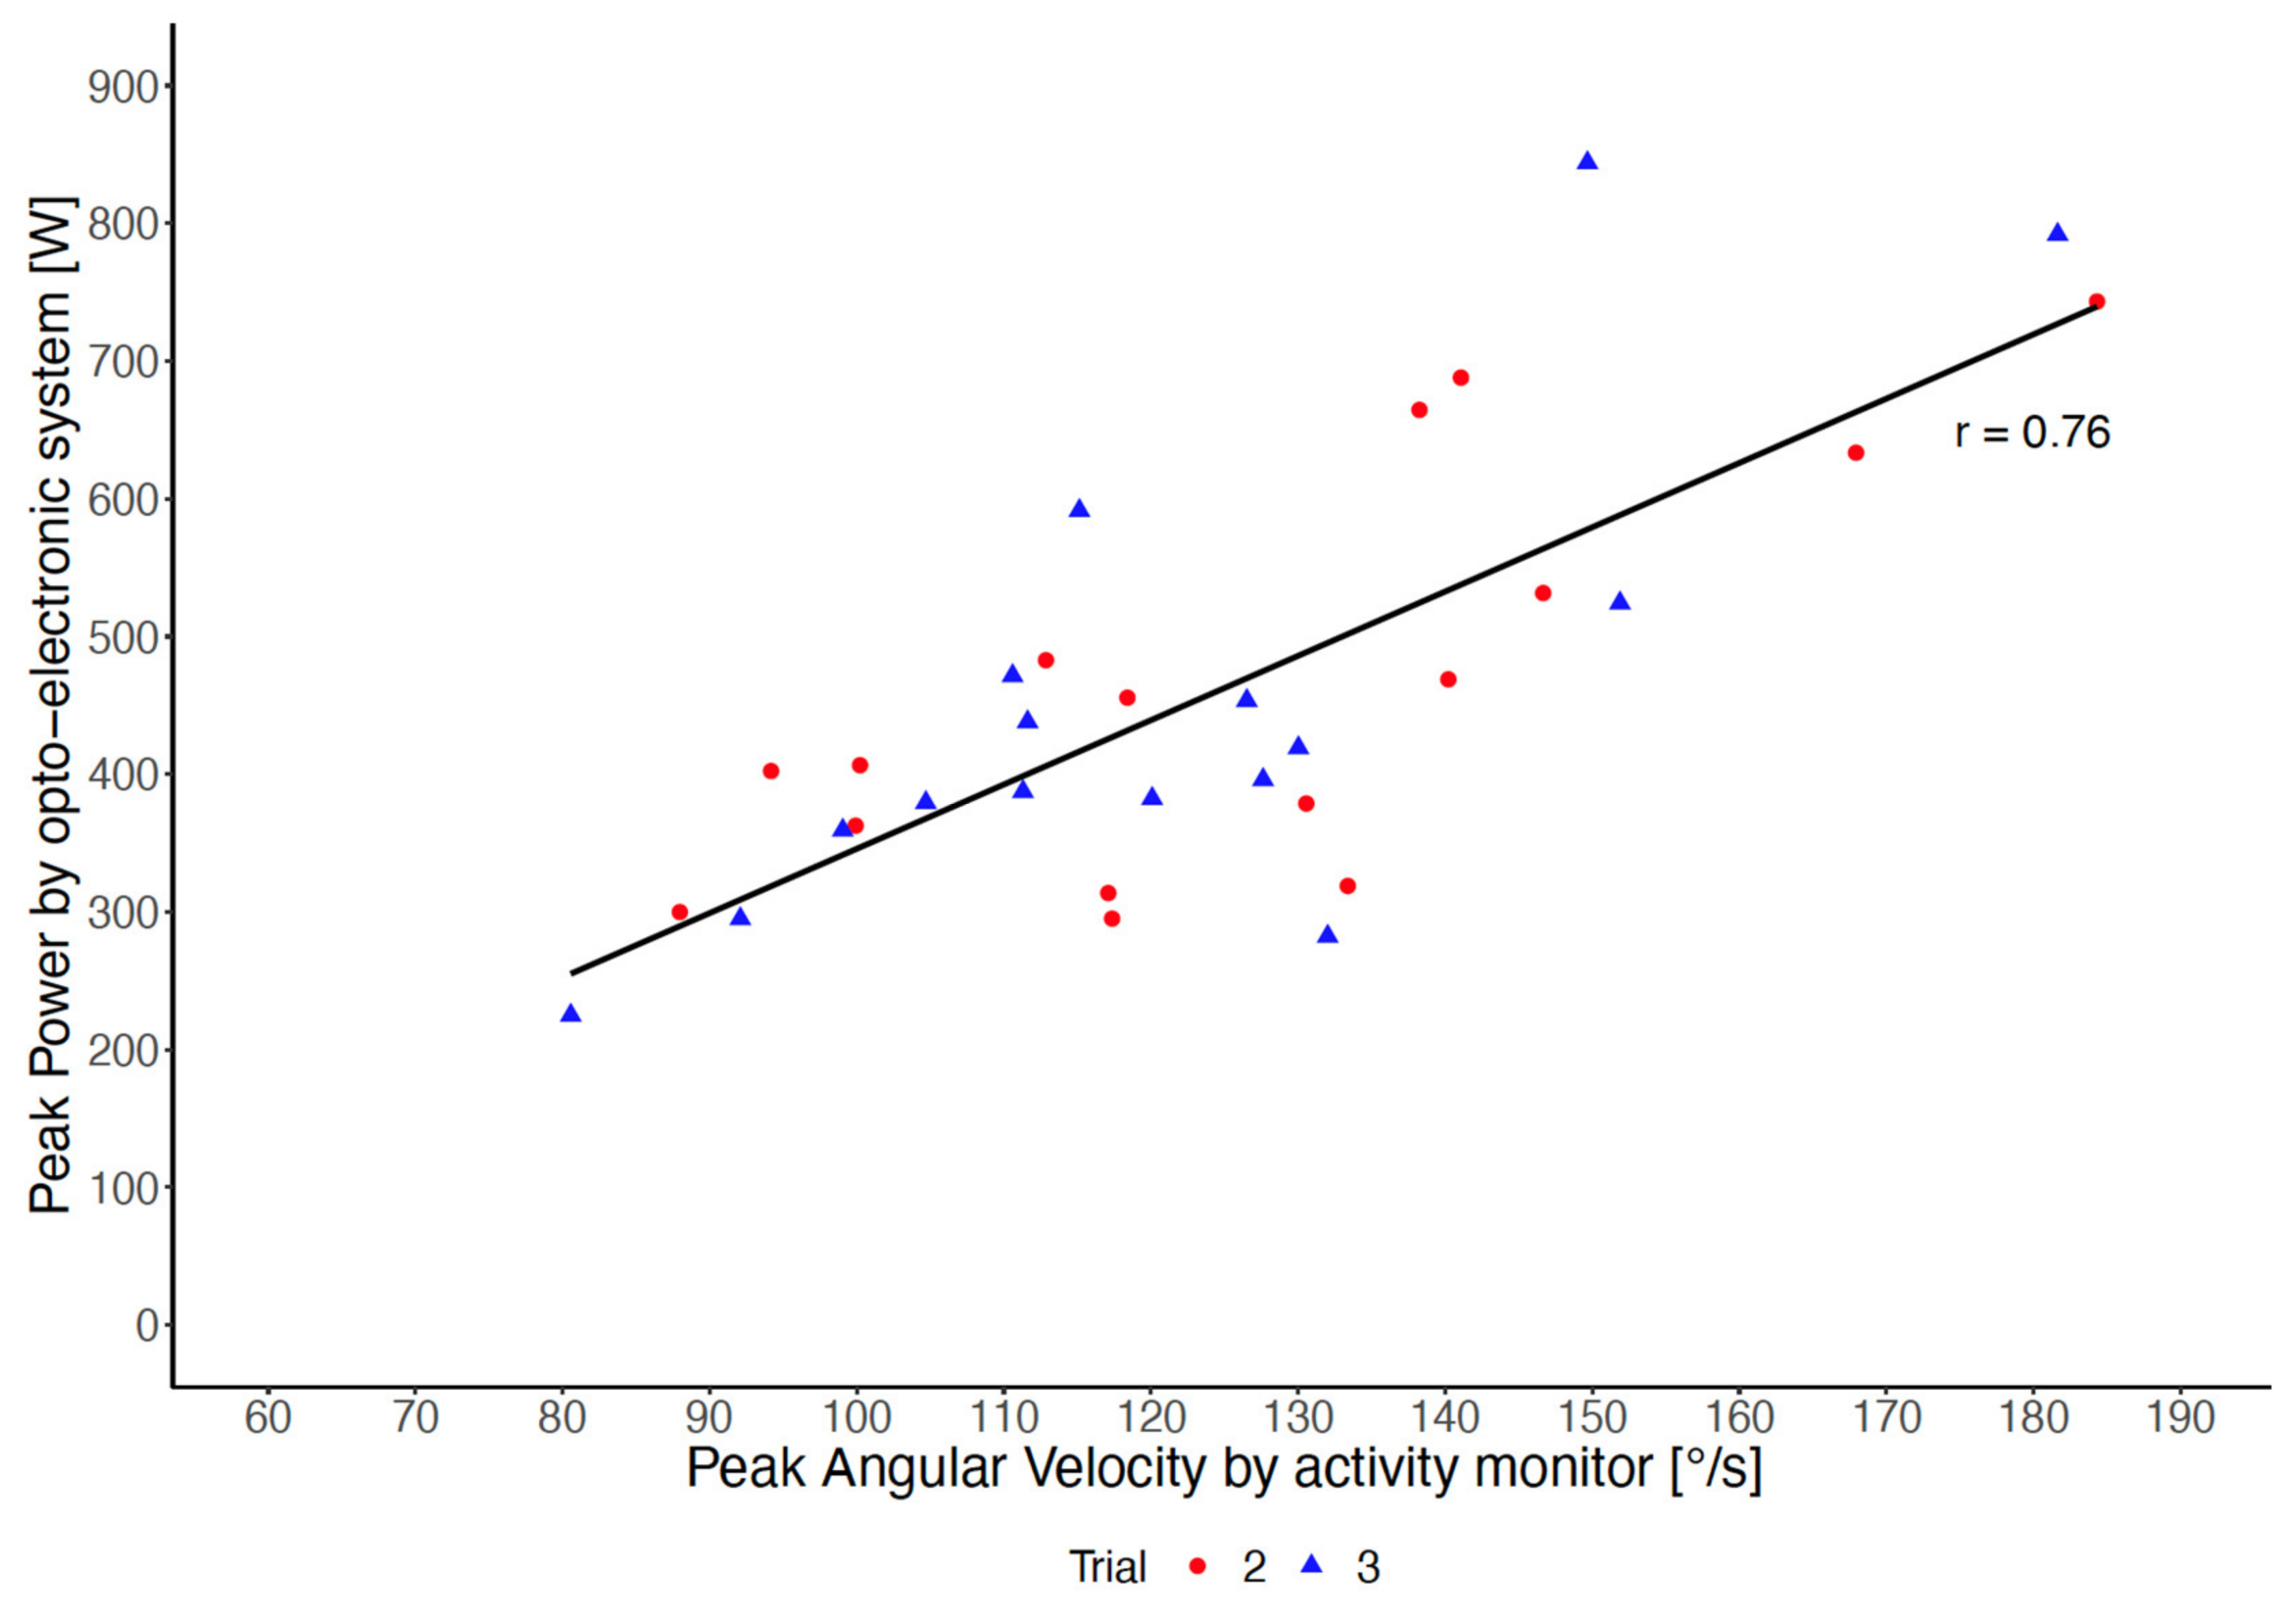
| Peak power, 2. trial FPOES [W] * | 465.3 (393.1; 537.5) | 295.1–743.2 |
| Peak power, 3. trial FPOES [W] * | 452.4 (369.8; 535.1) | 224.8–843.9 |
| Five chair rise time [s] | 8.4 (7.4; 9.4) | 5.2–15.9 |
| Habitual gait speed [m/s] | 1.58 (1.41; 1.75) | 0.75–2.29 |
Publisher’s Note: MDPI stays neutral with regard to jurisdictional claims in published maps and institutional affiliations. |
© 2022 by the authors. Licensee MDPI, Basel, Switzerland. This article is an open access article distributed under the terms and conditions of the Creative Commons Attribution (CC BY) license (https://creativecommons.org/licenses/by/4.0/).
Share and Cite
Klenk, J.; Ba, A.; Sczuka, K.S.; Daub, U.; Lindemann, U. Assessment of Thigh Angular Velocity by an Activity Monitor to Describe Sit-to-Stand Performance. Sensors 2022, 22, 1405. https://doi.org/10.3390/s22041405
Klenk J, Ba A, Sczuka KS, Daub U, Lindemann U. Assessment of Thigh Angular Velocity by an Activity Monitor to Describe Sit-to-Stand Performance. Sensors. 2022; 22(4):1405. https://doi.org/10.3390/s22041405
Chicago/Turabian StyleKlenk, Jochen, Alassane Ba, Kim S. Sczuka, Urban Daub, and Ulrich Lindemann. 2022. "Assessment of Thigh Angular Velocity by an Activity Monitor to Describe Sit-to-Stand Performance" Sensors 22, no. 4: 1405. https://doi.org/10.3390/s22041405
APA StyleKlenk, J., Ba, A., Sczuka, K. S., Daub, U., & Lindemann, U. (2022). Assessment of Thigh Angular Velocity by an Activity Monitor to Describe Sit-to-Stand Performance. Sensors, 22(4), 1405. https://doi.org/10.3390/s22041405