Article

Synergistic Evaluation of Passive Microwave and Optical/IR Data for Modelling Vegetation Transmissivity towards Improved Soil Moisture Retrieval

by
Mina Moradizadeh
1,
Prashant K. Srivastava
2 and
George P. Petropoulos
3,*
1
Department of Geomatics, Faculty of Civil and Transportation Engineering, University of Isfahan, Isfahan 8174673441, Iran
2
Remote Sensing Laboratory, Institute of Environment and Sustainable Development, Banaras Hindu University, Varanasi 221005, Uttar Pradesh, India
3
Department of Geography, Harokopio University of Athens, 17671 Athens, Greece
*
Author to whom correspondence should be addressed.
Sensors 2022, 22(4), 1354; https://doi.org/10.3390/s22041354
Submission received: 28 October 2021 / Revised: 3 February 2022 / Accepted: 4 February 2022 / Published: 10 February 2022
(This article belongs to the Section Remote Sensors)

Abstract

:
Vegetation cover and soil surface roughness are vital parameters in the soil moisture retrieval algorithms. Due to the high sensitivity of passive microwave and optical observations to Vegetation Water Content (VWC), this study assesses the integration of these two types of data to approximate the effect of vegetation on passive microwave Brightness Temperature (BT) to obtain the vegetation transmissivity parameter. For this purpose, a newly introduced index named Passive microwave and Optical Vegetation Index (POVI) was developed to improve the representativeness of VWC and converted into vegetation transmissivity through linear and nonlinear modelling approaches. The modified vegetation transmissivity is then applied in the Simultaneous Land Parameters Retrieval Model (SLPRM), which is an error minimization method for better retrieval of BT. Afterwards, the Volumetric Soil Moisture (VSM), Land Surface Temperature (LST) as well as canopy temperature (TC) were retrieved through this method in a central region of Iran (300 × 130 km2) from November 2015 to August 2016. The algorithm validation returned promising results, with a 20% improvement in soil moisture retrieval.

1. Introduction

Volumetric Soil Moisture (VSM) content is the volume of water accumulated in soil pores, usually recorded as a percent or volumetric ratio (i.e., cm3/cm3) for different depths. The knowledge of soil moisture content is essential in several applications in the field of ecological, hydrological and meteorological processes [1]. Predictions and results of these applications are highly dependent on the accuracy of the VSM data [2]. Due to high temporal and spatial variability of soil moisture and temperature, remote sensing is the only rational instrument to measure and monitor them in an efficient manner, in a wide range of areas [3,4].
Microwave (MW) remote sensing has great potential for measuring and monitoring of soil characteristics. In light of this, different methodologies are found in the literature to explain the rationale behind the estimation of surface soil characteristics accurately [5]. Findings of those studies among others have reported that the radar is more sensitive to surface features, such as roughness and vegetation structure, and radiometer is more sensitive to the near surface VSM and Land Surface Temperature (LST) [6].
Factors influencing the Brightness temperature (BT) of the surface as observed from space, especially in the soil-vegetation medium consist of soil moisture, temperature, vegetation cover (type and amount), surface roughness, soil texture, soil Bulk density (Bd) along with elevation, soil depth, soil mineralogy, etc. [7]. A better estimate of those factors is very much needed when assessing their effect on BT and soil moisture retrieval [7,8,9]. However, in almost all studies, the quantization or prediction of soil characteristics with a consistent degree of confidence is a challenging task for soil scientists and there exist different soil moisture retrieval algorithms in this context. As the modelling of the soil surface roughness and above-ground vegetation cover effects are critical, the difference in the developed algorithms is in their modelling method with respect to these two parameters [10,11,12]. Other challenges that we are facing in modelling soil characteristics are due to limited penetration of sensors and low sensitivity to the soil parameters [13]. Spatial and temporal resolutions of sensors are another major problem that limits the model’s performance due to mismatch between the ground and satellite footprints [14].
Due to the high temporal dynamics of vegetation effect, its accurate determination is very important. In this study, the relationship between Vegetation Water Content (VWC) and vegetation transmissivity, in order to model the effect of vegetation on BT, is investigated. The studies by [15] indicate that observations of passive microwave and optical sensors are sensitive to vegetation in different sensor wavelengths. Therefore, in this study, these two types of data are used and integrated under a newly introduced Passive microwave and Optical Vegetation Index (POVI) to estimate VWC in a more accurate way. Then, with two separate linear and nonlinear modelling approaches, the POVI is converted to transmissivity and applied in the Simultaneous Land Parameters Retrieval Model (SLPRM) algorithm to estimate the VSM, LST and canopy temperature (TC) parameters [16]. Finally, a comparison has been made between the retrieval accuracies of soil surface parameters under linear and nonlinear modelling. The advantage of this algorithm is that it considers the roughness parameter and VWC, therefore proposing a solution towards simultaneous retrieval of soil surface parameters. Unlike VSM operational retrieval algorithms, LST and TC parameters are not considered equal in order to simplify the algorithm [6].
In purview of the above, this study has been focused on (1) to develop, a new index named as POVI for better representation of VWC, (2) to assess new index for vegetation transmissivity estimation through linear and nonlinear modelling approaches, (3) to evaluate the modified vegetation transmissivity for retrieval of BT through Simultaneous Land Parameters Retrieval Model, (4) to retrieve the volumetric soil moisture, land surface temperature as well as canopy temperature using the improved BT.

2. Study Area and Datasets
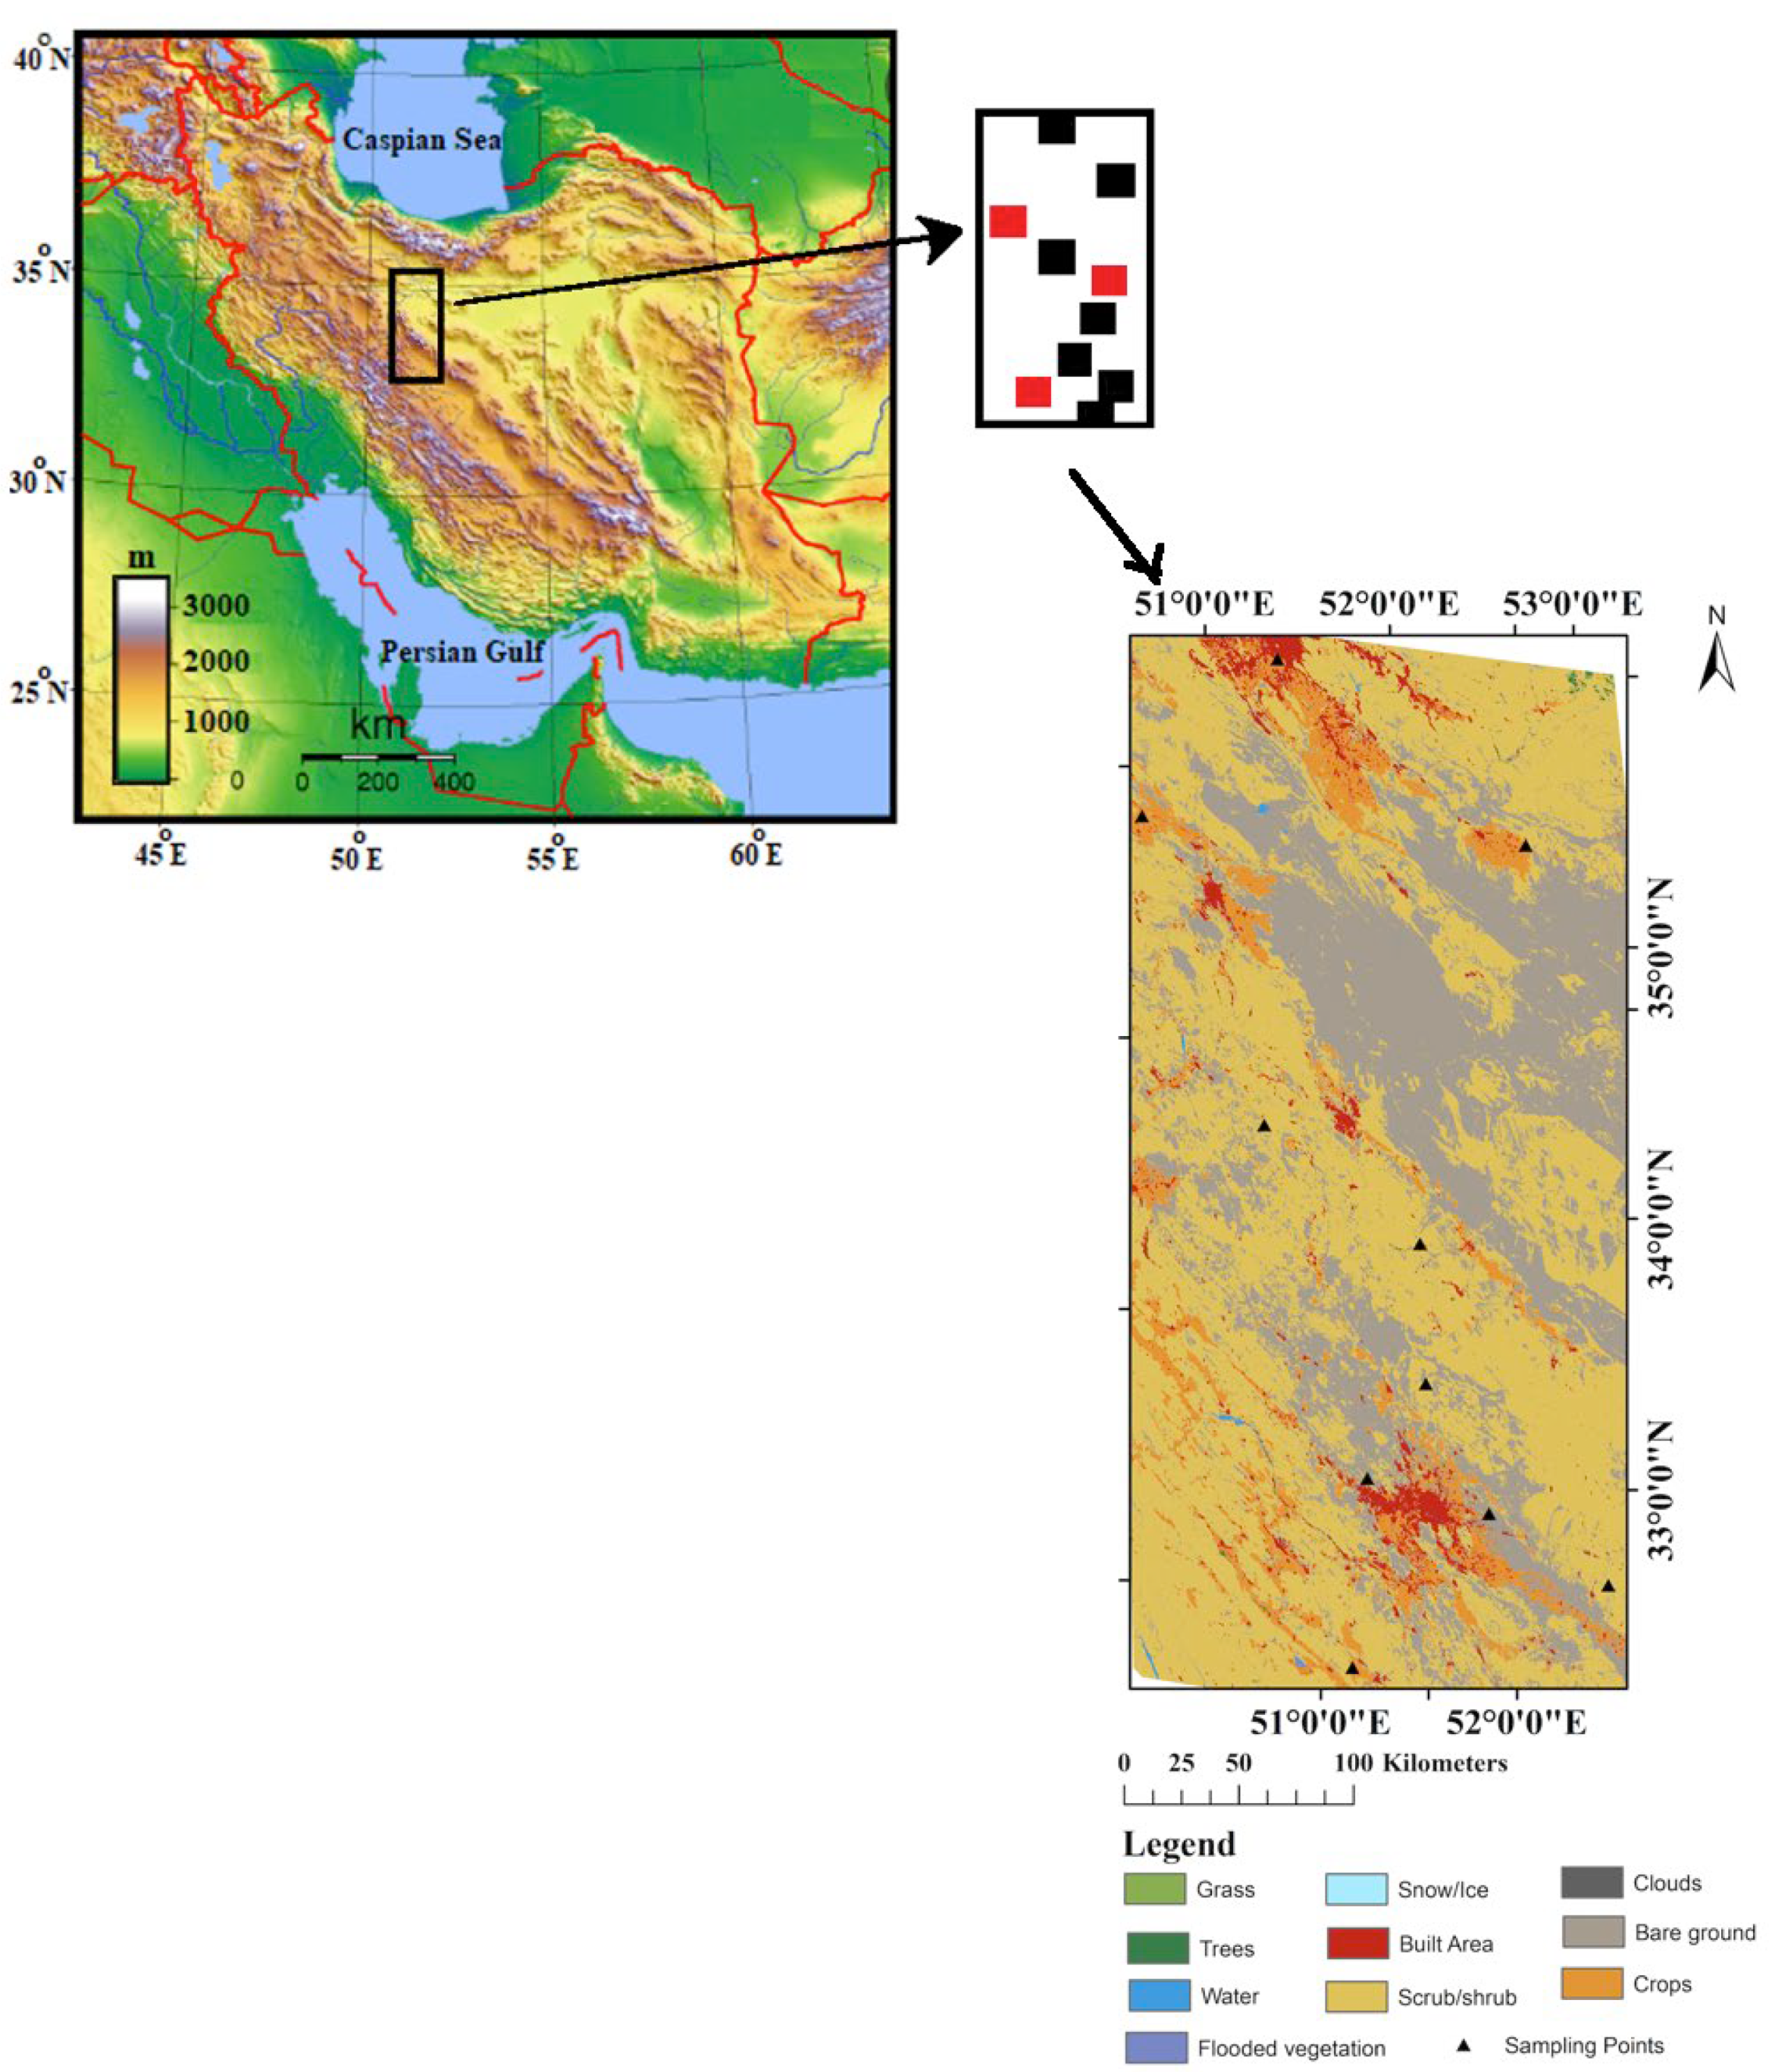
2.1. Study Area

In 2016, the data collection experiment was performed in the central Iranian plateau, a semiarid region of Iran located between Isfahan and Tehran provinces (32°43′–35°35′ N, 50°50′–52°10 E) [17]. This region and its ground sites occupy an area of approximately 300 × 130 km2, as shown in Figure 1.
This area is generally semi-arid and its average elevation is 1400 m above sea level. As elevation increases from east to west in this region, rainfall and temperature increase and decrease, respectively, which creates different climatic conditions. Based on the meteorological stations’ data, topography is the most important determinant of climate in the study area. Land cover distribution types are diverse in this region, including Grass (steppe species dominate the area). Other cover types that exist in the region are namely Trees, Water bodies, Flooded vegetation, Snow/Ice, Built Area, and Scrub/Shrub. Regarding the potential of this proposed algorithm, 10 sites with different soil moisture content are selected for validation purposes.

2.2. Satellite Datasets

In this study, the Advanced Microwave Scanning Radiometer-2 (AMSR2) microwave and MODIS data registered on 16 dates from November 2015 as well as January, March, May, June and August 2016 from the selected region are applied. The reason for choosing these dates is to make observations in different climatic conditions, and as a result, diversity in the values of soil surface parameters. Details about the dataset used are provided in Table 1. AMSR2 was launched on the JAXA’s GCOM-W1 spacecraft in May 2012, replacing the AMSR-E sensor onboard the NASA’s Aqua satellite. Although the spatial resolution of this sensor has been slightly upgraded, it is still not considered a suitable resolution. This instrument is dual-polarized and measures BT on several frequency channels twice a day. The overpass time of both MODIS/Aqua and AMSR2 is about 1:30 A.M. and 1:30 P.M. Because ground data are observed around noon, only daytime AMSR2 and MODIS (or Moderate Resolution Imaging Spectroradiometer) data are used. In addition to having the same overpass time of both the sensors, the other reasons for selecting MODIS among other VIS/IR sensors are its temporal resolution, data availability and good 1 km spatial resolution. The spatial resolution of AMSR2 in the metric unit is 25 km. The spectral bands 2 and 5 of MODIS data are upscaled to 25 km by using the averaging method.

2.3. Ground Datasets
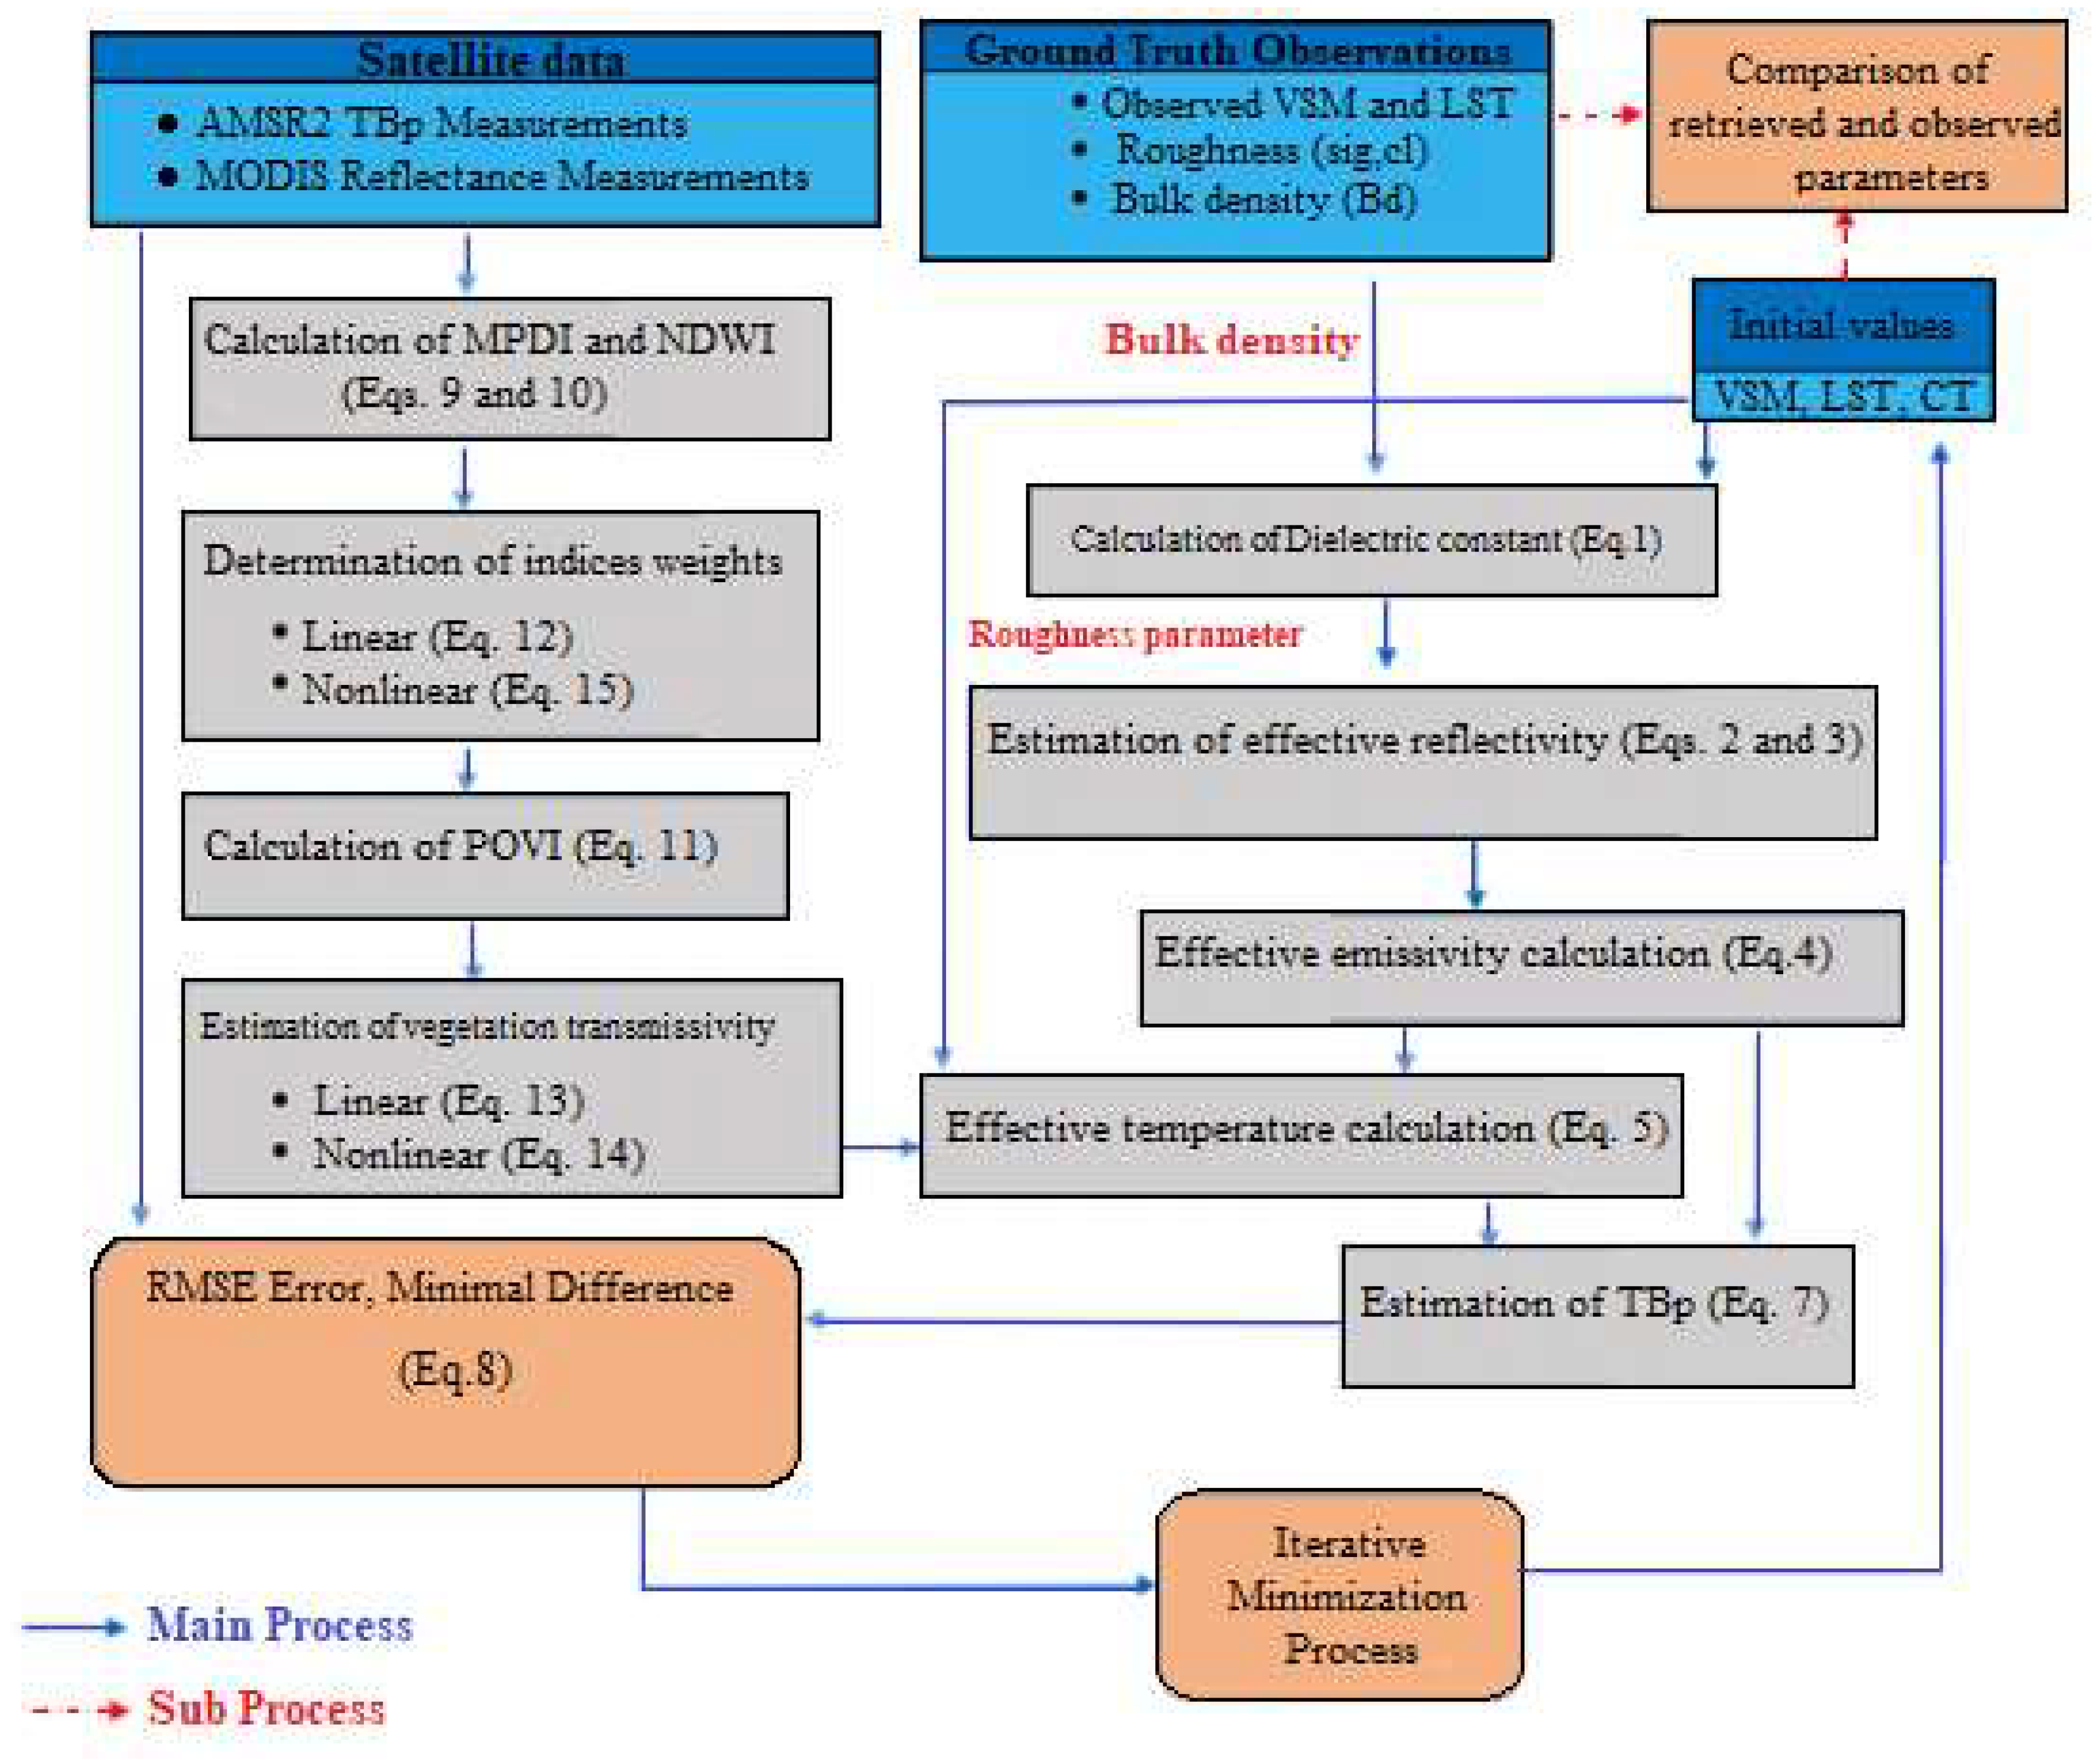
LST is determined and ground samples are taken concurrent to satellite overpass. VSM and LST measurements are taken at the depths of 0–6 cm and 0–5 cm, respectively. In the laboratory, VSM content is also estimated for the above-mentioned dates. The average Bd of the study region is measured by applying a few ground samples in the laboratory. Towards this, according to the means of the region, the values of 1.2 and 0.12 are considered for Bd and surface roughness, respectively. In total, the 10 best stations used in this study have uninterrupted quality-controlled supply of the datasets for the duration considered in this study. These stations are located in large homogenous fields to provide a good consistent record to compare with the satellite datasets and to reduce errors in the spatial mismatch between in situ and satellite datasets. Since the study area consists of 10 ground sites and each site can be considered equivalent to the nearest passive pixel, there are in total 160 passive pixels observed in 16 days. Out of these, observations of 7 stations in 16 days (112 pixels) were used to model calibration and the rest to assess accuracy.

3. Methods

3.1. Baseline Algorithm

SLPRM is developed to retrieve VSM, LST and TC from measurements at six frequency channels of AMSR2 at H and V polarizations at frequencies 6.9 GHz, 10.65 GHz, 18.7 GHz in a simultaneous manner [16]. The steps of this algorithm are as follows:
Step 1. Computation of dielectric constant by applying the model presented by [18]. The ground measured Bd and initial values for VSM and LST are required, obtained based on their average amounts in the region, through Equation (1):
ε = f ( V S M , L S T , B d )
where ε is the real part of the complex soil dielectric constant.
Step 2. Estimation of effective land surface reflection, is obtained through Equation (2) introduced by Fresnel expressions. To model roughness (i.e., sig and cl parameters), the model presented by [19] is applied through Equations (3) and (4).
r H = | cos ( θ ε sin 2 ( θ ) ) cos ( θ ) + ε sin 2 ( θ ) | 2 r V = | ε . cos ( θ ε sin 2 ( θ ) ) ε . cos ( θ ) + ε sin 2 ( θ ) | 2
log [ Q P ( f ) ] = a P ( f ) + ( b P ( f ) × log ( s i g / c l ) ) + ( c P ( f ) × ( s i g / c l ) )
R P e = ( Q P ) × r P + Q P × r q
where R P e represents reflectivity, Fresnel reflectivity denoted by the term r, θ is incidence angle, a, b and c are the frequency-based coefficients. Parameters H and V are horizontal and vertical polarization, respectively. p represents the desired polarization and q represents the opposite polarization. f represents the frequency, QP is related to surface roughness, which can be calculated for different frequencies in horizontal and vertical polarization.
Step 3. Effective reflectivity ( R P ( θ ) ) can be converted into effective emissivity ( E P ( θ ) ), through Equation (5):
E P ( θ ) = 1 R P ( θ )
Step 4. Here the effective temperature is calculated through Equations (6) and (7) as shown below:
T = ( ( 1 Γ ) × T C ) + ( Γ × T S ) + ( ( 1 Γ ) × Γ × ( 1 E P ( θ ) ) × T C )  
Γ = f ( ( V I ) × θ )  
where Γ   is vegetation transmissivity, VI is vegetation index and T, TS and TC are effective temperature, temperatures of the soil and canopy temperature, respectively.
Step 5. Calculation of BT by applying the effective temperature and emissivity, Equation (8):
BTP = EP (θ) × T
Step 6. Here, the obtained BT and sensor measured BT are compared through error minimization method with variables χ = {VSM, LST, TC} that minimizes χ2, through Equation (9):
χ 2 = i = 1 6 [ ( ( B T o b s ) i ( B T e s t ) i ) 2 ]

3.2. Algorithm Improvement

3.2.1. VWC Index Extraction

Since the Qp method is used in the SLPRM algorithm to model the roughness effects, the main purpose of this study is to minimize the effect of vegetation on the AMSR2 microwave BT, by applying appropriate modelling for the retrieval of VSM content along with LST and TC from microwave data. Because the purpose is to aggregate the observations of passive microwave and optical sensors to estimate VWC, the two Multi Polarized Difference Index (MPDI) and Normalized Difference Water Index (NDWI) are used as the proper indicators of VWC, obtained from the AMSR2 and MODIS sensors, respectively. The multi-polarization measurements at higher microwave frequencies are suitable for modelling the vegetation effects [11]. The MPDI derived from 36.5 GHz, as a good representative of the VWC, can be calculated through Equation (10):
M P D I = ( B T V B T H ) / ( B T V + B T H )
where, BTV and BTH are the vertical and horizontal BT in passive microwave sensors, respectively.
Because NDWI is more consistent with VWC than other (Vis/IR) vegetation indices, it is calculated through Equation (11). Band 2 (850 nm, NIR band), and one of 5 or 6 bands (1240 nm or 1650 nm, SWIR band) of MODIS can be applied. In this study, band 5 is used as the SWIR band, because photons at 850 nm and 1240 nm penetrate into vegetation canopies in a similar manner, with similar atmospheric scattering [20].
N D W I = ( N I R S W I R ) / ( N I R + S W I R )  
where, NIR is near infrared and SWIR is shortwave infrared.
Due to the different spatial resolution of MODIS and AMSR2 sensors, NDWI is extracted from MODIS pixels are averaged to each passive pixel.
At this stage, the main issue is the integration of these two indices in development of new index called POVI, in a sense that it is able to model the vegetation effect at its best. Due to different high sensitivity of transmissivity to the MPDI and NDWI, the weights (wi) are considered to calculate POVI in the Equation (12):
P O V I = i = 1 n w i × ( V I ) i  
Since the objective here is to calculate the vegetation transmissivity (Γ) through Equation (7) of step 4, it is necessary to examine the correlation between the vegetation transmissivity and the VWC indices. In this study, linear (first order) and nonlinear (exponential), both are applied to the vegetation transmissivity and the VWC indices as detailed in the following sections.

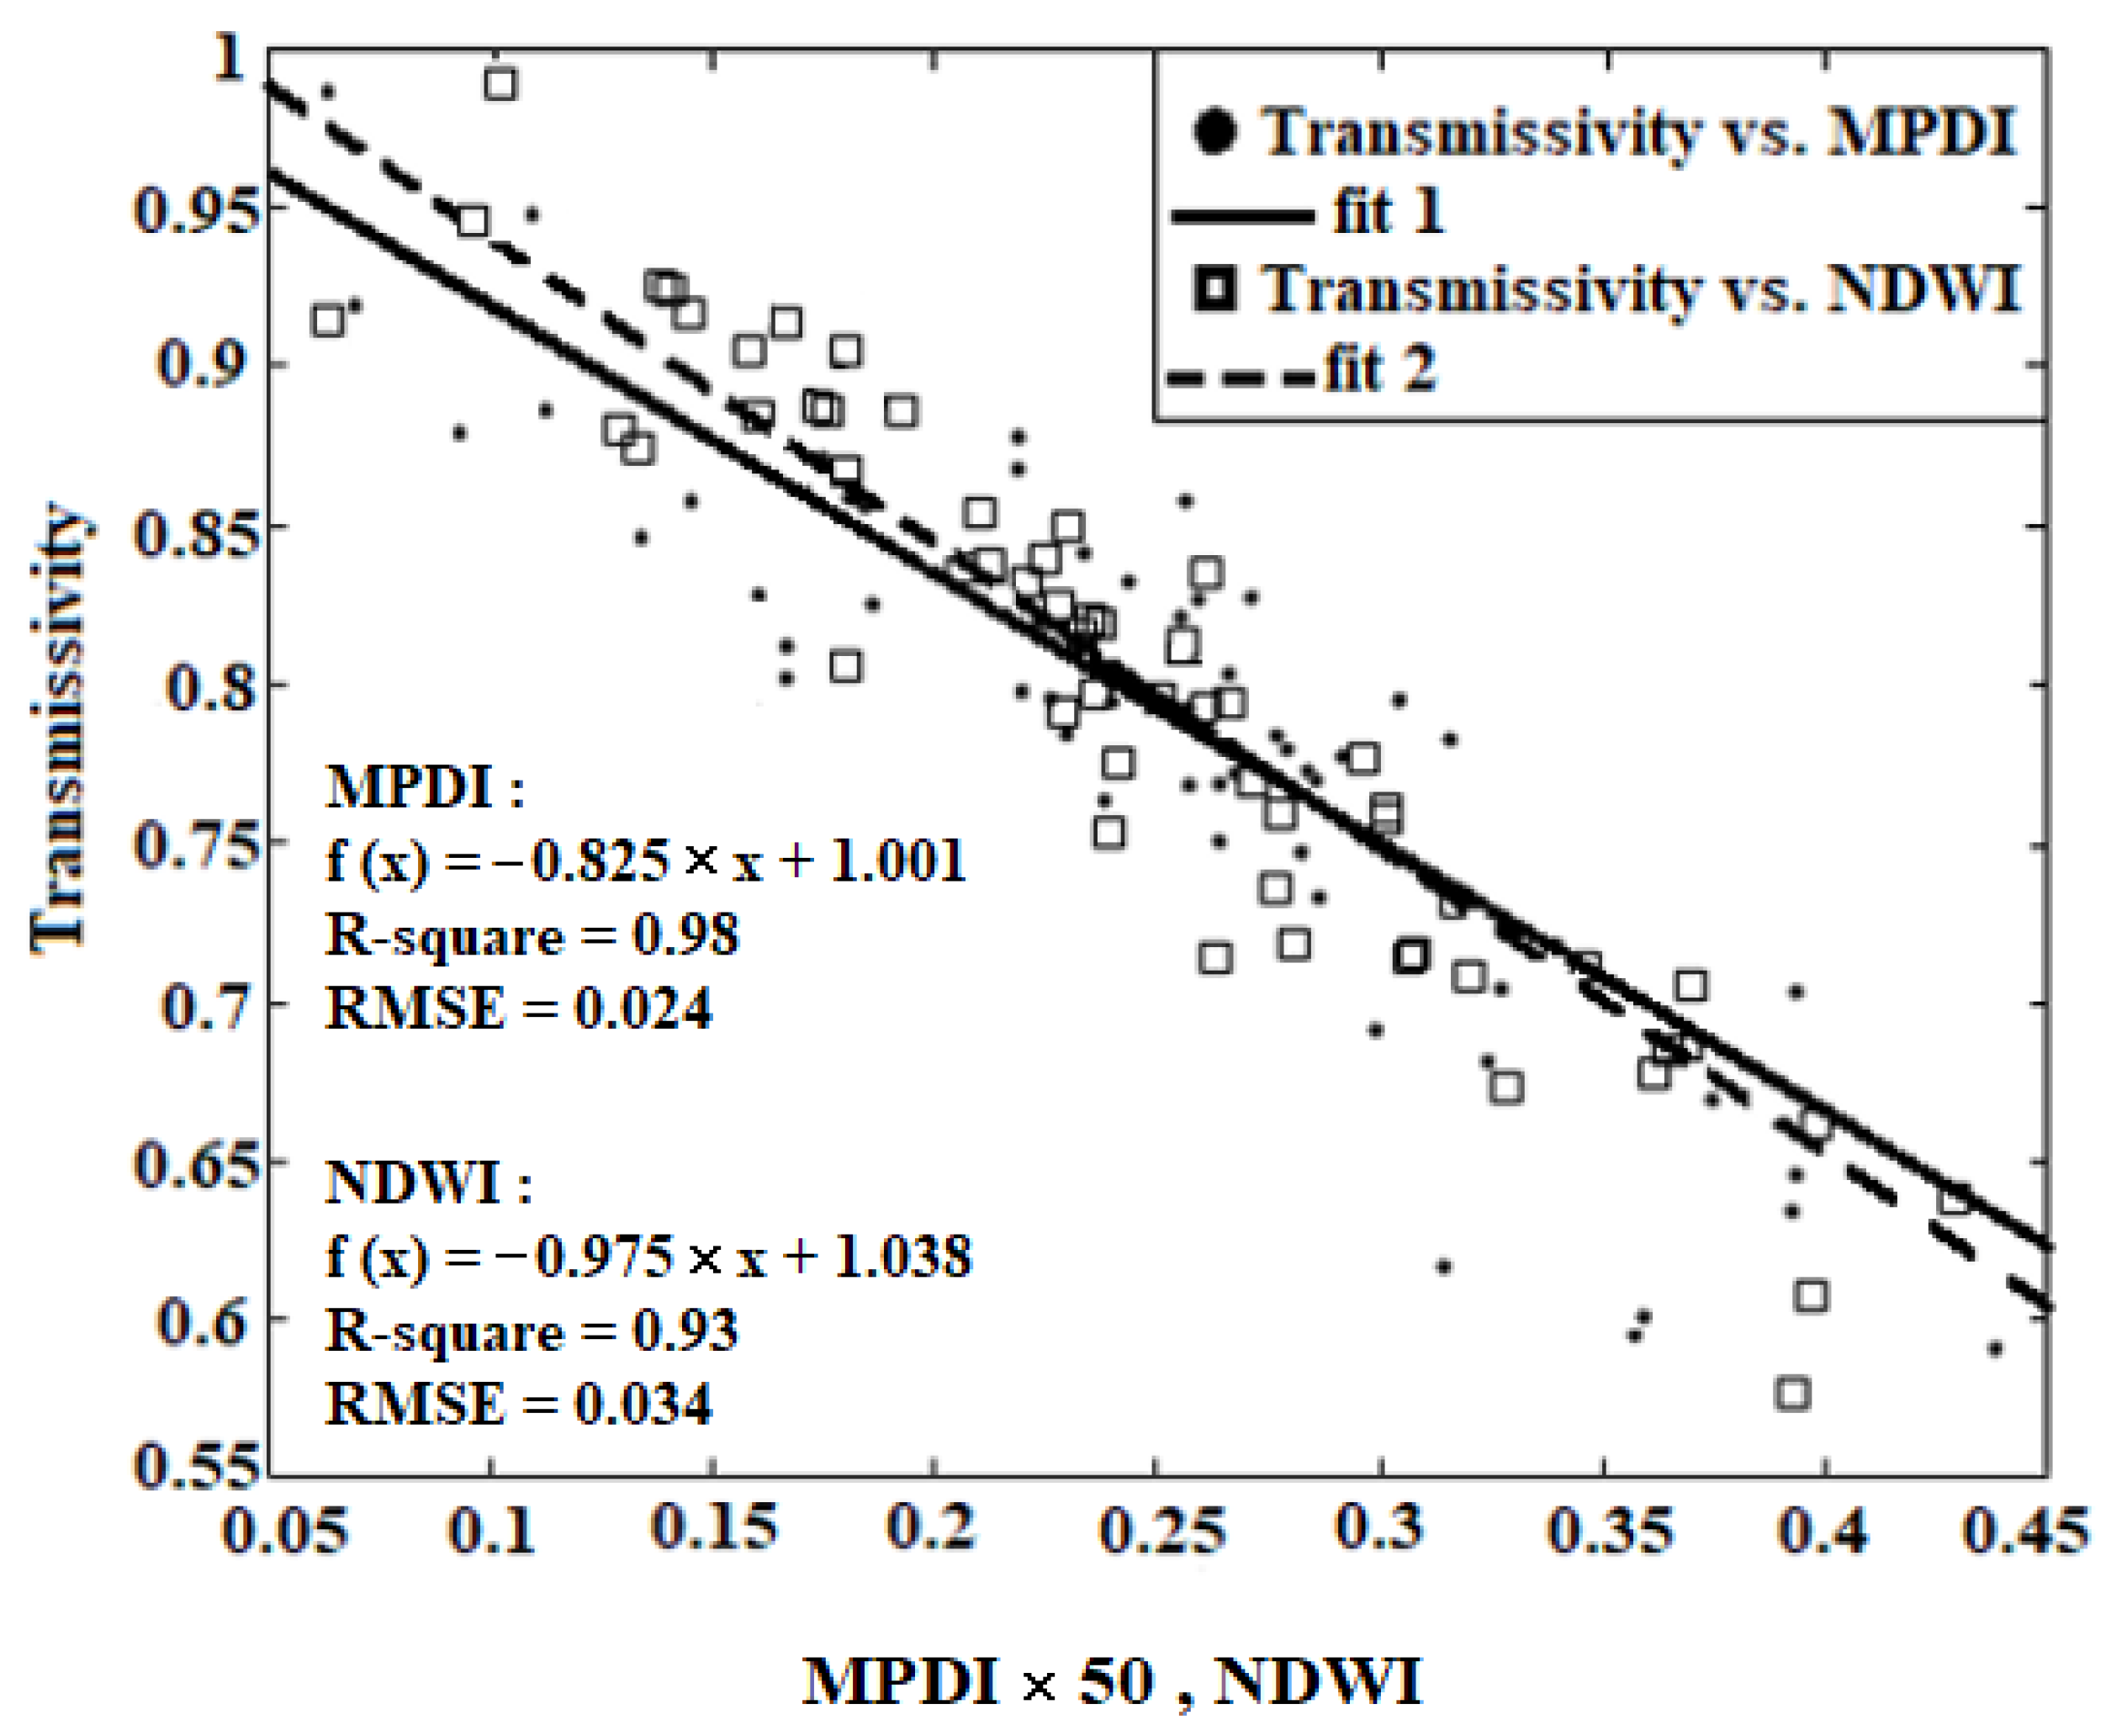
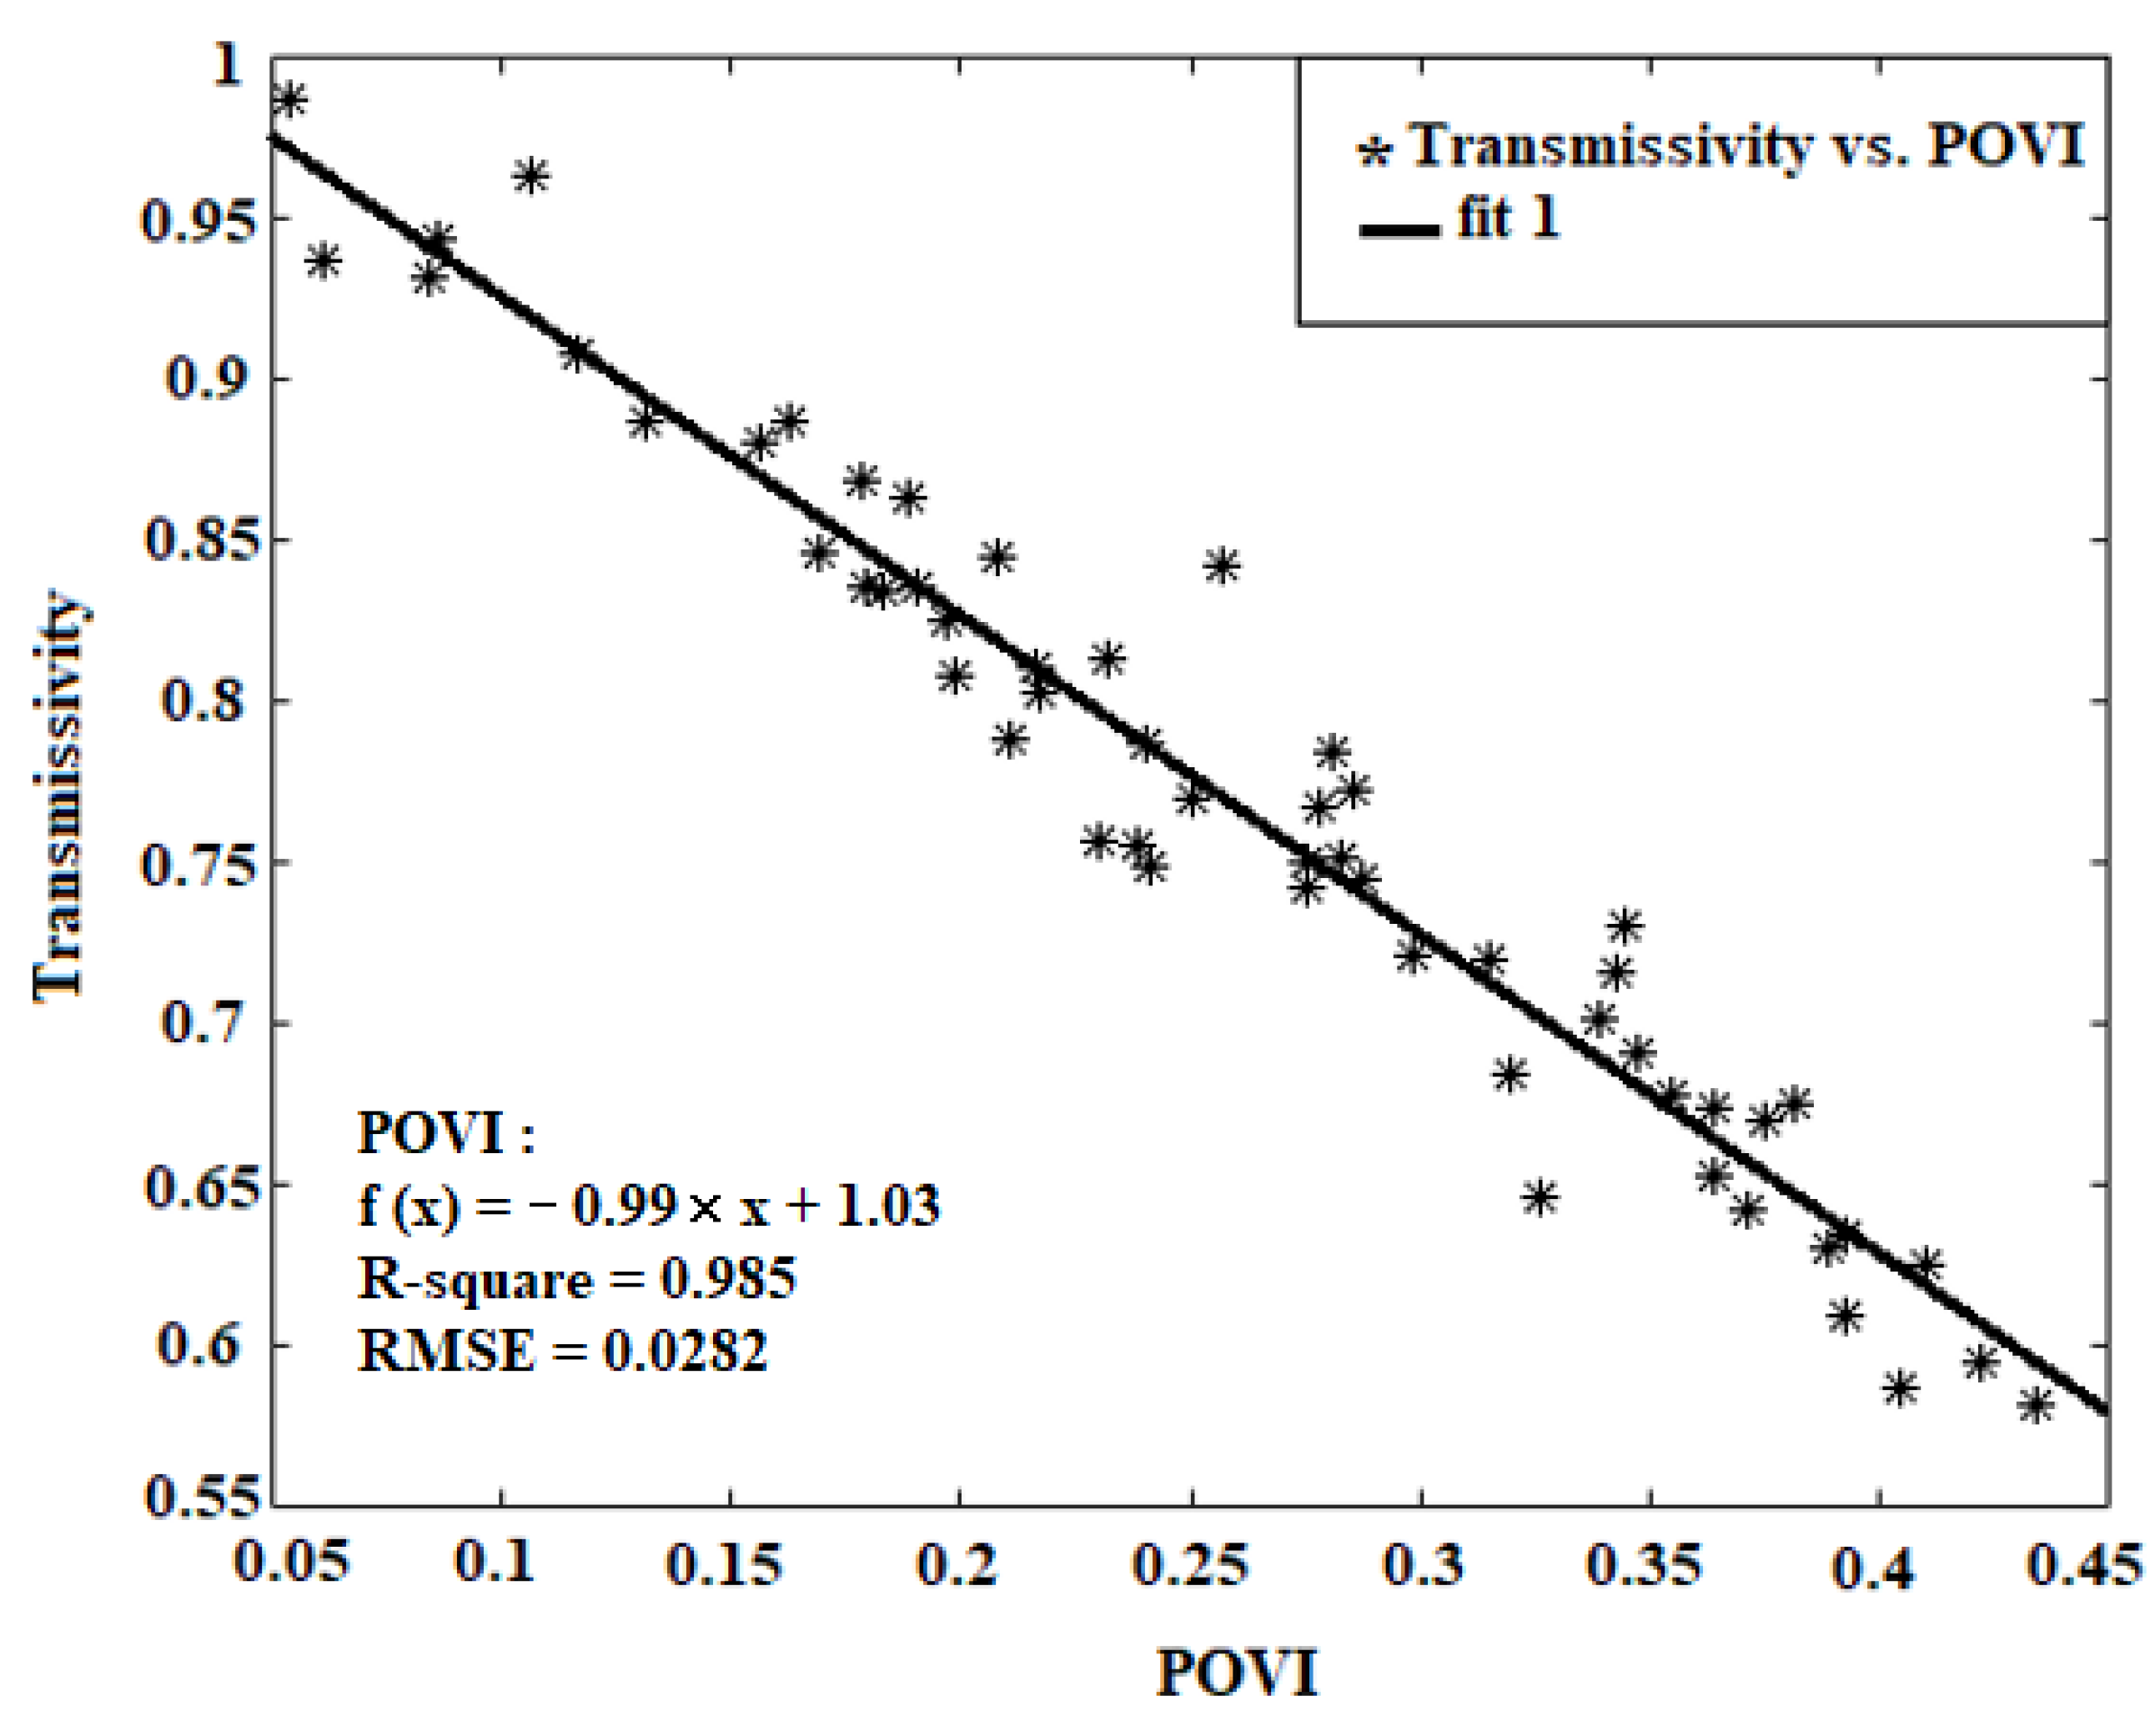
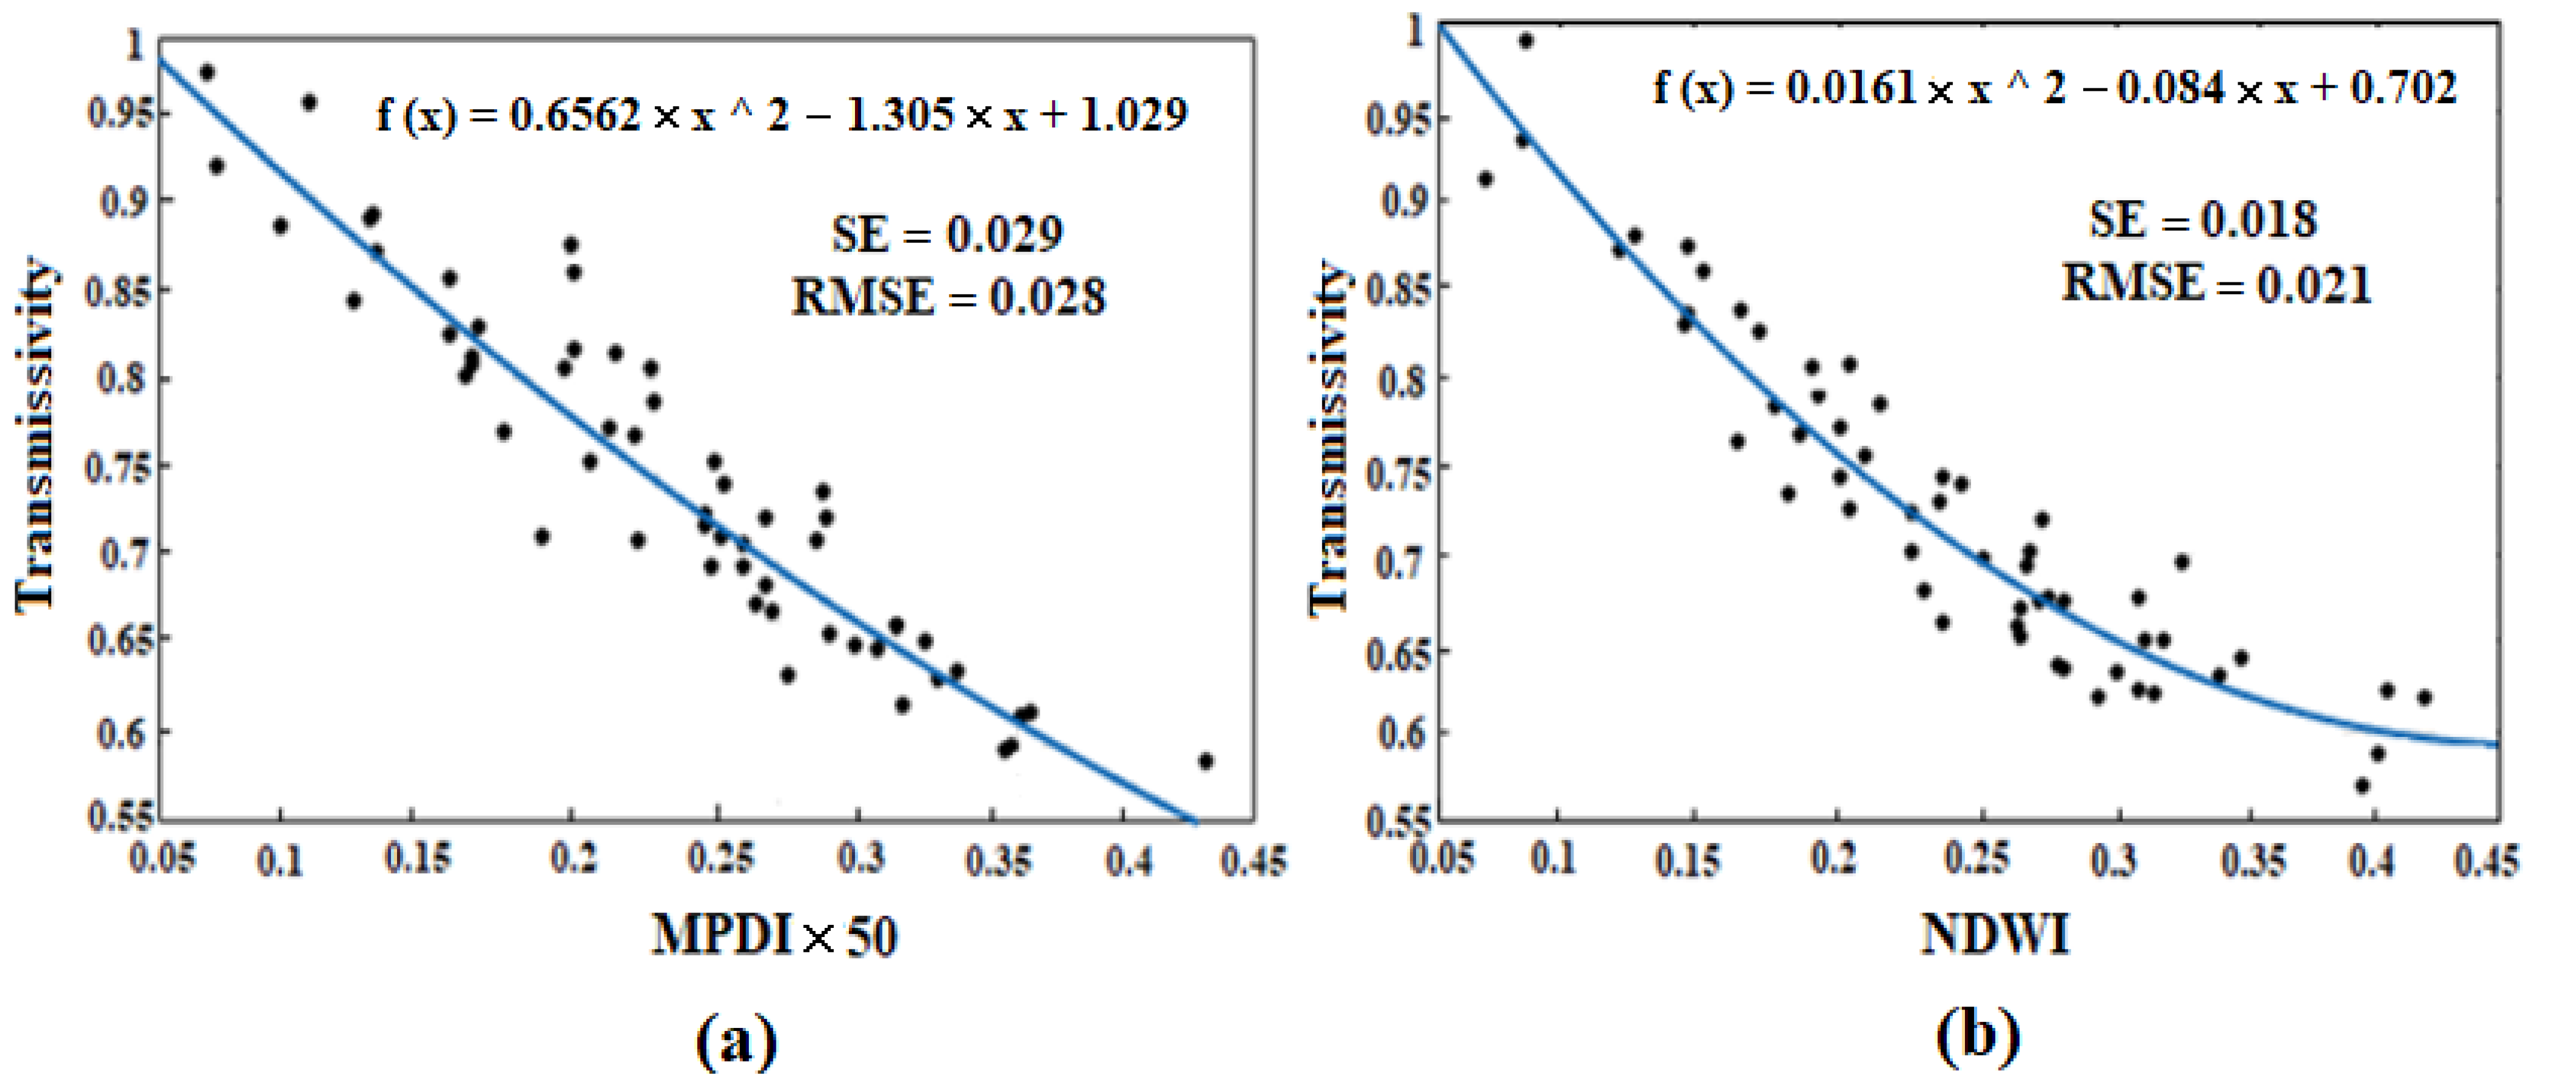
3.2.2. Transmissivity Modelling

Linear, First Order

As observed in Figure 2, the MPDI is more consistent with transmissivity than NDWI; therefore, due to its lower Root-Mean-Square Error (RMSE) and higher contribution in estimating vegetation effect, it should weigh more.
In linear regression, the R2 is the best statistical parameter to determine the degree of compatibility and can be obtained through the weights calculated through Equation (13).
w i = ( R 2 ) i   ( R 2 ) i  
Equation (14) is defined as a linear regression, applied to estimating vegetation transmissivity. The relationship between calculated POVI and vegetation transmissivity using linear regression is shown in Figure 3. The comparison between Figure 2 and Figure 3 indicates that the POVI is less compatible with the transmissivity than that of the MPDI:
Γ = ( a × ( P O V I ) ) + b  
where a and b are the constant coefficients of this equation.
Calculations were made to find the weight and the coefficients of linear regression according to Table 2, to determine the vegetation transmissivity, the SLPRM algorithm is applied and compared against ground measurements.

Nonlinear, Exponential

The exponential correlations between transmissivity and both the NDWI and MPDI are shown in Figure 4. Hence, the nonlinear regression applied in estimating the vegetation transmissivity is expressed through Equation (15):
Γ = e x p ( a × V I / c o s θ )  
where a is a constant coefficient with a value of 100.
As observed, there exists a correlation between Figure 4 and Equation (14). The indices weights are calculated through Equation (16):
w i = ( 1 S E i S E i )  
where, SE is the standard error. In Figure 5, a flowchart is provided for easier understanding of the algorithm and its modifications.

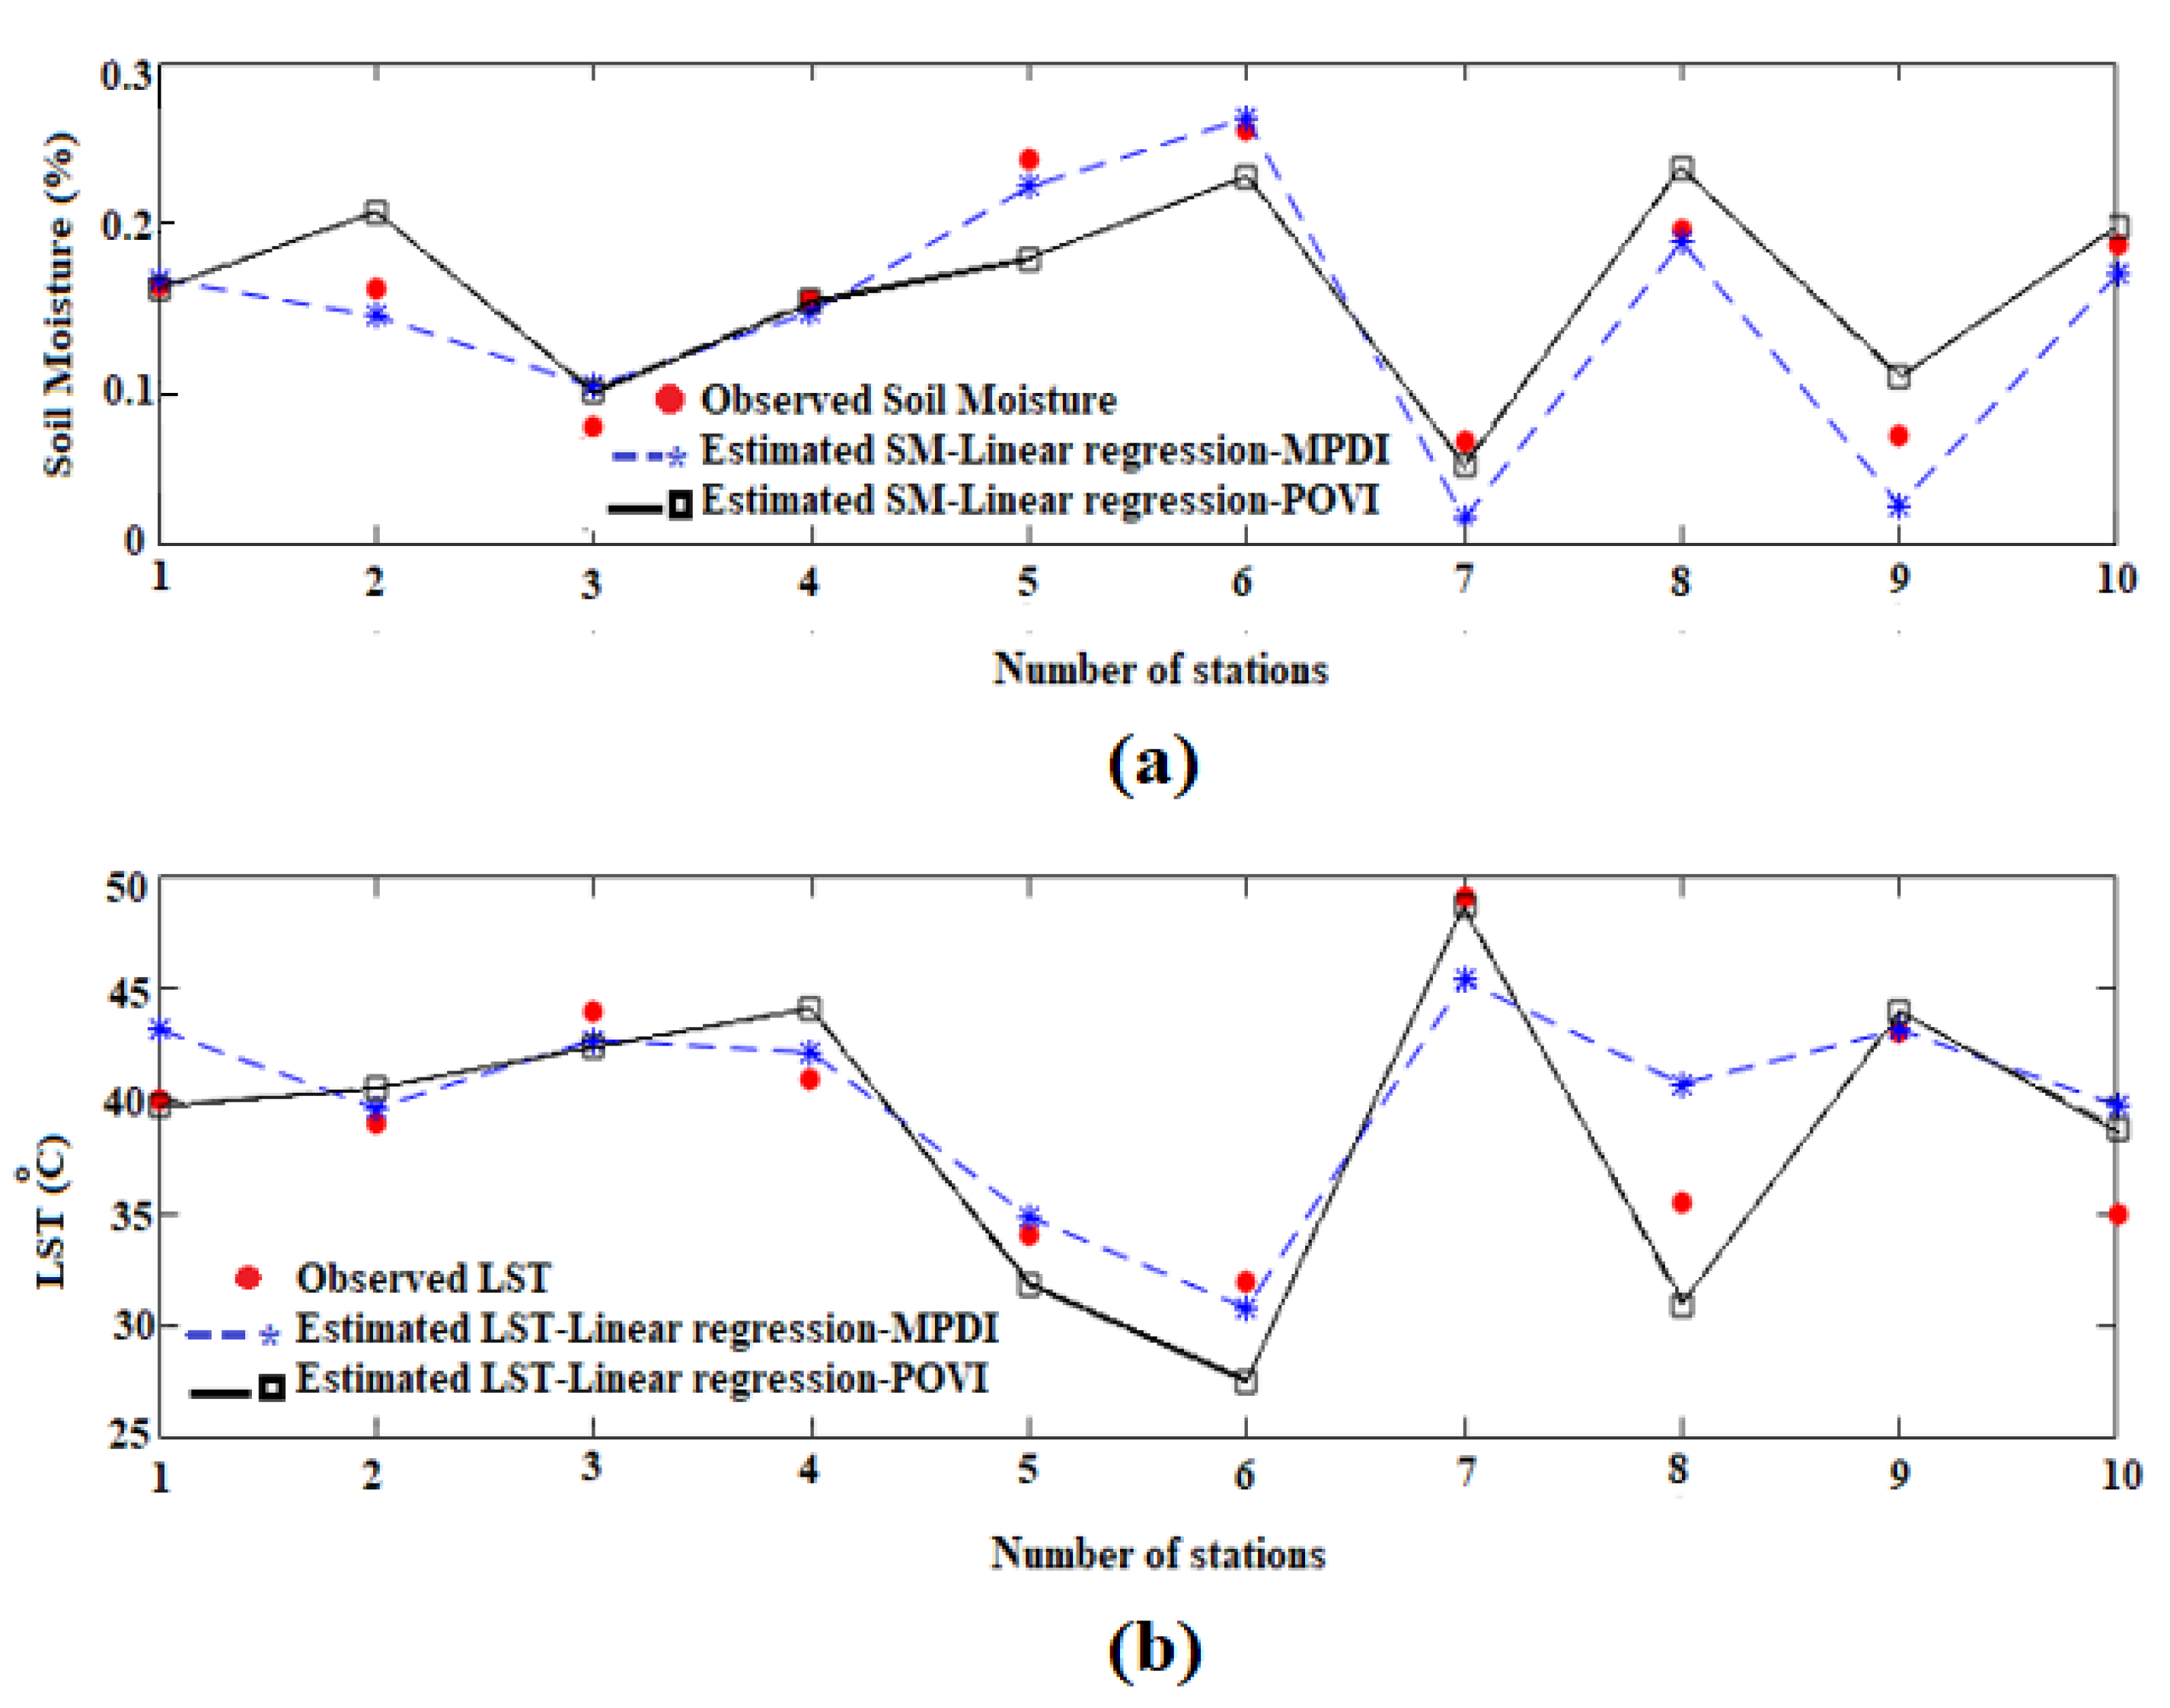
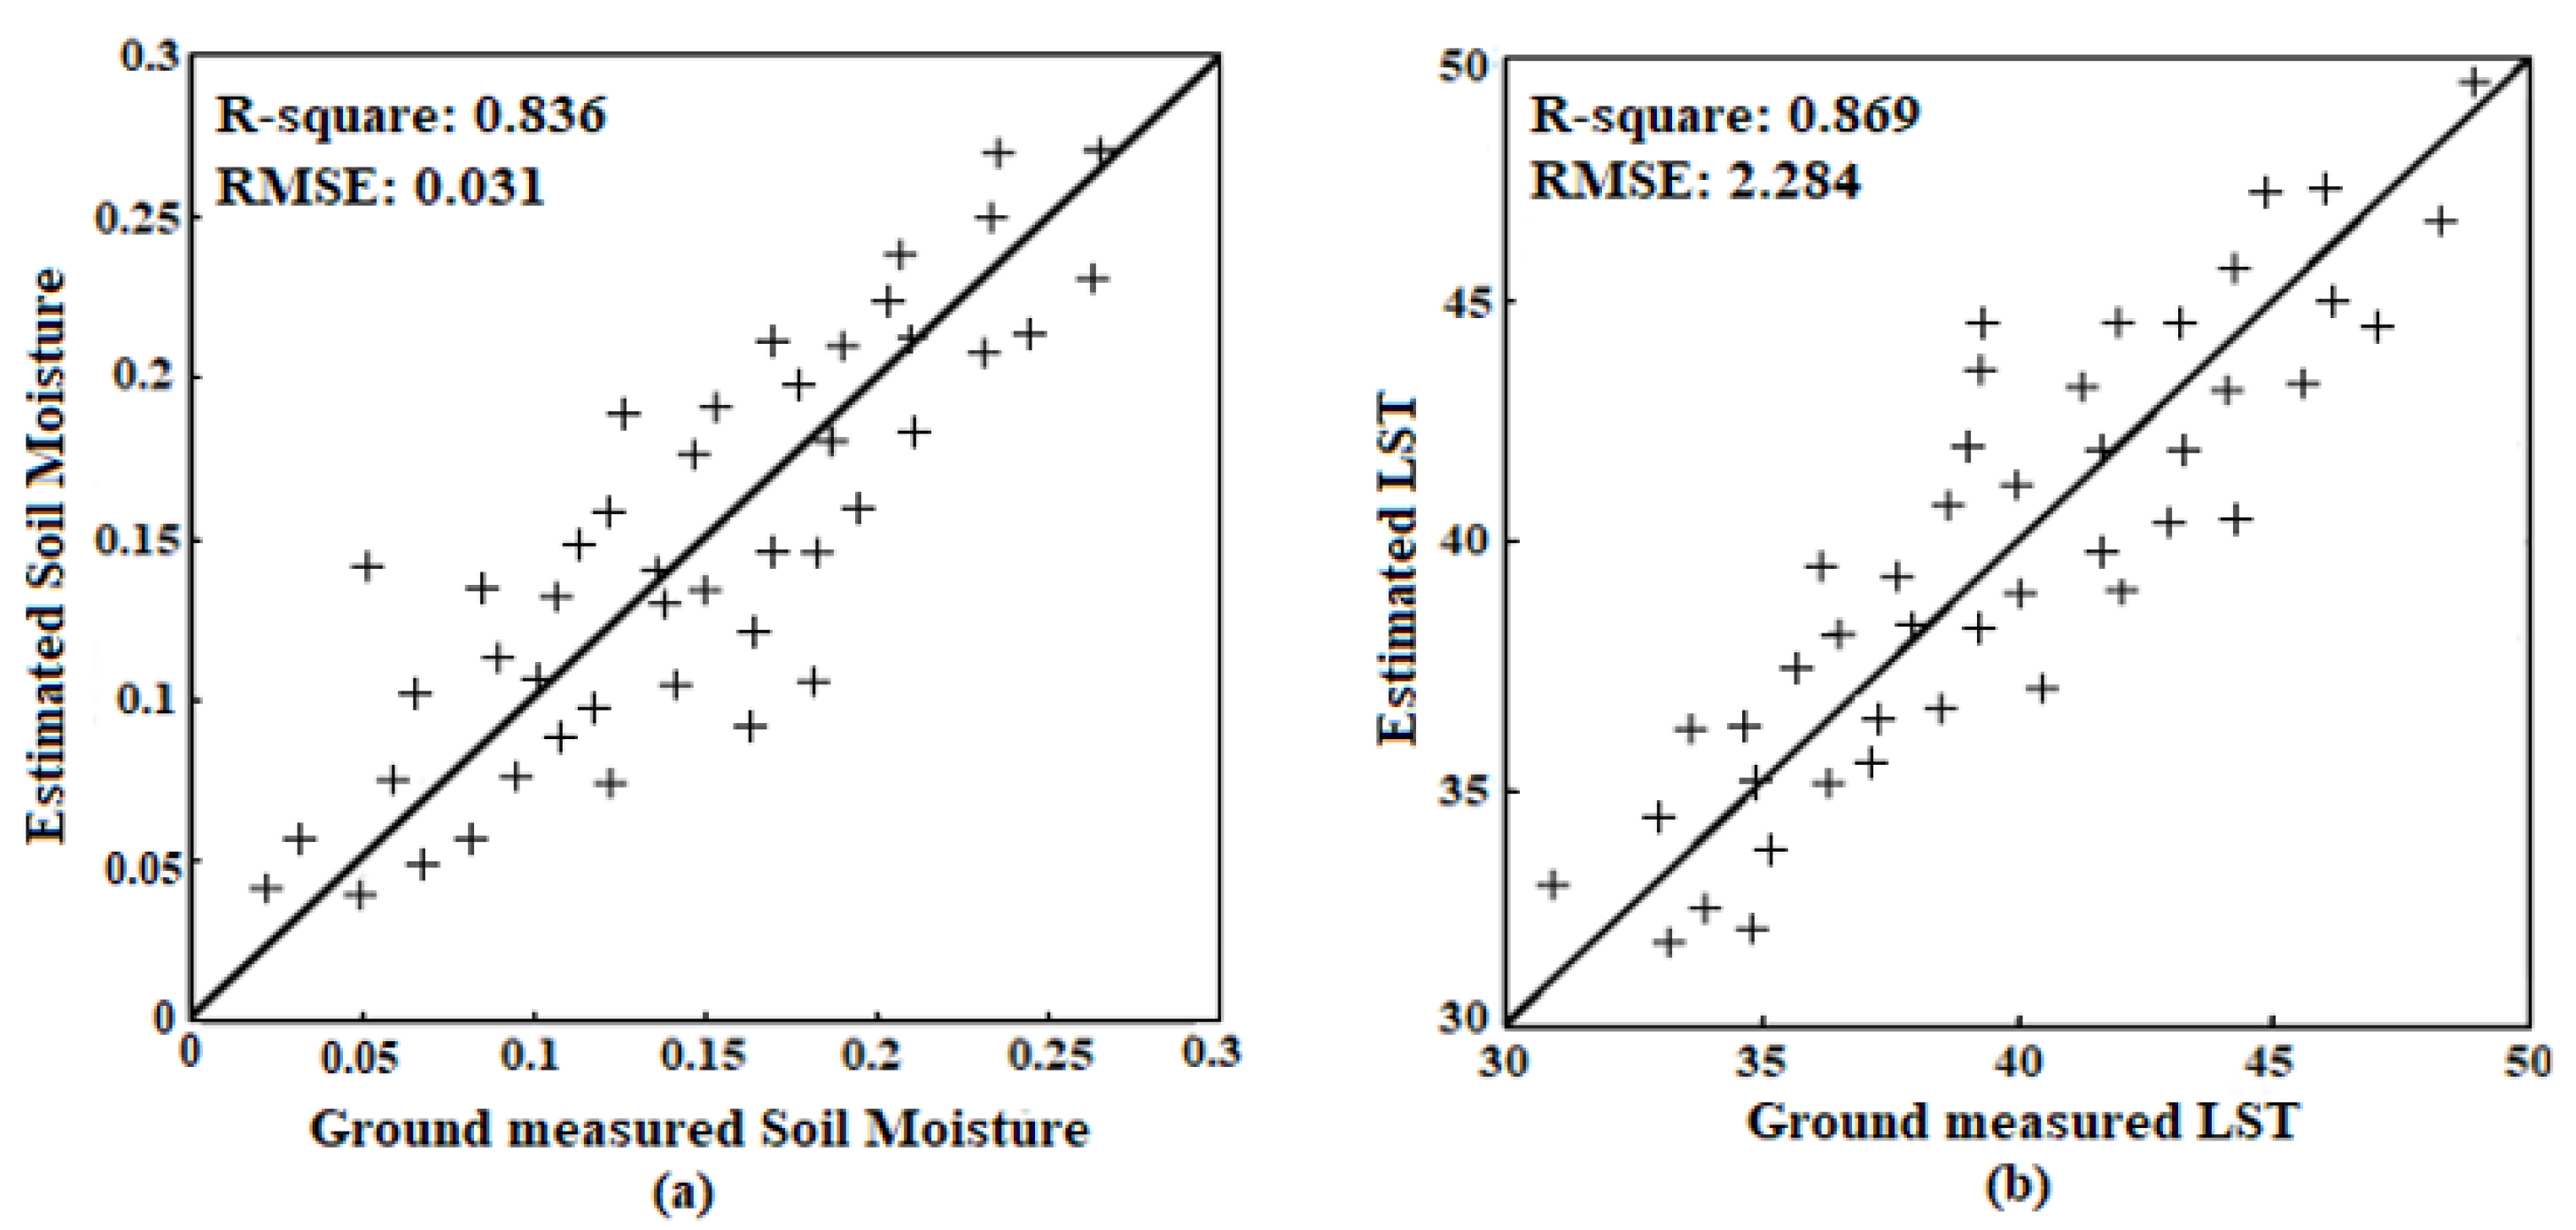
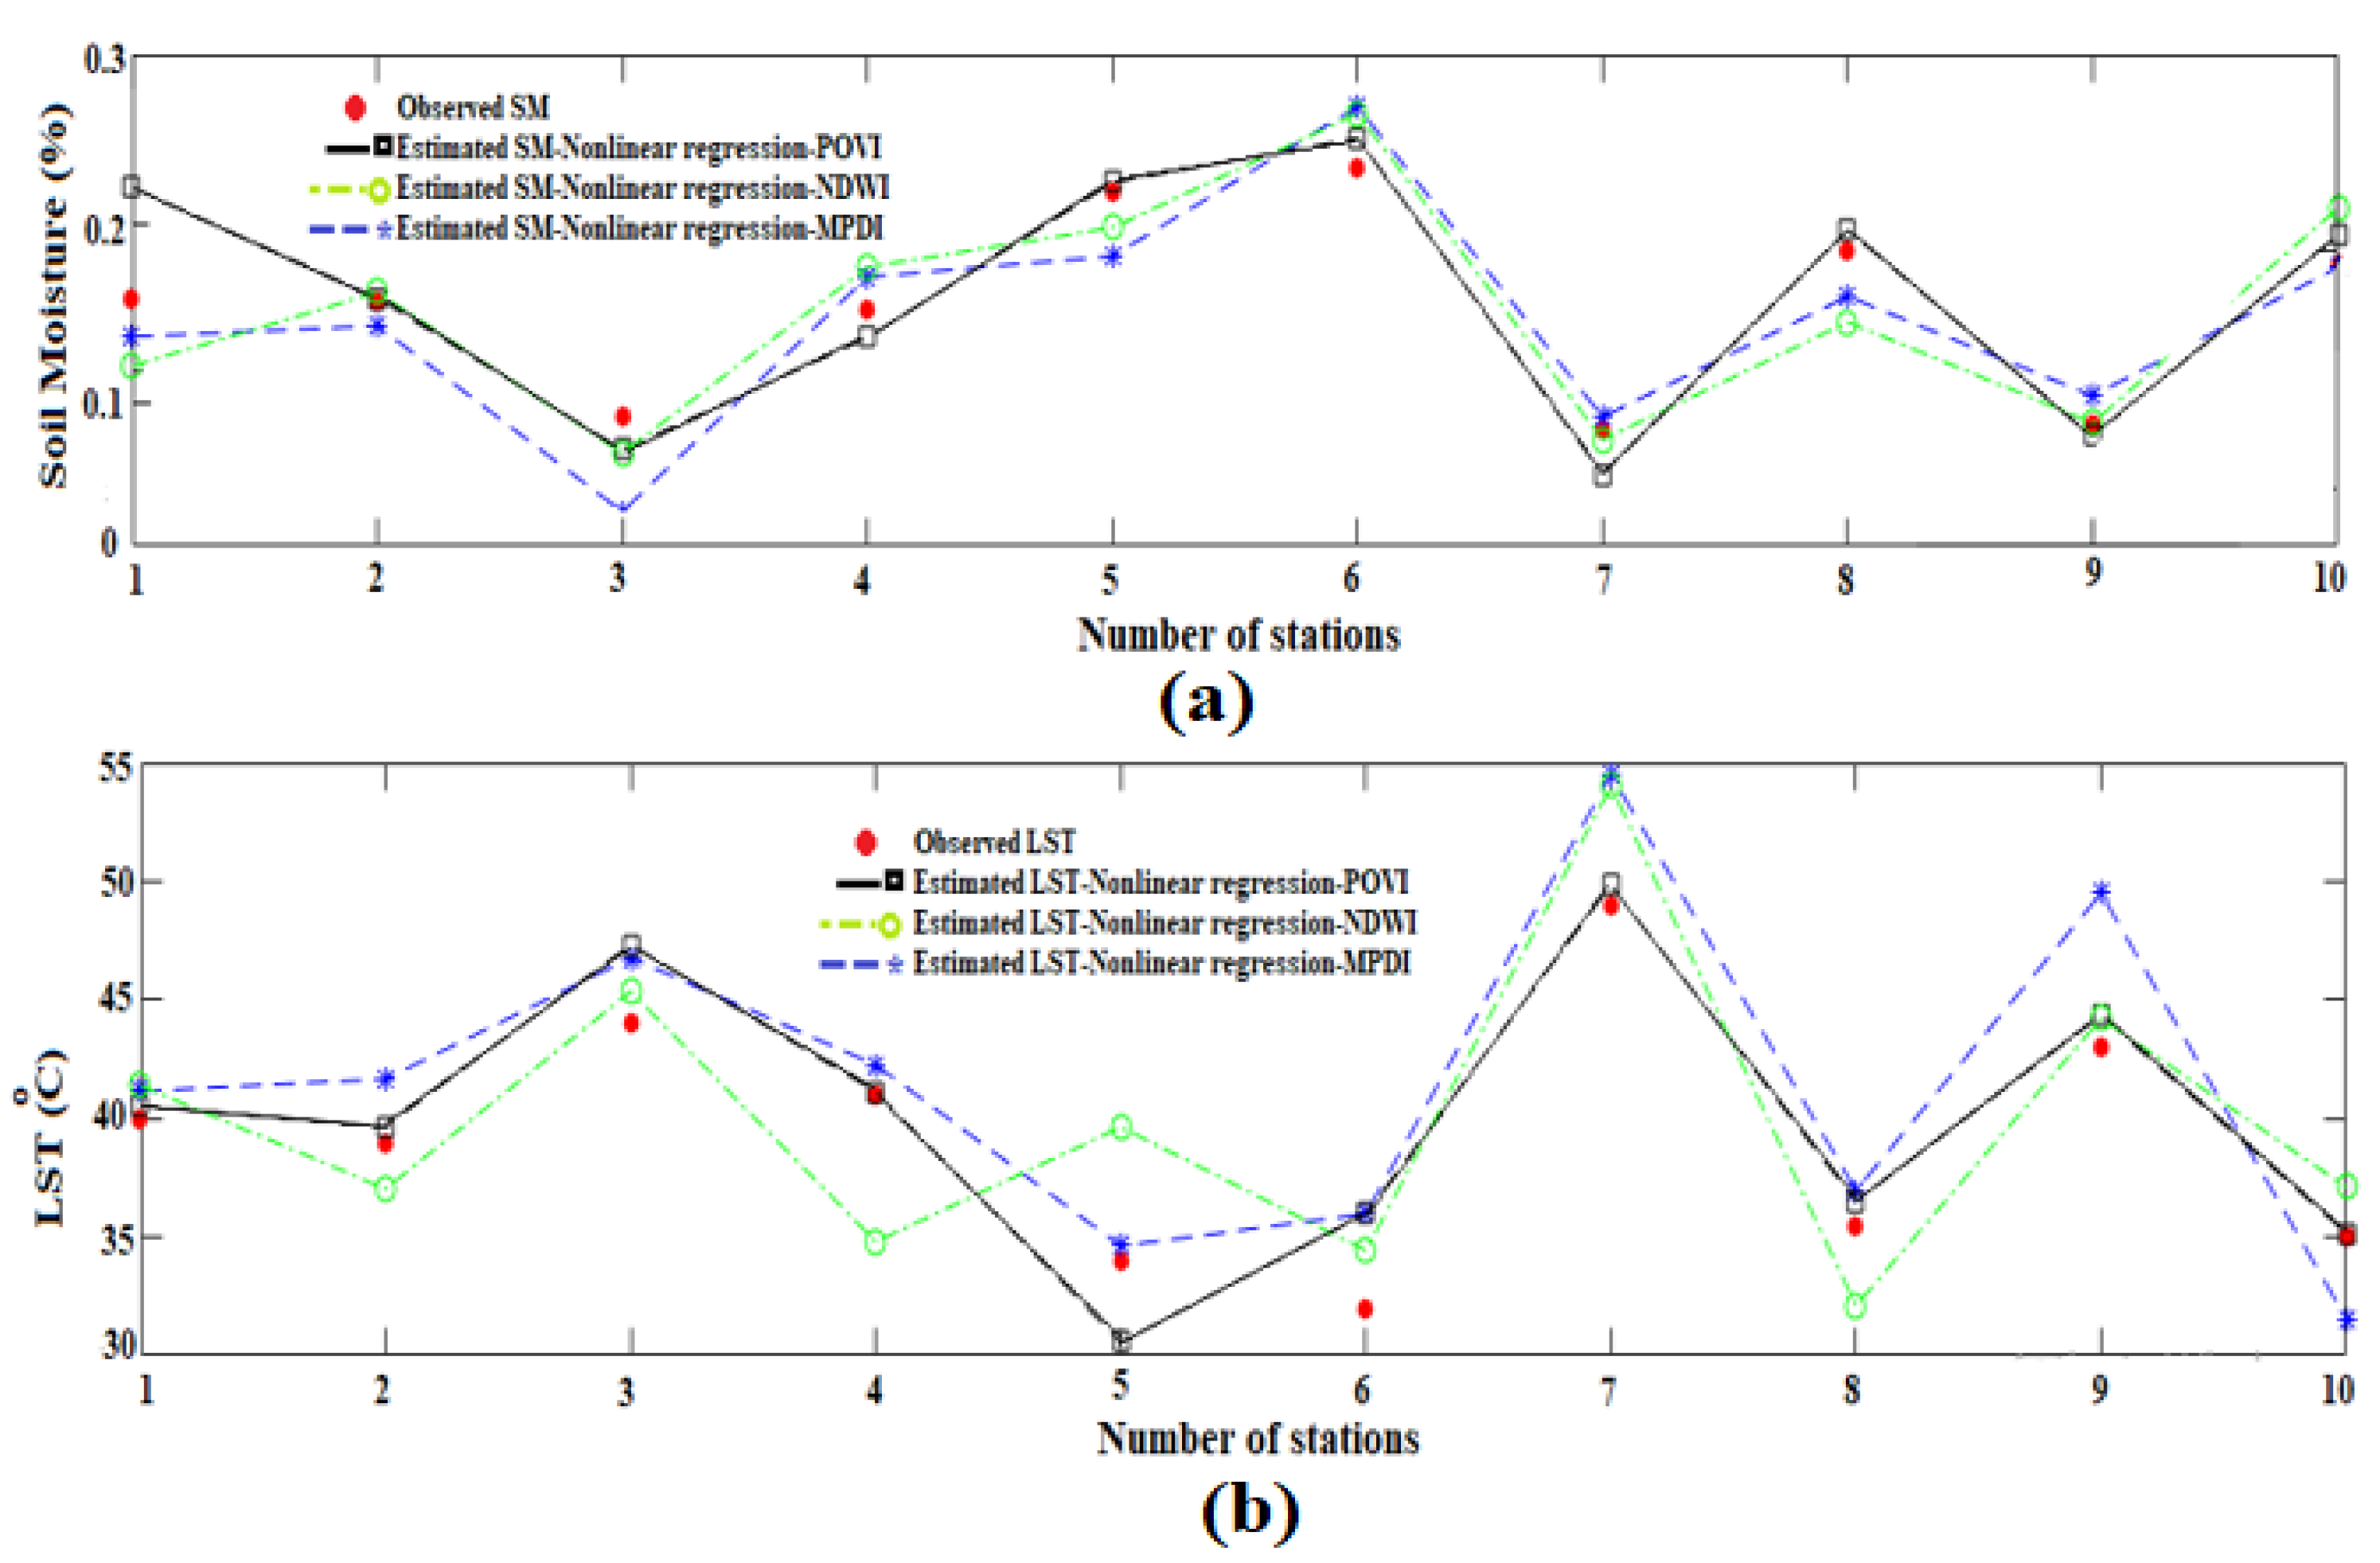
4. Results and Discussion

Vegetation water content is estimated together with VSM, LST and TC through an improved physical model. In order to improve the surface parameters retrieval accuracy, the surface roughness is inserted in the SLPRM algorithm. In this study to improve the performance of this retrieval algorithm, the POVI is introduced and evaluated in estimating VWC and therefore, vegetation effects modelling. Here, the equations developed can estimate vegetation transmissivity from the POVI. Surface roughness (sig/cl) of constant amount is considered as 0.12, which is the average of regional roughness. As a general result, the comparison between the accuracies of VSM and LST retrieval through the two different linear and nonlinear regression can be made according to Table 2. The RMSE of VSM and LST retrieval based on the linear regression are also tabulated in Table 2. The findings related to the implementation of the linear regression with POVI and MPDI are provided in Figure 6. In this figure, a comparison is made between the observed and retrieved parameters in ten stations. As mentioned, the observations of the last three stations, which are the checkpoints, are used to estimate the retrieval accuracy.
According to Figure 6 and as observed in Table 2, the RMSE of VSM and LST retrievals through linear regression and POVI are obtained as 0.044 (m3/m3) and 3.03 °C, respectively. While, if only the MPDI is applied, these values fall to 0.042 (m3/m3) and 2.91 °C, which indicates the better performance of MPDI. In the first where a linear correlation is applied between vegetation indices and transmissivity, there is a reduction in accuracy of the VSM and LST, compared with the condition where only MPDI is applied. Unlike the linear regression model, in the second case, the integration of indices increases the accuracy of the VSM and LST, as compared to MPDI and NDWI.
In the nonlinear regression model, the weights and coefficients of nonlinear regression are calculated and given in Table 2, the SLPRM algorithm is applied in VSM, LST and TC retrieval. By applying the ground measurements, the overall accuracy of the retrieved soil parameter is estimated. The RMSE of VSM and LST retrieval based on the nonlinear regression are given in Table 2. A comparison between ground measurement, and retrieved parameters, where the nonlinear regression is applied based on MPDI, NDWI and POVI, are shown in Figure 7. As observed, the RMSE of retrieved VSM and LST, where the nonlinear regression is applied, are obtained as 0.038 (m3/m3) and 2.81 °C, respectively, with MPDI. If the POVI is applied, these values also fall to 0.031 (m3/m3) and 2.28 °C, which indicates the better performance of POVI. It should be noted that using the NDWI alone instead of the MPDI, also improves the accuracy of VSM and LST retrieval by about 0.05% and 0.49 °C. As observed in Figure 4, there exist exponential correlations between vegetation transmissivity and both NDWI and MPDI. This exponential relationship of NDWI is even more visible. For this reason, the insertion of the NDWI into the linear regression will weaken the performance of the algorithm and ultimately reduce the retrieval accuracy.
While in nonlinear regression, the presence of the NDWI contributes to the better performance of the algorithm. In other words, the integration of NDWI with the MPDI in constructing the new vegetation index, i.e., POVI, increases the retrieval accuracy, only in nonlinear regression model. Moreover, a comparison has been made between measured and the most accurately estimated parameters, through nonlinear regression and POVI, at three check stations in 16 dates that shown in Figure 8. Note that, the in situ data are point measurements of soil moisture in the top 6 cm profile, whereas satellite provide measurement at some foot print, which may cause a spatial mismatch and some error in validation. However, in comparing with other methods [11,21,22], the RMSE values suggest that this improved SLPRM algorithm is sufficiently reliable to allow the estimates of all above mentioned parameters in the tested sites.
The accuracy of parameters retrieval is statistically improved when a nonlinear correlation is considered between VWC and vegetation transmissivity, as well as the aggregation of passive microwave and optical (VIs/IR) indices due to their sensitivity to the vegetation. It is more appropriate to apply passive microwave and optical (VIs/IR) observations on different platforms, like the AMSR2 and the MODIS observations, as applied in this study [6]. In addition to proper modelling of the VWC effects on BT, considering the roughness in the SLPRM is one of the reasons for the algorithm’s success. The study reveals that the changes in surface roughness also influence the emissivity of natural surfaces, and therefore, its modelling in physical soil moisture retrieval algorithms is of great importance. Furthermore, due to the fact that different soil parameters are affected by each other, establishing a proper relationship between different parameters is the key to have more accurate retrievals. In this study, an algorithm for retrieving three parameters simultaneously is presented. Due to the possibility of observing two parameters of soil moisture and temperature, the accuracy of these two retrieved parameters has been evaluated. Although the ground observation of the canopy temperature parameter is not possible, simultaneous retrieval of this parameter along with two other parameters improves their retrieval accuracy.

5. Conclusions

In this study, soil moisture, canopy temperature and land surface temperature were obtained by applying the SLPRM model at different levels of vegetation density, validated by using ground sensor data like soil moisture and soil temperature. Through this study, an attempt has been made to integrate passive microwave AMSR2 data and optical (Vis/IR) MODIS. Both linear and nonlinear models were tested for estimating the VWC indices and vegetation transmissivity. A new index called POVI, resulting from integration of two sensors data, has been developed for an improved VWC estimation and ultimately soil moisture retrieval.
The study showed that it is possible to estimate soil parameters with an improvement accuracy of about 20%, by applying different sensors for vegetation modelling in the SLPRM algorithm. Due to the possibility of extracting valuable information, this capability may be useful in climatic, agricultural, and soil moisture retrieval studies. This newly devised method allows the modelling of surface roughness and vegetation effects at AMSR2 spatial scale in addition to retrieving reliable, acceptable and accurate soil parameters from satellite observations. Further studies in expanding this algorithm could focus on evaluation of soil parameters retrieval in specific regions (high vegetative areas) and testing other vegetation indices by inclusion of more sensors.

Author Contributions

Conceptualization, M.M. and P.K.S.; data curation, M.M.; formal analysis, M.M.; funding acquisition, P.K.S. and G.P.P.; investigation, P.K.S. and G.P.P.; methodology, M.M.; project administration, P.K.S.; resources, G.P.P.; supervision, P.K.S.; validation, M.M.; writing—original draft, M.M.; writing—review and editing, P.K.S. and G.P.P. All authors have read and agreed to the published version of the manuscript.

Funding

This research received no external funding.

Institutional Review Board Statement

Not applicable.

Informed Consent Statement

Not applicable.

Data Availability Statement

All the datasets used in this study are freely available.

Acknowledgments

Thank you to Banaras Hindu University for providing the support.

Conflicts of Interest

The authors declare no conflict of interest.

References

  1. Sun, F.; Lü, Y.; Wang, J.; Hu, J.; Fu, B. Soil moisture dynamics of typical ecosystems in response to precipitation: A monitoring-based analysis of hydrological service in the Qilian Mountains. Catena 2015, 129, 63–75. [Google Scholar] [CrossRef]
  2. Entekhabi, D.; Reichle, R.H.; Koster, R.D.; Crow, W.T. Performance metrics for soil moisture retrievals and application requirements. J. Hydrometeorol. 2010, 11, 832–840. [Google Scholar] [CrossRef]
  3. Walker, J.P.; Houser, P.R. Requirements of a global near-surface soil moisture satellite mission: Accuracy, repeat time, and spatial resolution. Adv. Water Resour. 2004, 27, 785–801. [Google Scholar] [CrossRef]
  4. Srivastava, P.K. Satellite soil moisture: Review of theory and applications in water resources. Water Resour. Manag. 2017, 31, 3161–3176. [Google Scholar] [CrossRef]
  5. Chanzy, A. Basic soil surface characteristics derived from active microwave remote sensing. Remote Sens. Rev. 1993, 7, 303–319. [Google Scholar] [CrossRef]
  6. Li, Q.; Zhong, R.; Huang, J.; Gong, H. Comparison of two retrieval methods with combined passive and active microwave remote sensing observations for soil moisture. Math. Comput. Model. 2011, 54, 1181–1193. [Google Scholar] [CrossRef]
  7. Njoku, E.G.; Chan, S.K. Vegetation and surface roughness effects on AMSR-E land observations. Remote Sens. Environ. 2006, 100, 190–199. [Google Scholar] [CrossRef]
  8. Colliander, A.; Chan, S.; Kim, S.-b.; Das, N.; Yueh, S.; Cosh, M.; Bindlish, R.; Jackson, T.; Njoku, E. Long term analysis of PALS soil moisture campaign measurements for global soil moisture algorithm development. Remote Sens. Environ. 2012, 121, 309–322. [Google Scholar] [CrossRef]
  9. Srivastava, P.K.; Han, D.; Ramirez, M.A.; O’Neill, P.; Islam, T.; Gupta, M. Assessment of SMOS soil moisture retrieval parameters using tau-omega algorithms for soil moisture deficit estimation. J. Hydrol. 2014, 519, 574–587. [Google Scholar] [CrossRef] [Green Version]
  10. Gao, Z.; Xu, X.; Wang, J.; Yang, H.; Huang, W.; Feng, H. A method of estimating soil moisture based on the linear decomposition of mixture pixels. Math. Comput. Model. 2013, 58, 606–613. [Google Scholar] [CrossRef]
  11. Owe, M.; de Jeu, R.; Walker, J. A methodology for surface soil moisture and vegetation optical depth retrieval using the microwave polarization difference index. IEEE Trans. Geosci. Remote Sens. 2001, 39, 1643–1654. [Google Scholar] [CrossRef] [Green Version]
  12. Santi, E.; Pettinato, S.; Paloscia, S.; Pampaloni, P.; Macelloni, G.; Brogioni, M. An algorithm for generating soil moisture and snow depth maps from microwave spaceborne radiometers: HydroAlgo. Hydrol. Earth Syst. Sci. 2012, 16, 3659–3676. [Google Scholar] [CrossRef] [Green Version]
  13. El Hajj, M.; Baghdadi, N.; Bazzi, H.; Zribi, M. Penetration analysis of SAR signals in the C and L bands for wheat, maize, and grasslands. Remote Sens. 2019, 11, 31. [Google Scholar] [CrossRef] [Green Version]
  14. Petropoulos, G.; Srivastava, P.K.; Ferentinos, K.P.; Hristopoulos, D. Evaluating the capabilities of optical/TIR imaging sensing systems for quantifying soil water content. Geocarto Int. 2020, 35, 494–511. [Google Scholar] [CrossRef]
  15. Yang, S.; Shen, S.; Li, B.; Le Toan, T.; He, W. Rice mapping and monitoring using ENVISAT ASAR data. IEEE Geosci. Remote Sens. Lett. 2008, 5, 108–112. [Google Scholar] [CrossRef]
  16. Moradizadeh, M.; Saradjian, M.R. The effect of roughness in simultaneously retrieval of land surface parameters. Phys. Chem. Earth Parts A/B/C 2016, 94, 127–135. [Google Scholar] [CrossRef]
  17. Mojiri, A.; Jalalian, A. Relationship between growth of Nitraria schoberi and some soil properties. J. Anim. Plant Sci. 2011, 21, 246–250. [Google Scholar]
  18. Dobson, M.C.; Ulaby, F.T.; Hallikainen, M.T.; El-Rayes, M.A. Microwave dielectric behavior of wet soil-Part II: Dielectric mixing models. IEEE Trans. Geosci. Remote Sens. 1985, GE-23, 35–46. [Google Scholar]
  19. Shi, J.; Jiang, L.; Zhang, L.; Chen, K.-S.; Wigneron, J.-P.; Chanzy, A. A parameterized multifrequency-polarization surface emission model. IEEE Trans. Geosci. Remote Sens. 2005, 43, 2831–2841. [Google Scholar]
  20. Gao, B.-C. NDWI—A normalized difference water index for remote sensing of vegetation liquid water from space. Remote Sens. Environ. 1996, 58, 257–266. [Google Scholar] [CrossRef]
  21. Saradjian, M.; Hosseini, M. Soil moisture estimation by using multipolarization SAR image. Adv. Space Res. 2011, 48, 278–286. [Google Scholar] [CrossRef]
  22. Zhao, T.; Shi, J.; Bindlish, R.; Jackson, T.; Cosh, M.; Jiang, L.; Zhang, Z.; Lan, H. Parametric exponentially correlated surface emission model for L-band passive microwave soil moisture retrieval. Phys. Chem. Earth Parts A/B/C 2015, 83, 65–74. [Google Scholar] [CrossRef]
Figure 1. Spatial distribution of the ground stations (Solid black and red squares are locations of calibration and check stations, respectively) and geographic location (Rectangular polygon) of the study region along with the land cover.
Sensors 22 01354 g001
Figure 2. Scatter plots of MPDI and NDWI versus transmissivity using linear regression.
Sensors 22 01354 g002
Figure 3. Scatter plots of POVI—versus transmissivity with linear regression.
Sensors 22 01354 g003
Figure 4. Scatter plots of MPDI (a) and NDWI (b) versus transmissivity.
Sensors 22 01354 g004
Figure 5. Workflow employed in this study.
Sensors 22 01354 g005
Figure 6. Comparison between observed and estimated Soil moisture (a) and Land surface temperature (b) parameters using POVI and MPDI in linear relationship.
Sensors 22 01354 g006
Figure 7. Comparison between observed and estimated Soil moisture (a) and Land surface temperature (b) parameters using POVI, MPDI and NDWI in nonlinear relationship.
Sensors 22 01354 g007
Figure 8. Comparison between measured and estimated parameters using POVI in nonlinear relationship: (a) Soil moisture (%), (b) Land surface temperature (°C).
Sensors 22 01354 g008
Table 1. Details about the satellite datasets used in this study.
SourceUsed ChannelsSpatial ResolutionTemporal ResolutionPurpose
AMSR2/GCOM-W6.9, 10.65 and
18.7 GHz
(v and h polarizations)
25 kmDailyVSM, LST and TC retrieval
AMSR2/GCOM-W36.5 GHz
(v and h polarizations)
25 kmDailyDerivation of MPDI (calculation of vegetation water content)
MODIS/AquaBand 2
(850 nm, NIR),
Band 5
(1240 nm, SWIR)
1 kmDailyCalculation of NDWI
Table 2. VSM- and -LST- retrieval accuracies.
Regression TypeParametersCoefficientsType of INDEXRMSE VSM (m3/m3)RMSE LST (°C)
Linear regressiona = −0.041w1 = 1, w2 = 0MPDI0.0422.92
b = 0.984w1 = 0.513, w2 = 0.486POVI0.0443.03
Nonlinear regressiona = 100w1 = 0.38, w2 = 0.62POVI0.0312.28
w1 = 0, w2 = 1NDWI0.0332.32
w1 = 1, w2 = 0MPDI0.0382.81
Publisher’s Note: MDPI stays neutral with regard to jurisdictional claims in published maps and institutional affiliations.

