
Multi-Mode Ultrasonic Guided Waves Based Damage Detection in L-Bars with Asymmetric Cross-Section with Sum of Multiple Signals Method


Abstract
:1. Introduction
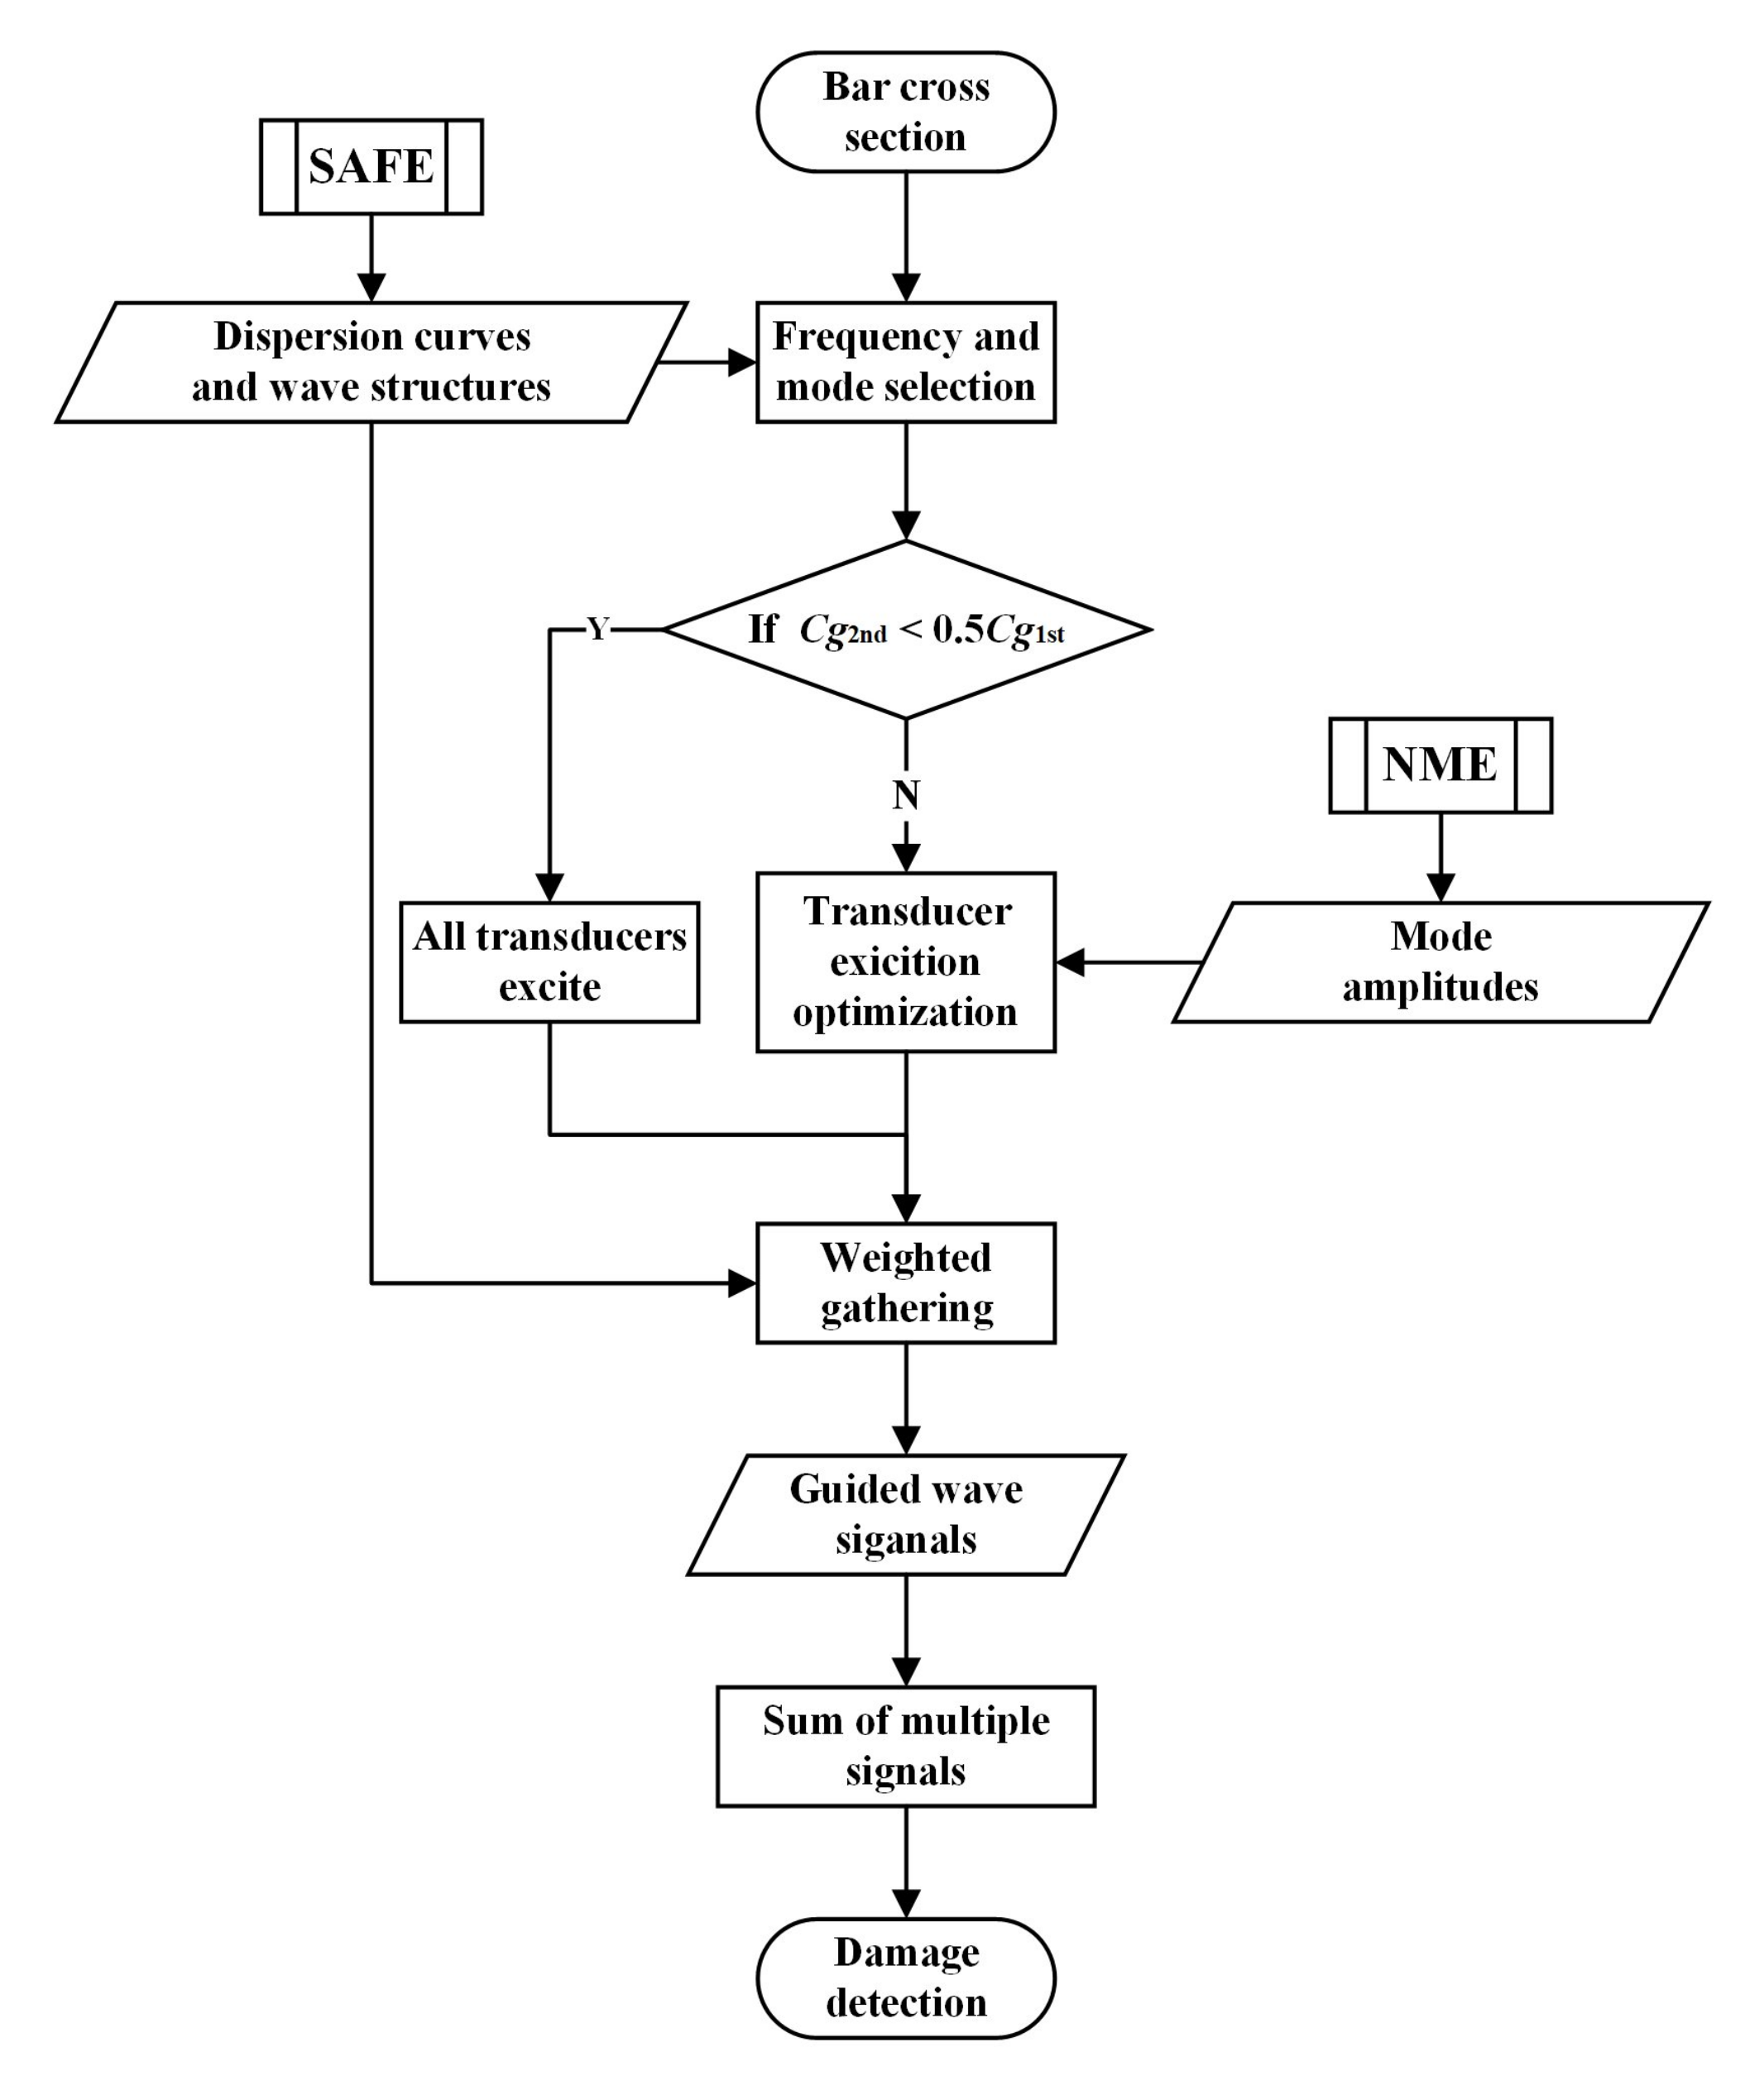
2. Methodology
3. Validation with L-Bar Example
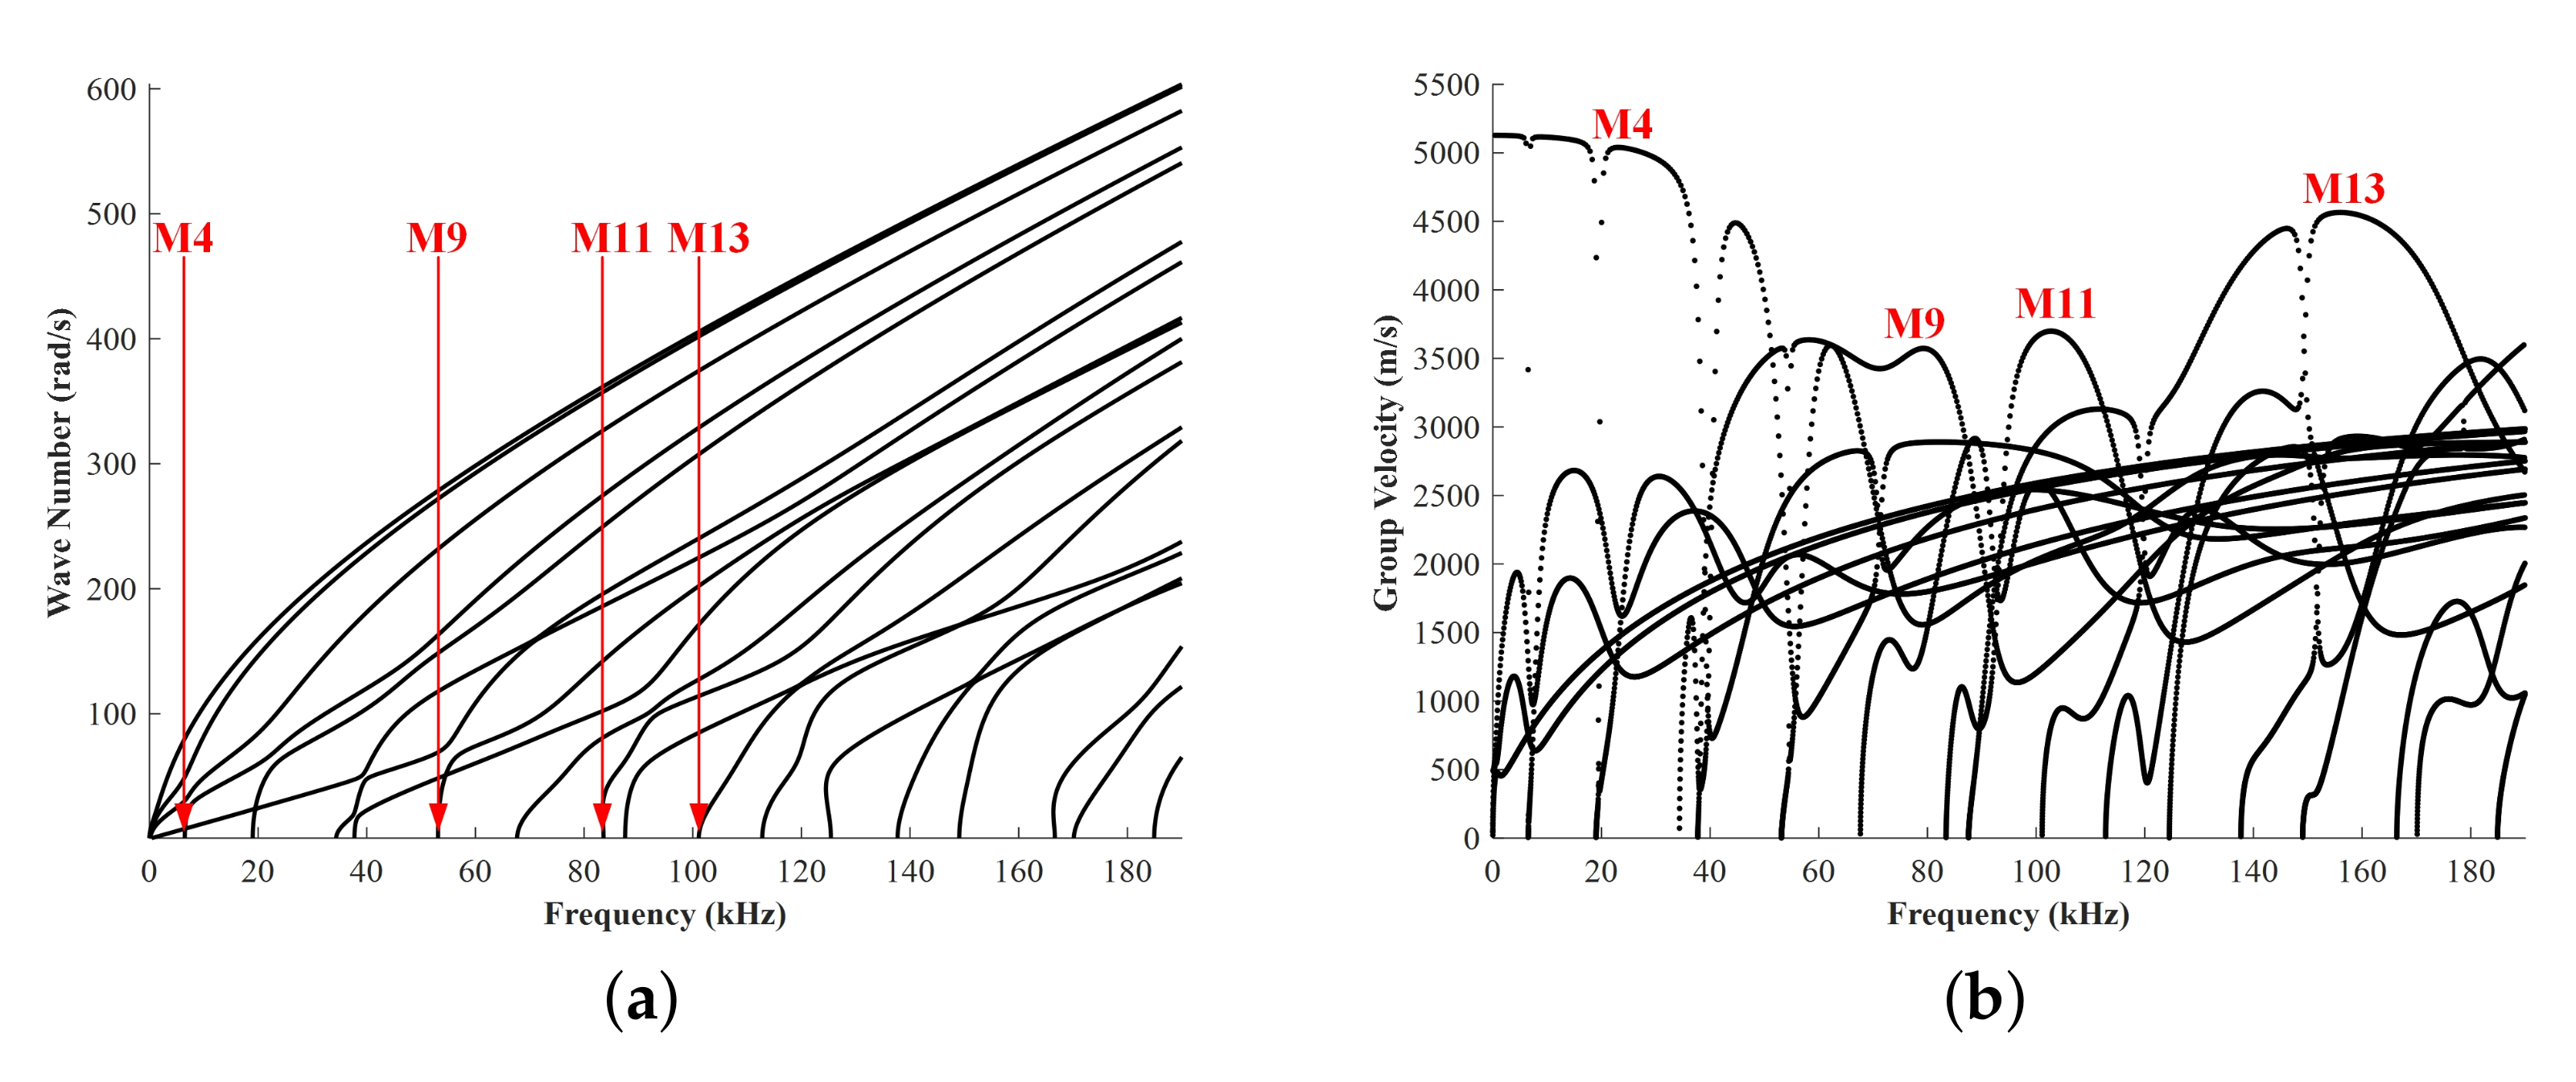
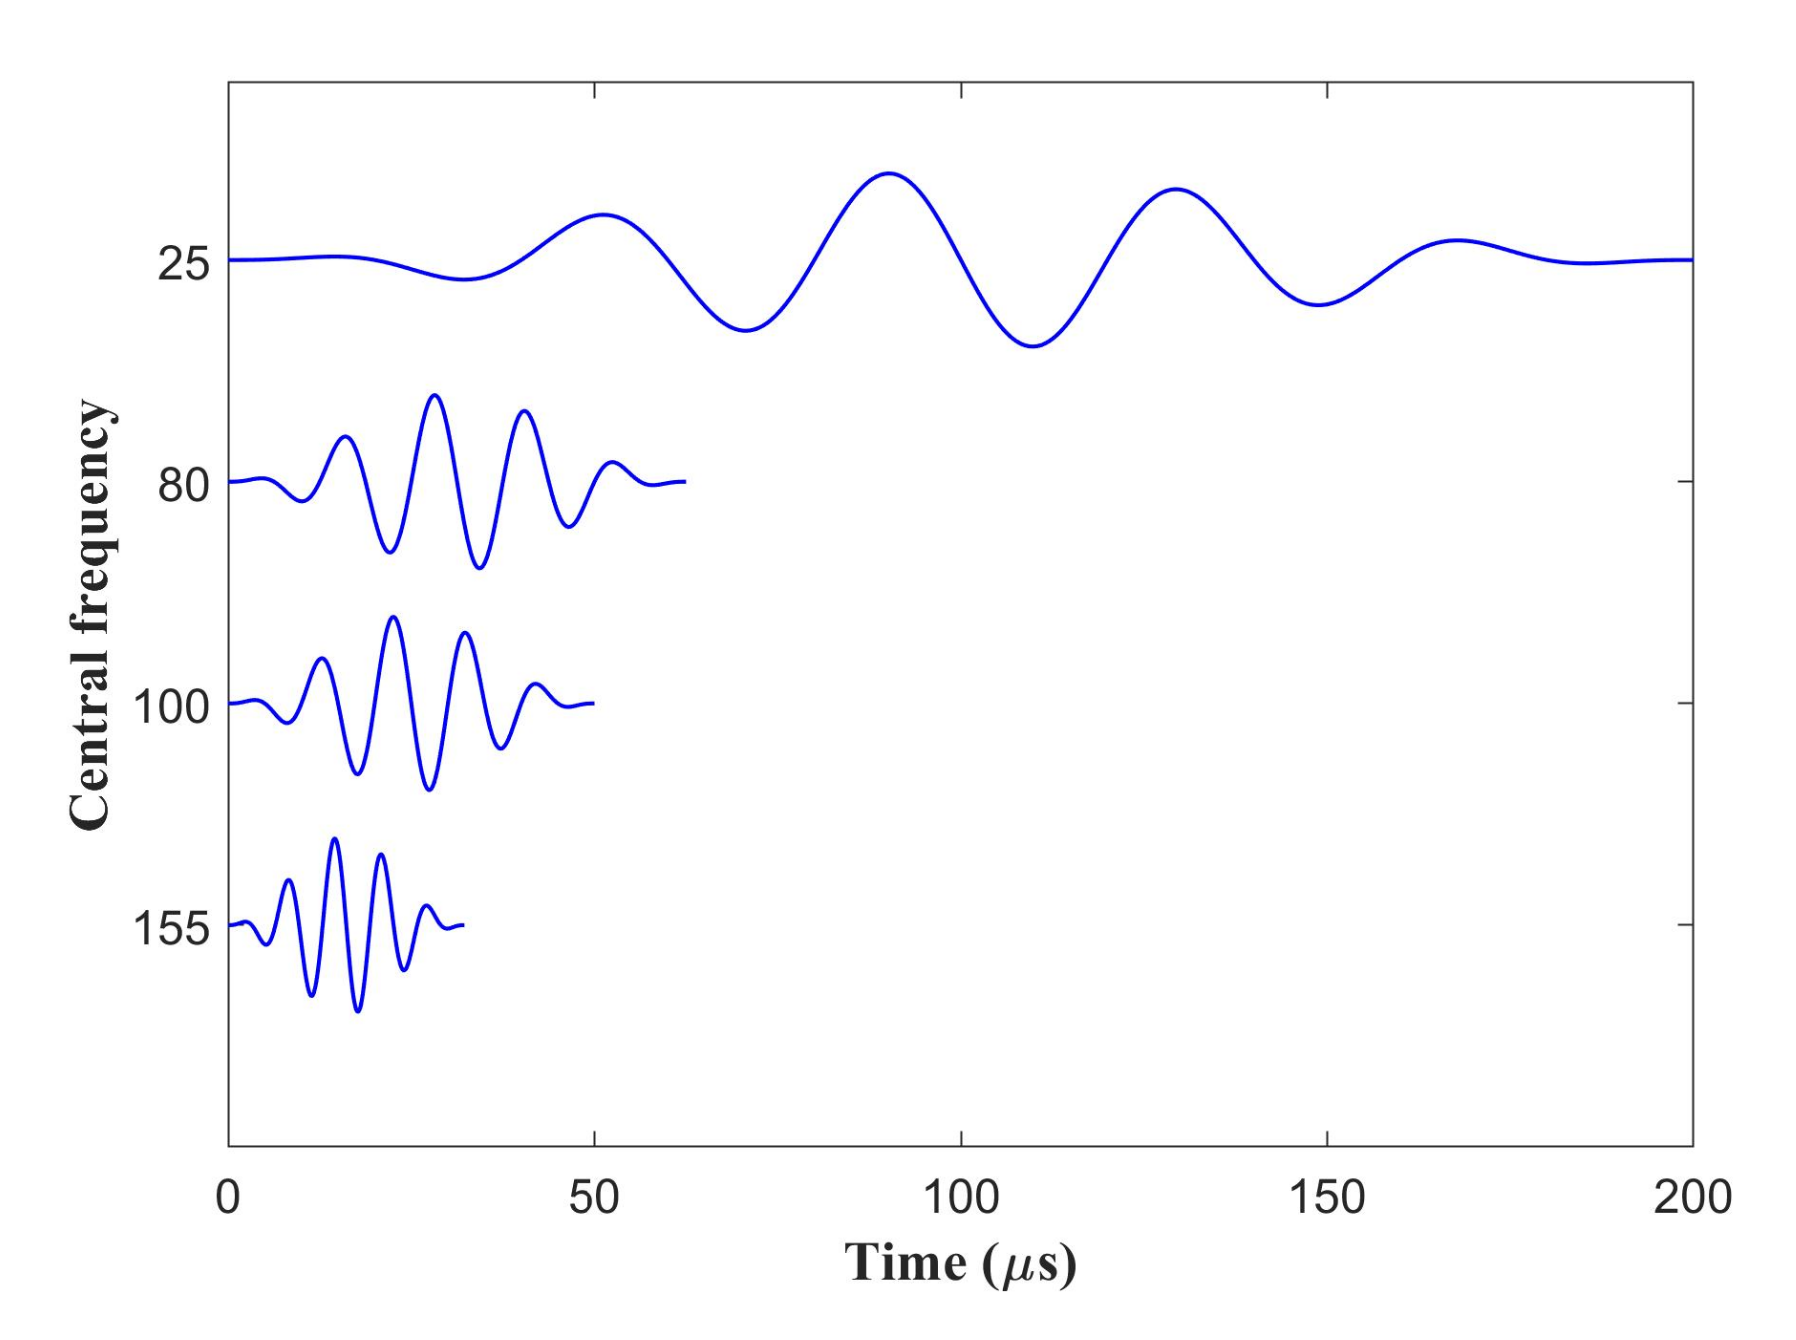
3.1. Selection of Frequencies and Modes of Ultrasonic Guided Waves
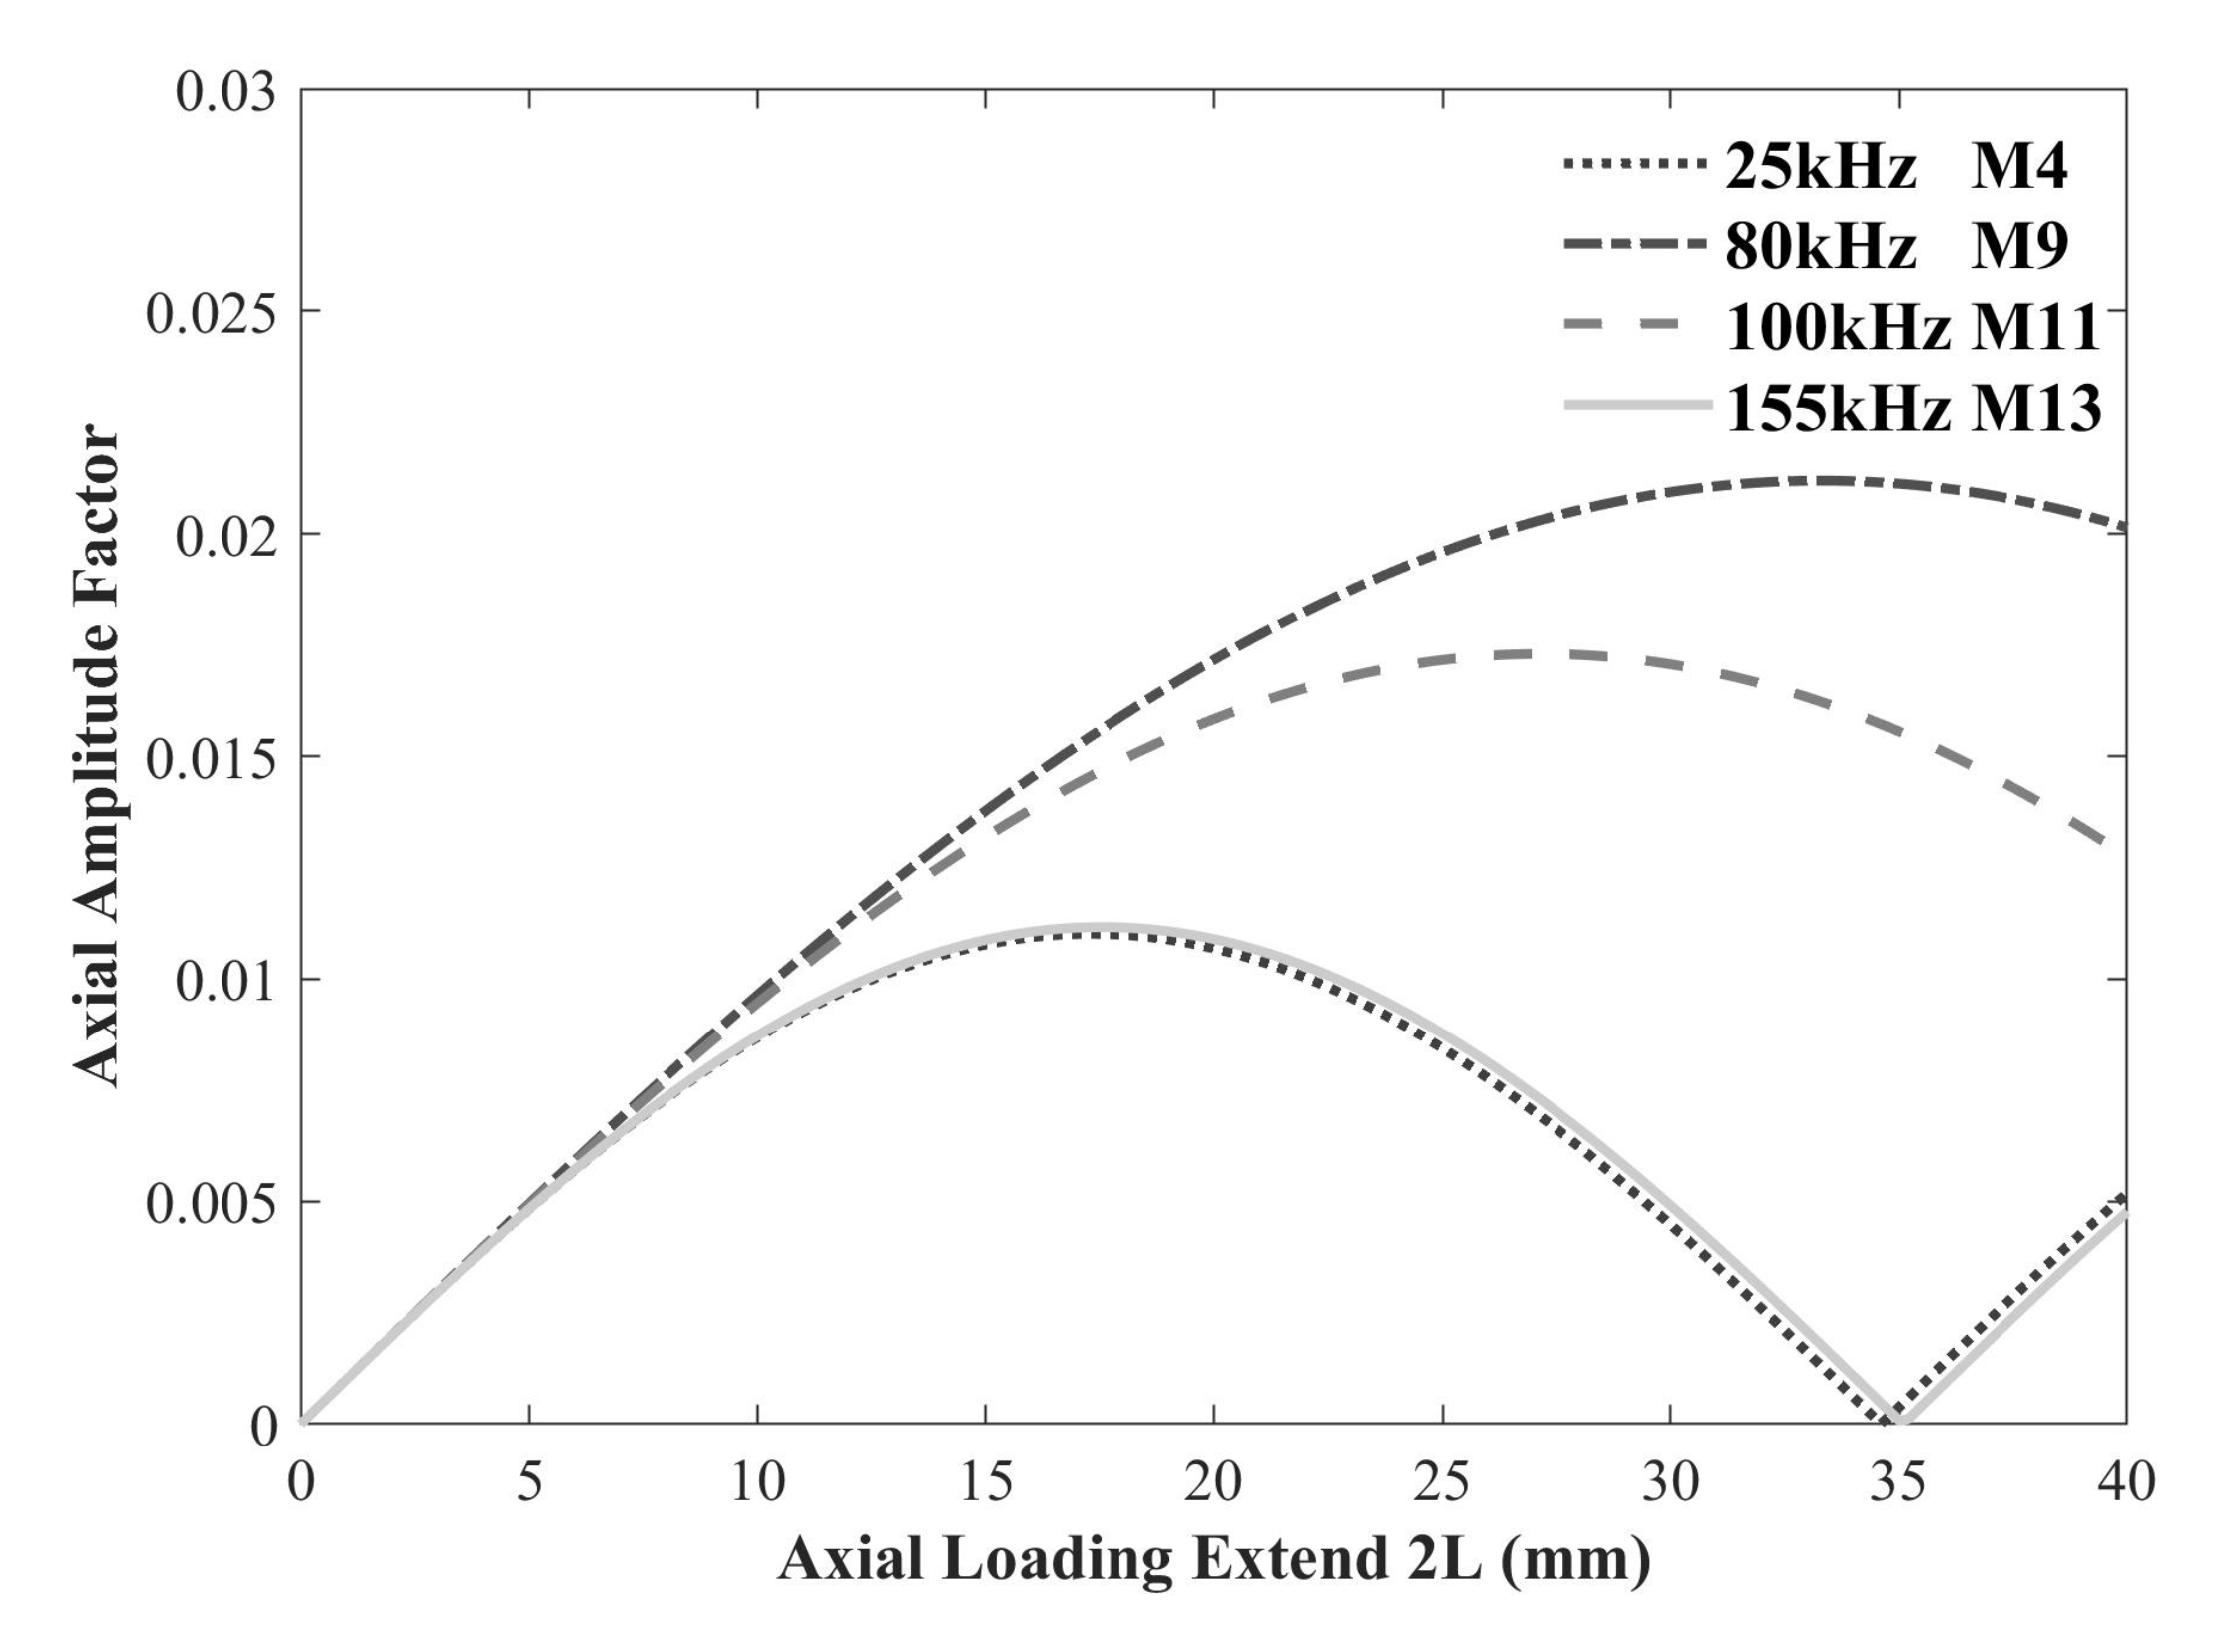
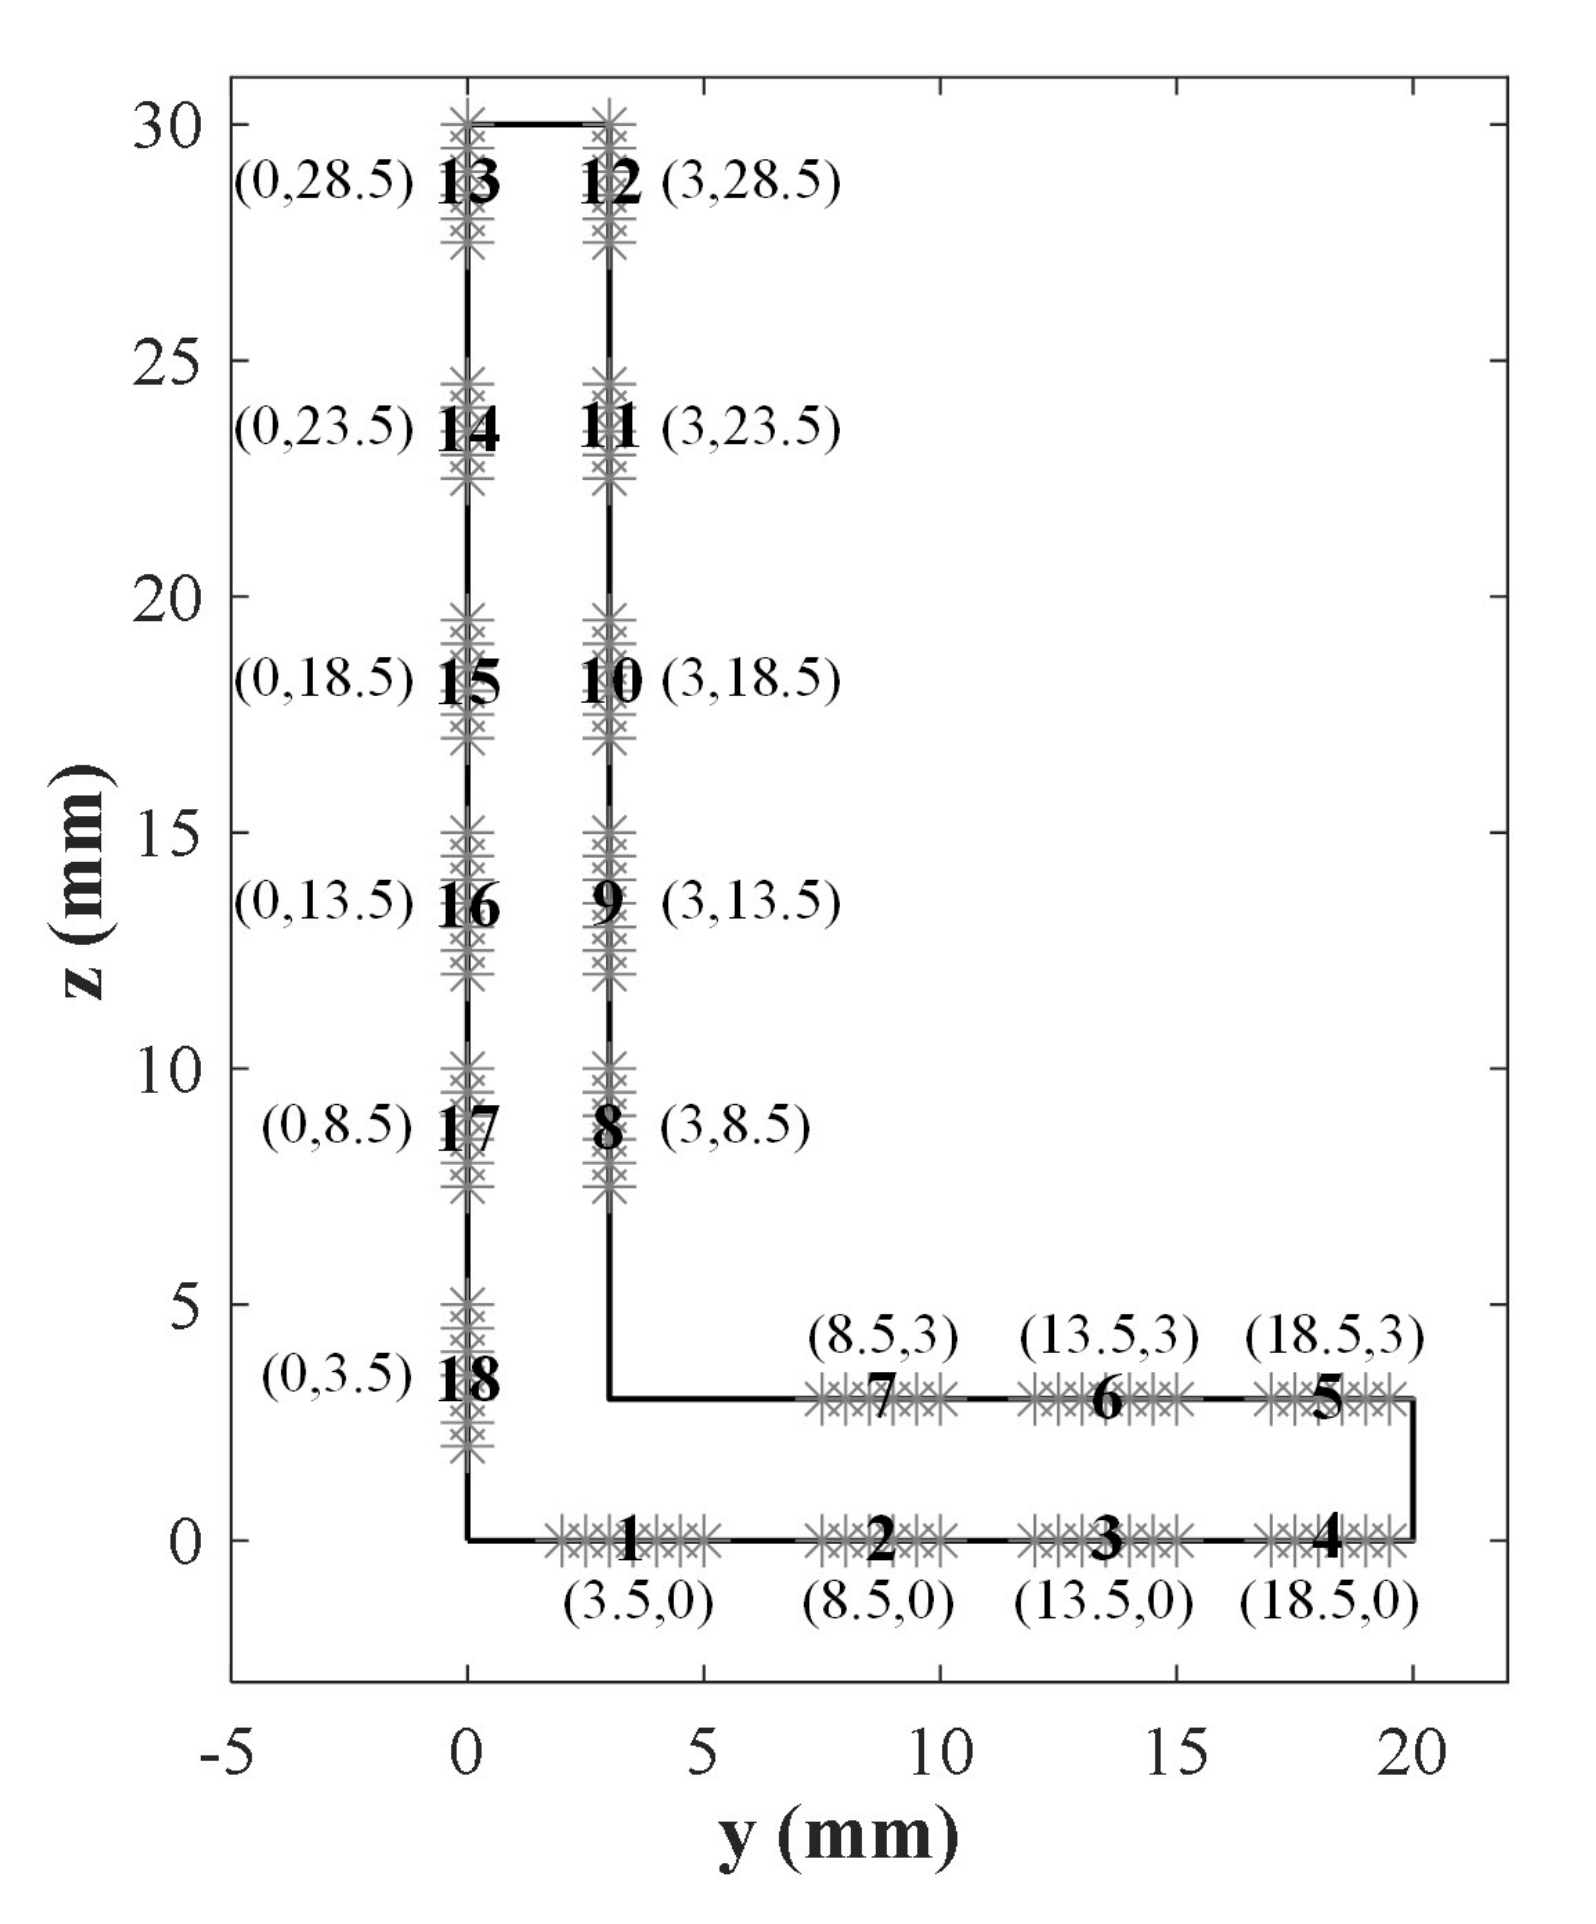
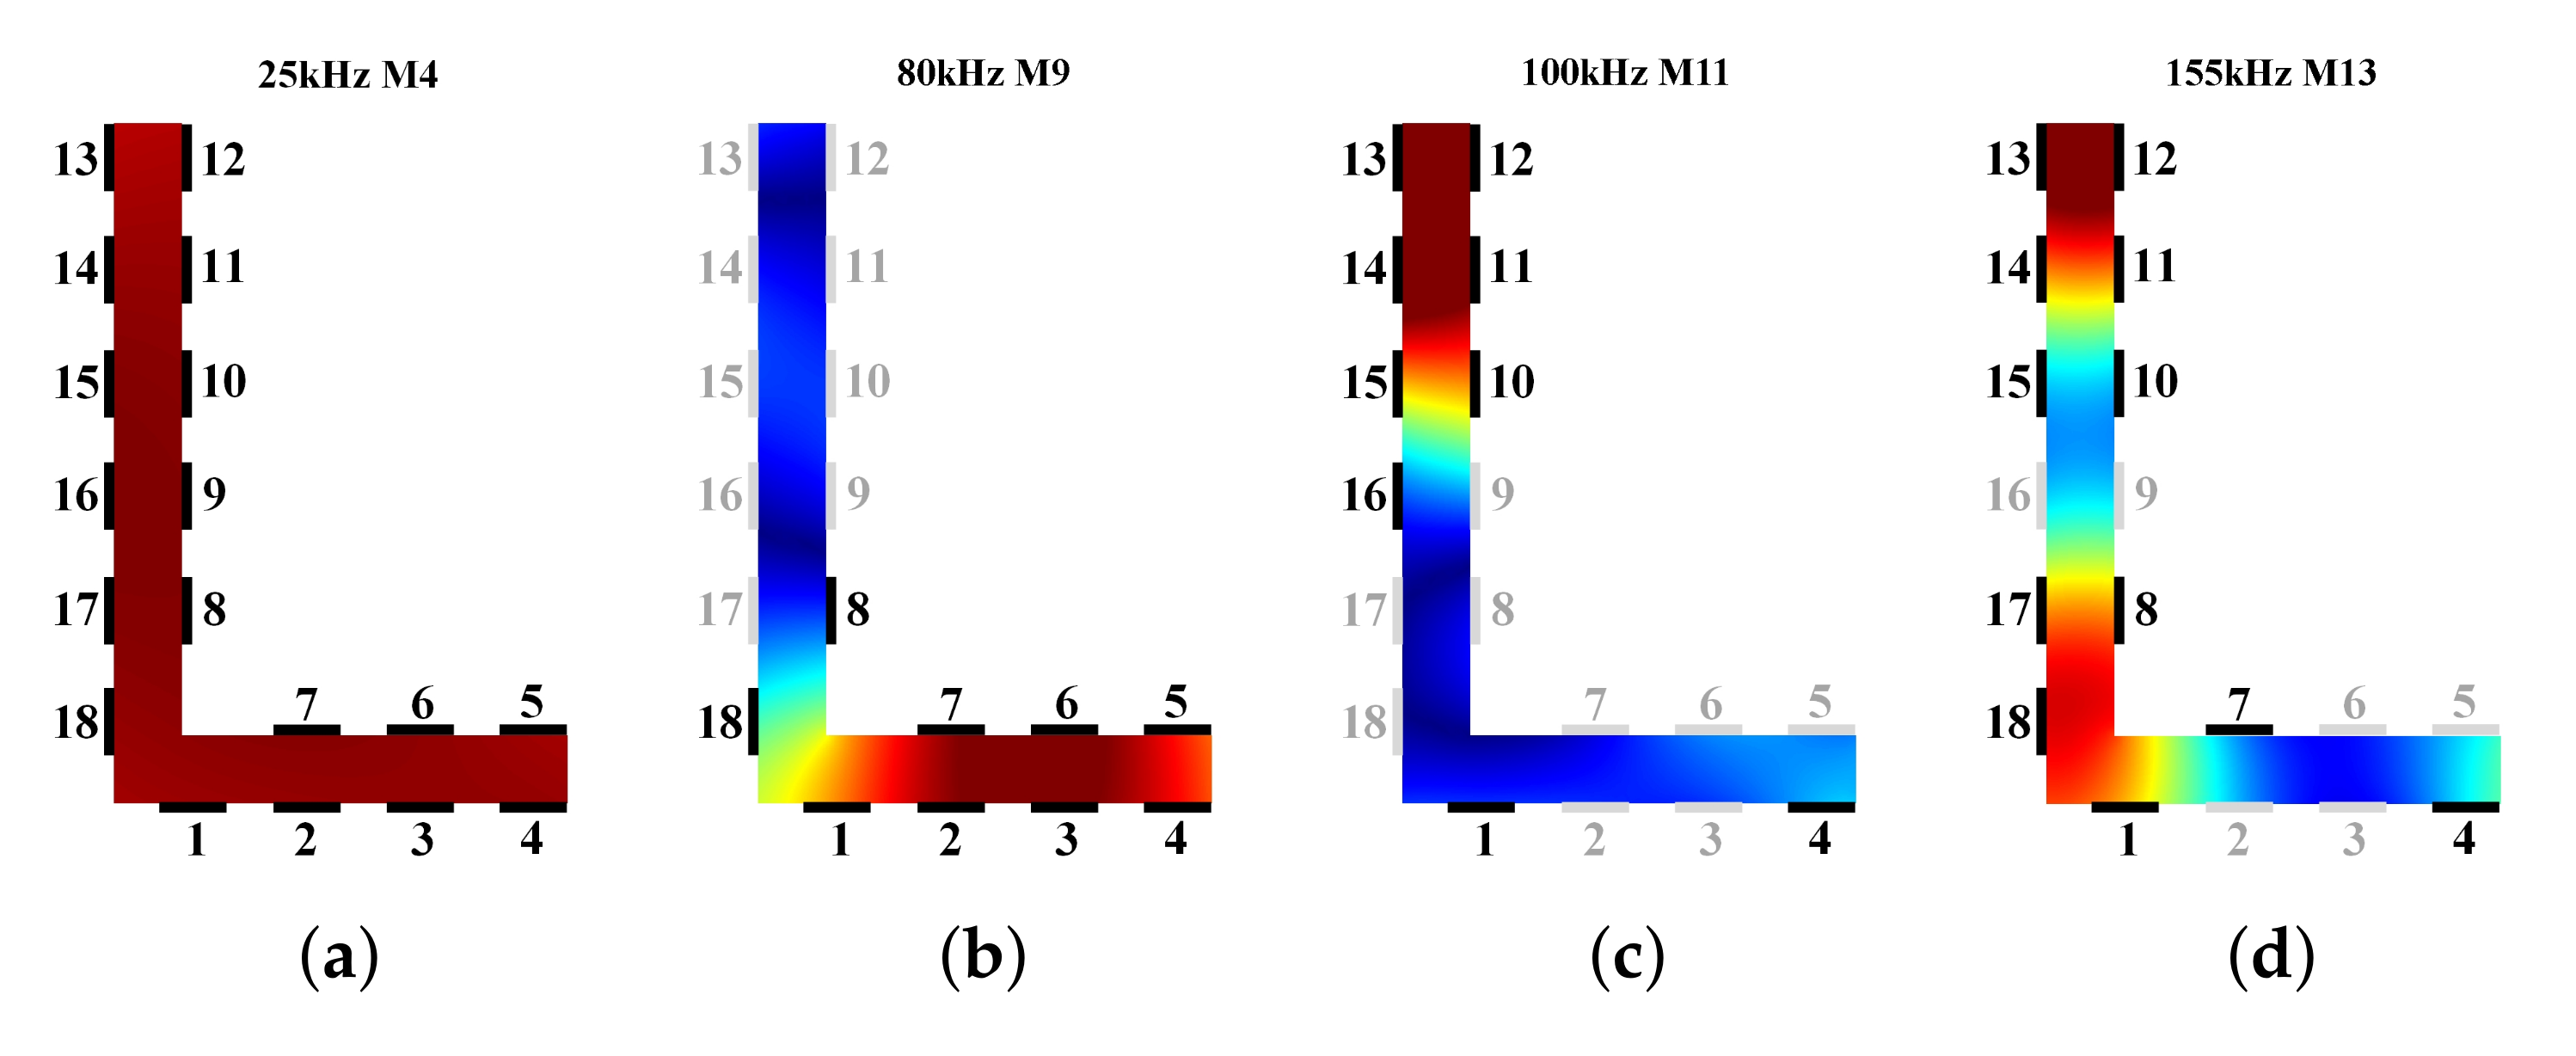
3.2. Mode Control
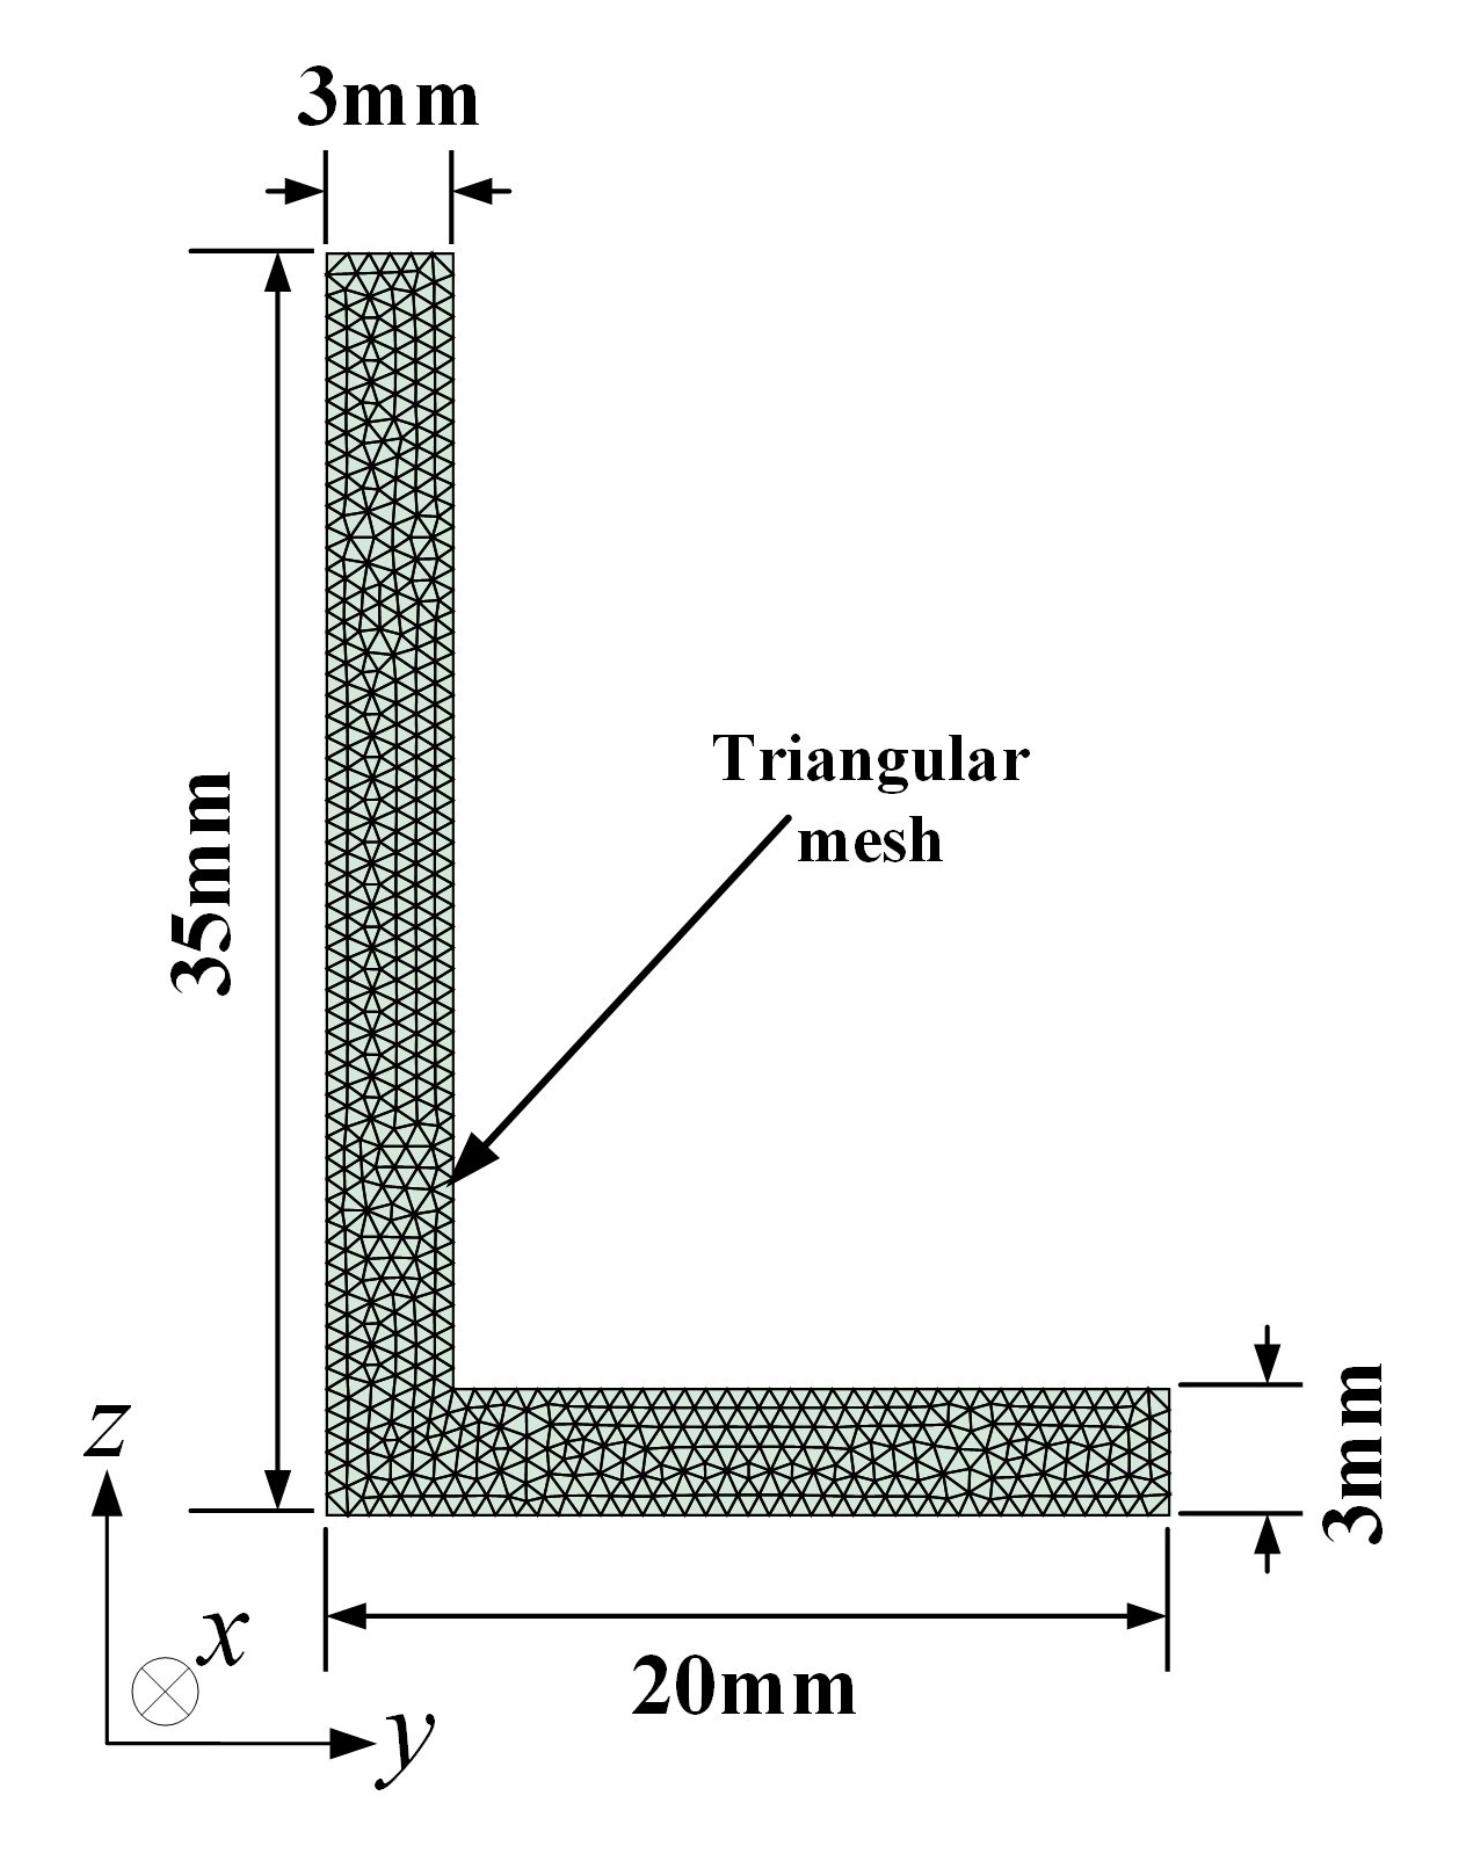
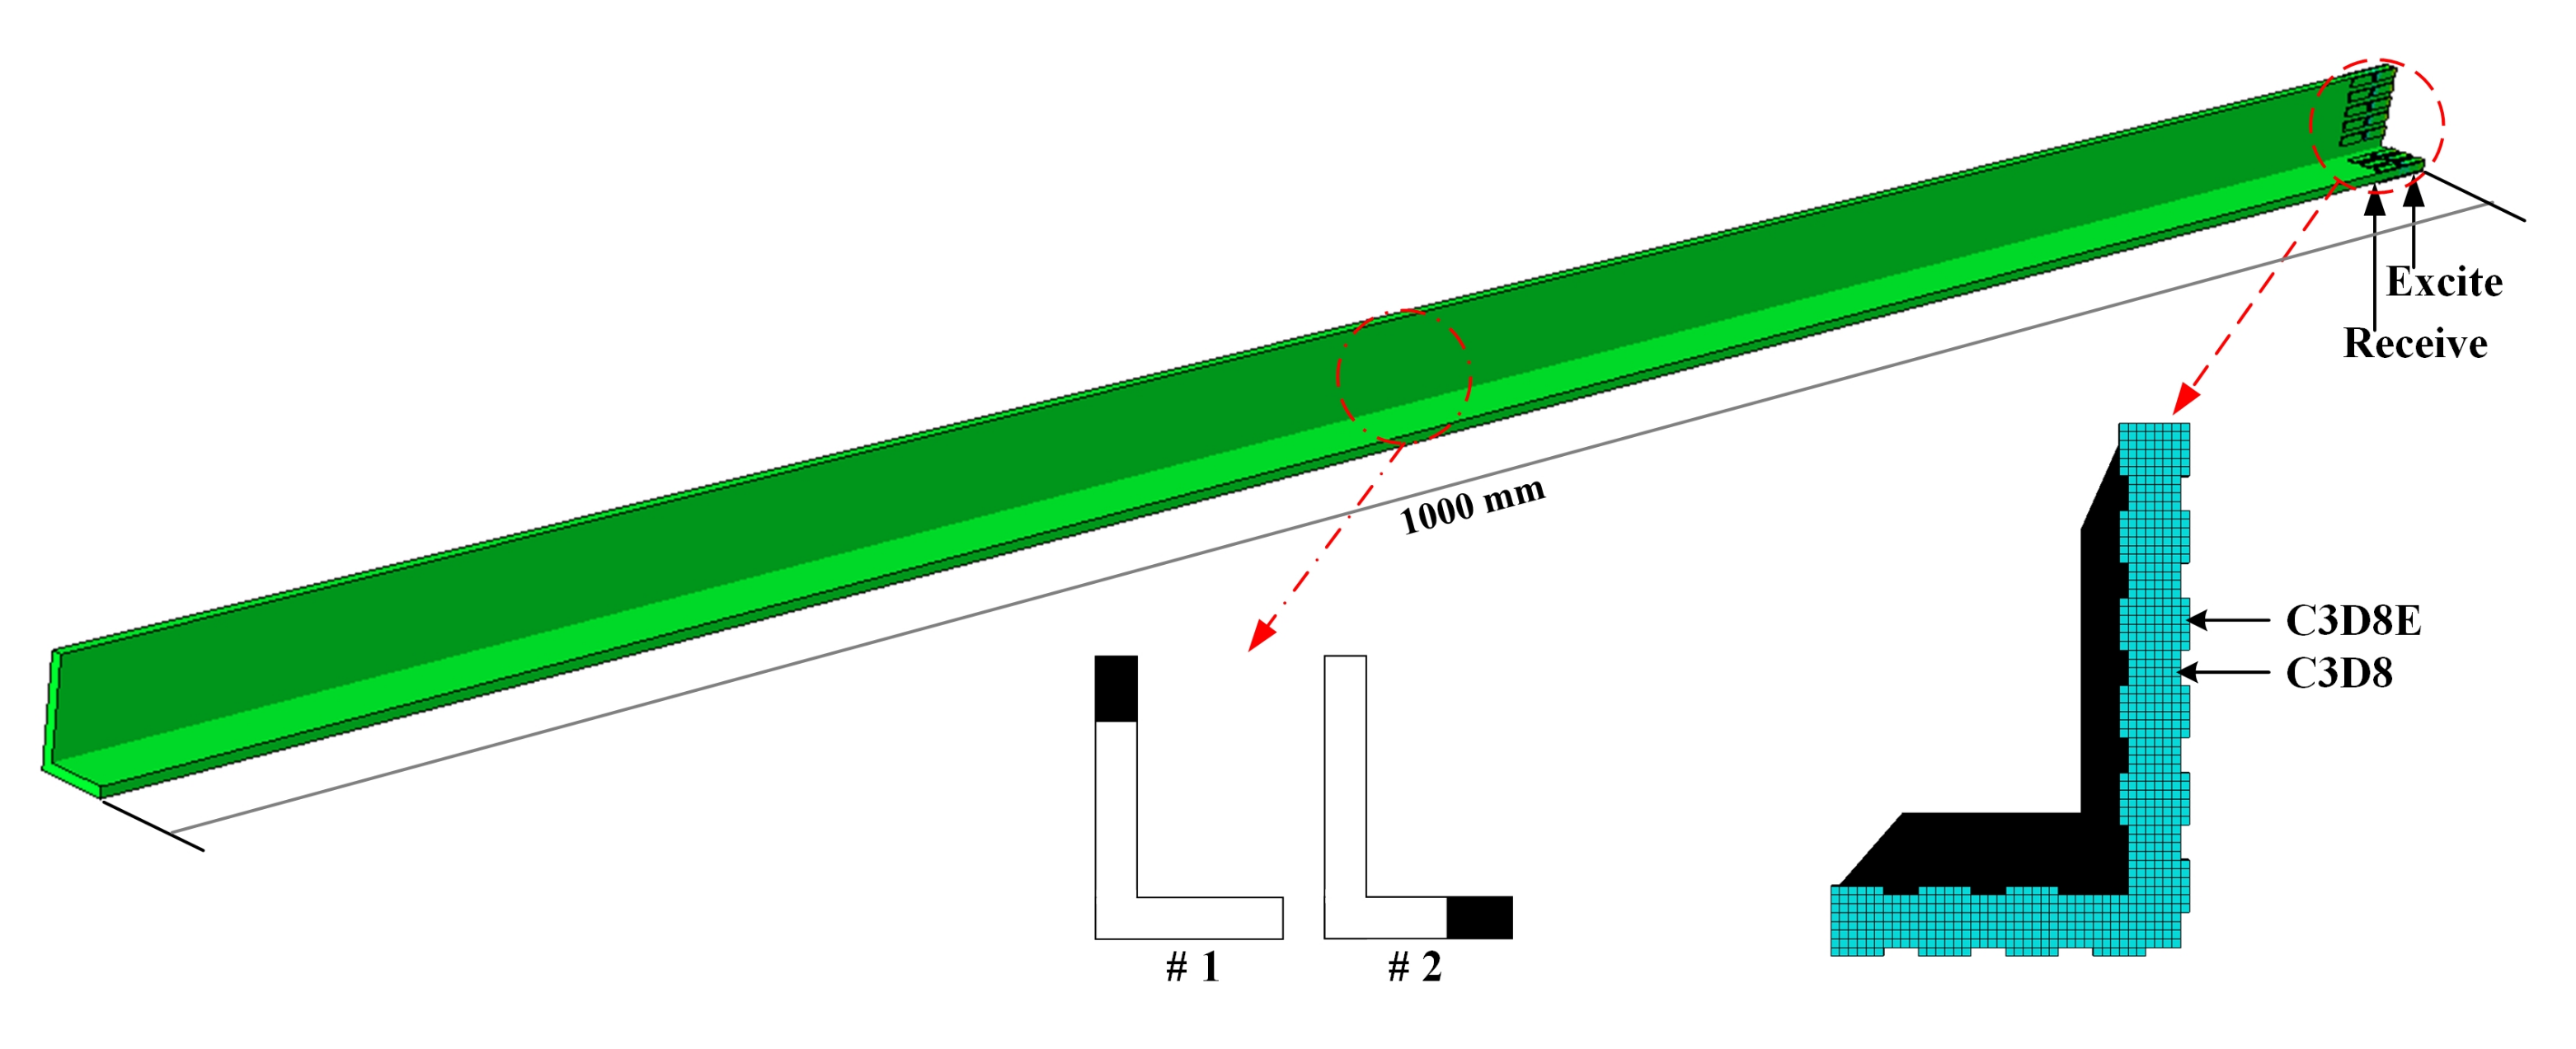
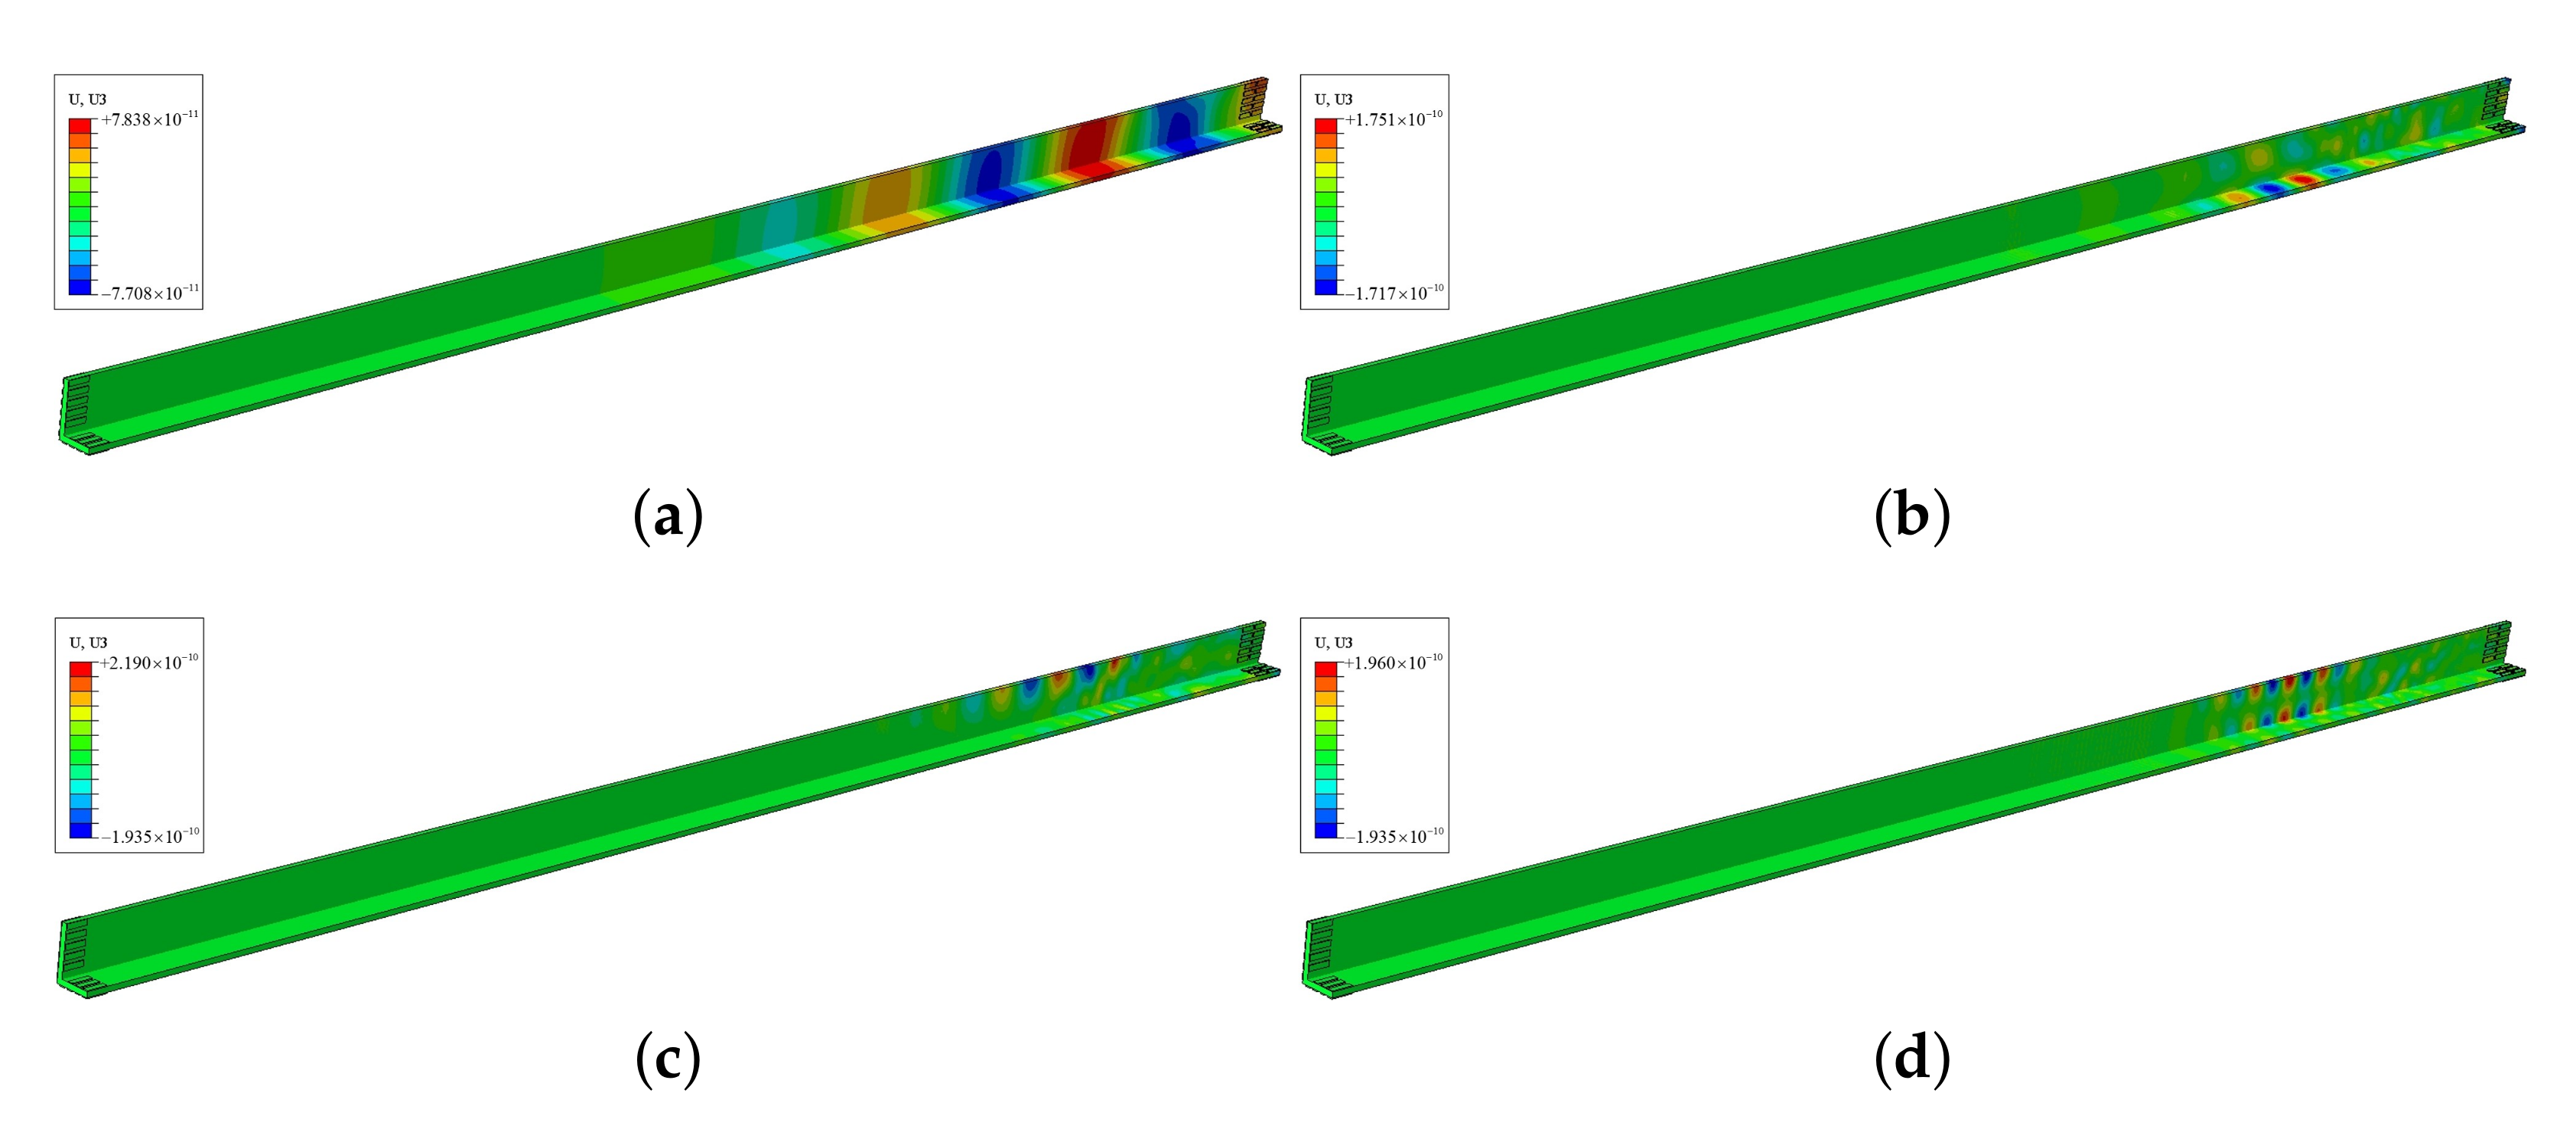
3.3. FE Simulation
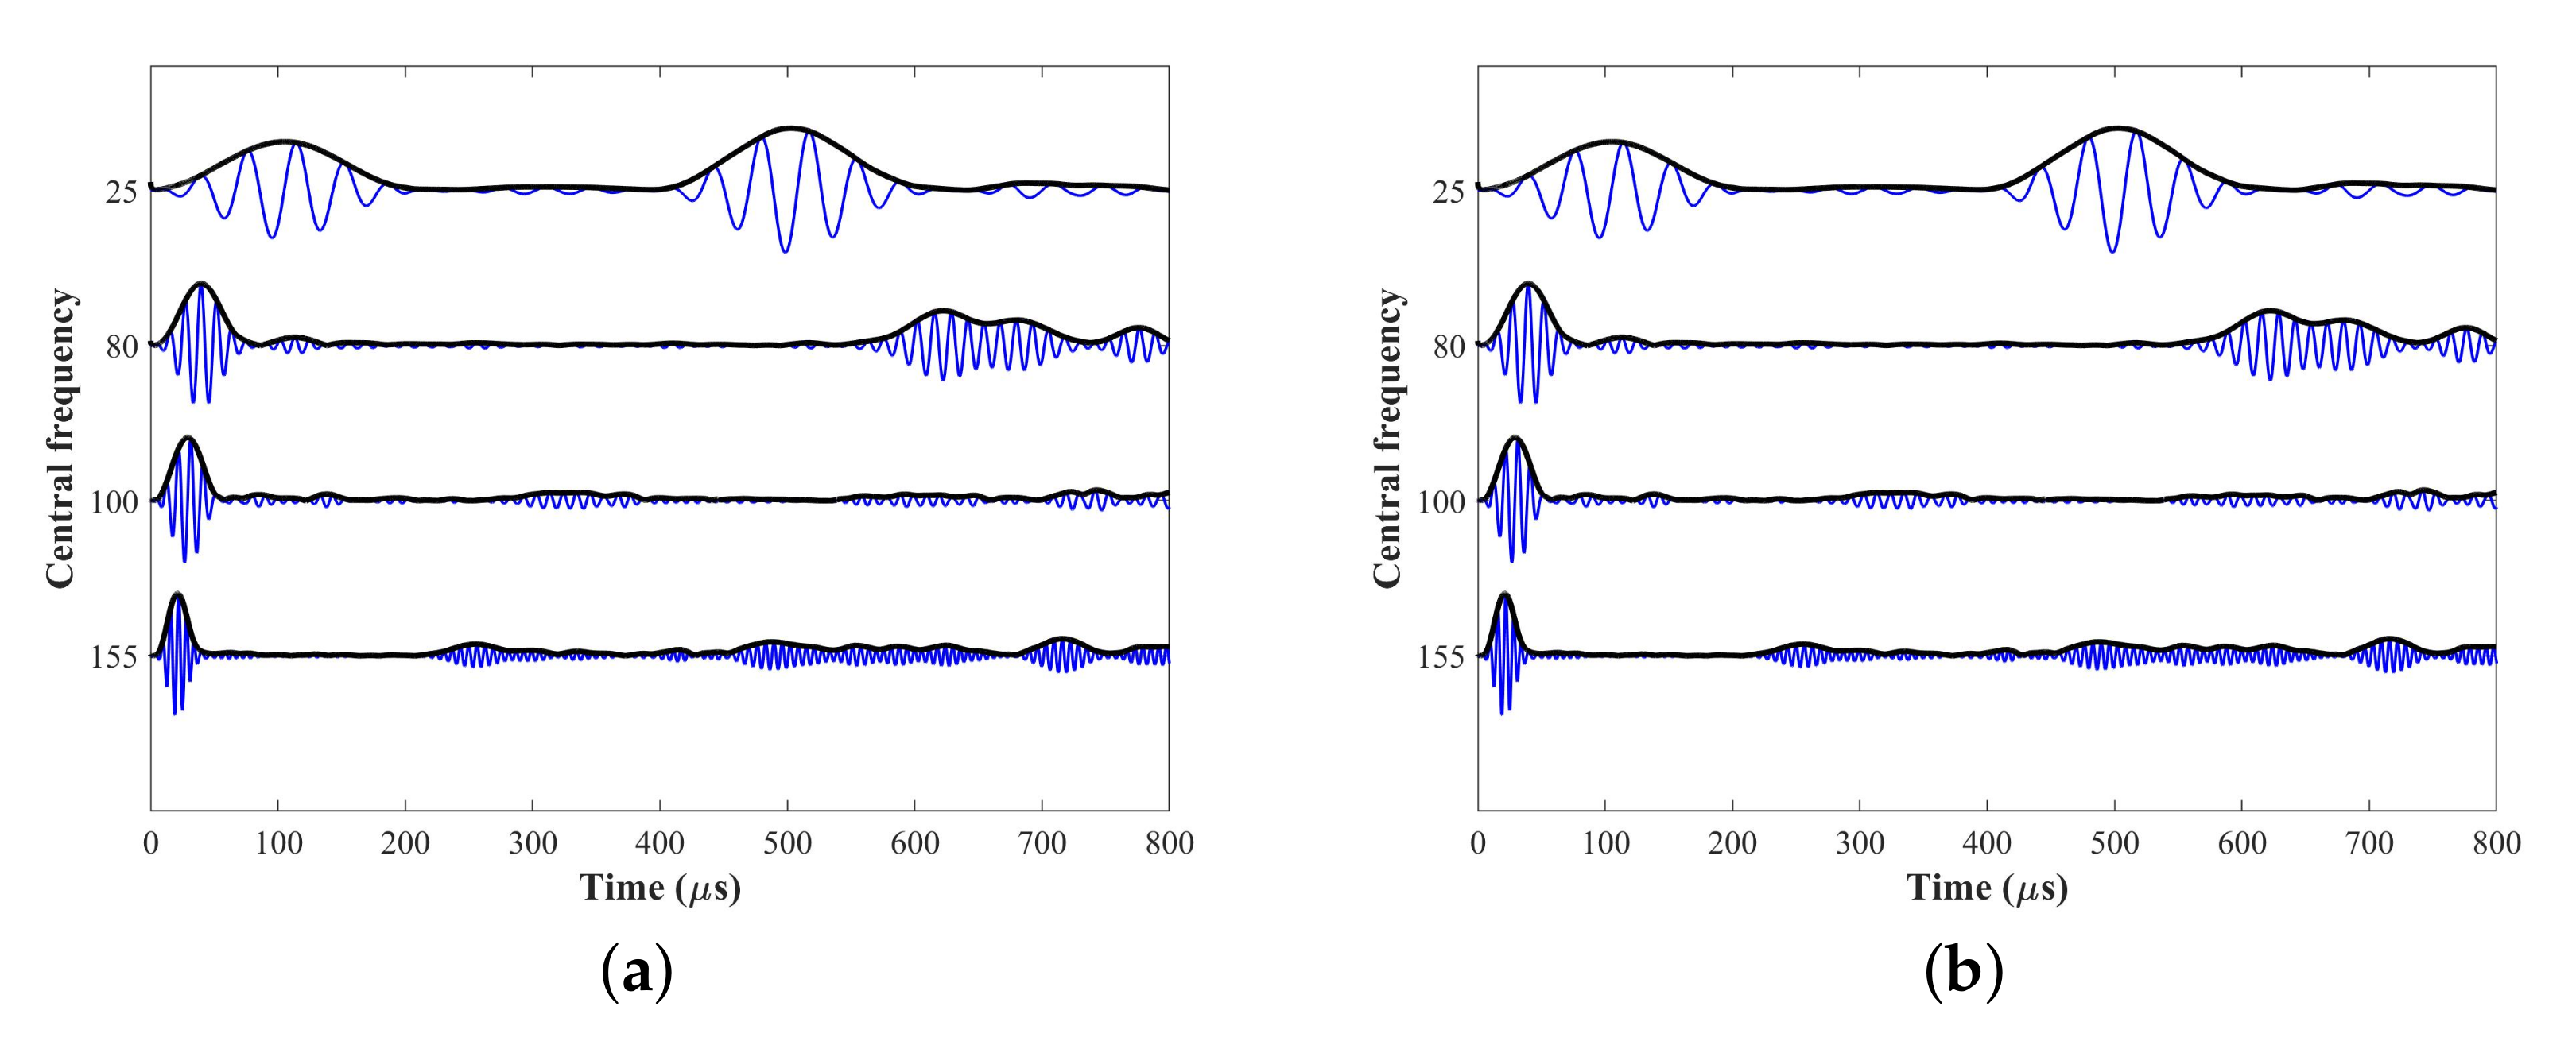
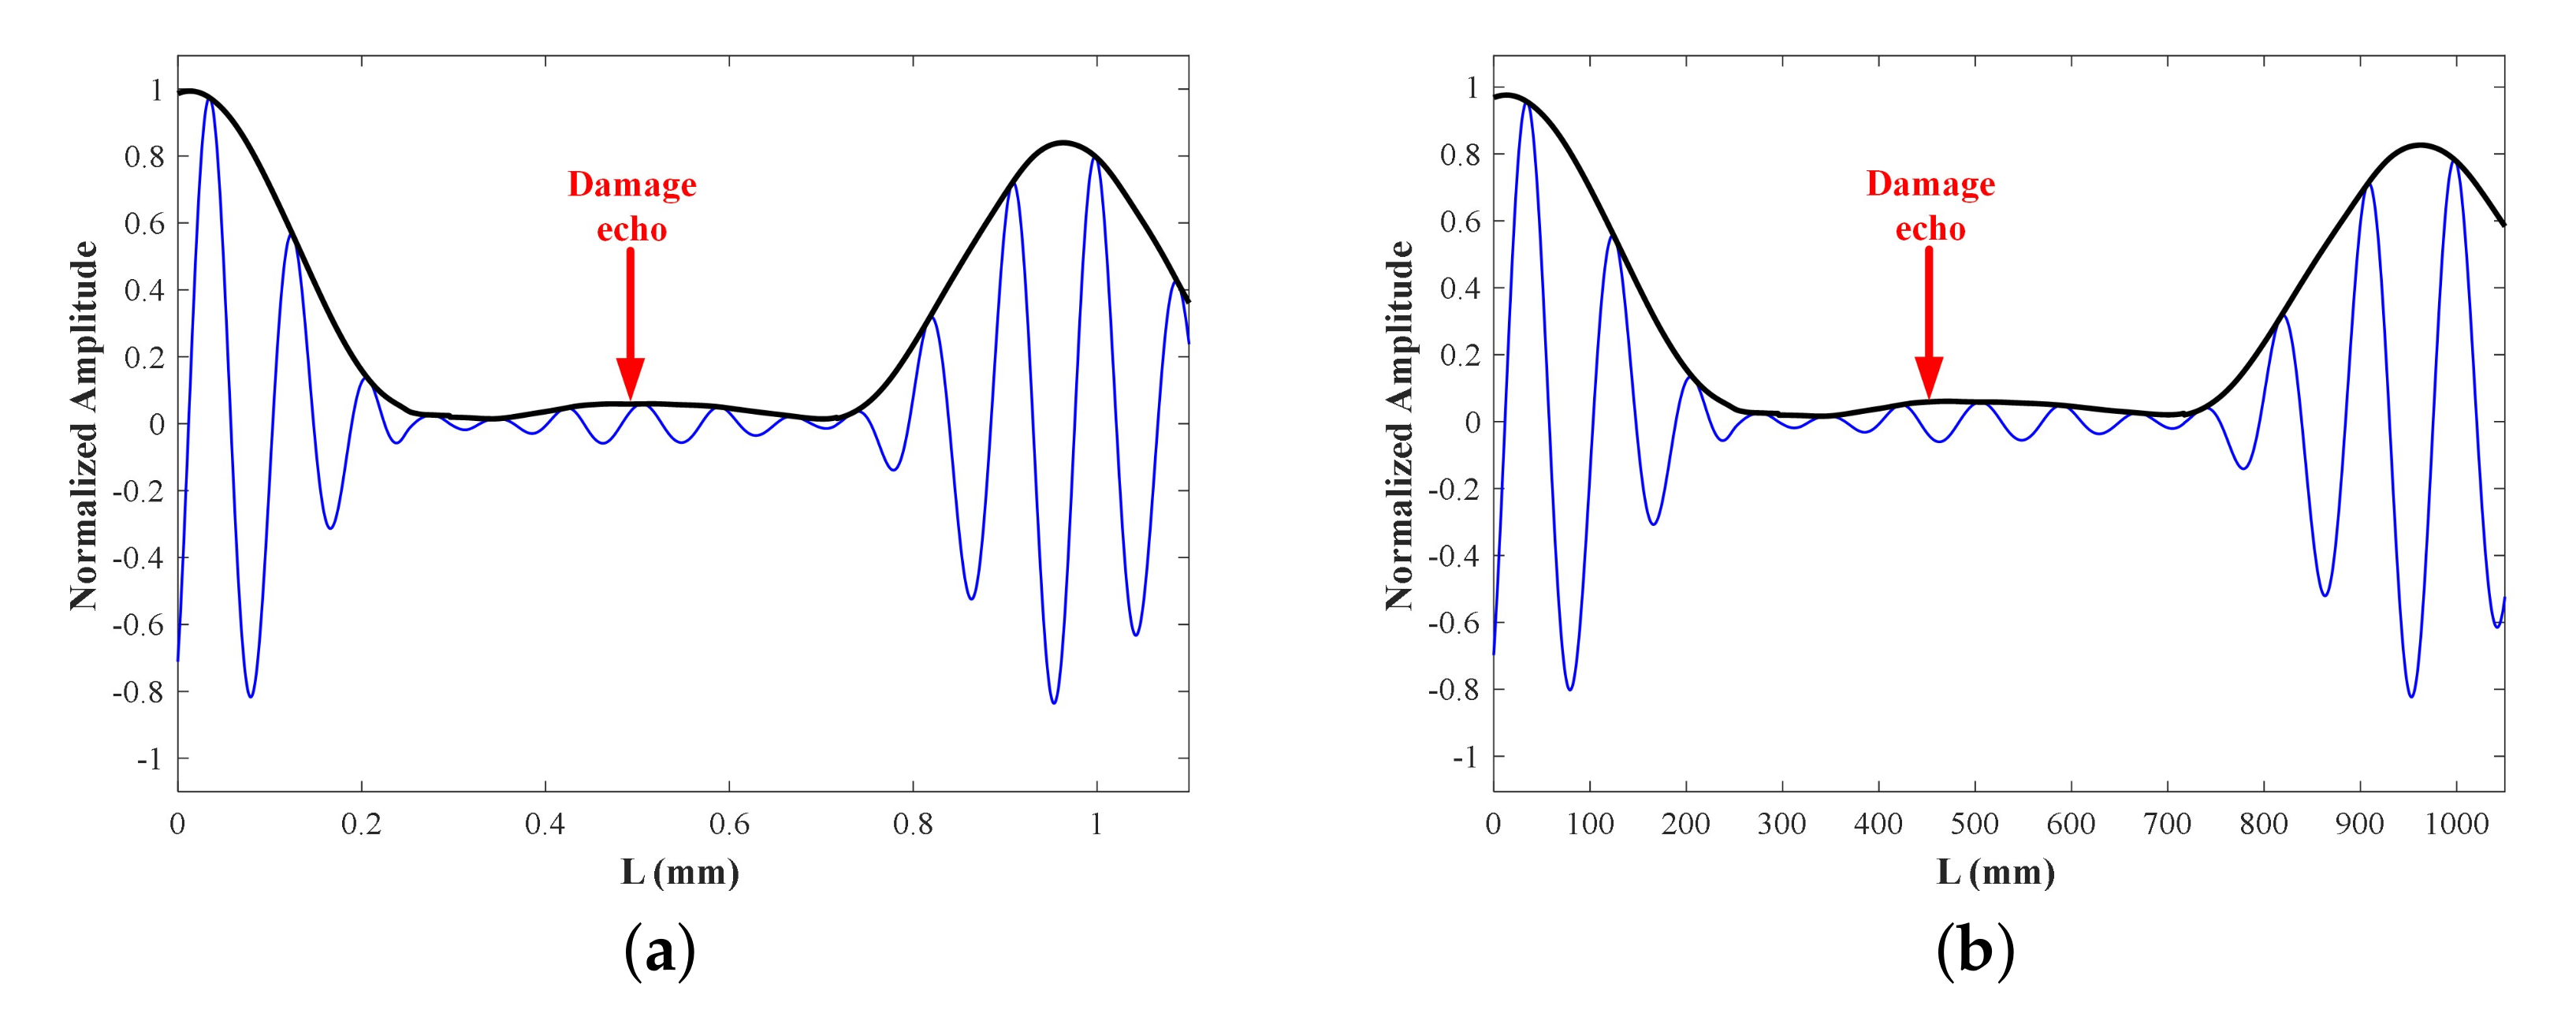
3.4. Sum of Multiple Signals
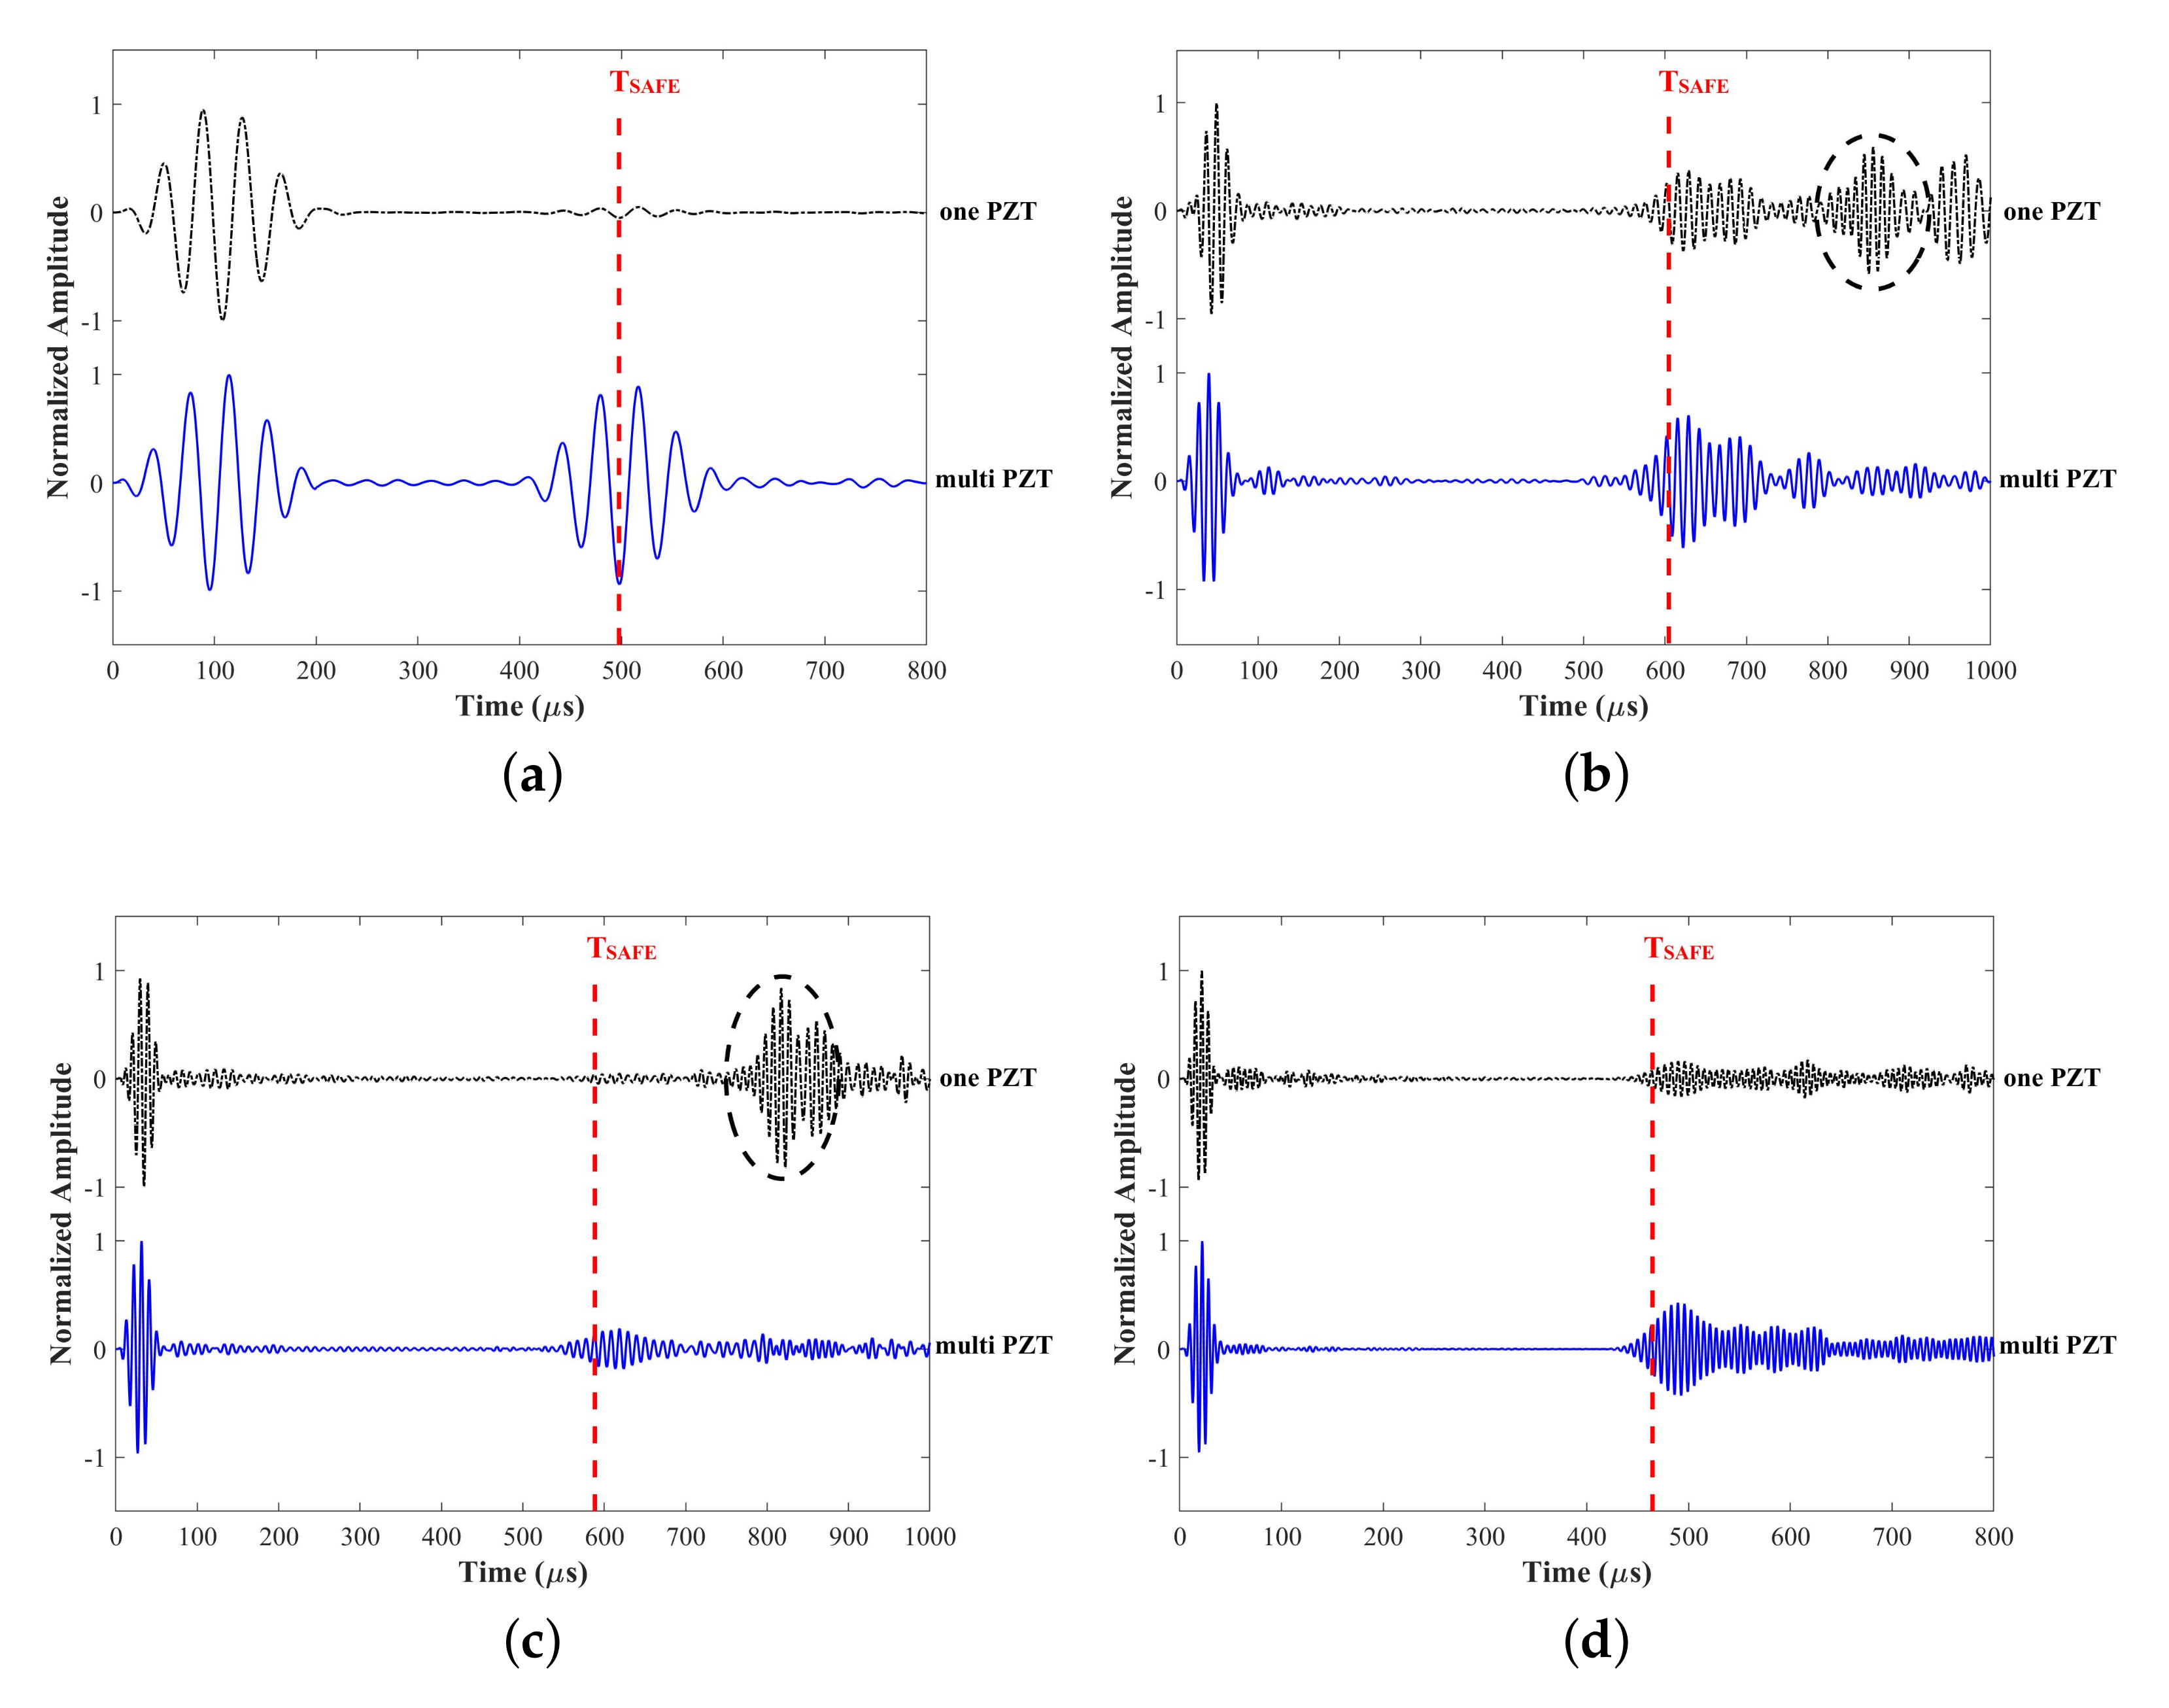
4. Experiments
4.1. Experimental Setup
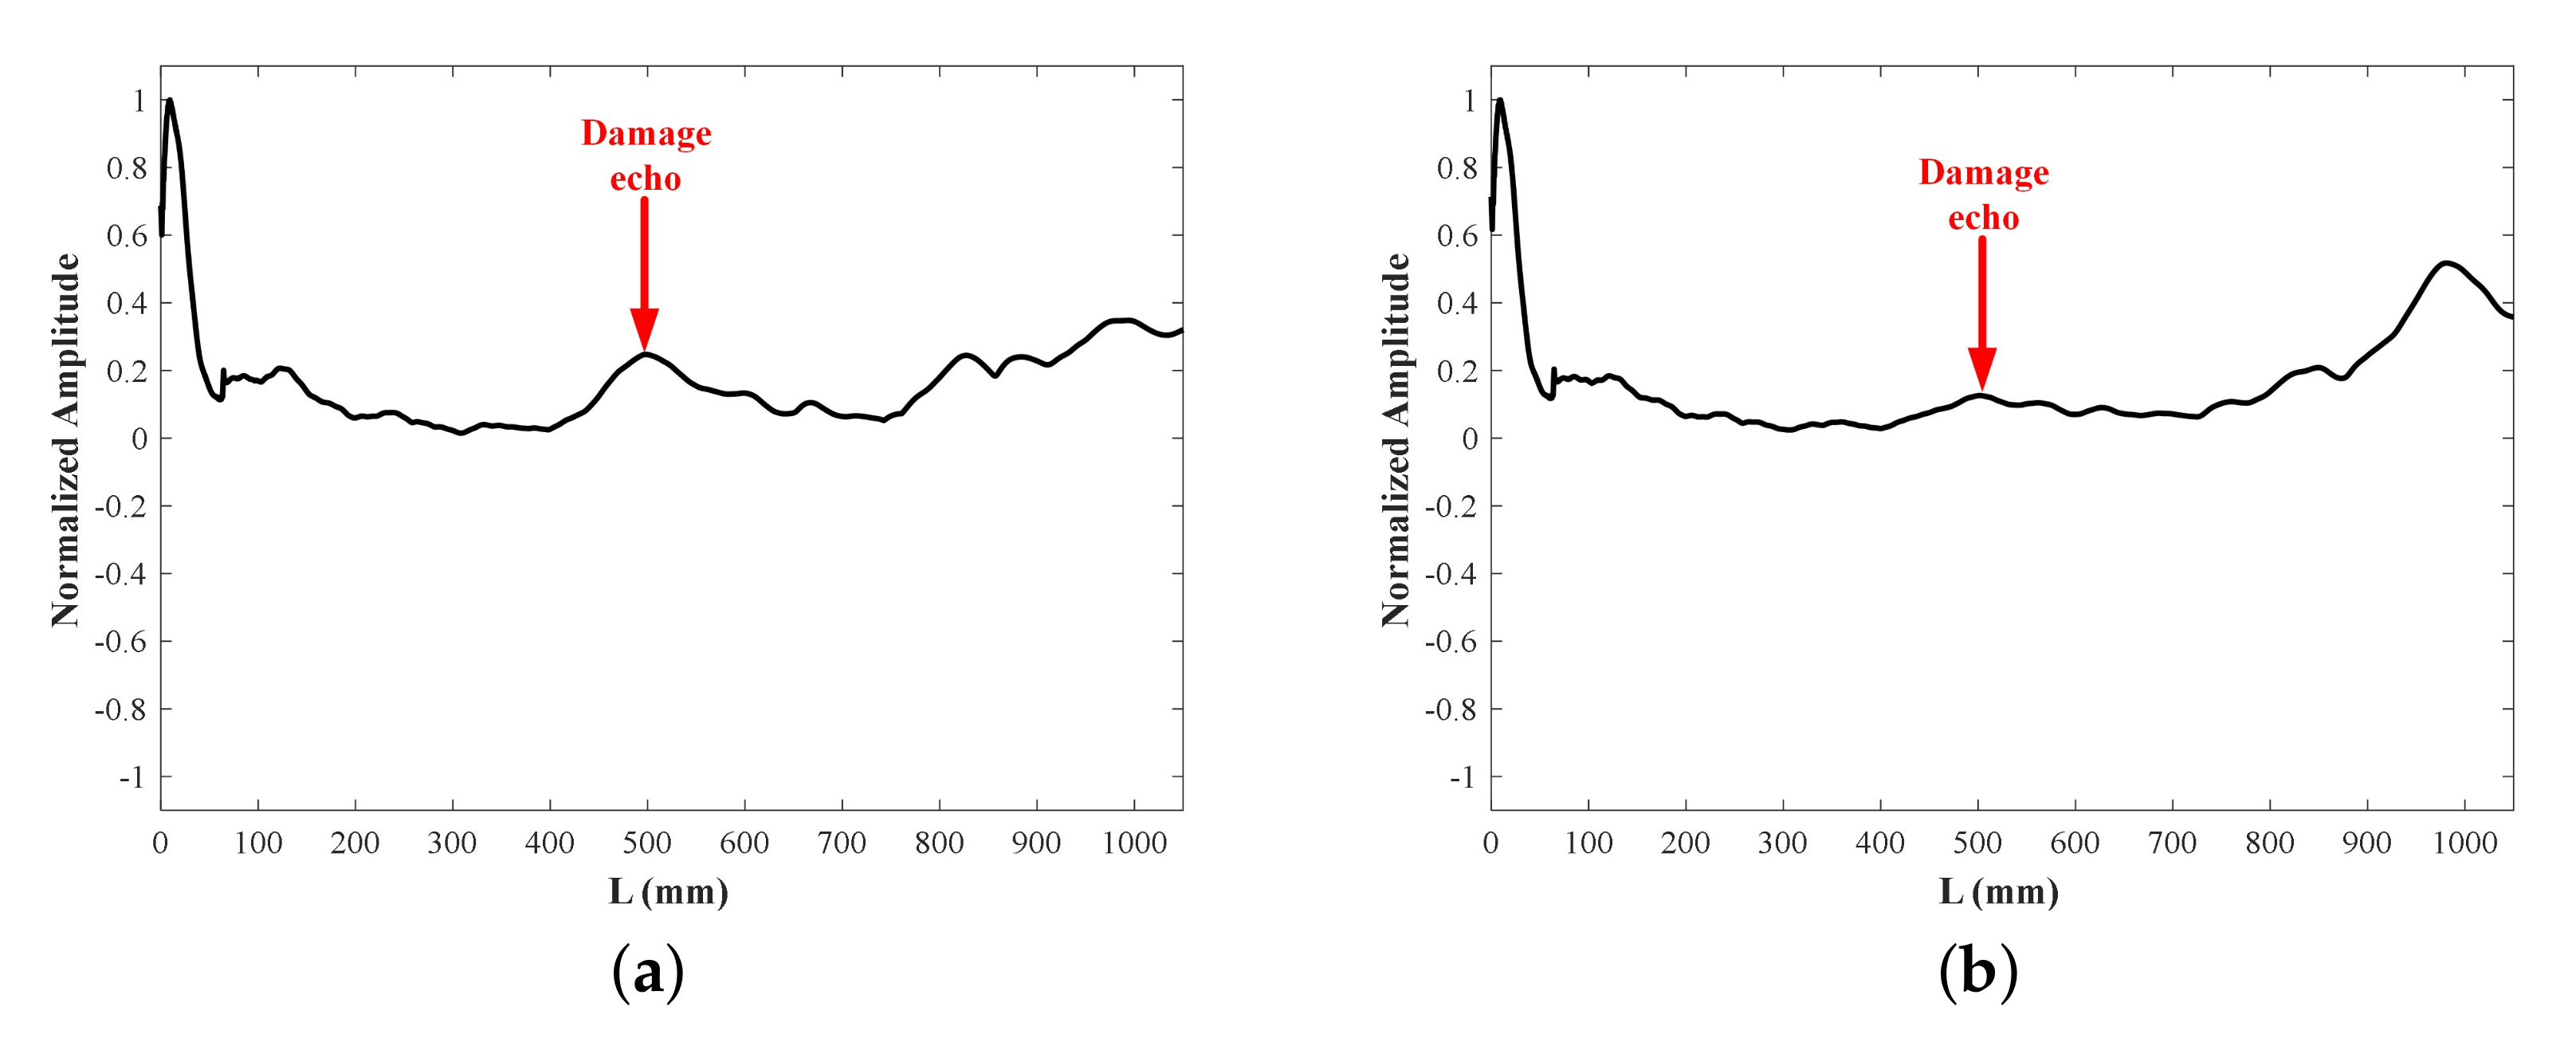
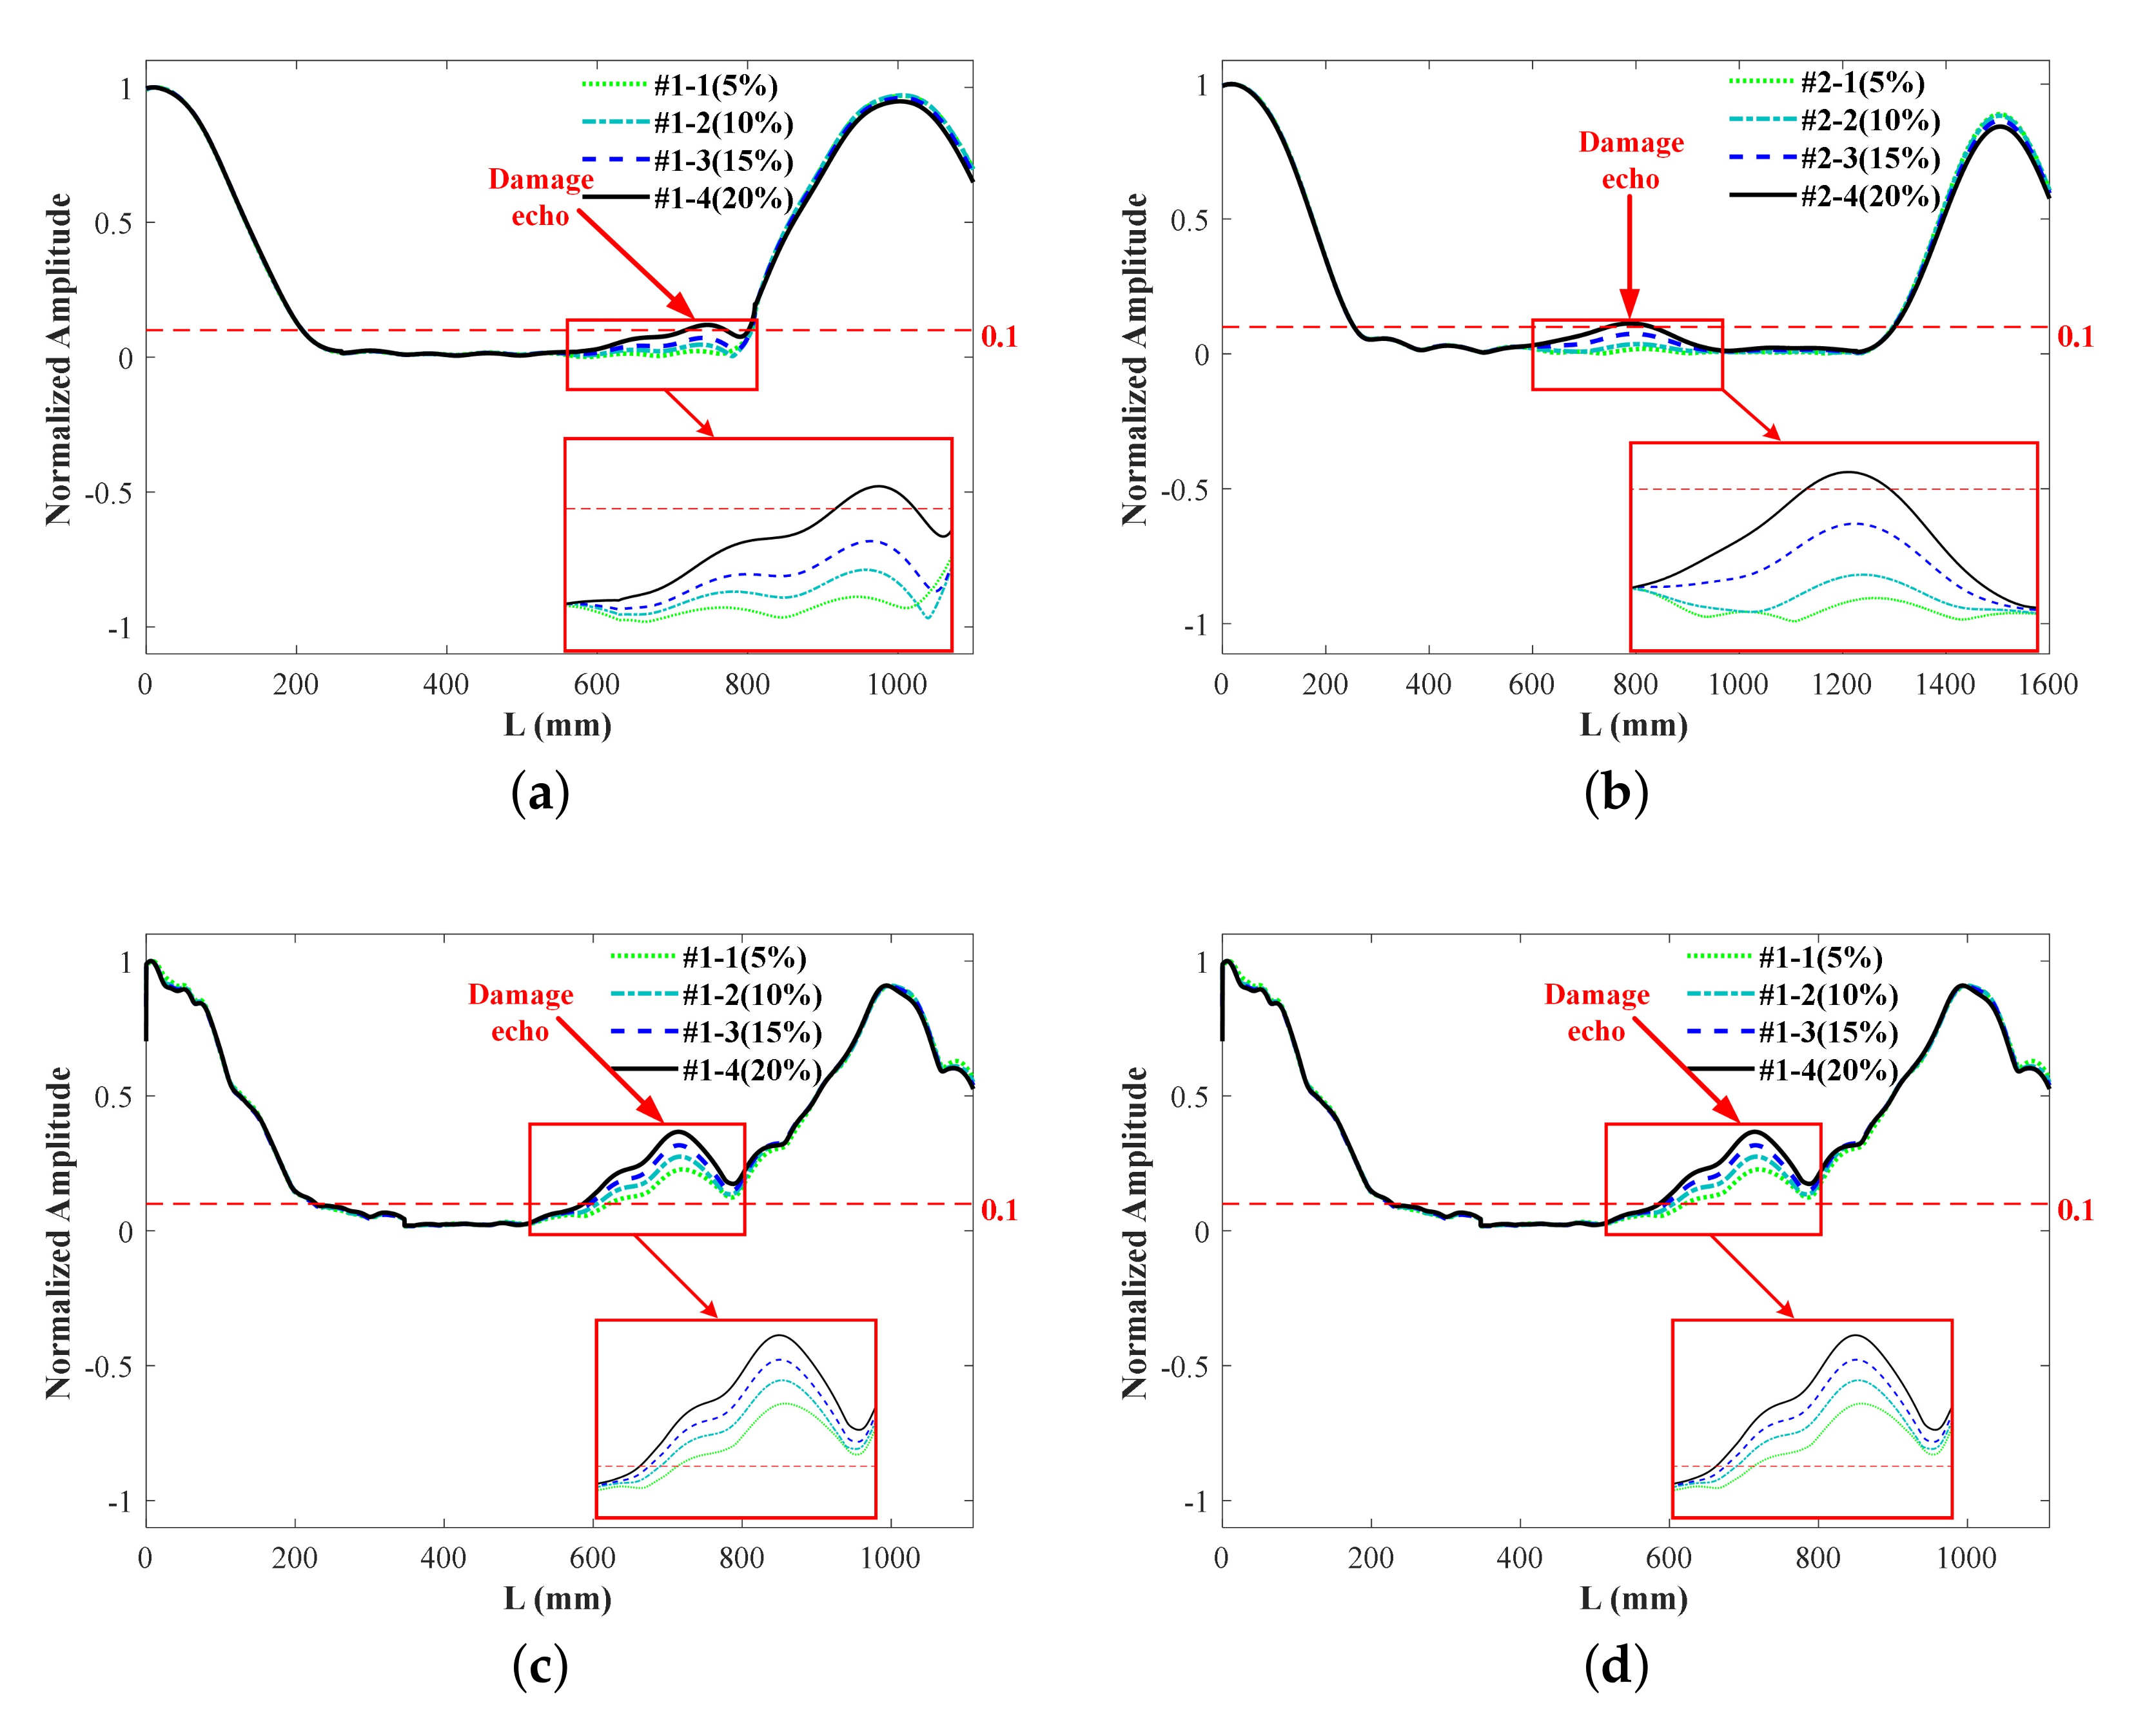
4.2. Results and Discussion
5. Conclusions
Author Contributions
Funding
Data Availability Statement
Acknowledgments
Conflicts of Interest
Appendix A
Appendix A.1
| Algorithm 1: SAFE and NME. |
1: Input properties, parameters of structures 2: Assemble stiffness and mass matrices, get K, K, K, M 3: FOR 4: Procedure SAFE 5: Solve 6: Get , 7: Evaluate , to get dispersion curves 8: Plot mode shapes 9: Plot dispersion curves 10: END FOR 11: Input loadings 12: FOR 13: Procedure NME 14: Calculate Pm 15: Calculate amplitude factor and 16: Calculate amplitude 17: END FOR 18: Bar plot normalized amplitudes |
Appendix A.2

References
- Mei, H.; Giurgiutiu, V. High-order wave-Damage interaction coefficients (WDIC) extracted through modal decomposition. Sensors 2021, 21, 2749. [Google Scholar] [CrossRef] [PubMed]
- Giurgiutiu, V. Tuned lamb wave excitation and detection with piezoelectric wafer active sensors for structural health monitoring. J. Intell. Mater. Syst. Struct. 2005, 16, 291–305. [Google Scholar] [CrossRef]
- Su, Z.; Ye, L.; Lu, Y. Guided lamb waves for identification of damage in composite structures: A review. J. Sound Vib. 2006, 295, 753–780. [Google Scholar] [CrossRef]
- Wang, Y.; Gao, L.; Yuan, S.; Qiu, L.; Qing, X. An adaptive filter-based temperature compensation technique for structural health monitoring. J. Intell. Mater. Syst. Struct. 2014, 25, 2187–2198. [Google Scholar] [CrossRef]
- Mei, H.; Haider, M.; Joseph, R.; Migot, A.; Giurgiutiu, V. Recent advances in piezoelectric wafer active sensors for structural health monitoring applications. Sensors 2019, 19, 383. [Google Scholar] [CrossRef] [Green Version]
- Gao, D.; Wu, Z.; Yang, L.; Zheng, Y. Guide waves-based multi-damage identification using a local probability-based diagnostic imaging method. Smart Mater. Struct. 2016, 25, 045009. [Google Scholar] [CrossRef]
- Liu, K.; Wu, Z.; Jiang, Y.; Wang, Y.; Zhou, K.; Chen, Y. Guided waves based diagnostic imaging of circumferential cracks in small diameter pipe. Ultrasonics 2016, 65, 34–42. [Google Scholar] [CrossRef] [PubMed]
- Mei, H.; Haider, M.; James, R.; Giurgiutiu, V. Pure S0 and SH0 detections of various damage types in aerospace composites. Compos. Part B-Eng. 2020, 189, 107906. [Google Scholar] [CrossRef]
- Qing, X.; Li, W.; Wang, Y.; Sun, H. Piezoelectric transducer based structural health monitoring for aircraft applications. Sensors 2019, 19, 545. [Google Scholar] [CrossRef] [PubMed]
- Kamal, A.M.; Lin, B.; Giurgiutiu, V. Exact analytical modeling of power and energy for multimode lamb waves excited by piezoelectric wafer active sensors. J. Intell. Mater. Syst. Struct. 2014, 25, 452–471. [Google Scholar] [CrossRef]
- Raghavan, A.; Cesnik, C.E. Finite-dimensional piezoelectric transducer modeling for guided wave based structural health monitoring. Smart Mater. Struct. 2005, 14, 1448. [Google Scholar] [CrossRef]
- Mei, H.; Giurgiutiu, V. Guided wave excitation and propagation in damped composite plates. Struct. Health Monit. 2019, 18, 690–714. [Google Scholar] [CrossRef]
- Ditri, J.J.; Rose, J.L. Excitation of guided elastic wave modes in hollow cylinders by applied surface tractions. J. Appl. Phys. 1992, 72, 2589–2597. [Google Scholar] [CrossRef]
- Li, J.; Rose, J.L. Excitation and propagation of non-axisymmetric guided waves in a hollow cylinder. J. Acoust. Soc. Am. 2001, 109, 457–464. [Google Scholar] [CrossRef]
- Zhou, C.; Zhang, C.; Su, Z.; Yue, X.; Xiang, J.; Liu, G. Health monitoring of rail structures using guided waves and three-dimensional diagnostic imaging. Struct. Contr. Health. Monit. 2017, 24, e1966. [Google Scholar] [CrossRef]
- Fan, Z.; Lowe, M.J.S.; Castaings, M.; Bacon, C. Torsional waves propagation along a waveguide of arbitrary cross section immersed in a perfect fluid. J. Acoust. Soc. Am. 2008, 124, 2002–2010. [Google Scholar] [CrossRef]
- Zuo, P.; Yu, X.; Fan, Z. Acoustoelastic guided waves in waveguides with arbitrary prestress. J. Sound Vib. 2020, 469, 115113. [Google Scholar] [CrossRef]
- Li, F.; Li, H.; Qiu, J.; Meng, G. Guided wave propagation in H-beam and probability-based damage localization. Struct. Contr. Health. Monit. 2017, 24, e1916. [Google Scholar] [CrossRef]
- Yu, X.; Fan, Z.; Castaings, M.; Biateau, C. Feature guided wave inspection of bond line defects between a stiffener and a composite plate. NDT E Int. 2017, 89, 44–55. [Google Scholar] [CrossRef]
- Zhang, J.; Wu, Z.; Yang, Z.; Gao, C.; Liu, K.; Zheng, Y.; Zhou, K. Multimode guided waves-based structural defect localization longitudinally and cross-sectionally in T-bars. J. Aerosp. Eng. 2020, 33, 04020017. [Google Scholar] [CrossRef]
- Ma, Y.; Yang, Z.; Zhang, J.; Liu, K.; Wu, Z.; Ma, S. Axial stress monitoring strategy in arbitrary cross-section based on acoustoelastic guided waves using PZT sensors. AIP Adv. 2019, 9, 125304. [Google Scholar] [CrossRef] [Green Version]
- Michaels, J.T.; Lee, S.J.; Croxford, A.L.; Wilcox, P.D. Chirp excitation of ultrasonic guided waves. Ultrasonics 2013, 53, 265–270. [Google Scholar] [CrossRef] [PubMed]
- Giurgiutiu, V.; Bao, J. Embedded-ultrasonics structural radar for in situ structural health monitoring of thin-wall structures. Struct. Health Monit. 2004, 3, 121–140. [Google Scholar] [CrossRef] [Green Version]
- Sternini, S.; Quattrocchi, A.; Montanini, R.; Pau, A.; Lanza di Scalea, F. A match coefficient approach for damage imaging in structural components by ultrasonic synthetic aperture focus. Procedia Eng. 2017, 199, 1544–1549. [Google Scholar] [CrossRef]
- Shan, S.; Qiu, J.; Zhang, C.; Ji, H.; Cheng, L. Multi-damage localization on large complex structures through an extended delay-and-sum based method. Struct. Health Monit. 2016, 15, 50–64. [Google Scholar] [CrossRef]
- Rose, J.L.; Lissenden, C.J. Guided wave mode and frequency selection tips. AIP Conf. 2014, 1581, 358–364. [Google Scholar]
- Hayashi, T.; Song, W.J.; Rose, J.L. Guided wave dispersion curves for a bar with an arbitrary cross-section, a rod and rail example. Ultrasonics 2003, 41, 175–183. [Google Scholar] [CrossRef]
- Hayashi, T.; Tamayama, C.; Murase, M. Wave structure analysis of guided waves in a bar with an arbitrary cross-section. Ultrasonics 2006, 44, 17–24. [Google Scholar] [CrossRef]
- Yang, Z.; Wu, Z.; Zhang, J.; Liu, K.; Jiang, Y.; Zhou, K. Acoustoelastic guided wave propagation in axial stressed arbitrary cross-section. Smart Mater. Struct. 2019, 28, 045013. [Google Scholar] [CrossRef]
- Ahmad, Z.A. Numerical Simulations of Lamb Waves in Plates Using a Semi-Analytical Finite Element Method. Ph.D. Thesis, Otto von Guericke University, Magdeburg, Germany, 2011. [Google Scholar]
- Fritsch, F.N.; Carlson, R.E. Monotone piecewise cubic interpolation. SIAM J. Numer. Anal. 1980, 17, 238–246. [Google Scholar] [CrossRef]
- Rose, J. Ultrasonic Guided Waves in Solid Media: Plates; Cambridge University Press: Cambridge, UK, 2014. [Google Scholar]
- Loveday, P.W.; Long, C.S.; Ramatlo, D.A. Mode repulsion of ultrasonic guided waves in rails. Ultrasonics 2018, 84, 142–149. [Google Scholar] [CrossRef] [PubMed]
- Zhang, J.; Xu, H.; Zhou, K.; Yang, Z.; Liu, K.; Zheng, Y.; Ma, S.; Wu, Z. Baseline-free damage diagnostic imaging approach relying on the extraction of converted modes of ultrasonic guided waves. J. Aerosp. Eng. 2021, 34, 04021071. [Google Scholar] [CrossRef]
- Zhang, J.; Wu, Z.; Yang, Z.; Liu, K.; Zhou, K.; Zheng, Y. Excitation of guided wave modes in arbitrary cross-section structures by applied surface tractions. Smart Mater. Struct. 2020, 29, 065010. [Google Scholar] [CrossRef]
- Auld, B.A. Acoustic Fields and Waves in Solids; Krieger: Malabar, FL, USA, 1990. [Google Scholar]
- Wu, J.; Tang, Z.; Lü, F.; Yang, K. Ultrasonic guided wave focusing in waveguides with constant irregular cross-sections. Ultrasonics 2018, 89, 1–12. [Google Scholar] [CrossRef] [PubMed]
- Manbachi, A.; Cobbold, R.S.C. Development and application of piezoelectric materials for ultrasound generation and detection. Ultrasound 2011, 19, 187–196. [Google Scholar] [CrossRef]
- Moser, F.; Jacobs, L.J.; Qu, J. Modeling elastic wave propagation in waveguides with the finite element method. NDT E Int. 1999, 32, 225–234. [Google Scholar] [CrossRef]
- ABAQUS. Abaqus User Manual, Version 6.14; Dassault Systemes Simulia Corp.: Providence, RI, USA, 2014. [Google Scholar]
- Ma, S.; Wu, Z.; Wang, Y.; Liu, K. The reflection of guided waves from simple dents in pipes. Ultrasonics 2015, 57, 190–197. [Google Scholar] [CrossRef]


| Transducer Number | Weight at 25 kHz | Weight at 80 kHz | Weight at 100 kHz | Weight at 155 kHz |
|---|---|---|---|---|
| 1 | 0.9726 | 0.7181 | 0.1310 | 0.6356 |
| 2 | 0.9789 | 0.9467 | 0.1255 | 0.2772 |
| 3 | 0.9818 | 0.9835 | 0.1361 | 0.1111 |
| 4 | 0.9790 | 0.8389 | 0.2377 | 0.3363 |
| 5 | 0.9681 | 0.8251 | 0.1958 | 0.3239 |
| 6 | 0.9842 | 1 | 0.1944 | 0.1294 |
| 7 | 0.9908 | 0.9467 | 0.0767 | 0.2478 |
| 8 | 0.9954 | 0.1684 | 0.0692 | 0.6736 |
| 9 | 0.9966 | 0.0978 | 0.2064 | 0.3287 |
| 10 | 0.9903 | 0.1645 | 0.5762 | 0.2983 |
| 11 | 0.9771 | 0.0816 | 0.8560 | 0.6964 |
| 12 | 0.9565 | 0.0570 | 1 | 0.9959 |
| 13 | 0.9516 | 0.0879 | 0.9616 | 1 |
| 14 | 0.9777 | 0.1198 | 0.9131 | 0.6903 |
| 15 | 0.9944 | 0.1687 | 0.5446 | 0.3084 |
| 16 | 1 | 0.0530 | 0.1641 | 0.3206 |
| 17 | 0.9944 | 0.1584 | 0.0004 | 0.6779 |
| 18 | 0.9791 | 0.4337 | 0.0167 | 0.8351 |
| Parameter | Setup |
|---|---|
| Analysis type | Dynamic, Implicit |
| Step | 0.1 s |
| Element size | 0.5 mm (PZT) |
| 2 mm (plate) | |
| Element type | C3D8E (PZT) |
| C3D8 (plate) |
| Density | Young’s Modulus | Electrical Permittivity | Piezoelectric |
|---|---|---|---|
| 7650 kg/m | 80 Gpa | D11 = 1.0005 Farad/m | −3.09 N/Volt·m |
| D22 = 1.0005 Farad/m | |||
| D33 = 8.0926 Farad/m |
| Damage | Signal | Location | Absolute Error | Relative Error |
|---|---|---|---|---|
| #1 | 25 kHz | 473.7 mm | 26.3 mm | 5.26% |
| SoM | 498.8 mm | 1.2 mm | 0.24% | |
| #2 | 25 kHz | 471.3 mm | 28.7 mm | 5.74% |
| SoM | 501.9 mm | 1.9 mm | 0.38% |
| Damge Position / End Position | Damage | 25 kHz | SoM |
|---|---|---|---|
| 725 mm / 1000 mm | #1-1(D5%) | / | 715.0 mm 1.38% |
| #1-2(D10%) | / | 715.8 mm 1.27% | |
| #1-3(D15%) | / | 717.2 mm 1.08% | |
| #1-4(D20%) | 745.8 mm 2.86% | 719.8 mm 0.72% | |
| 750 mm / 1500 mm | #2-1(D5%) | / | 765.4 mm 2.05% |
| #2-2(D10%) | / | 754.7 mm 0.63% | |
| #2-3(D15%) | / | 753.5 mm 0.47% | |
| #2-4(D20%) | 787.1 mm 4.95% | 752.2 mm 0.29% |
Publisher’s Note: MDPI stays neutral with regard to jurisdictional claims in published maps and institutional affiliations. |
© 2022 by the authors. Licensee MDPI, Basel, Switzerland. This article is an open access article distributed under the terms and conditions of the Creative Commons Attribution (CC BY) license (https://creativecommons.org/licenses/by/4.0/).
Share and Cite
Yang, Z.; Zhang, J.; Liu, K.; Zheng, Y.; Ma, S.; Wu, Z. Multi-Mode Ultrasonic Guided Waves Based Damage Detection in L-Bars with Asymmetric Cross-Section with Sum of Multiple Signals Method. Sensors 2022, 22, 922. https://doi.org/10.3390/s22030922
Yang Z, Zhang J, Liu K, Zheng Y, Ma S, Wu Z. Multi-Mode Ultrasonic Guided Waves Based Damage Detection in L-Bars with Asymmetric Cross-Section with Sum of Multiple Signals Method. Sensors. 2022; 22(3):922. https://doi.org/10.3390/s22030922
Chicago/Turabian StyleYang, Zhengyan, Jiaqi Zhang, Kehai Liu, Yuebin Zheng, Shuyi Ma, and Zhanjun Wu. 2022. "Multi-Mode Ultrasonic Guided Waves Based Damage Detection in L-Bars with Asymmetric Cross-Section with Sum of Multiple Signals Method" Sensors 22, no. 3: 922. https://doi.org/10.3390/s22030922
APA StyleYang, Z., Zhang, J., Liu, K., Zheng, Y., Ma, S., & Wu, Z. (2022). Multi-Mode Ultrasonic Guided Waves Based Damage Detection in L-Bars with Asymmetric Cross-Section with Sum of Multiple Signals Method. Sensors, 22(3), 922. https://doi.org/10.3390/s22030922