
Detection and Analysis of Corrosion and Contact Resistance Faults of TiN and CrN Coatings on 410 Stainless Steel as Bipolar Plates in PEM Fuel Cells

 ,
,  ,
,  ,
,  ,
,  and
and 
Abstract
:1. Introduction
2. Experimental Procedure
2.1. Material and BPP Sample
2.2. Coating Process
2.3. Surface Characterization
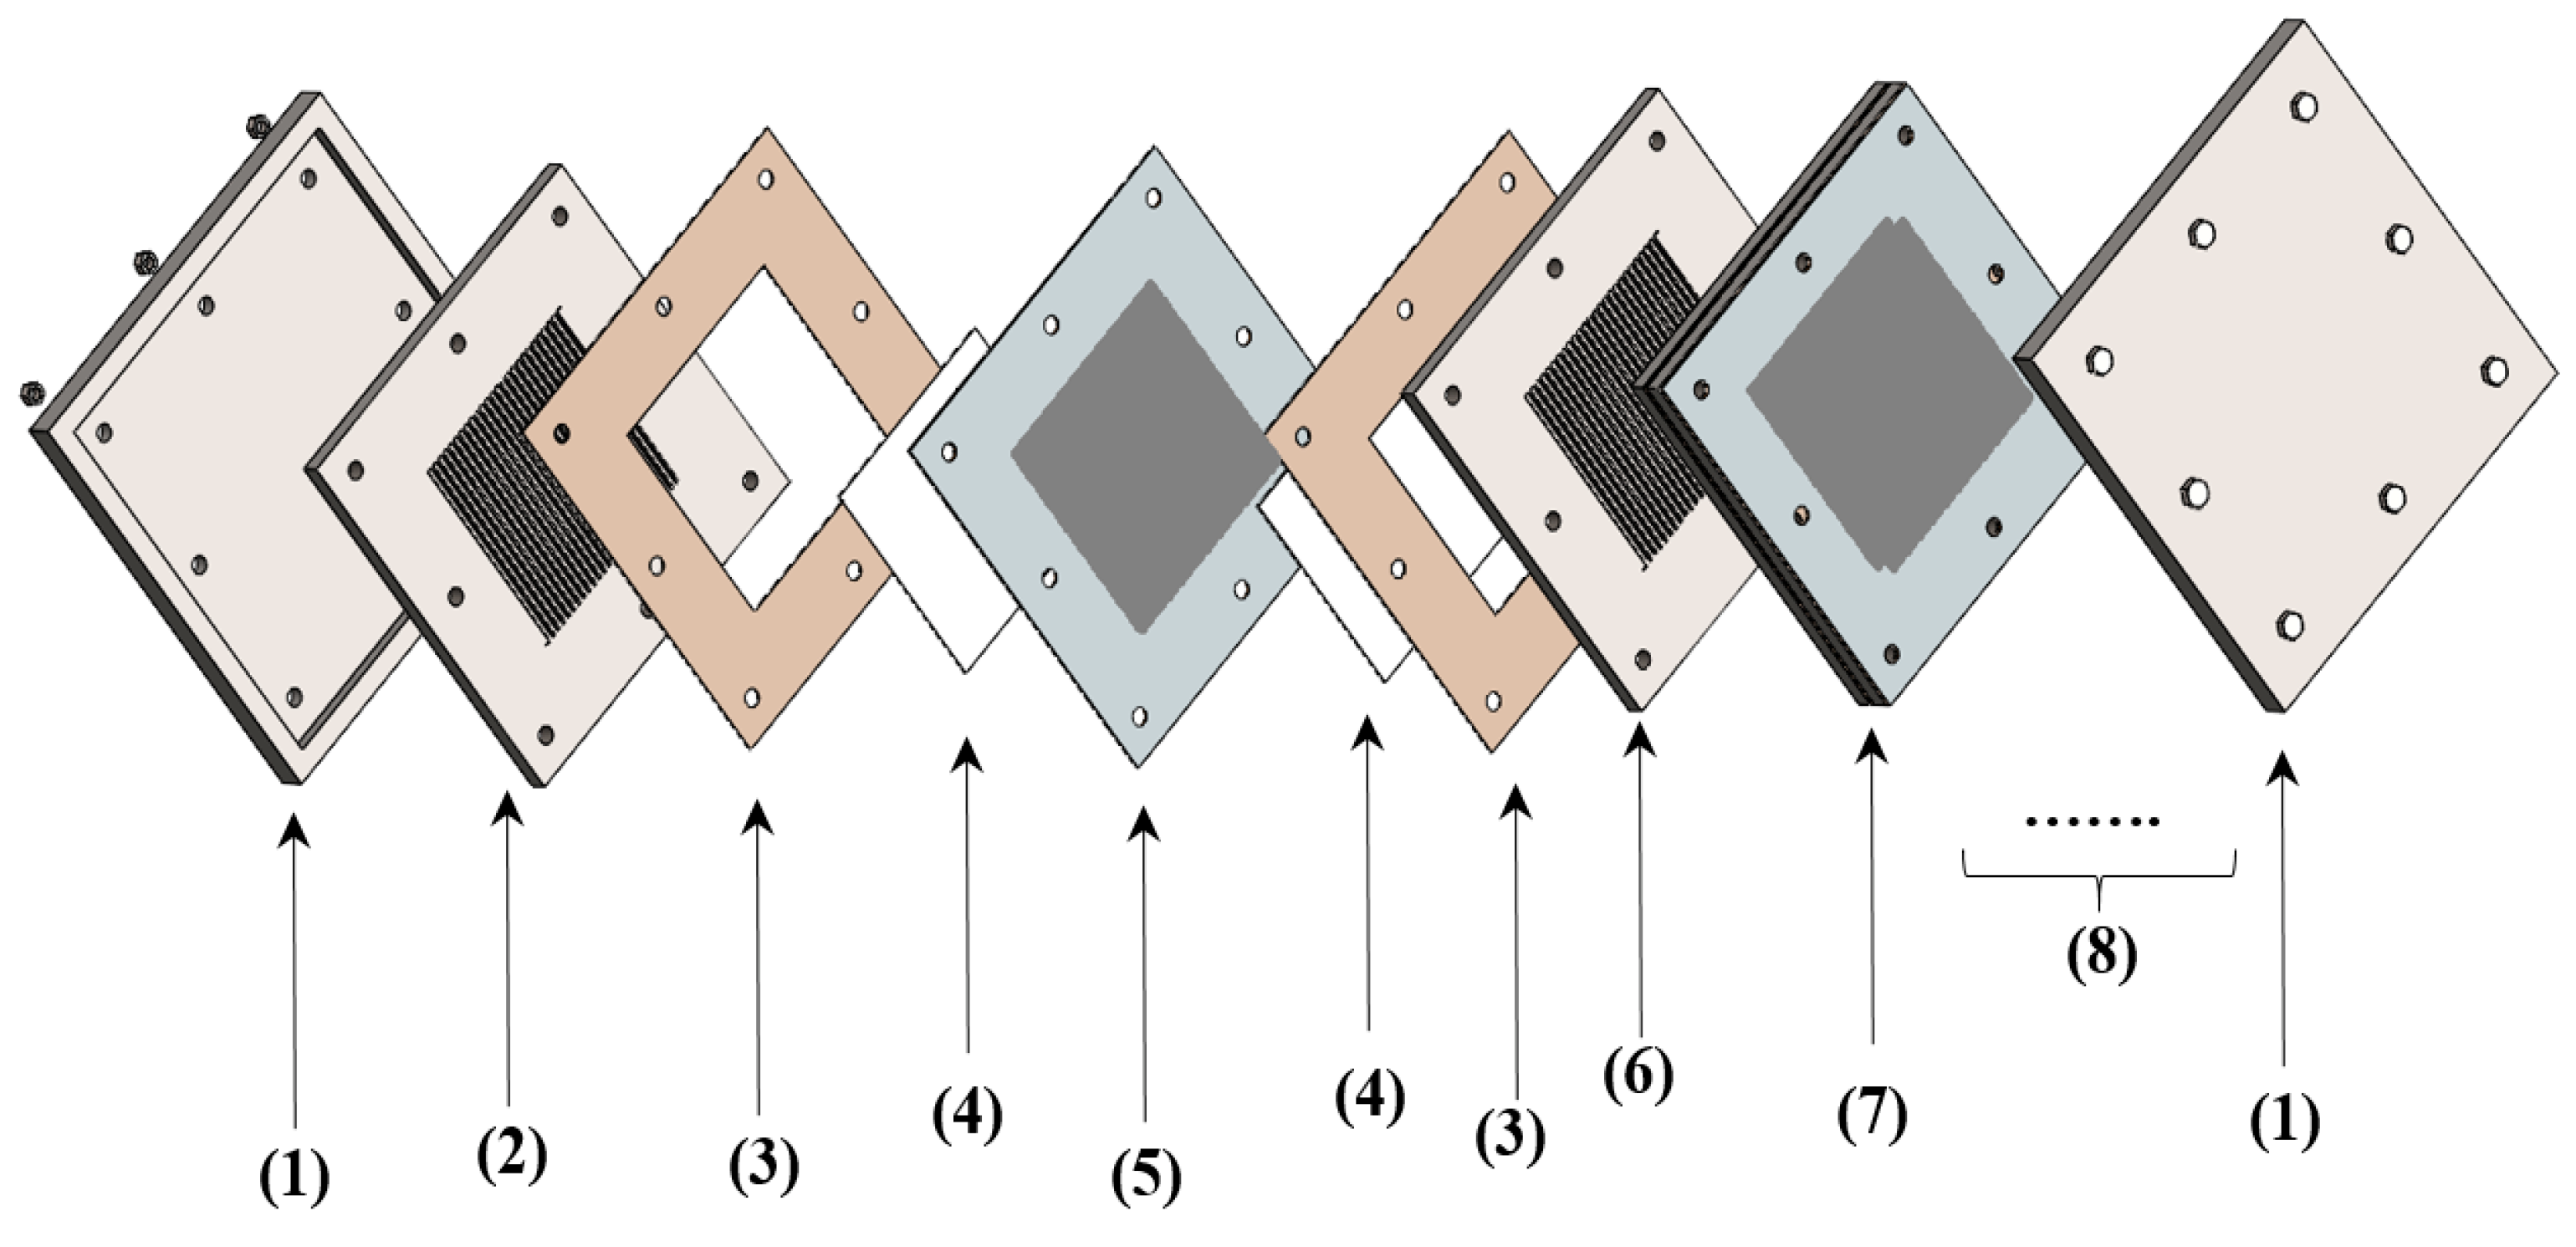
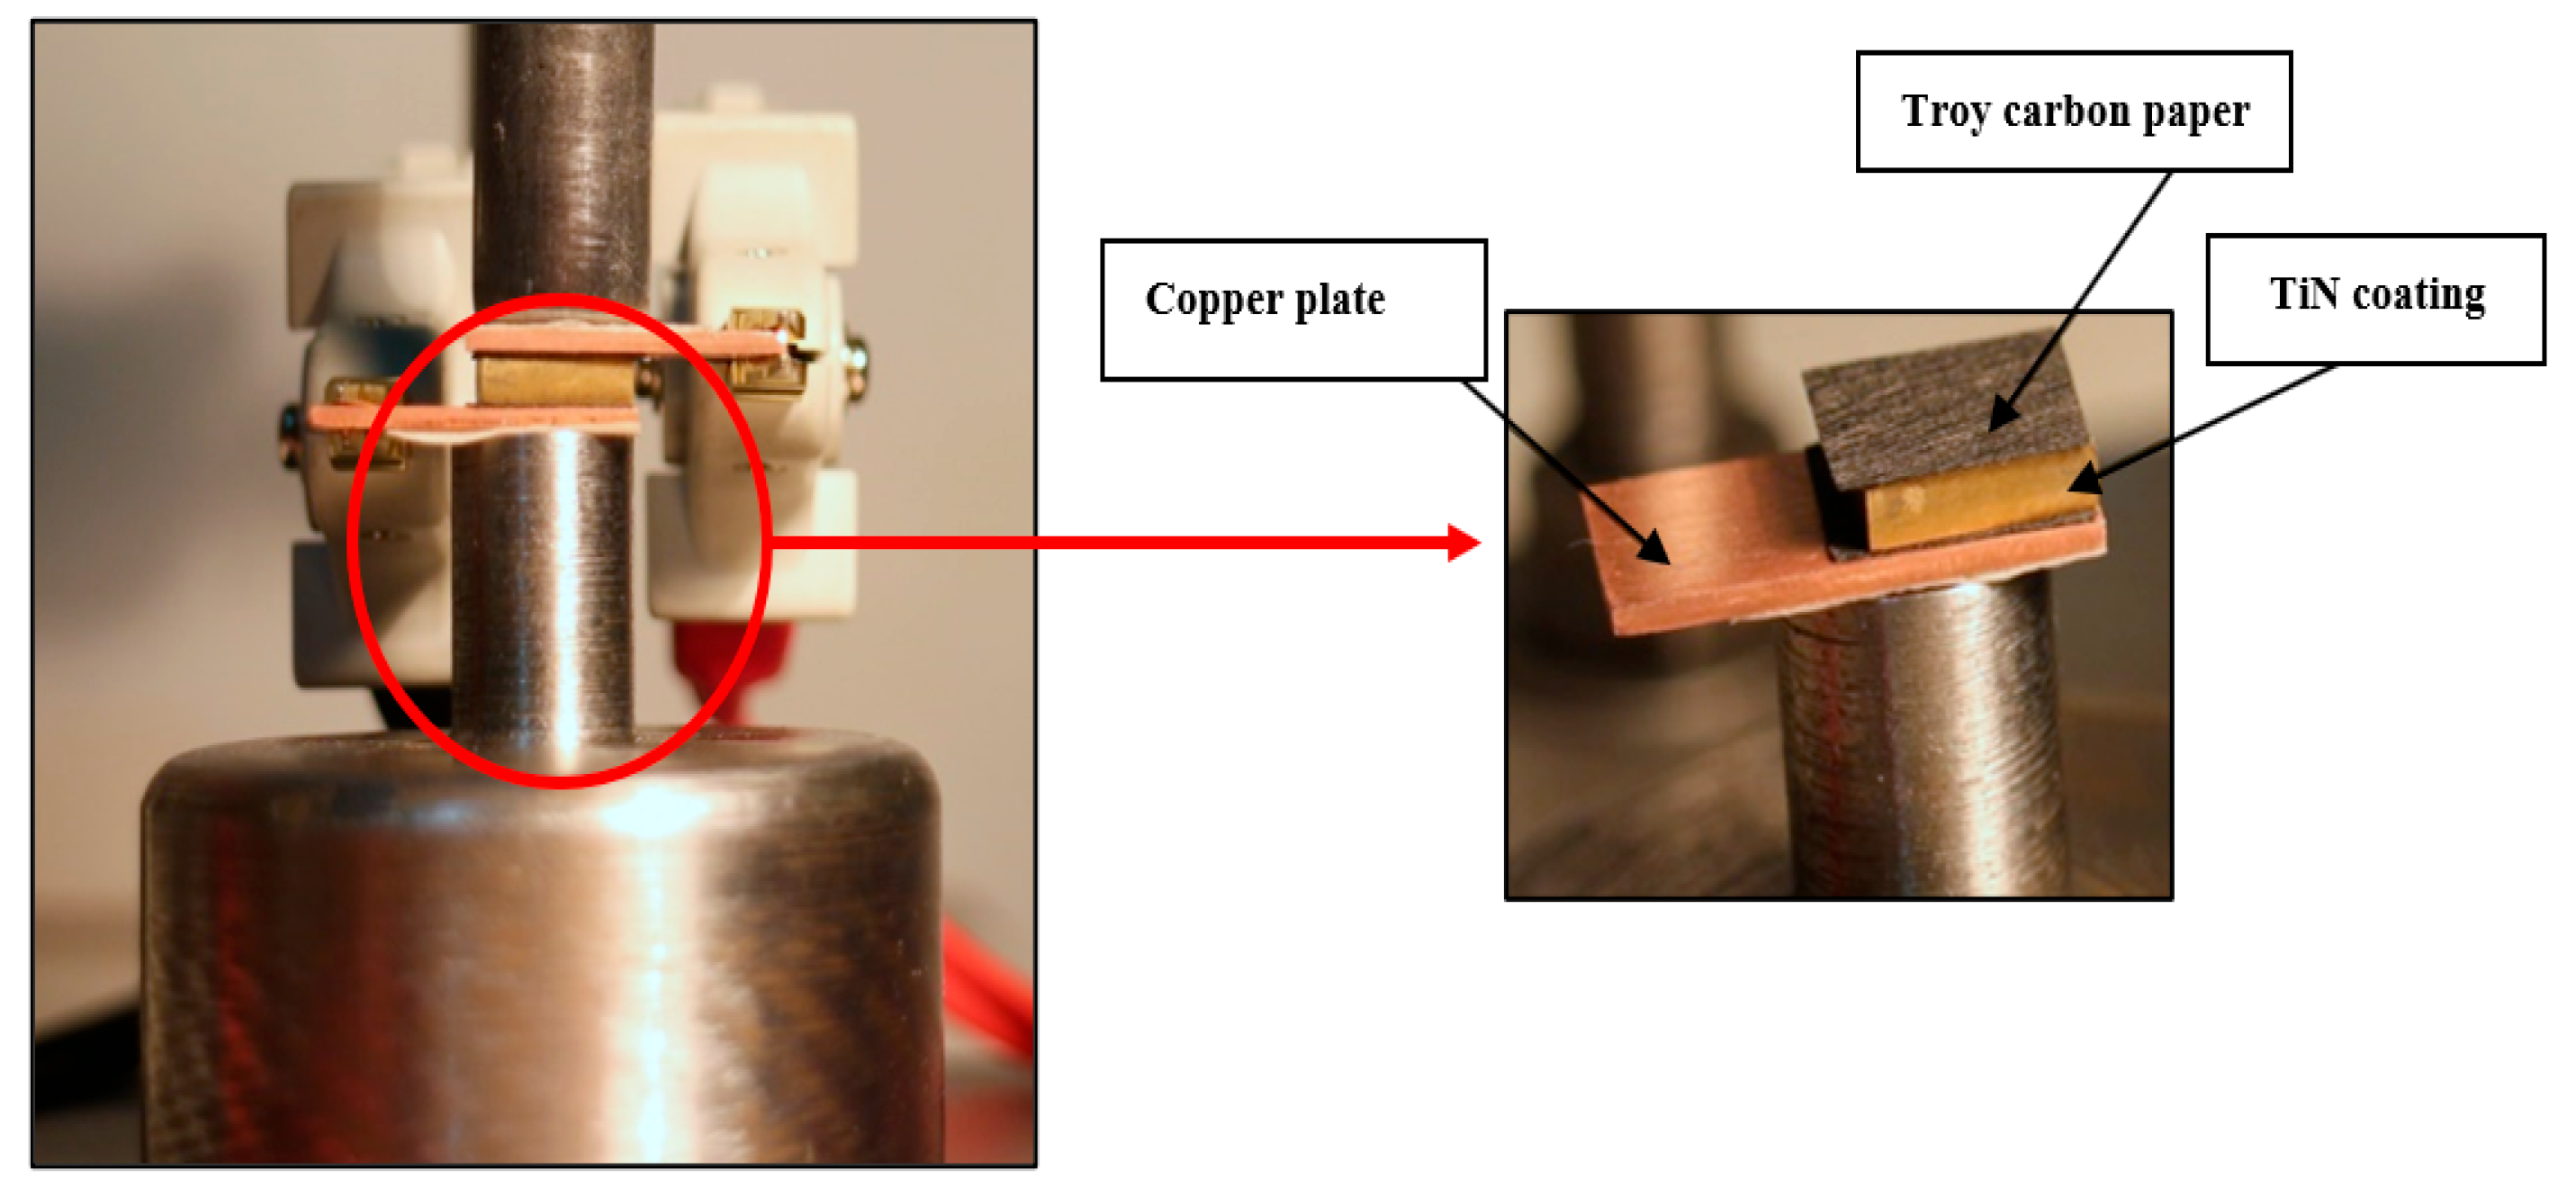
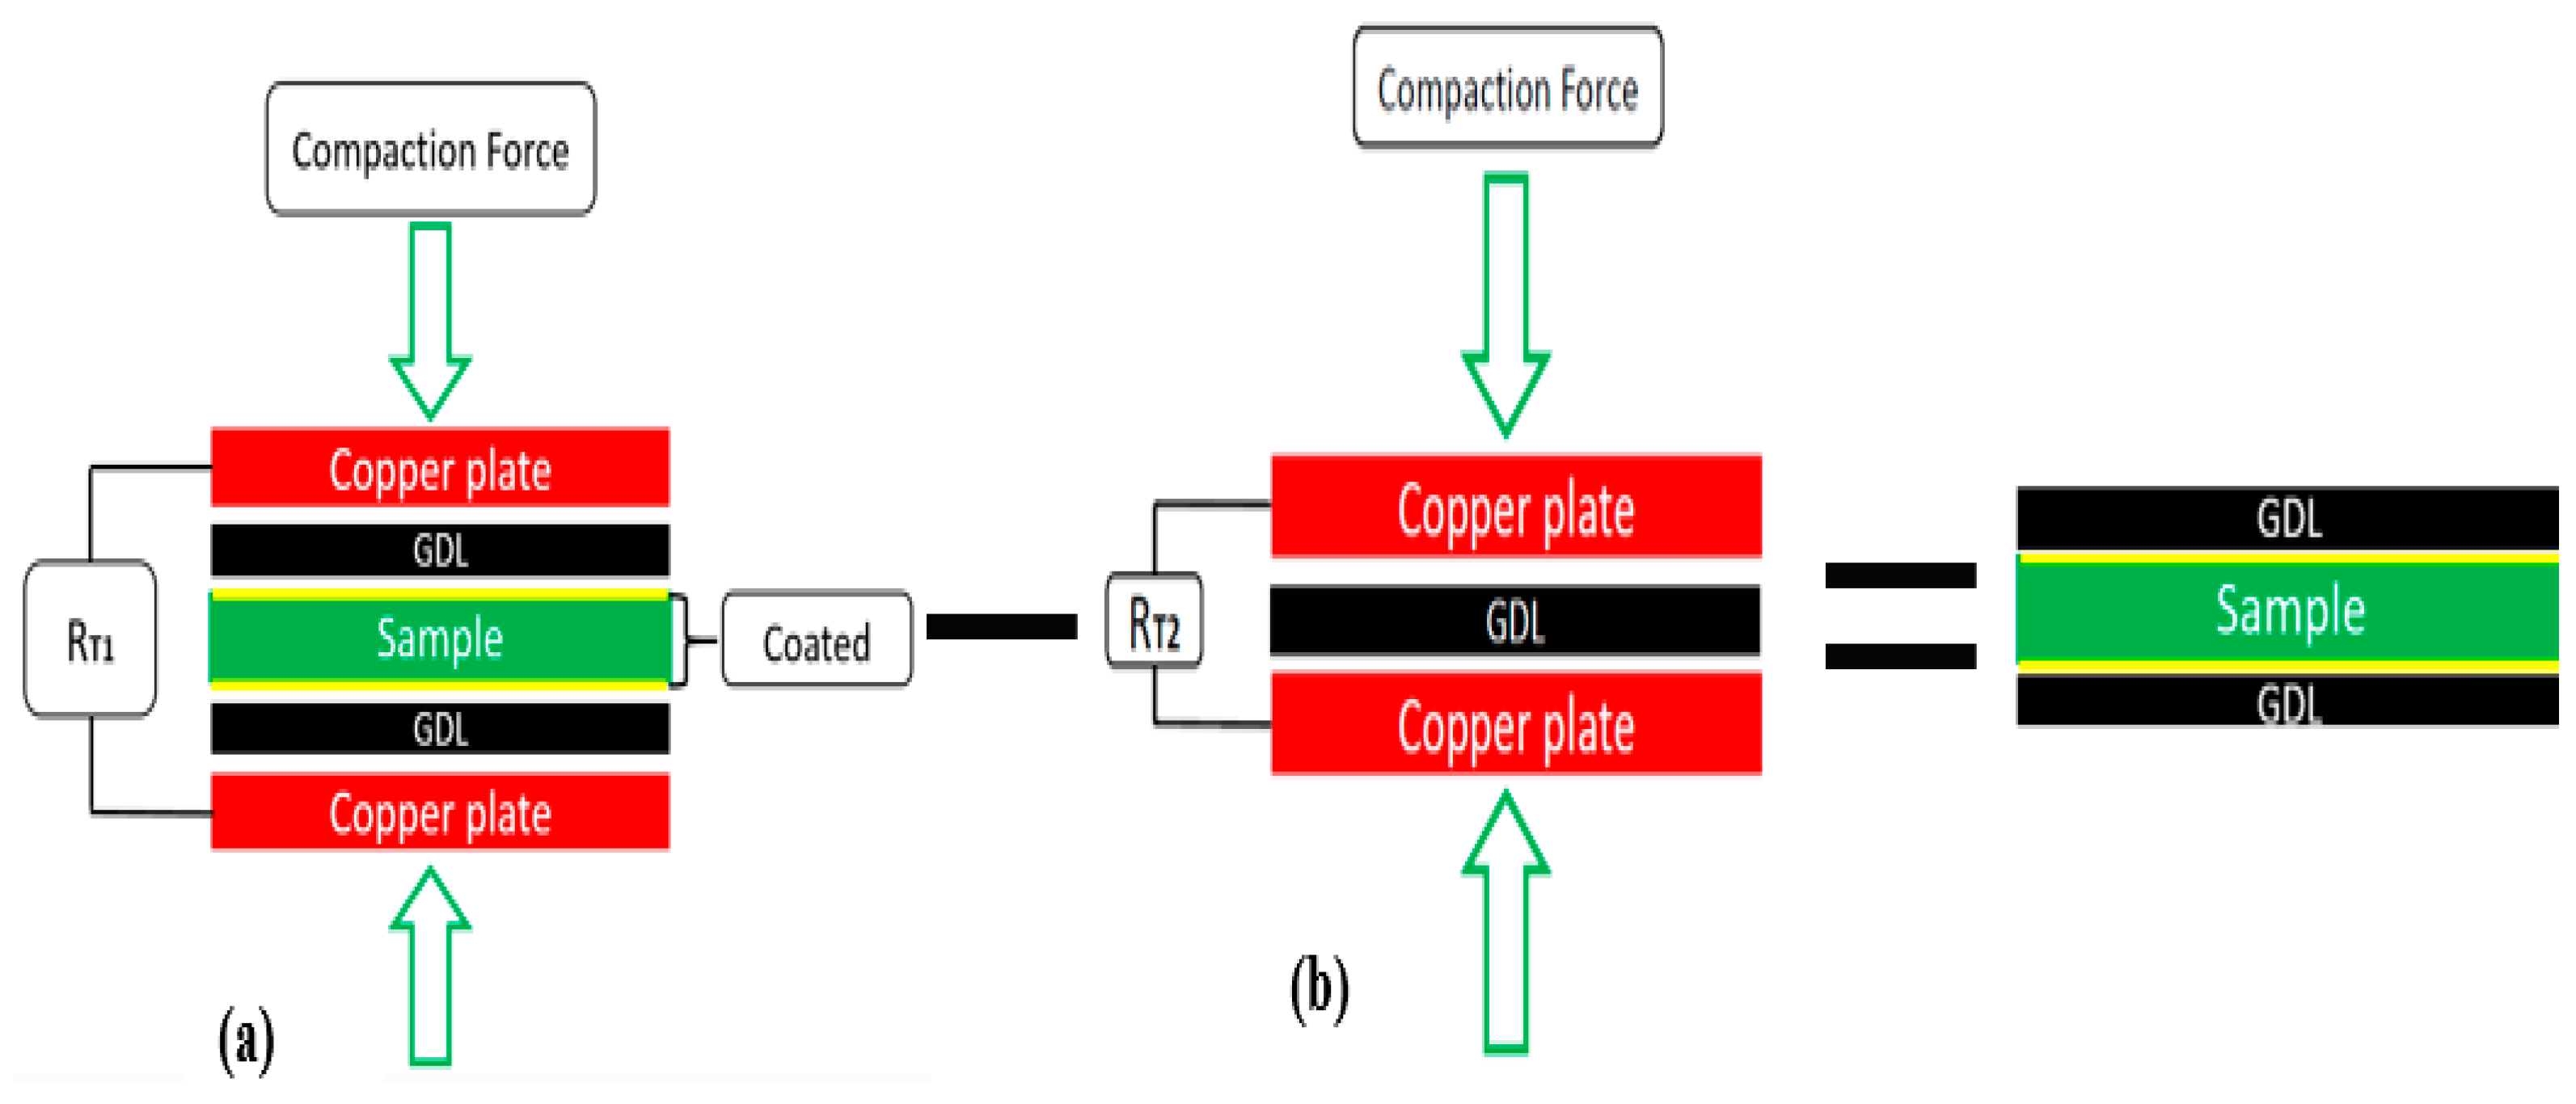
2.4. ICR Measurement Setup
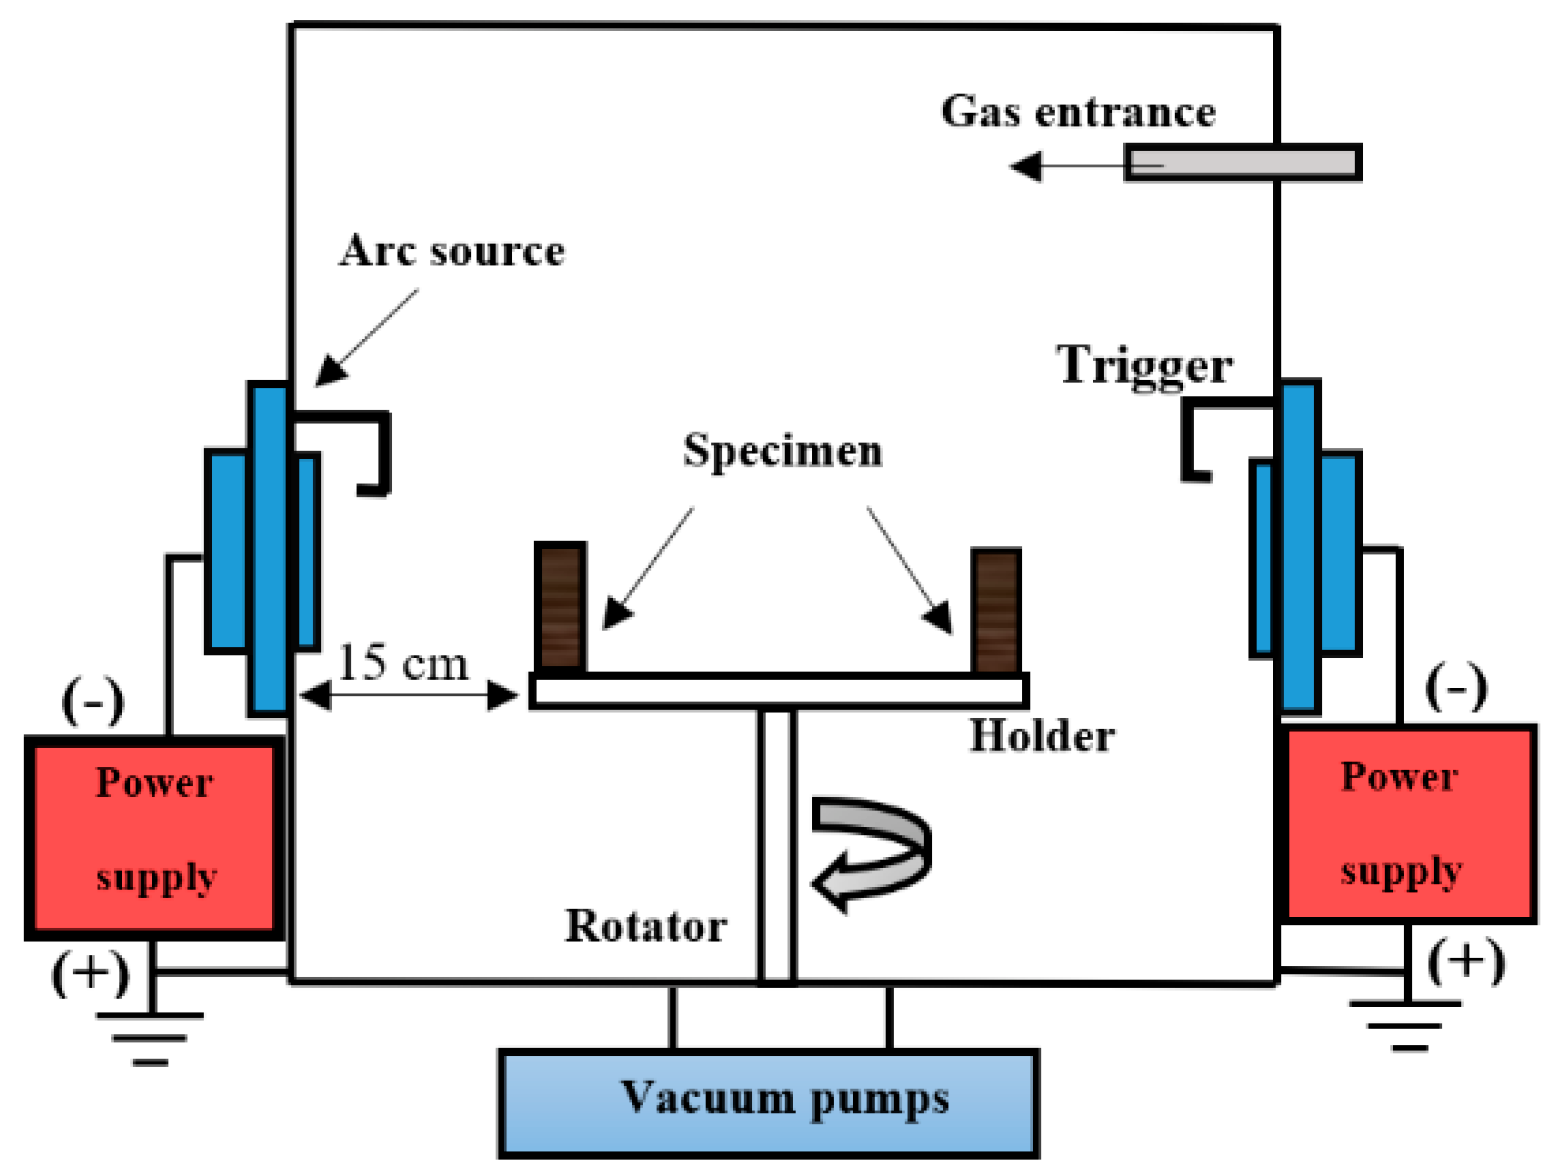
2.5. Corrosion Resistance Measurement
3. Results and Discussions
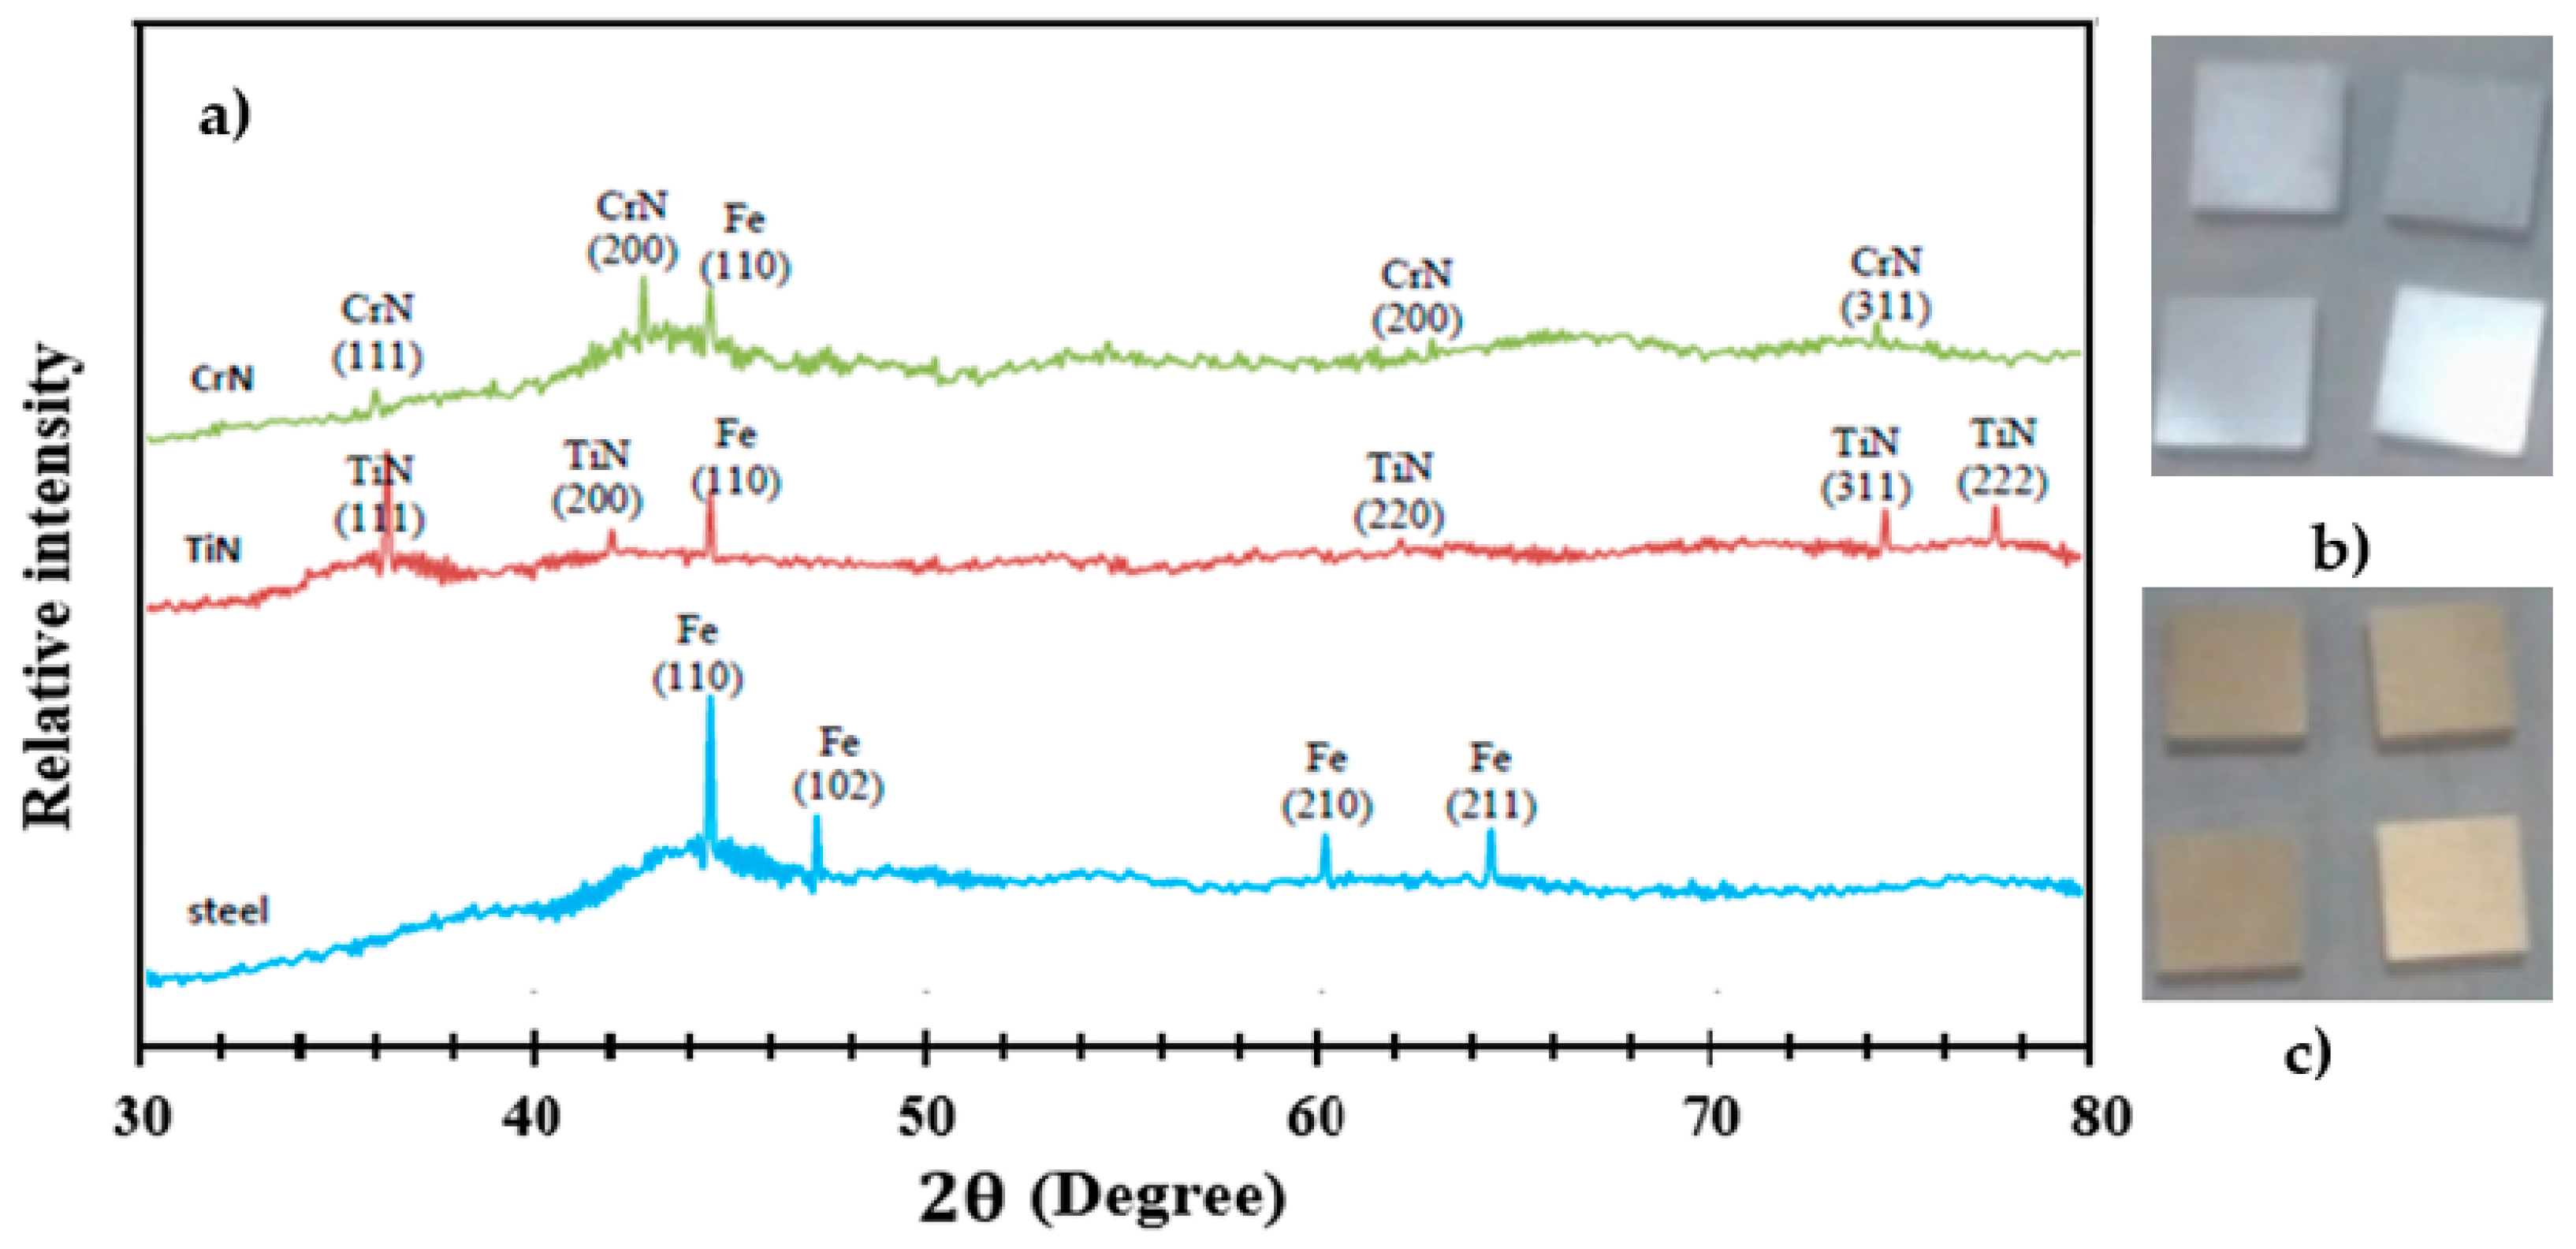
3.1. XRD Analysis
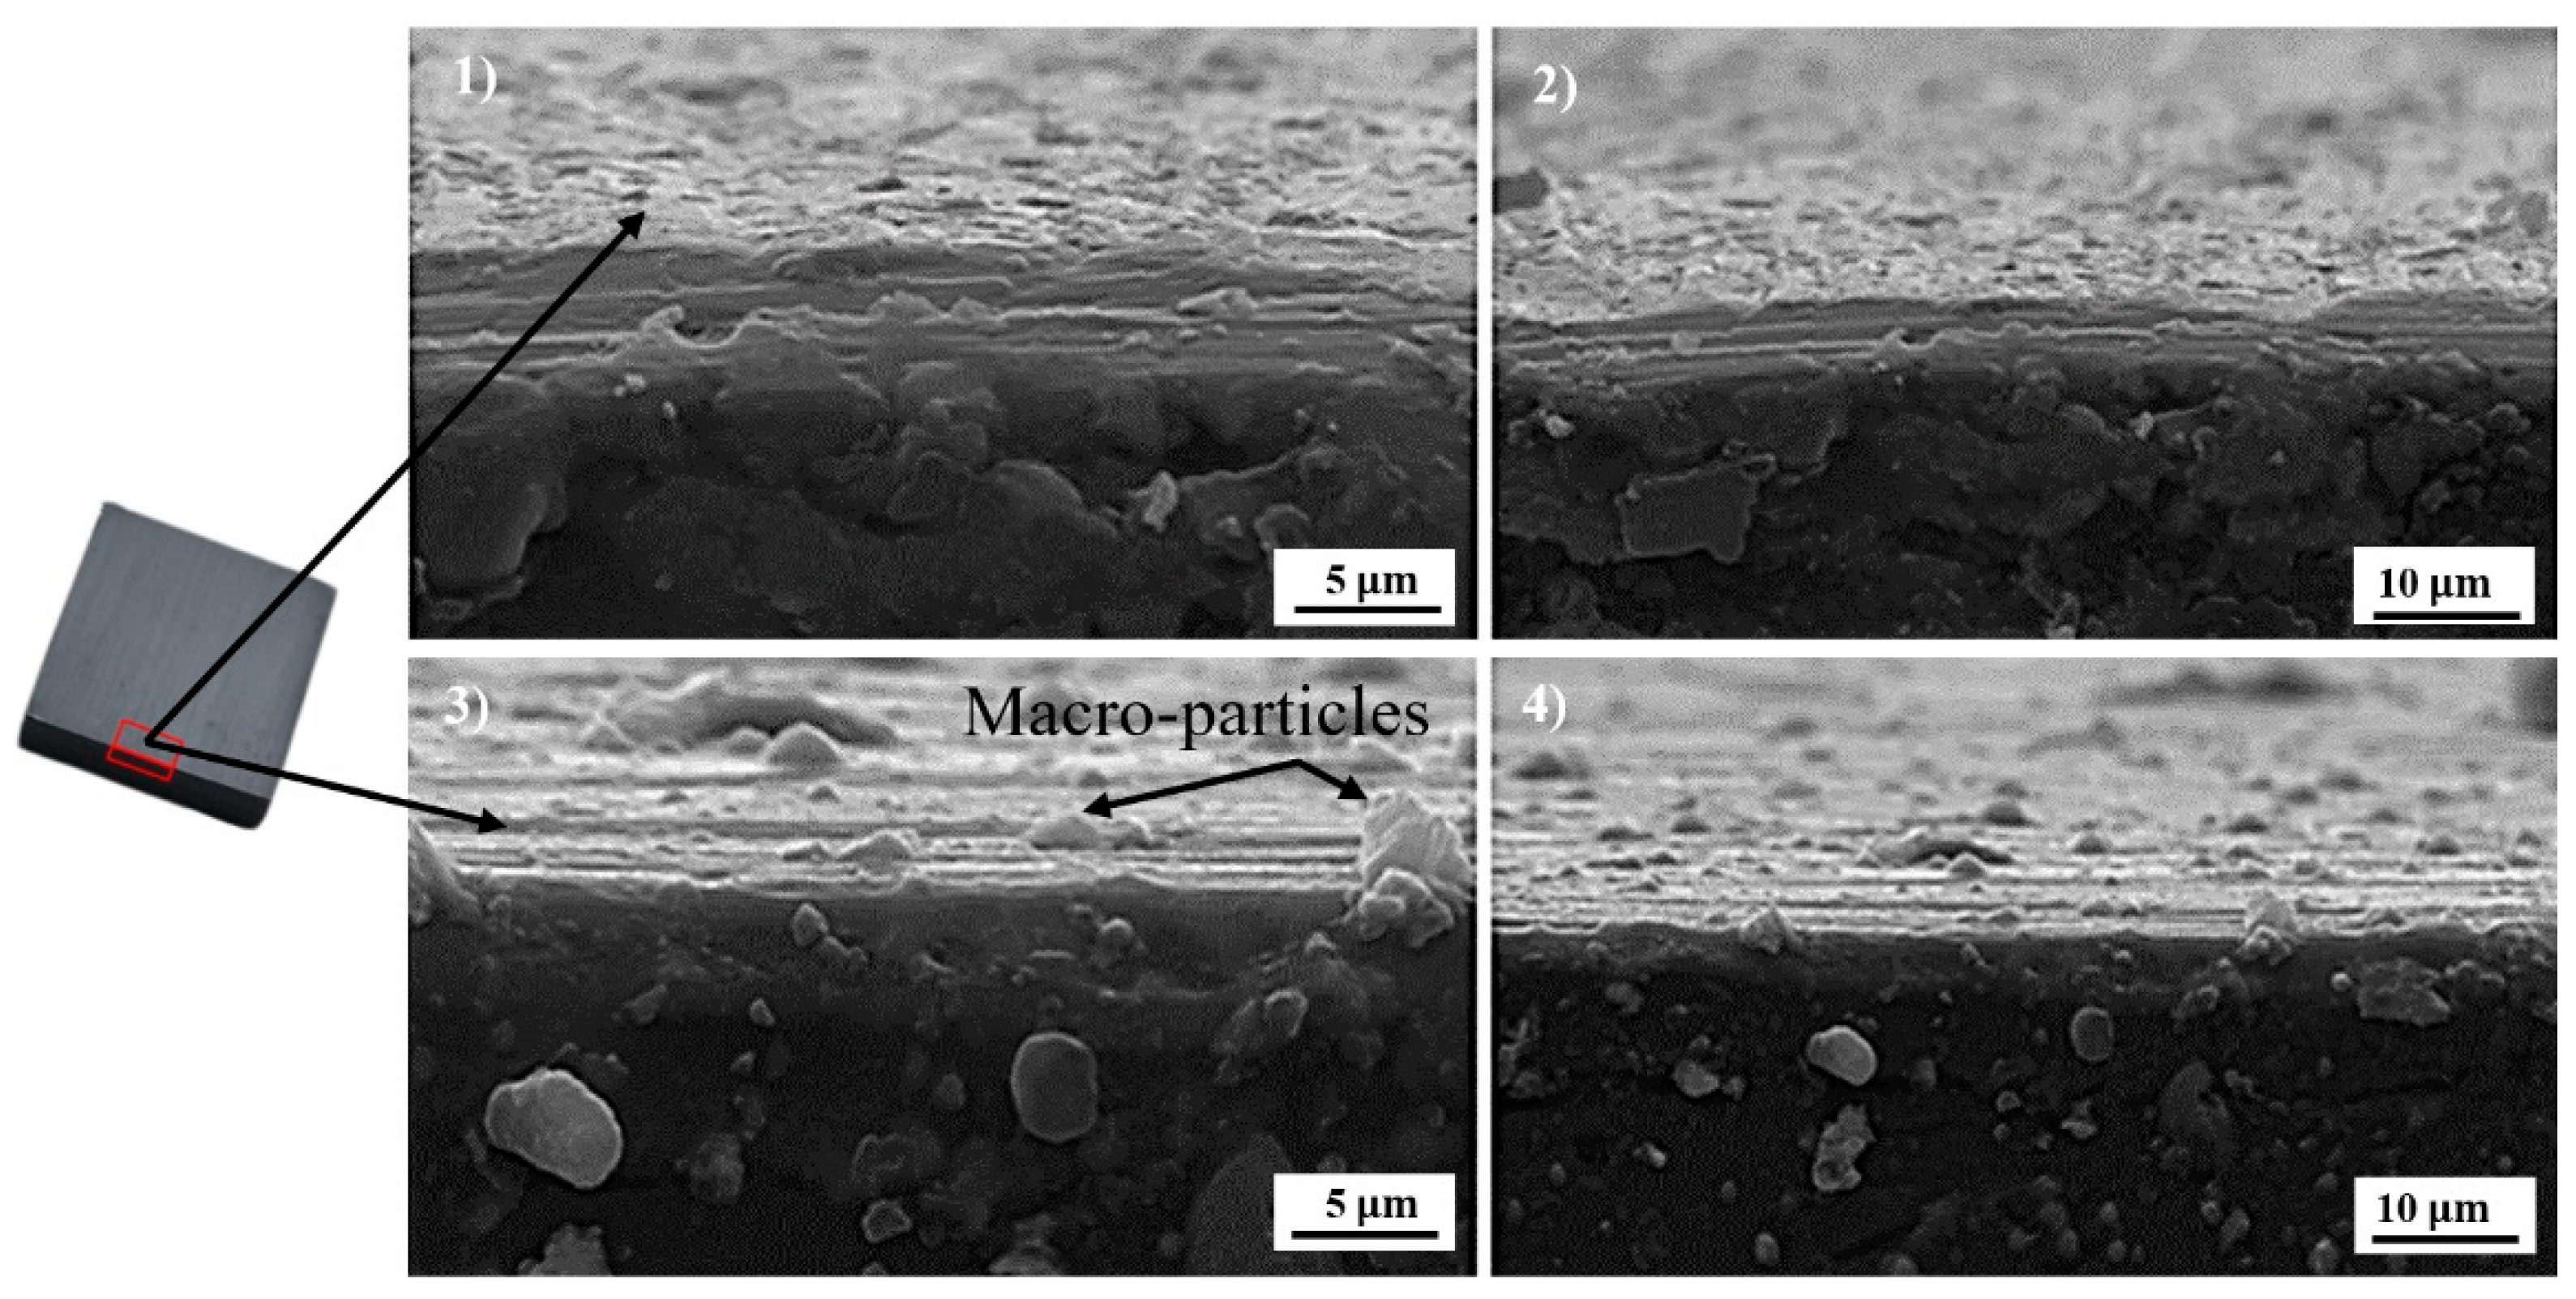
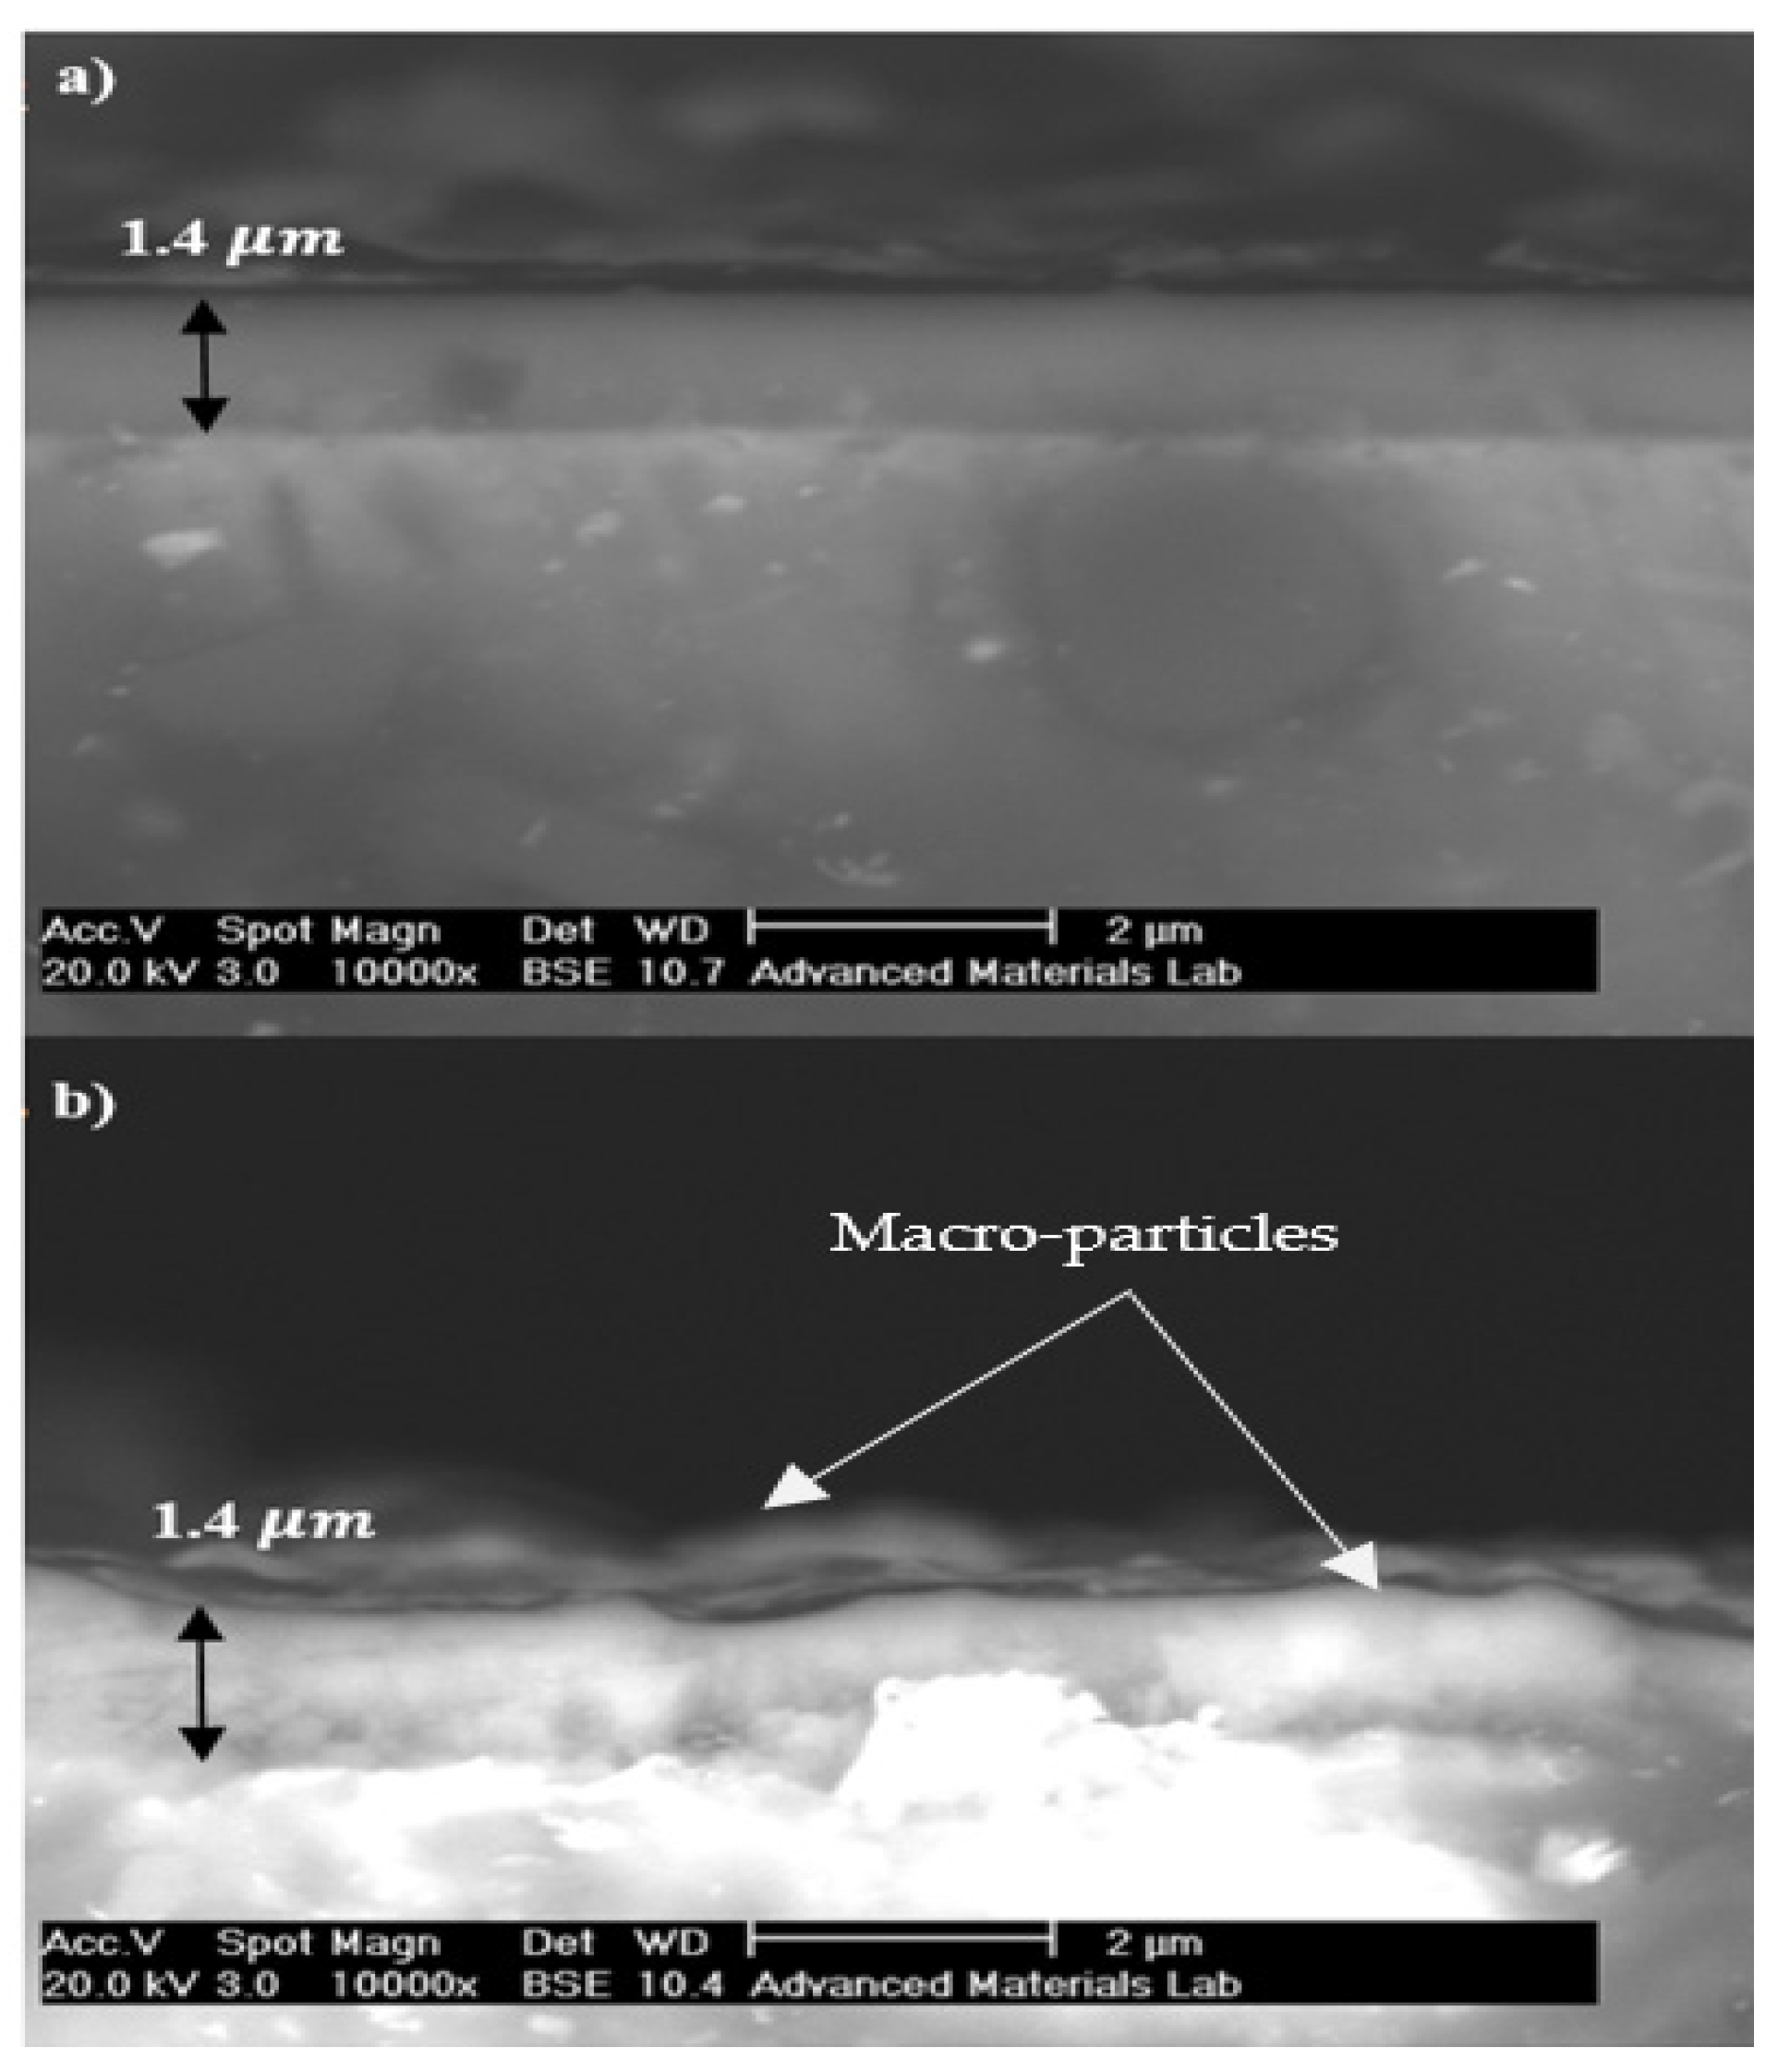
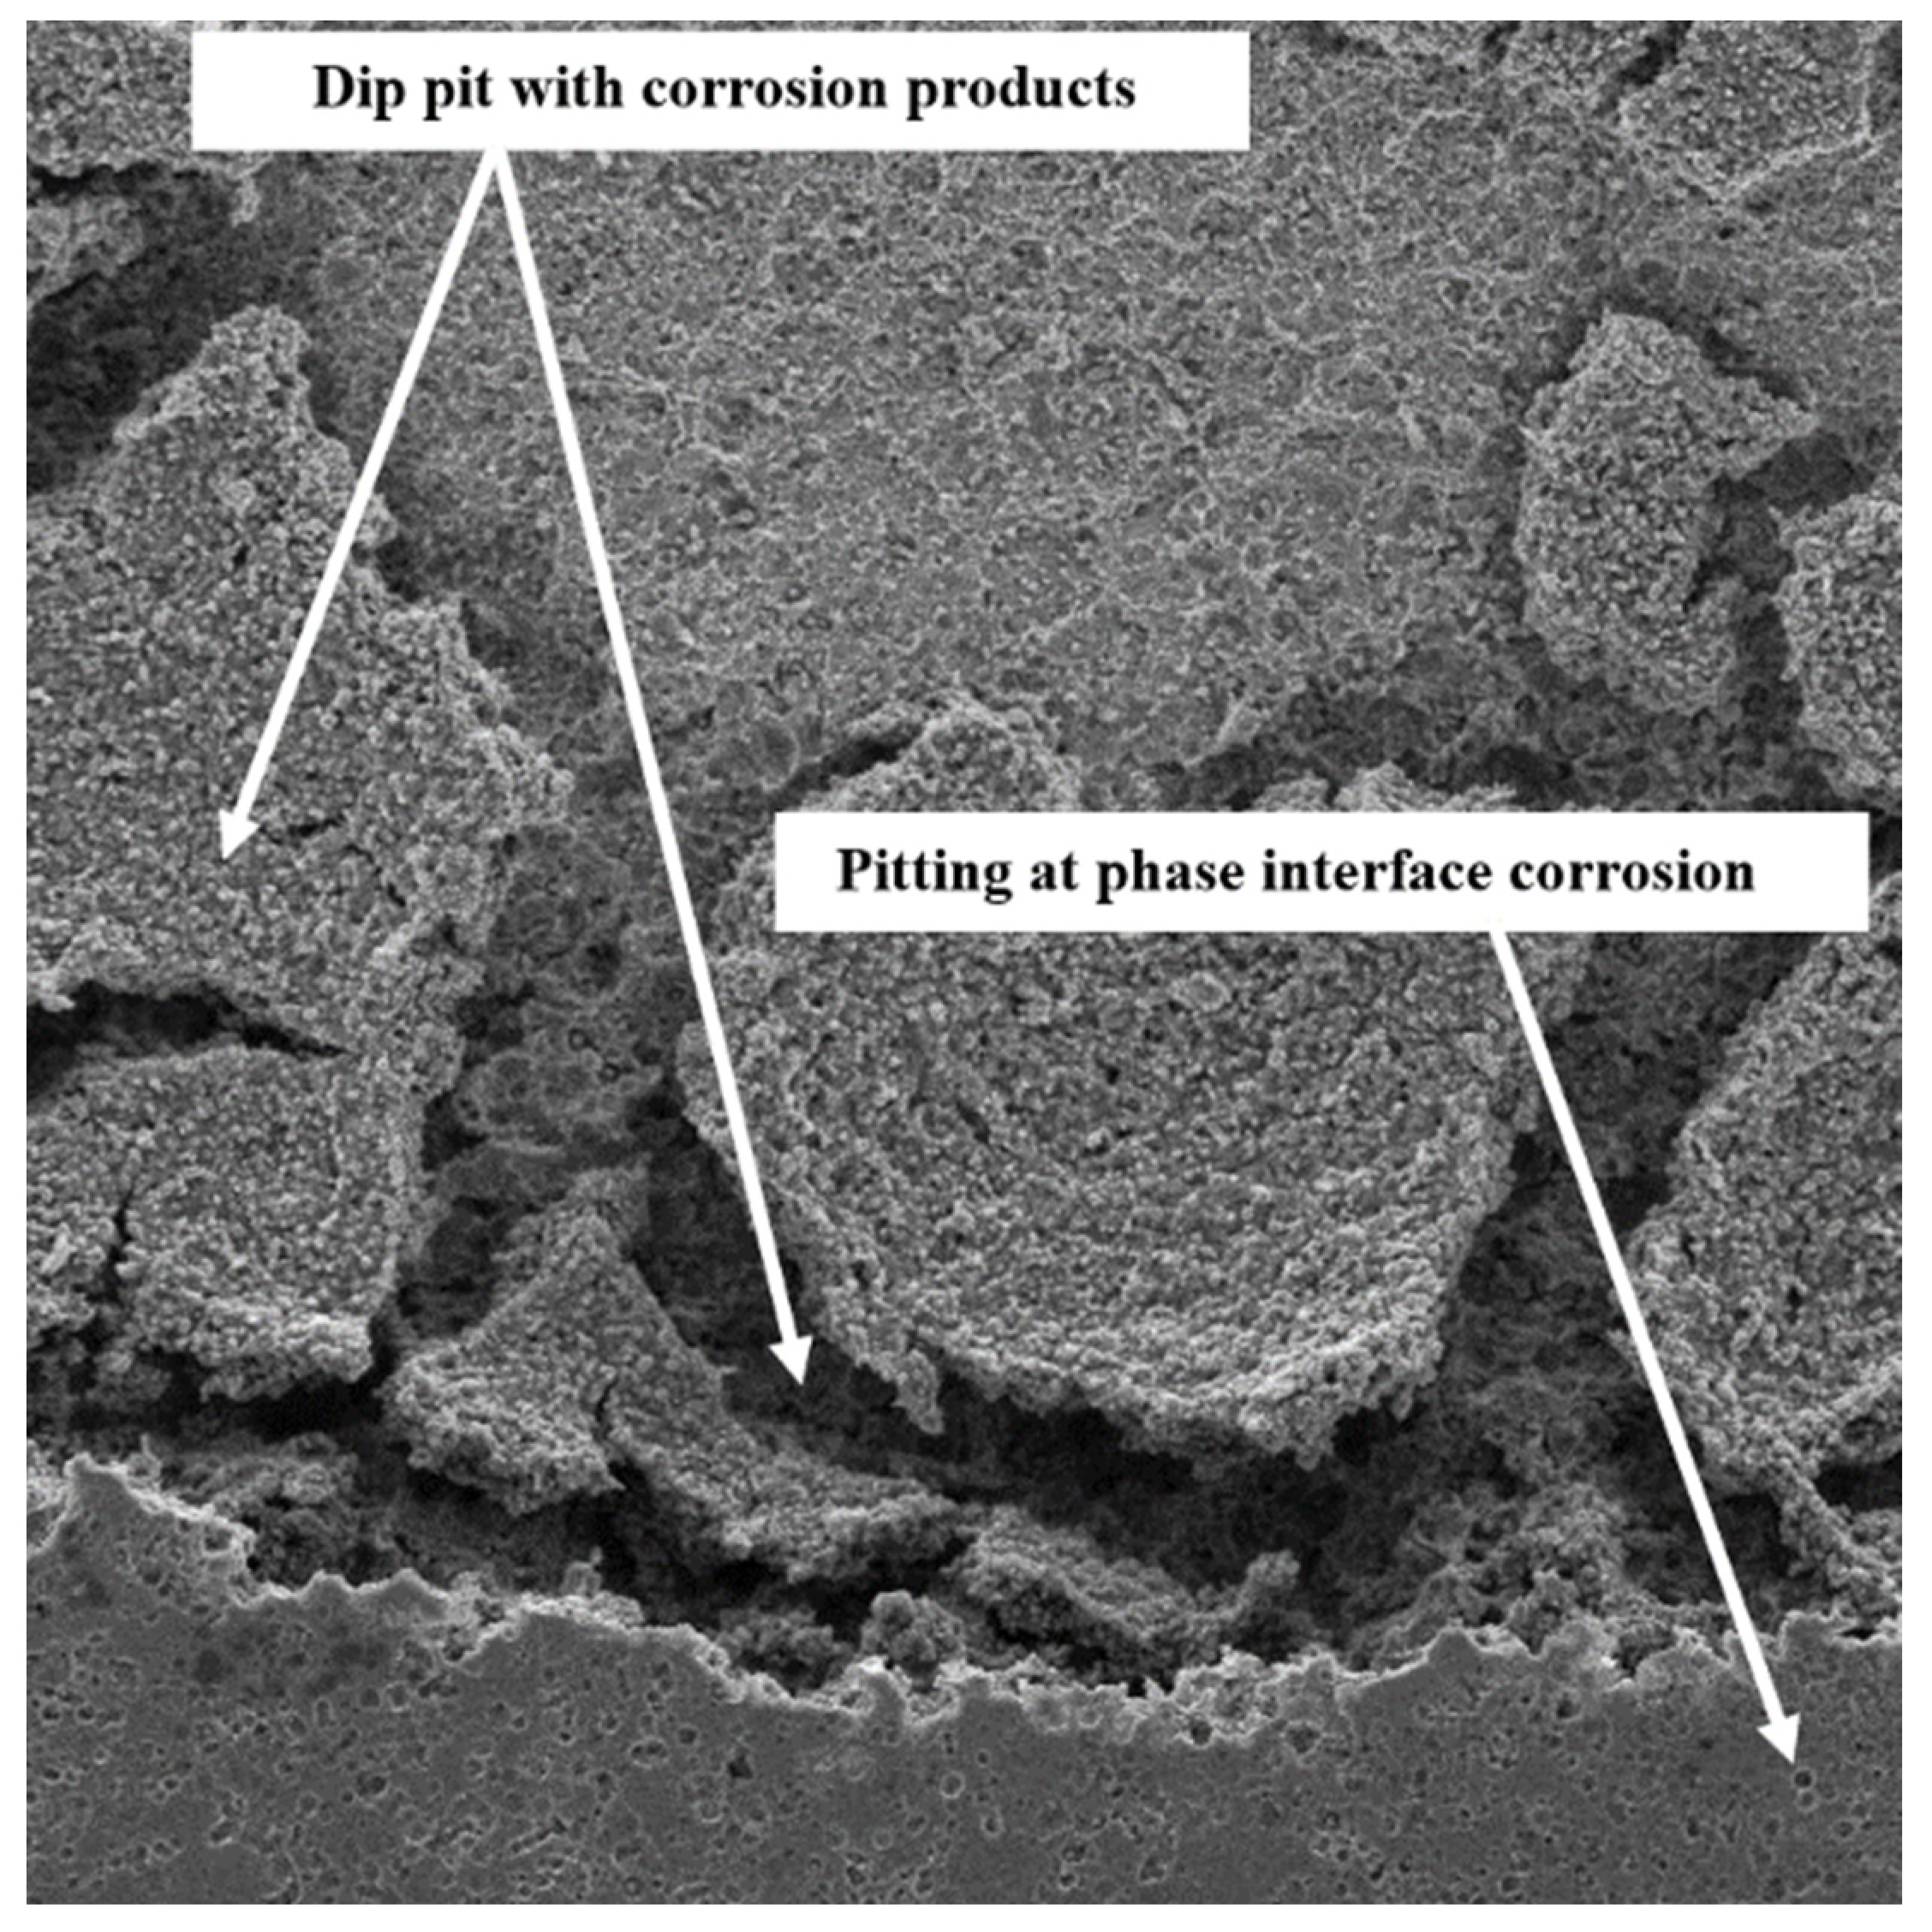
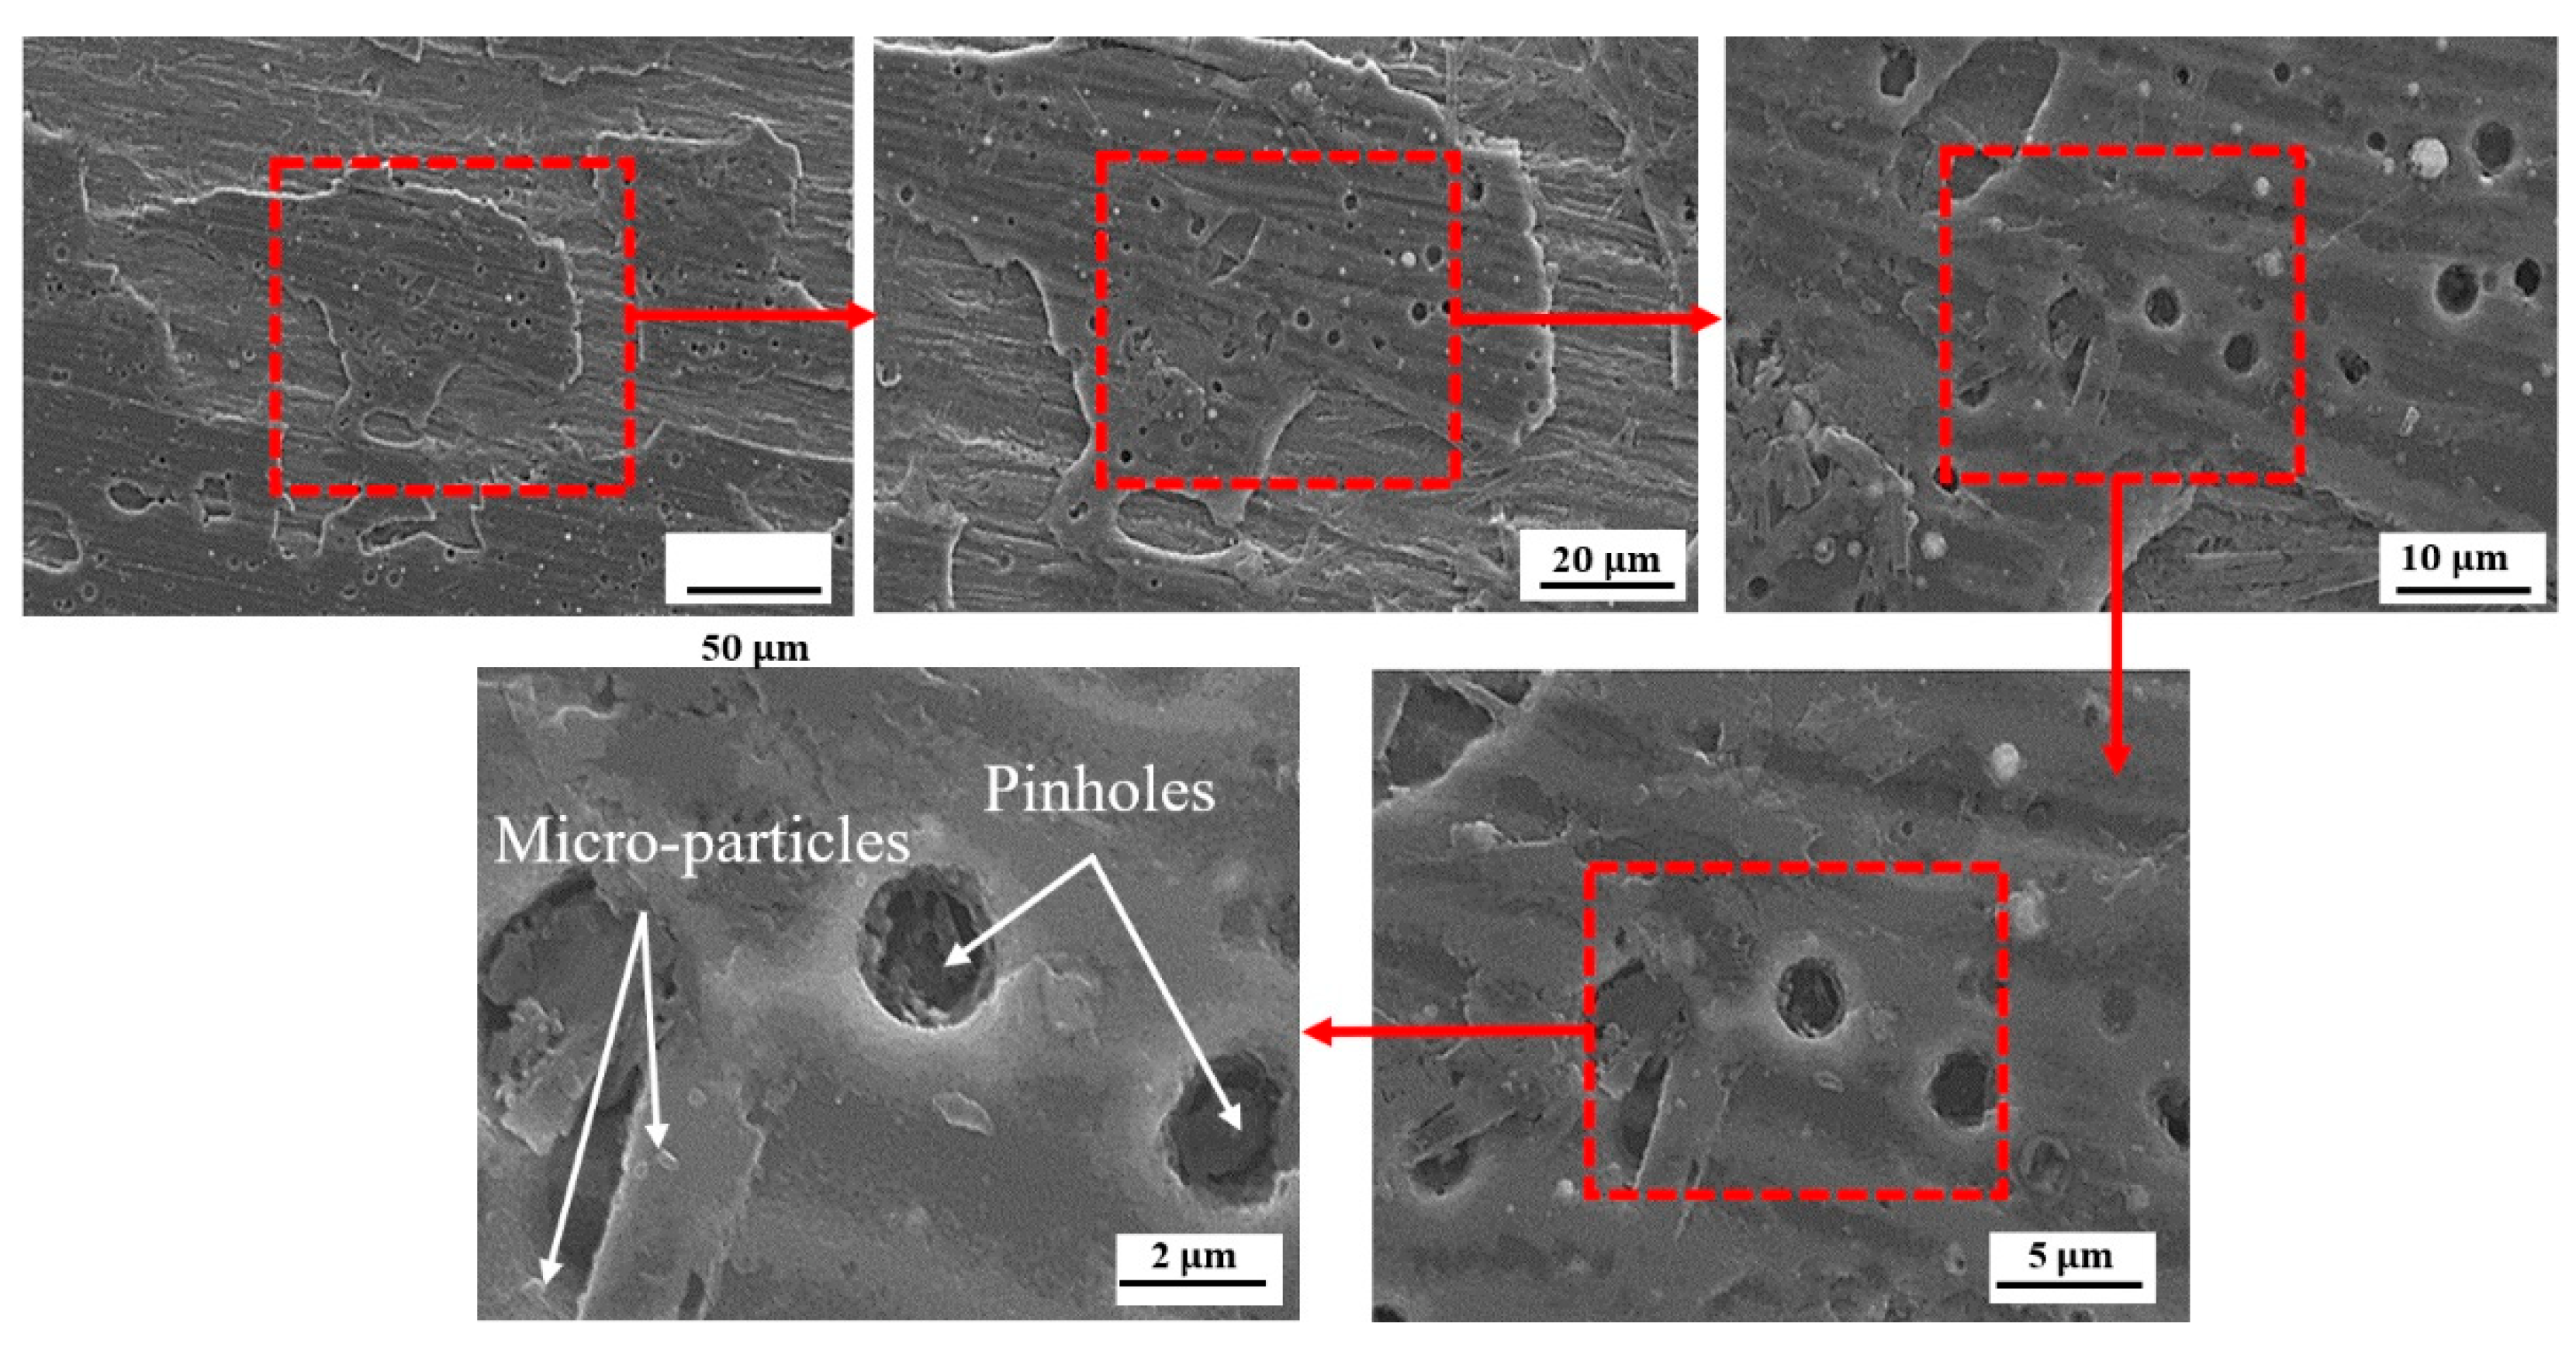
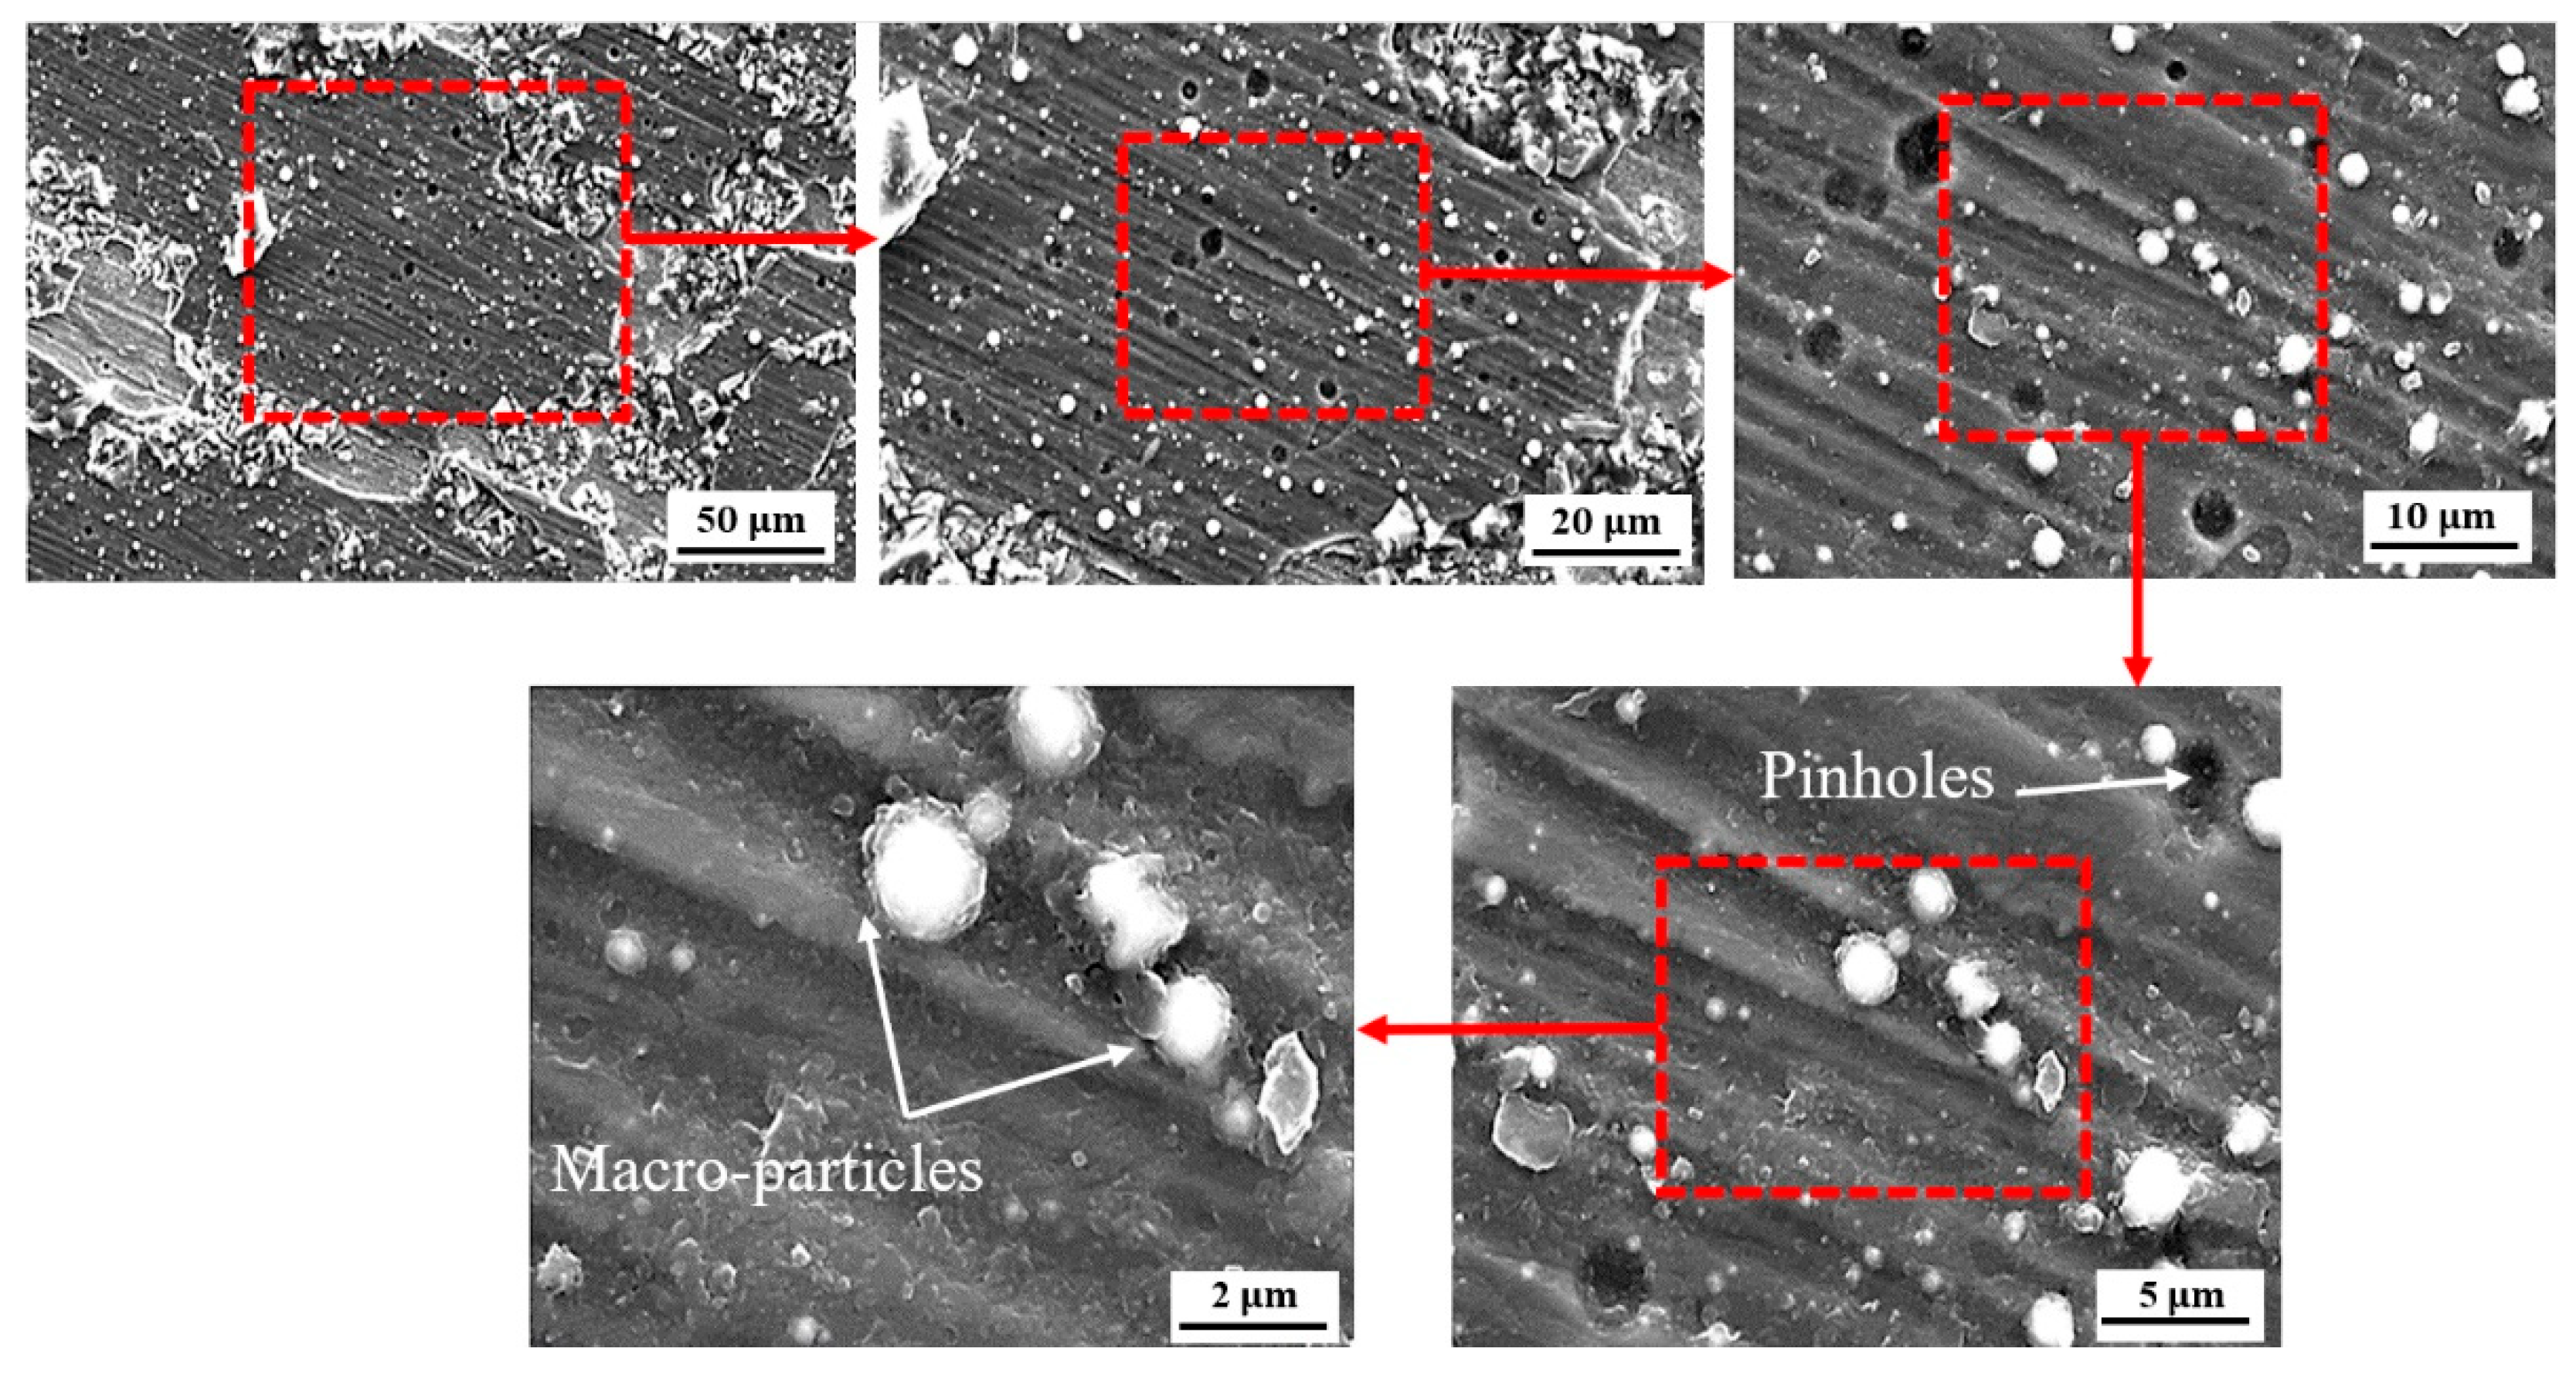
3.2. SEM Observation
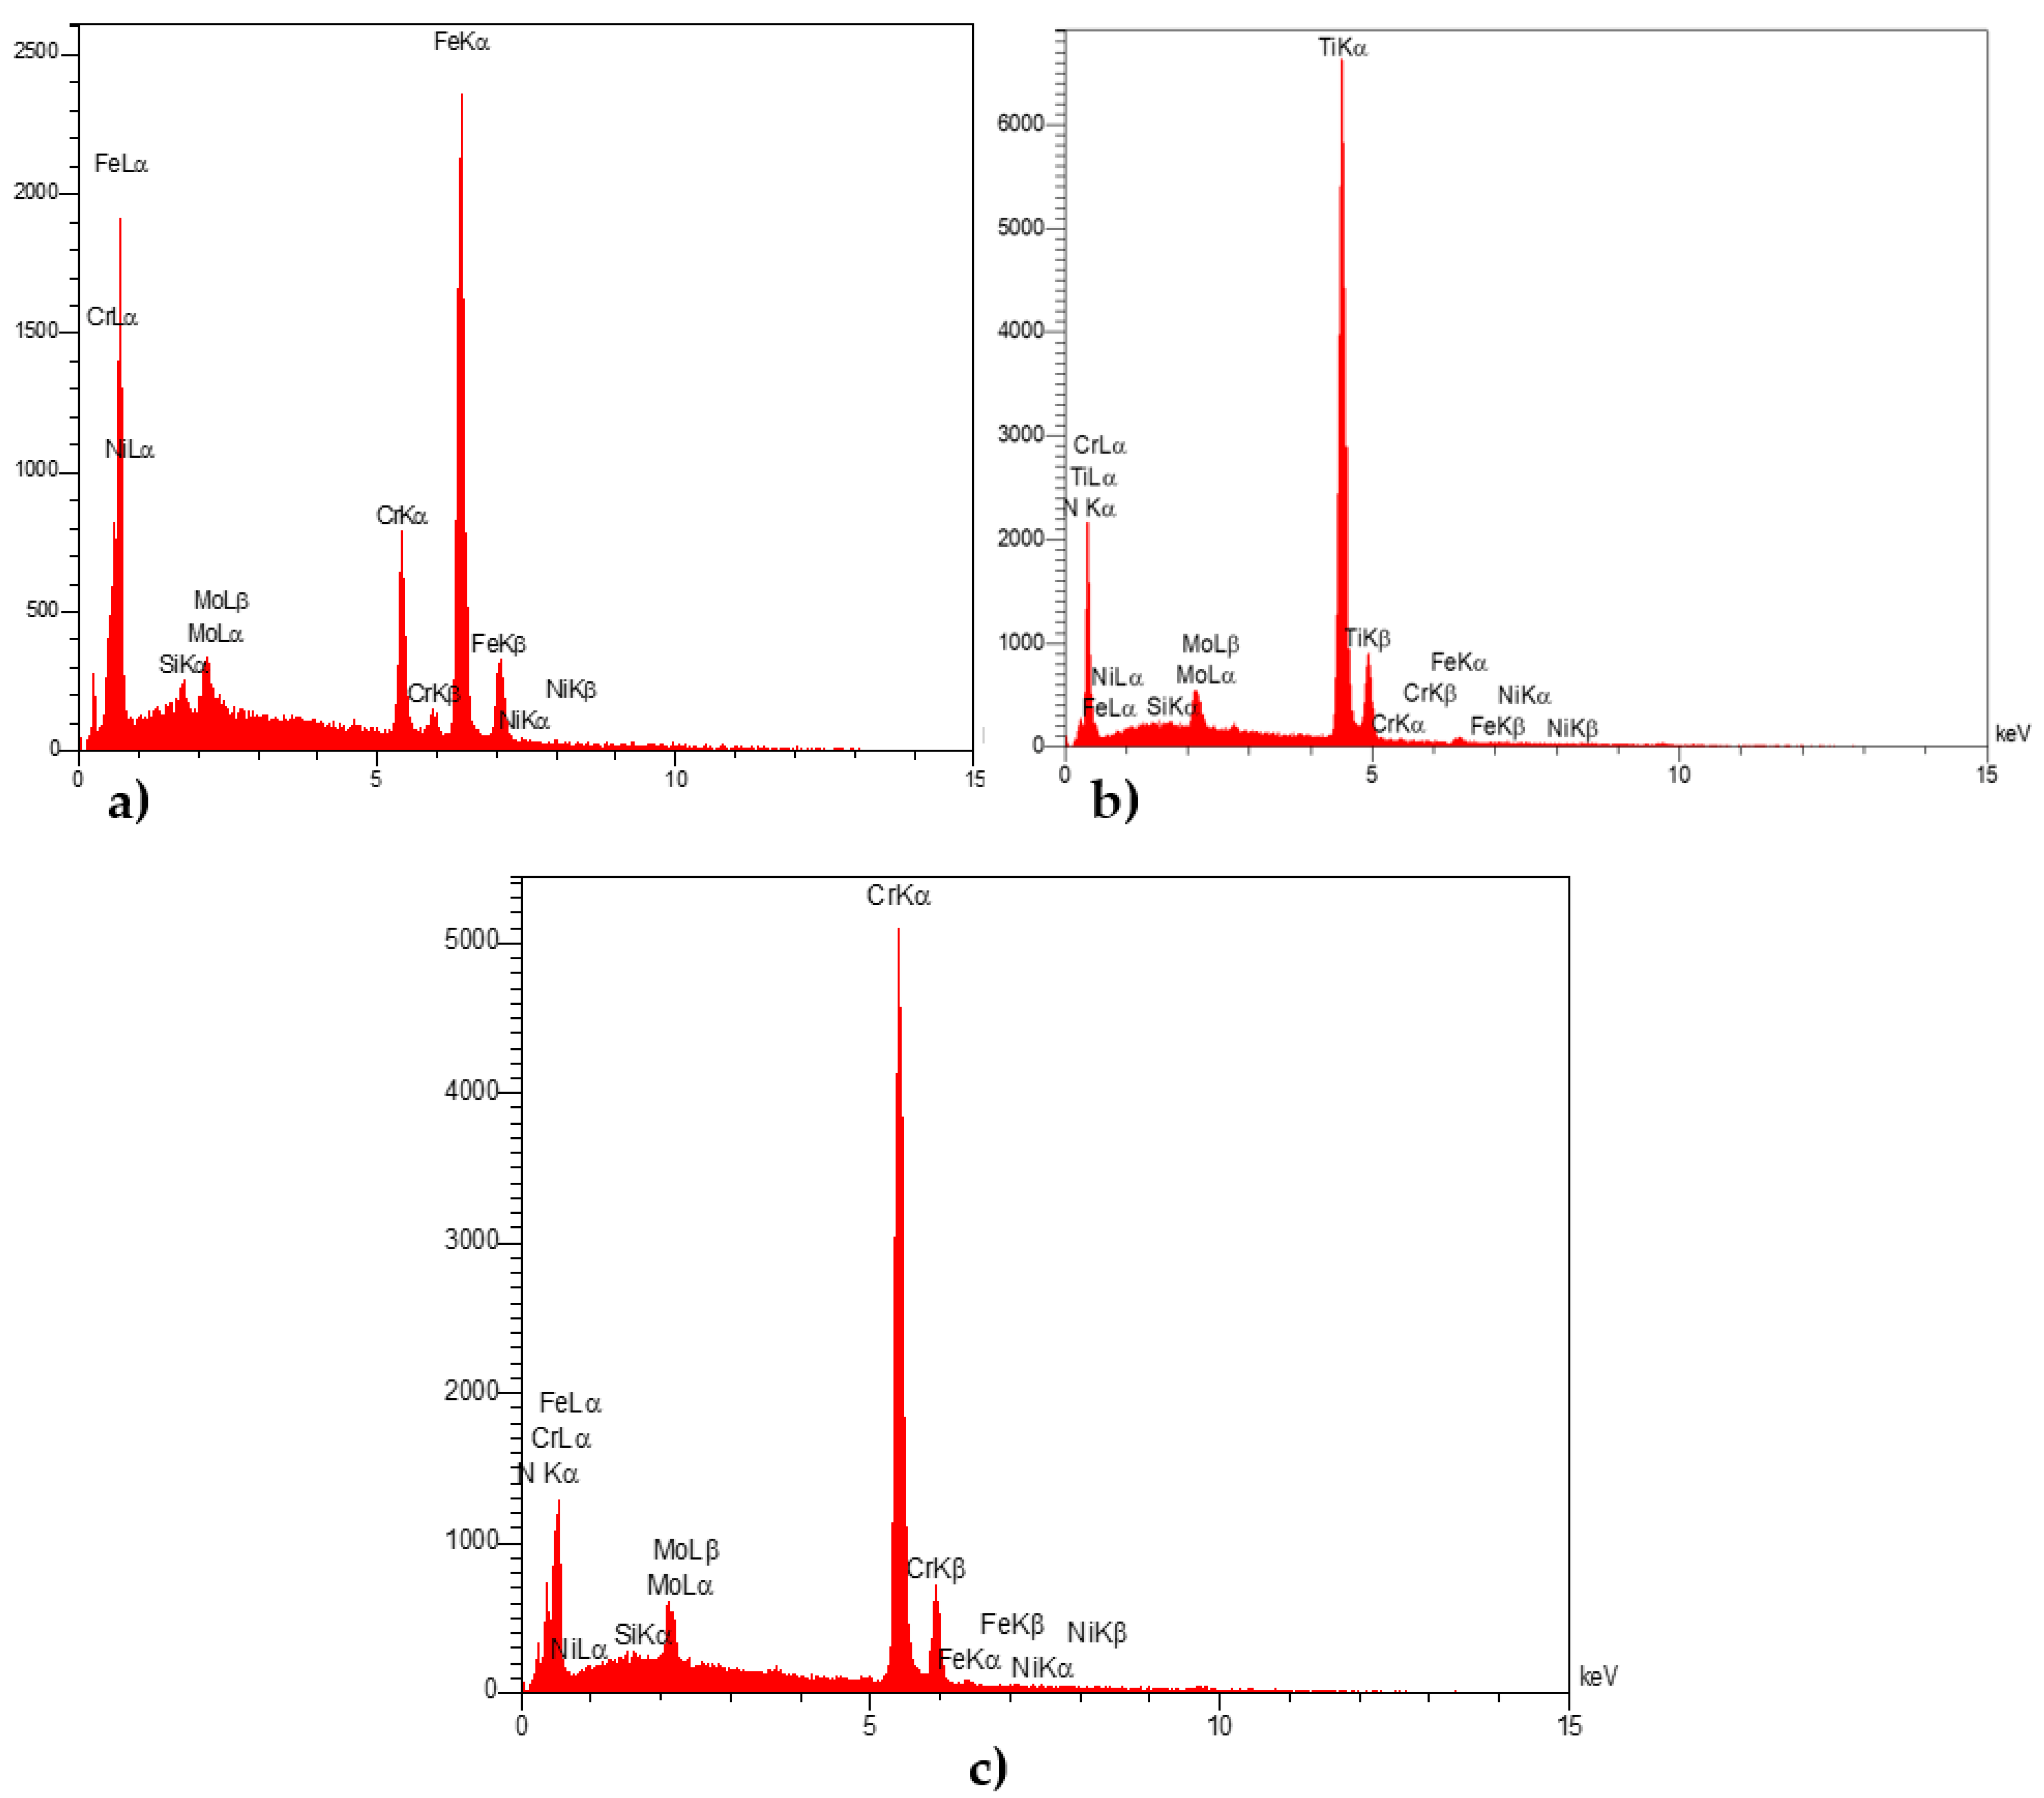
3.3. EDX Analysis
3.4. Corrosion Resistance
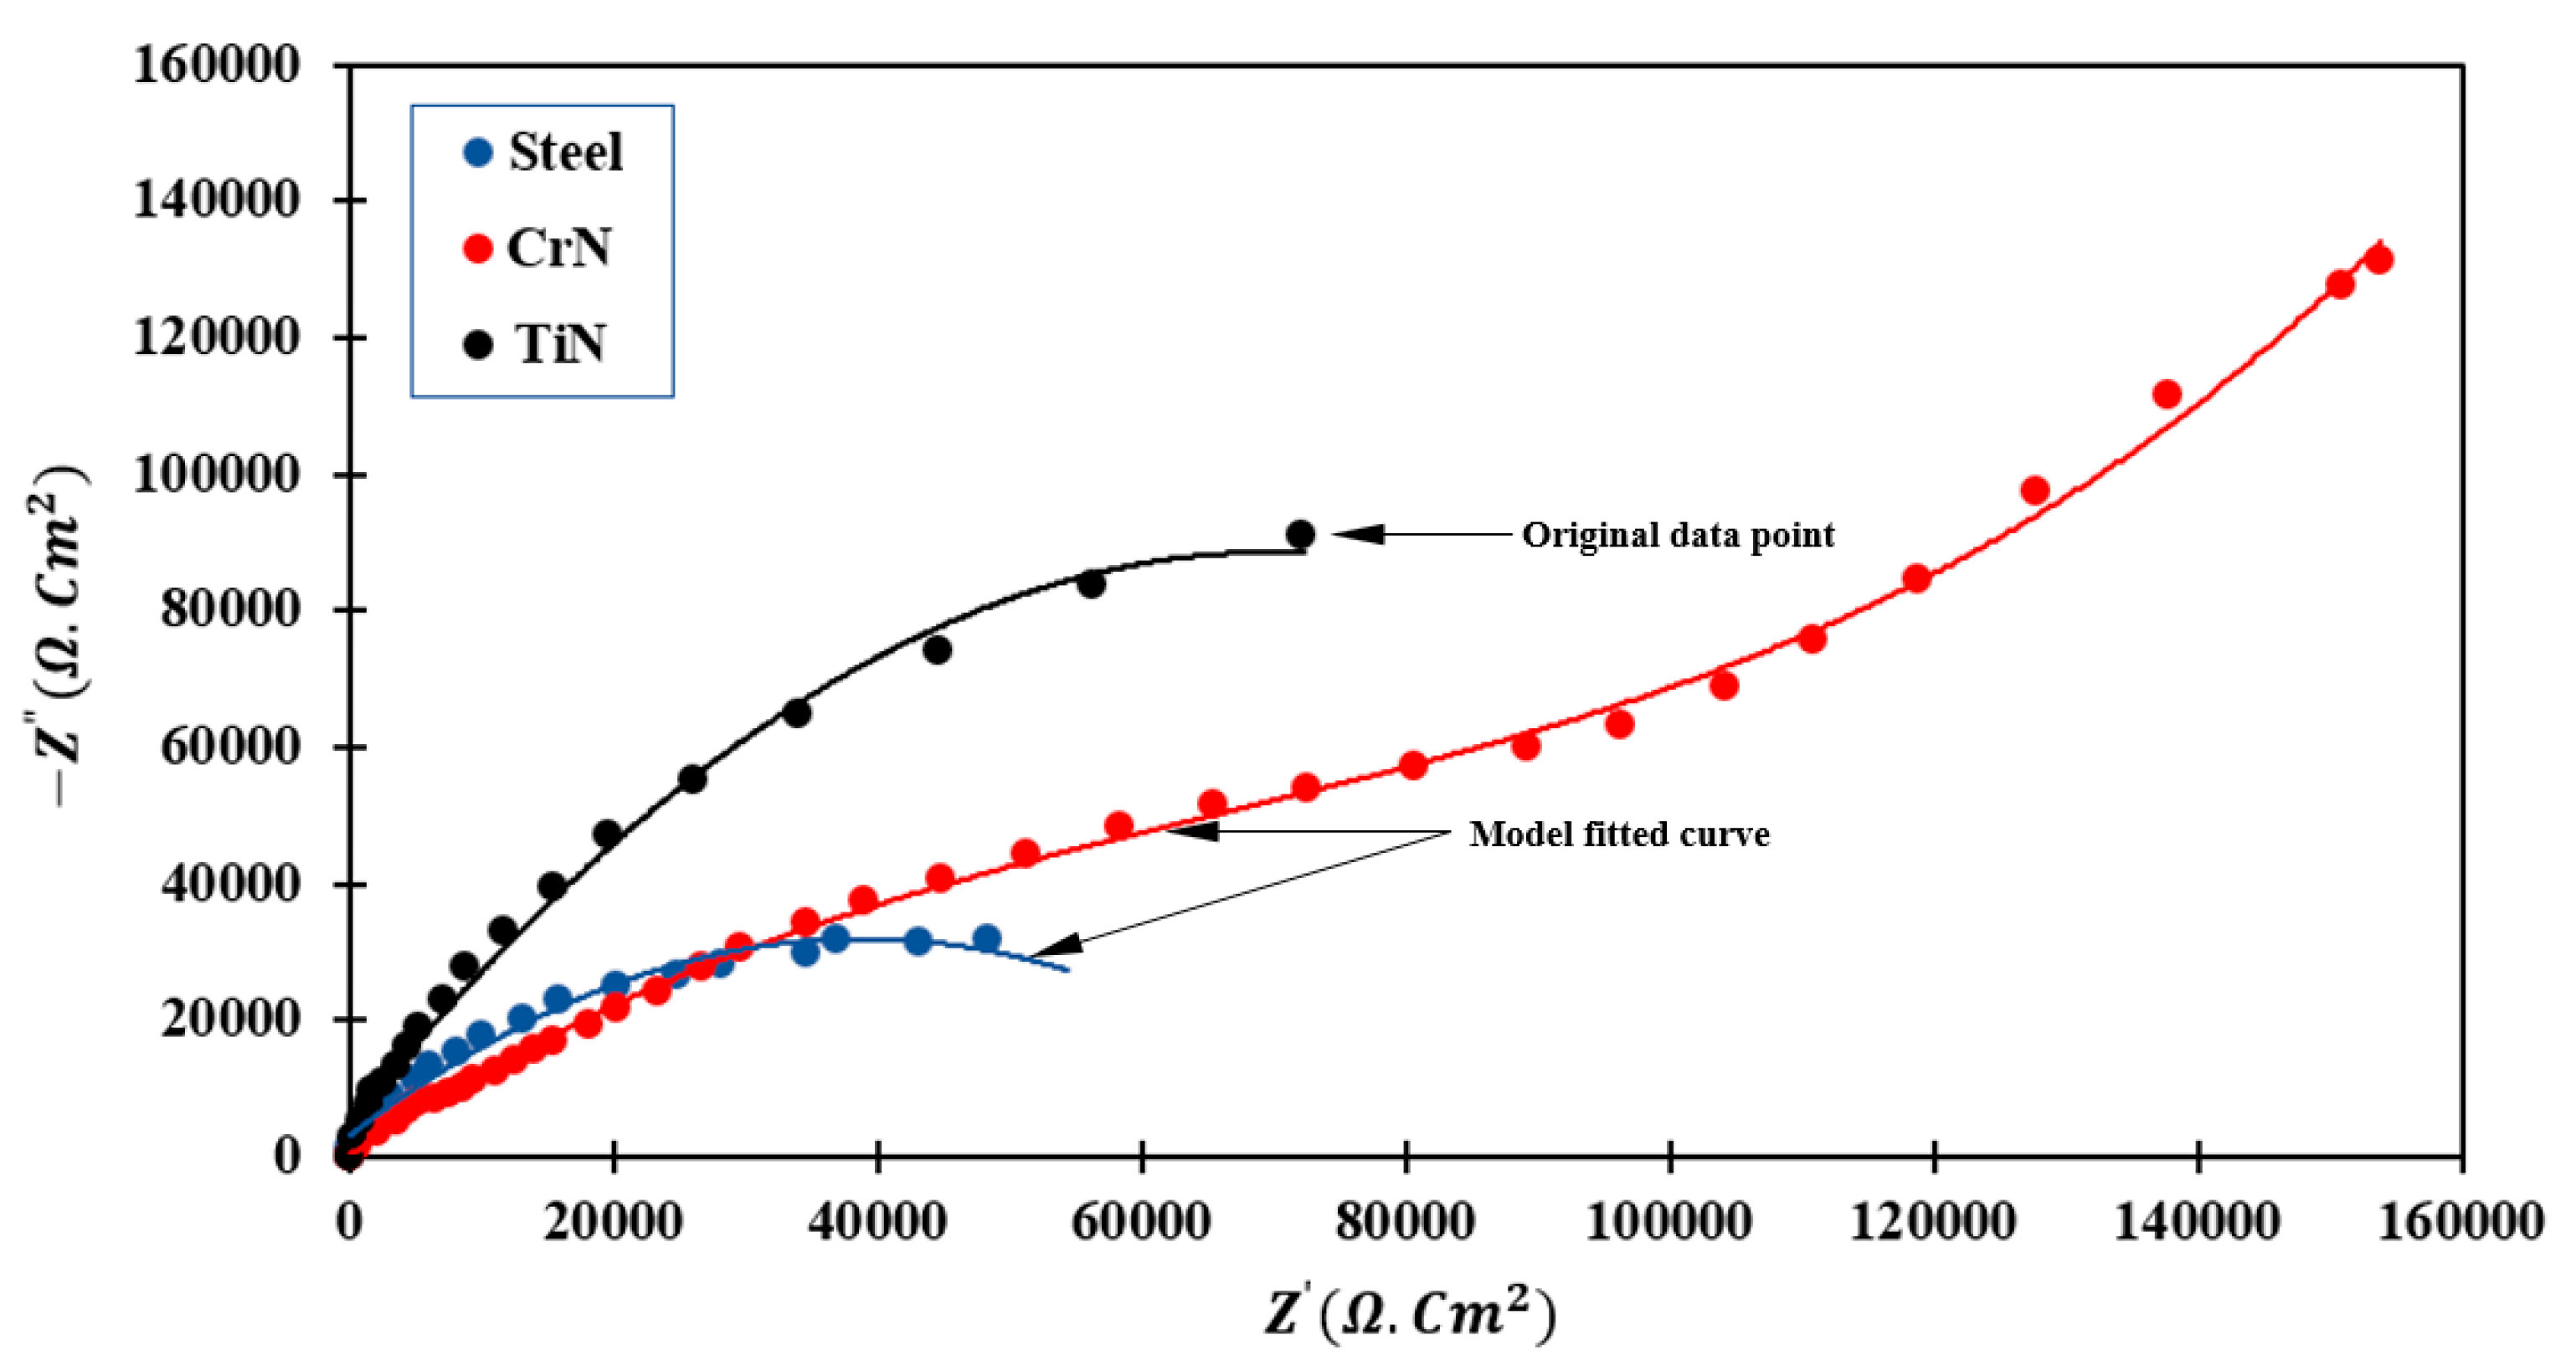
3.4.1. EIS Measurement
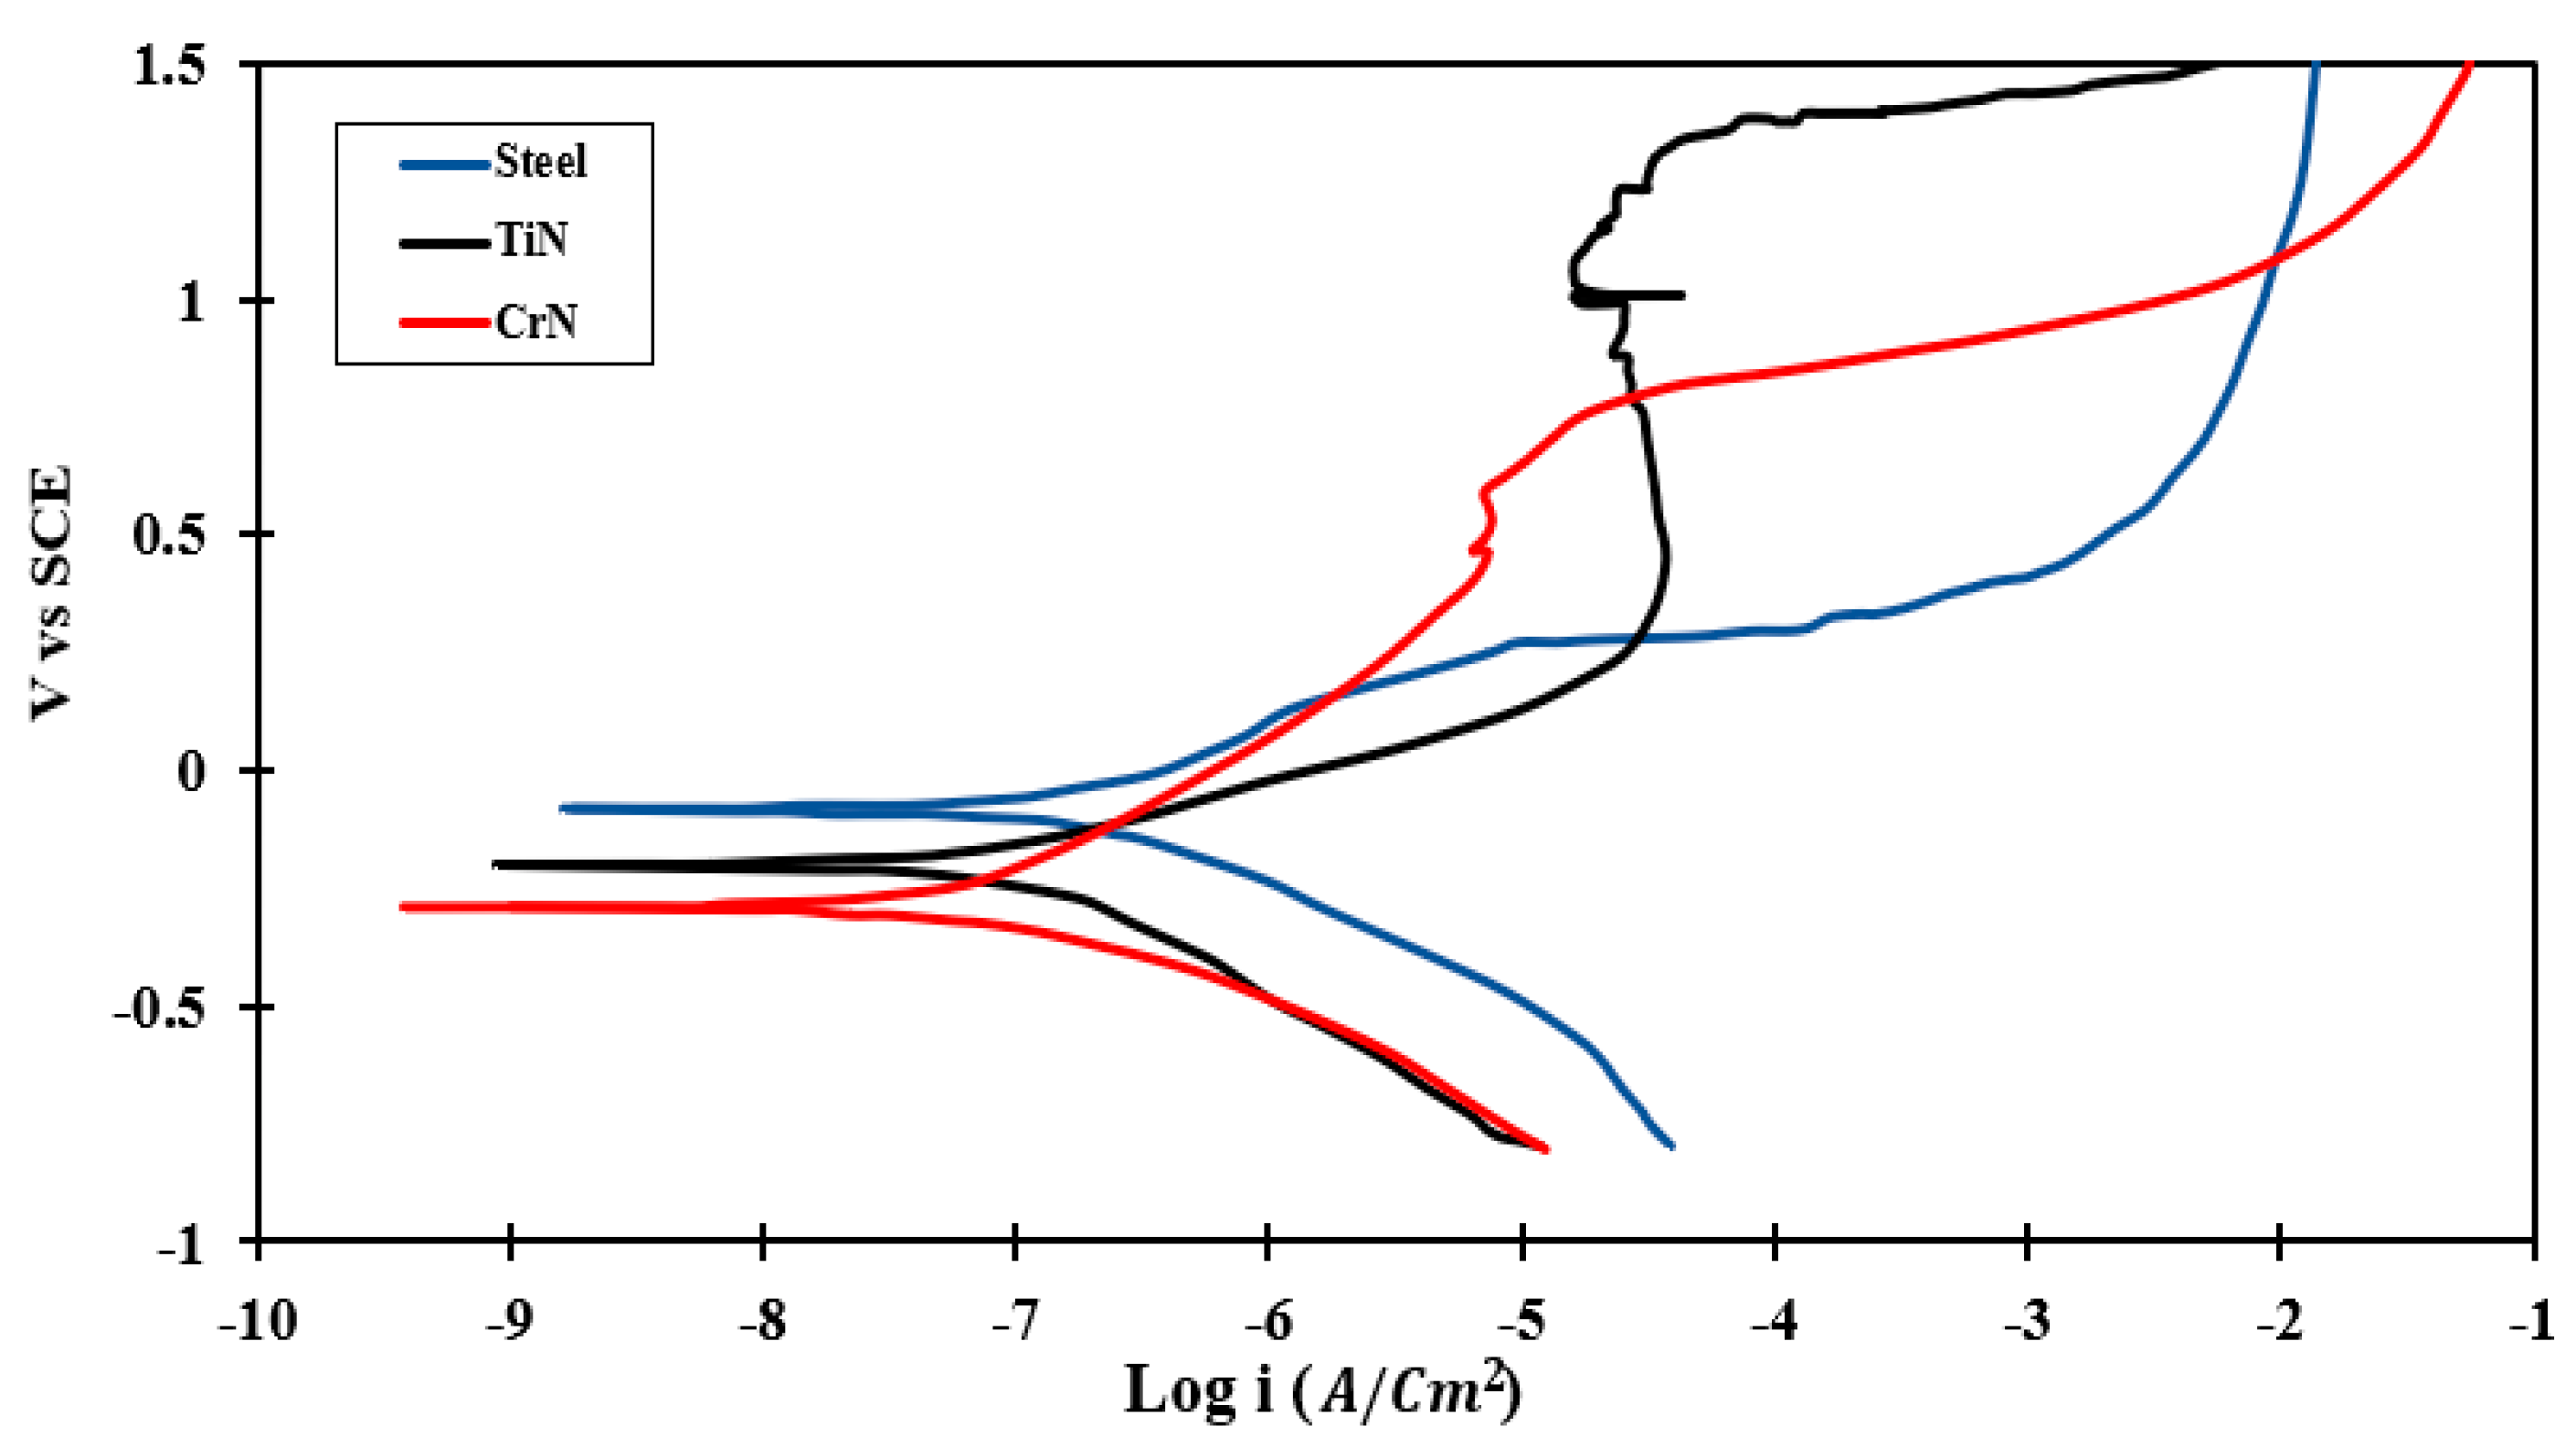
3.4.2. PDP Test
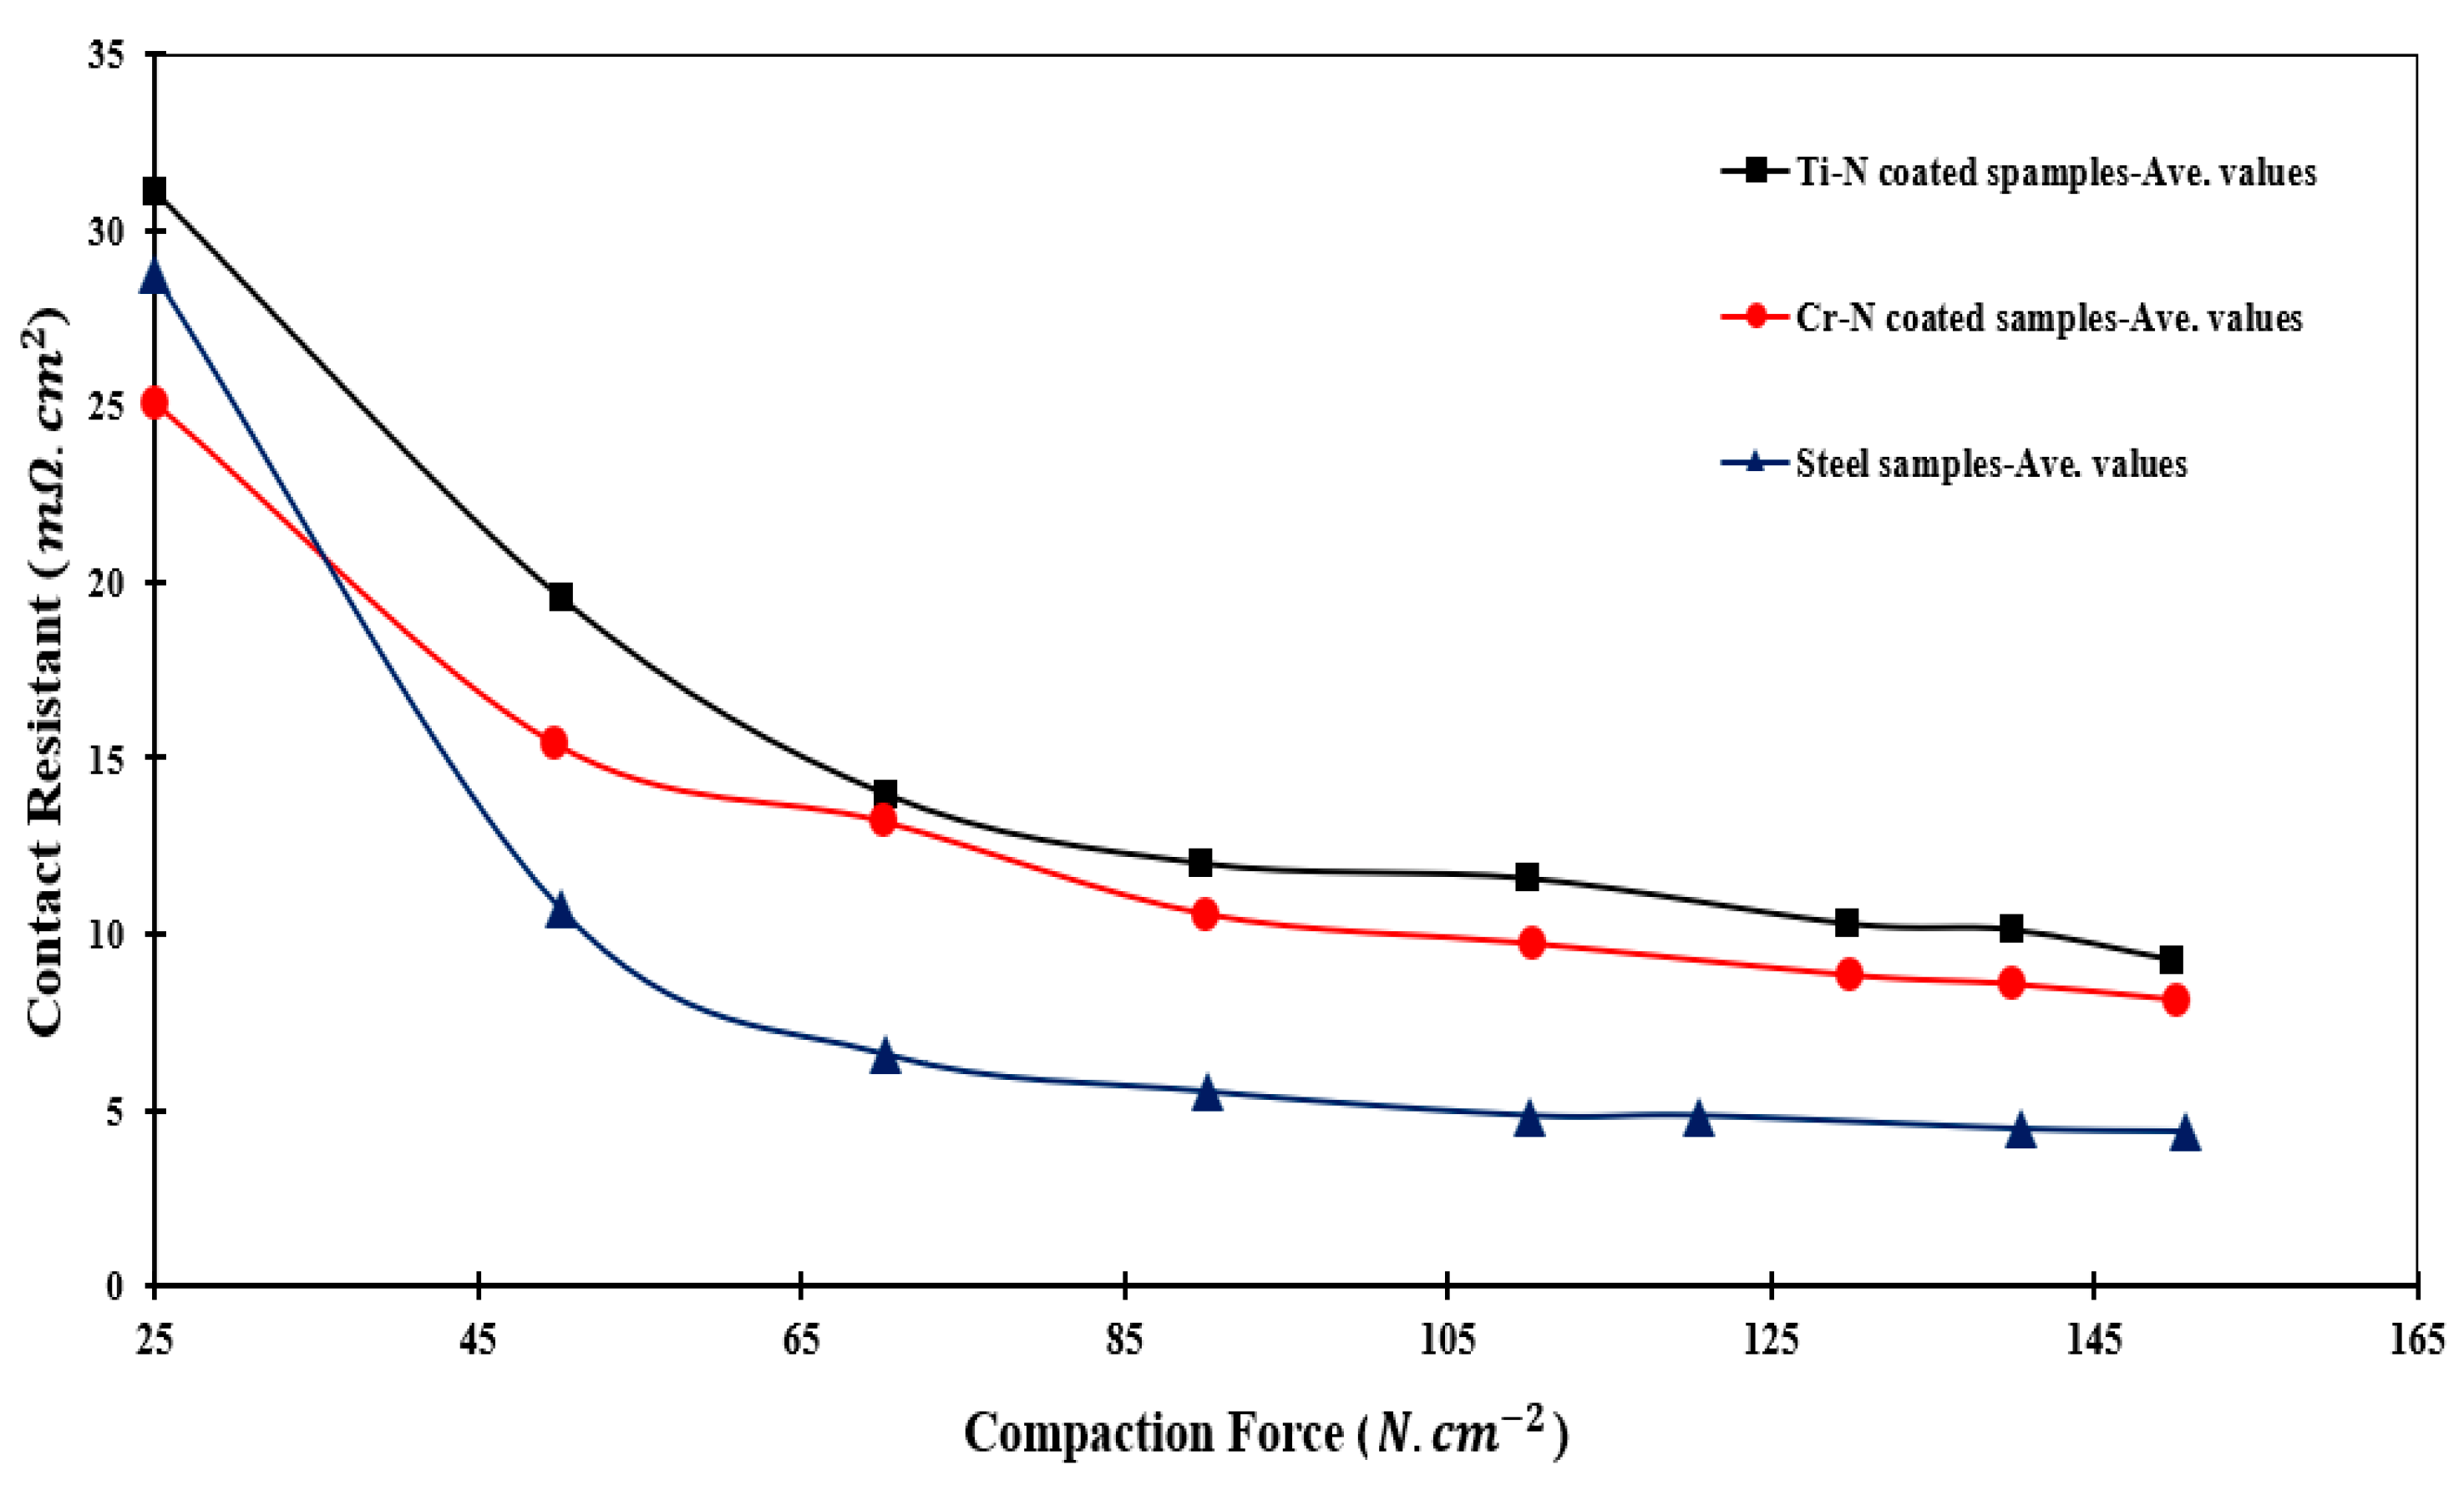
3.5. ICR
4. Conclusions
- The corrosion resistance of TiN-coated and CrN-coated specimens is significantly greater than that of uncoated steel, thus reducing contamination, extending the life of the bipolar plates in fuel cells, and lowering their maintenance costs.
- According to PDP results, CrN coated on 410 SS exhibited a maximum value of (690.6 ) and a minimum rate of corrosion (0.032).
- The results of the EIS demonstrate that the TiN-coated specimen has a larger semicircle than the uncoated steel specimen (higher impedance). This property indicates that the TiN-coated sample has a higher polarization resistance than that of uncoated 410 stainless steel.
- In CrN-coated samples, the formation of more continuous semicircles of larger diameter is due to surface activity and the formation of layers in contact with the electrolyte solution, which slows the electrochemical reaction. The deepening of the semicircle is related to the non-uniformity of the electrode surface.
- The SEM images confirmed that CrN crystallites are smooth and without cracks. This increases its resistance to corrosion in the fuel cell environment compared to other TiN and bare SS.
- The average values of ICR for CrN and TiN samples were found to be 9.26 and 11.23 mΩ·cm2, respectively. This substantiated the superior performance of CrN-coated layers for PEM fuel cell BPPs.
- Due to its ICR, corrosion resistance, low material cost, and ease of manufacture, the CrN-coated 410 SS may be an excellent candidate for use in PEM fuel cells as a BPP.
Author Contributions
Funding
Institutional Review Board Statement
Informed Consent Statement
Data Availability Statement
Acknowledgments
Conflicts of Interest
References
- Dhimish, M.; Vieira, R.G.; Badran, G. Investigating the stability and degradation of hydrogen PEM fuel cell. Int. J. Hydrogen Energy 2021, 46, 37017–37028. [Google Scholar] [CrossRef]
- Jin, J.; He, Z.; Zhao, X. Formation of a protective TiN layer by liquid phase plasma electrolytic nitridation on Ti–6Al–4V bipolar plates for PEMFC. Int. J. Hydrogen Energy 2020, 45, 12489–12500. [Google Scholar] [CrossRef]
- Wang, Y.; Zhang, S.; Lu, Z.; Wang, L.; Li, W. Preparation and performances of electrically conductive Nb-doped TiO2 coatings for 316 stainless steel bipolar plates of proton-exchange membrane fuel cells. Corros. Sci. 2018, 142, 249–257. [Google Scholar] [CrossRef]
- Branco, C.M. Multilayer Membranes for Intermediate Temperature Polymer Electrolyte Fuel Cells. Ph.D. Thesis, University of Birmingham, Birmingham, UK, May 2017. [Google Scholar]
- Song, Y.; Zhang, C.; Ling, C.-Y.; Han, M.; Yong, R.-Y.; Sun, D.; Chen, J. Review on current research of materials, fabrication and application for bipolar plate in proton exchange membrane fuel cell. Int. J. Hydrogen Energy 2020, 45, 29832–29847. [Google Scholar] [CrossRef]
- Shaigan, N.; Yuan, X.-Z.; Girard, F.; Fatih, K.; Robertson, M. Standardized testing framework for quality control of fuel cell bipolar plates. J. Power Sources 2021, 482, 228972. [Google Scholar] [CrossRef]
- Xiong, K.; Wu, W.; Wang, S.; Zhang, L. Modeling, design, materials and fabrication of bipolar plates for proton exchange membrane fuel cell: A review. Appl. Energy 2021, 301, 117443. [Google Scholar] [CrossRef]
- Sadeghian, Z.; Hadidi, M.R.; Salehzadeh, D.; Nemati, A. Hydrophobic octadecylamine-functionalized graphene/TiO2 hybrid coating for corrosion protection of copper bipolar plates in simulated proton exchange membrane fuel cell environment. Int. J. Hydrogen Energy 2020, 45, 15380–15389. [Google Scholar] [CrossRef]
- Talebi-Ghadikolaee, H.; Naeini, H.M.; Mirnia, M.J.; Mirzai, M.A.; Gorji, H.; Alexandrov, S. Ductile fracture prediction of AA6061-T6 in roll forming process. Mech. Mater. 2020, 148, 103498. [Google Scholar] [CrossRef]
- Wlodarczyk, R.; Zasada, D.; Morel, S.; Kacprzak, A. A comparison of nickel coated and uncoated sintered stainless steel used as bipolar plates in low-temperature fuel cells. Int. J. Hydrogen Energy 2016, 41, 17644–17651. [Google Scholar] [CrossRef]
- Kucharczyk, A.; Adamczyk, L.; Miecznikowski, K. The Influence of the Type of Electrolyte in the Modifying Solution on the Protective Properties of Vinyltrimethoysilane/Ethanol-Based Coatings Formed on Stainless Steel X20Cr13. Materials 2021, 14, 6209. [Google Scholar] [CrossRef]
- Yi, P.; Zhang, W.; Bi, F.; Peng, L.; Lai, X. Microstructure and properties of aC films deposited under different argon flow rate on stainless steel bipolar plates for proton exchange membrane fuel cells. J. Power Sources 2019, 410, 188–195. [Google Scholar] [CrossRef]
- Rashtchi, H.; Gomez, Y.A.; Raeissi, K.; Shamanian, M.; Eriksson, B.; Zhiani, M.; Lagergren, C.; Lindström, R.W. Performance of a PEM fuel cell using electroplated Ni–Mo and Ni–Mo–P stainless steel bipolar plates. J. Electrochem. Soc. 2017, 164, F1427. [Google Scholar] [CrossRef]
- Coutanceau, C.; Chatenet, M.; Jones, D.; Maranzana, G. 12 Materials for proton-exchange fuel cell for mobility and stationary applications. In Utilization of Hydrogen for Sustainable Energy and Fuels; De Gruyter: Berlin, Germany, 2021; pp. 399–432. [Google Scholar] [CrossRef]
- Planes, E.; Flandin, L.; Alberola, N. Polymer composites bipolar plates for PEMFCs. Energy Procedia 2012, 20, 311–323. [Google Scholar] [CrossRef] [Green Version]
- Mani, S.P.; Rajendran, N. Corrosion and interfacial contact resistance behavior of electrochemically nitrided 316L SS bipolar plates for proton exchange membrane fuel cells. Energy 2017, 133, 1050–1062. [Google Scholar] [CrossRef]
- Wang, S.; Hou, M.; Zhao, Q.; Jiang, Y.; Wang, Z.; Li, H.; Fu, Y.; Shao, Z. Ti/(Ti, Cr) N/CrN multilayer coated 316L stainless steel by arc ion plating as bipolar plates for proton exchange membrane fuel cells. J. Energy Chem. 2017, 26, 168–174. [Google Scholar] [CrossRef]
- Akula, S.; Kalaiselvi, P.; Sahu, A.K.; Chellammal, S. Electrodeposition of conductive PAMT/PPY bilayer composite coatings on 316L stainless steel plate for PEMFC application. Int. J. Hydrogen Energy 2021, 46, 17909–17921. [Google Scholar] [CrossRef]
- Jin, J.; Zhao, X.; Liu, H. Durability and degradation of CrMoN coated SS316L in simulated PEMFCs environment: High potential polarization and electrochemical impedance spectroscopy (EIS). Int. J. Hydrogen Energy 2019, 44, 20293–20303. [Google Scholar] [CrossRef]
- Madadi, F.; Rezaeian, A.; Edris, H.; Zhiani, M. Improving performance in PEMFC by applying different coatings to metallic bipolar plates. Mater. Chem. Phys. 2019, 238, 121911. [Google Scholar] [CrossRef]
- Li, M.; Luo, S.; Zeng, C.; Shen, J.; Lin, H. Corrosion behavior of TiN coated type 316 stainless steel in simulated PEMFC environments. Corros. Sci. 2004, 46, 1369–1380. [Google Scholar] [CrossRef]
- Cho, E.; Jeon, U.-S.; Hong, S.-A.; Oh, I.-H.; Kang, S.-G. Performance of a 1 kW-class PEMFC stack using TiN-coated 316 stainless steel bipolar plates. J. Power Sources 2005, 142, 177–183. [Google Scholar] [CrossRef]
- Forouzanmehr, M.; Kashyzadeh, K.R.; Borjali, A.; Jafarnode, M.; Chizari, M. Effects of CrN/TiN coatings on interfacial contact resistance of stainless steel 410 bipolar plates in fuel cells. In Energy and Sustainable Futures: Proceedings of the 2nd ICESF 2020, Hatfield, UK, 10–11 September 2020; Springer Nature: Berlin/Heidelberg, Germany, 2021; pp. 133–139. [Google Scholar]
- Mani, S.P.; Srinivasan, A.; Rajendran, N. Effect of nitrides on the corrosion behaviour of 316L SS bipolar plates for Proton Exchange Membrane Fuel Cell (PEMFC). Int. J. Hydrogen Energy 2015, 40, 3359–3369. [Google Scholar] [CrossRef]
- Brady, M.; Tortorelli, P.; More, K.; Meyer III, H.; Walker, L.R.; Wang, H.; Turner, J.; Yang, B.; Buchanan, R. Cost-effective surface modification for metallic bipolar plates. DOE FY 2004. [Google Scholar]
- Brady, M.P.; Wang, H.; Yang, B.; Turner, J.; Bordignon, M.; Molins, R.; Abd Elhamid, M.; Lipp, L.; Walker, L.R. Growth of Cr-Nitrides on commercial Ni–Cr and Fe–Cr base alloys to protect PEMFC bipolar plates. Int. J. Hydrogen Energy 2007, 32, 3778–3788. [Google Scholar] [CrossRef]
- Fu, Y.; Lin, G.; Hou, M.; Wu, B.; Li, H.; Hao, L.; Shao, Z.; Yi, B. Optimized Cr-nitride film on 316L stainless steel as proton exchange membrane fuel cell bipolar plate. Int. J. Hydrogen Energy 2009, 34, 453–458. [Google Scholar] [CrossRef]
- Maksakova, O.; Simoẽs, S.; Pogrebnjak, A.; Bondar, O.; Kravchenko, Y.; Beresnev, V.; Erdybaeva, N. The influence of deposition conditions and bilayer thickness on physical-mechanical properties of CA-PVD multilayer ZrN/CrN coatings. Mater. Charact. 2018, 140, 189–196. [Google Scholar] [CrossRef]
- Maksakova, O.V.; Webster, R.F.; Tilley, R.D.; Ivashchenko, V.I.; Postolnyi, B.O.; Bondar, O.V.; Takeda, Y.; Rogoz, V.M.; Sakenova, R.E.; Zukowski, P.V. Nanoscale architecture of (CrN/ZrN)/(Cr/Zr) nanocomposite coatings: Microstructure, composition, mechanical properties and first-principles calculations. J. Alloys Compd. 2020, 831, 154808. [Google Scholar] [CrossRef]
- Jin, J.; Zhang, J.; Hu, M.; Li, X. Investigation of high potential corrosion protection with titanium carbonitride coating on 316L stainless steel bipolar plates. Corros. Sci. 2021, 191, 109757. [Google Scholar] [CrossRef]
- Li, T.; Yan, Z.; Liu, Z.; Yan, Y.; Chen, Y. Surface microstructure and performance of TiN monolayer film on titanium bipolar plate for PEMFC. Int. J. Hydrogen Energy 2021, 46, 31382–31390. [Google Scholar] [CrossRef]
- Chen, Y.; Xu, J.; Jiang, S.; Xie, Z.-H.; Munroe, P.; Kuai, S. Corrosion-resistant, electrically conductive TiCN coatings for direct methanol fuel cell. Surf. Coat. Technol. 2021, 422, 127562. [Google Scholar] [CrossRef]
- Li, G.; Zhang, L.; Cai, F.; Yang, Y.; Wang, Q.; Zhang, S. Characterization and corrosion behaviors of TiN/TiAlN multilayer coatings by ion source enhanced hybrid arc ion plating. Surf. Coat. Technol. 2019, 366, 355–365. [Google Scholar] [CrossRef]
- Xiaona Suo, C.G.; Kong, D.; Wang, L. Corrosion behavior of TiN and CrN coatings produced by magnetron sputtering process on aluminium alloy. Int. J. Electrochem. Sci. 2019, 14, 826–837. [Google Scholar]
- Wang, Y.; Northwood, D.O. An investigation of the electrochemical properties of PVD TiN-coated SS410 in simulated PEM fuel cell environments. Int. J. Hydrogen Energy 2007, 32, 895–902. [Google Scholar] [CrossRef]
- Pana, I.; Braic, V.; Dinu, M.; Mouele, E.S.M.; Parau, A.C.; Petrik, L.F.; Braic, M. In vitro corrosion of titanium nitride and oxynitride-based biocompatible coatings deposited on stainless steel. Coatings 2020, 10, 710. [Google Scholar] [CrossRef]
- Wang, H.; Sweikart, M.A.; Turner, J.A. Stainless steel as bipolar plate material for polymer electrolyte membrane fuel cells. J. Power Sources 2003, 115, 243–251. [Google Scholar] [CrossRef]
- Eliaz, N. Corrosion of metallic biomaterials: A review. Materials 2019, 12, 407. [Google Scholar] [CrossRef] [PubMed] [Green Version]
- Forooshani, H.M.; Aliofkhazraei, M.; Bagheri, H. Fabrication of hierarchical dual structured (HDS) nickel surfaces and their corrosion behavior. J. Alloys Compd. 2019, 784, 556–573. [Google Scholar] [CrossRef]
- Hu, C.; Li, Y.; Zhang, J.; Huang, W. Fabrication of Poly (o/m-Toluidine)–SiC/Zinc Bilayer Coatings and Evaluation of Their Corrosion Resistances. Coatings 2018, 8, 180. [Google Scholar] [CrossRef] [Green Version]
- Kowalski, M.; Stachowiak, A. Tribocorrosion Performance of Cr/CrN Hybrid Layer as a Coating for Machine Components Used in a Chloride Ions Environment. Coatings 2021, 11, 242. [Google Scholar] [CrossRef]
- Razavizadeh, O.; Bahadormanesh, B.; Ghorbani, M.; Simchi, A. Effect of photoelectrochemical activity of ZnO-graphene thin film on the corrosion of carbon steel and 304 stainless steel. J. Mater. Eng. Perform. 2020, 29, 497–505. [Google Scholar] [CrossRef]
- Liu, Y.; Gao, Z.; Lu, X.; Wang, L. Effect of temperature on corrosion and cathodic protection of X65 pipeline steel in 3.5% NaCl solution. Int. J. Electrochem. Sci. 2019, 14, 150–160. [Google Scholar] [CrossRef]
- Ward, L.; Pilkington, A.; Dowey, S. Studies on the effect of arc current mode and substrate rotation configuration on the structure and corrosion behavior of PVD TiN coatings. Coatings 2017, 7, 50. [Google Scholar] [CrossRef] [Green Version]
- Kong, D.; Ni, X.; Dong, C.; Zhang, L.; Man, C.; Yao, J.; Xiao, K.; Li, X. Heat treatment effect on the microstructure and corrosion behavior of 316L stainless steel fabricated by selective laser melting for proton exchange membrane fuel cells. Electrochim. Acta 2018, 276, 293–303. [Google Scholar] [CrossRef]
- Loveday, D.; Peterson, P.; Rodgers, B. Evaluation of organic coatings with electrochemical impedance spectroscopy. JCT Coat. Technol. 2004, 8, 46–52. [Google Scholar]
- Huya-Kouadio, J.M.; James, B.D.; Houchins, C. Meeting cost and manufacturing expectations for automotive fuel cell bipolar plates. ECS Trans. 2018, 83, 93. [Google Scholar] [CrossRef]
- Kraytsberg, A.; Auinat, M.; Ein-Eli, Y. Reduced contact resistance of PEM fuel cell’s bipolar plates via surface texturing. J. Power Sources 2007, 164, 697–703. [Google Scholar] [CrossRef]

| Ref No. | Substrate as Bipolar Plates | Coated Samples (TiN and CrN) | Other Coating Study | Surface Morphology | XRD and EDS | Coating Methods | Corrosion Behavior | ICR |
|---|---|---|---|---|---|---|---|---|
| [30] | 316L SS | ✓✕ | TiCN | ✓ | ✓✓ | Closed Field Unbalanced Magnetron Sputter | ✓ | ✓ |
| [31] | Titanium | ✓✕ | ✕ | ✓ | ✓✕ | Multi-arc ion plating | ✓ | ✓ |
| [32] | 316L SS | ✕✕ | TiCN | ✓ | ✓✓ | Mathode glow discharge plasma | ✓ | ✕ |
| [23] | 410 SS | ✓✓ | ✕ | ✕ | ✕✕ | CAE | ✕ | ✓ |
| [30] | 316L SS | ✓✕ | TiCN | ✓ | ✓✓ | Closed Field Unbalanced Magnetron Sputter | ✓ | ✓ |
| [33] | 410 SS | ✕✕ | TiN/TiAlN | ✓ | ✓✓ | Arc ion plating system | ✓ | ✕ |
| [34] | Al 7000 | ✓✓ | ✕ | ✓ | ✓ | Magnetron sputtering | ✓ | ✓ |
| This study | 410 SS | ✓✓ | ✕ | ✓ | ✓ | CAE | ✓ | ✓ |
| C | Mn | Si | P | S | Cr | Ni |
|---|---|---|---|---|---|---|
| 0.13 | 0.95 | 1 | 0.03 | 0.03 | 13 | 0.70 |
| Content | Concentration (g/100 mL) | mEq/L |
|---|---|---|
| Sodium chloride | 0.85 | - |
| Potassium chloride | 0.03 | - |
| Calcium chloride anhydrous | 0.33 | - |
| Sodium | - | 147 |
| Potassium | - | 4 |
| Calcium | - | 4.5 |
| Chloride | - | 156 |
| Specimen | Elt. | Int. | K | Kr | W% | A% |
|---|---|---|---|---|---|---|
| Uncoated samples | C | 24.0 | 0.0212 | 0.0195 | 7.23 | 26.30 |
| Si | 15.5 | 0.0150 | 0.0138 | 2.00 | 3.11 | |
| Cr | 159.0 | 0.1884 | 0.1733 | 15.63 | 13.14 | |
| Fe | 594.3 | 0.7386 | 0.6796 | 70.84 | 55.44 | |
| Ni | 1.2 | 0.0016 | 0.0015 | 0.16 | 0.12 | |
| Mo | 35.1 | 0.0352 | 0.0324 | 4.14 | 1.89 | |
| TiN-coated samples | N | 192.9 | 0.0911 | 0.0809 | 14.11 | 35.07 |
| Ti | 1424.0 | 0.8544 | 0.7590 | 79.44 | 57.76 | |
| Fe | 9.4 | 0.0062 | 0.0055 | 0.62 | 0.39 | |
| CrN-coated samples | N | 76.0 | 0.0420 | 0.0364 | 8.91 | 24.16 |
| Cr | 1186.0 | 0.8711 | 0.7560 | 78.62 | 57.40 | |
| Fe | 8.4 | 0.0065 | 0.0056 | 0.63 | 0.43 |
| Sample | Ecorr (mV vs. SCE) | icorr (µA/cm2) | βC (mV/dec) | βa (mV/dec) | Corrosion Rate (mpy) | Rp (Ω·cm2) |
|---|---|---|---|---|---|---|
| Base steel | −78.3 | 0.18 | 220 | 220 | 0.096 | 230.1 |
| CrN | −279.5 | 0.07 | 203 | 339 | 0.032 | 690.6 |
| TiN | −192.9 | 0.11 | 300 | 164 | 0.060 | 410.2 |
Publisher’s Note: MDPI stays neutral with regard to jurisdictional claims in published maps and institutional affiliations. |
© 2022 by the authors. Licensee MDPI, Basel, Switzerland. This article is an open access article distributed under the terms and conditions of the Creative Commons Attribution (CC BY) license (https://creativecommons.org/licenses/by/4.0/).
Share and Cite
Forouzanmehr, M.; Reza Kashyzadeh, K.; Borjali, A.; Ivanov, A.; Jafarnode, M.; Gan, T.-H.; Wang, B.; Chizari, M. Detection and Analysis of Corrosion and Contact Resistance Faults of TiN and CrN Coatings on 410 Stainless Steel as Bipolar Plates in PEM Fuel Cells. Sensors 2022, 22, 750. https://doi.org/10.3390/s22030750
Forouzanmehr M, Reza Kashyzadeh K, Borjali A, Ivanov A, Jafarnode M, Gan T-H, Wang B, Chizari M. Detection and Analysis of Corrosion and Contact Resistance Faults of TiN and CrN Coatings on 410 Stainless Steel as Bipolar Plates in PEM Fuel Cells. Sensors. 2022; 22(3):750. https://doi.org/10.3390/s22030750
Chicago/Turabian StyleForouzanmehr, Mohsen, Kazem Reza Kashyzadeh, Amirhossein Borjali, Anastas Ivanov, Mosayeb Jafarnode, Tat-Hean Gan, Bin Wang, and Mahmoud Chizari. 2022. "Detection and Analysis of Corrosion and Contact Resistance Faults of TiN and CrN Coatings on 410 Stainless Steel as Bipolar Plates in PEM Fuel Cells" Sensors 22, no. 3: 750. https://doi.org/10.3390/s22030750
APA StyleForouzanmehr, M., Reza Kashyzadeh, K., Borjali, A., Ivanov, A., Jafarnode, M., Gan, T.-H., Wang, B., & Chizari, M. (2022). Detection and Analysis of Corrosion and Contact Resistance Faults of TiN and CrN Coatings on 410 Stainless Steel as Bipolar Plates in PEM Fuel Cells. Sensors, 22(3), 750. https://doi.org/10.3390/s22030750