1. Introduction
Deep learning and big data analytics are, nowadays, important fields in computational science. Various organizations face the necessity of bringing these areas into their work processes to keep up with current trends. Deep learning neural networks can identify the most complex patterns in the data quickly and efficiently at high levels of abstraction, while those patterns are not observed in the first approximation. Information from machine learning applications can deepen the understanding of many hidden processes, as well as solve problems of prediction and automation in many areas of life, such as speech recognition [
1], computer vision [
2,
3], and data visualization [
4].
Automatic pattern and image recognition technologies have the widest applications in image processing. The use of convolutional neural networks (CNNs) increases its success for image processing, character and handwritten text recognition [
5], license plate recognition [
6], human, plant, and animal pathology detection [
7,
8], face and emotion recognition [
9,
10], distinguishing objects of interest in a video stream [
11], etc.
Most publications deal with new datasets from various problem domains [
7,
8,
12]. Many publications are concerned with neural network topology and learning technique improvements [
13]. However, there are many unsolved problems in image recognition tasks. First,
the recognition accuracy is sometimes poor or insufficient. False diagnoses made by a neural network, while not being a big problem nowadays (since the data obtained from the network are verified by the operator), can be a barrier toward expanding the impact of automatic recognition algorithms in the future. The same might be said for automatic driving systems, such as automobile autopilots.
Second, the results of neural networks are affected by data distortions, such as adversarial attacks [
14,
15].
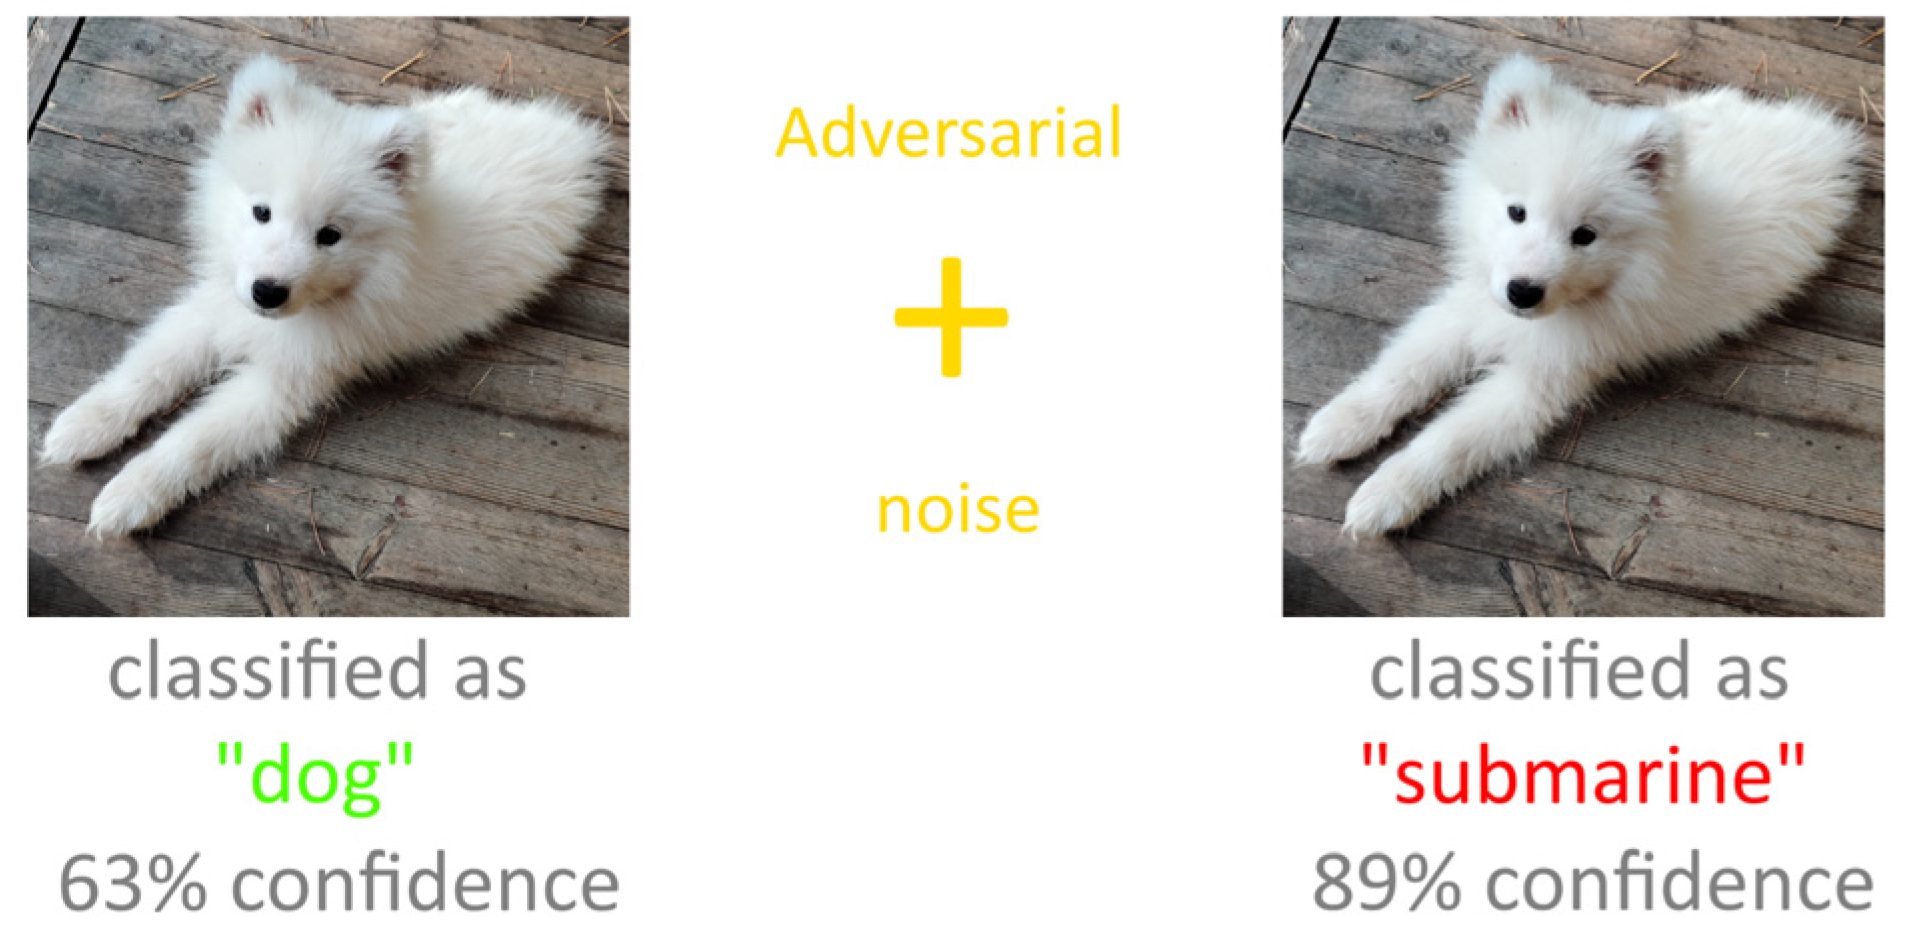
Figure 1 shows an example of this kind of attack: an image of a dog with added (invisible to the human eye) noise is recognized by the network as an image of a submarine with a large coefficient of confidence. Thus,
images with different amounts of distortions are recognized with different accuracies.
Third, there is no universal approach to estimate the optimality and robustness of a trained neural network. It cannot be predicted in advance how the trained neural network will behave when new data are obtained, and we cannot be unequivocally sure that the network will correctly recognize new data, especially if statistical characteristics of new data differ from those of the data used for training.
Recent publication analyses showed that robustness studies are performed only in terms of precision–recall curve plotting [
16]. Some publications deal with the estimation of adversarial attack success rates rather than with increasing noise immunity of the neural networks [
17]. Recent works concerning uncertainty quantifications in neural networks have not provided solutions for increasing neural network noise immunity [
18]. A noise immunity study of a neural network is still “out of consideration”. However, such an investigation seems to be the key to solve adversarial attack problems and to improve the robustness and correctness of recognition of various data by neural networks.
The most important aspect in the neural network application is training, and its success mainly depends on the correct training data representation. Complex and large neural networks trained on poorly represented data, in addition to their high resource consumptions, turn out to be much poorer than simple networks that are trained on correct and well-organized data [
19,
20]. As a result, feature construction—the correct feature generation process (for the training data)—is the most important part of machine learning.
Correct and deep feature construction involves the potential of the CNN’s generalization ability, which can (and should) be utilized to withstand noise added to the recognized data and even adversarial attacks. Noise-immune CNN should gather the information from its layers, where the noise influence on the detectable features is quite low. For example, to fight high-frequency noise, the CNN should utilize the features obtained in its deep convolutional layers, where input data are averaged throughout large regions of the original image. We suppose that training CNNs using noisy data can help to improve their generalization abilities and capabilities of withstanding adversarial attacks.
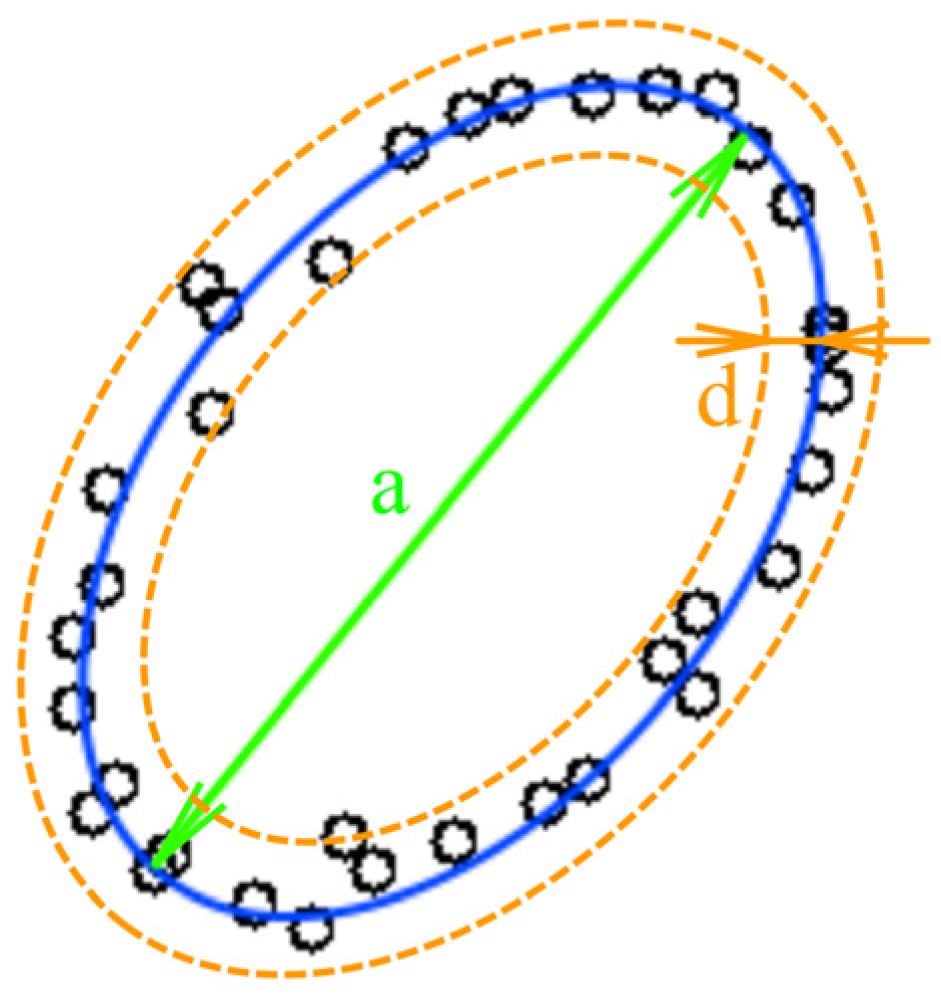
In our study, we strived to use an easy-to-understand example to investigate the neural network behavior without loss of generality. The first example was chosen for its clarity: the amount of noise (here represented as point location uncertainty) can be estimated visually. Images with low point density (
Figure 2) are convenient to distinguish distortions from the object shape.
Figure 2 shows an example of the low-density image. The ideal figure is an ellipse; one can see the deviations of point placements from the perfect ellipse. These deviations are considered as noise or uncertainty. In this paper, we analyze the low-point density image recognition accuracy as a function of the amount of point location uncertainty (further: uncertainty) in the training and test datasets. We also define a way to determine the optimal training parameters.
The research method consists in generating a dataset with pseudo-random low-density point images with different uncertainties and then analyzing the recognition accuracy of these datasets by a trained convolutional neural network, as well as determining the optimal dataset parameters for convolutional neural network training to obtain the best recognition accuracy results.
Robustness estimation of low-density image recognition was investigated in [
21]. The robustness study was performed in application to signature verification and resulted in obtaining the miss probability vs. false alarm probability charts with fixed uncertainty. The noise influence on low-density image recognition was also researched in [
22]. In both papers, the influence of the training and testing dataset uncertainty on the recognition results was not investigated. The parameter defining the uncertainty measure can be described as
U = d/a, where
d—variance and
a—linear size of the figure (
Figure 2). Further, we consider the training dataset uncertainty as
UTR and the testing dataset uncertainty as
UTS. In other tasks, such as noisy image recognition shown in
Figure 1,
U can be described as
where
Inoise is the average intensity of noise and
Iinfo is the average intensity (size) of the meaningful part of the recognized image [
17]. In both cases, uncertainty
U describes the ratio of the noisy component of the image to the informative component of the image. The addition of noise of any matter and level can drastically decrease the performance of recognition for a neural network trained on an ideal dataset, so the robustness study should be conducted to avoid this effect by altering the training dataset properties.
The low point density image recognition tasks have already been researched by the authors in a series of papers dedicated to the estimation and prediction of behavior of mobile communication network subscriber groups and complex clusters by analyzing teletraffic and geolocation data [
23,
24,
25]. The locations of subscribers in groups can be considered as sparsely located points on images. Convolutional neural networks have shown their effectiveness in solving this task [
26], but the analysis and justification of the applied method’s stability on the initial data uncertainty have not been conducted so far. In [
23], the mathematical model describing the subscribers’ cluster shapes was implemented, and it was shown that typical cluster shapes, representing images with low point density, can also be automatically classified by convolutional neural networks.
The exhaustive characteristics of the proposed method stability have not been obtained so far, but there is a good basis to suppose that different uncertainties in datasets can significantly distort the forms, representing subscriber groups, and complicate the recognition of these forms. Thus, the evaluation and optimization of the convolutional neural network robustness in solving the recognition tasks require specific statistical modeling. This task presents a great theoretical interest, since the results of this paper can be applied to all fields of machine learning—the work describes a largely simplified model, thereby summarizing its conclusions for most cases solved by neural networks and other machine learning models.
2. Research Plan
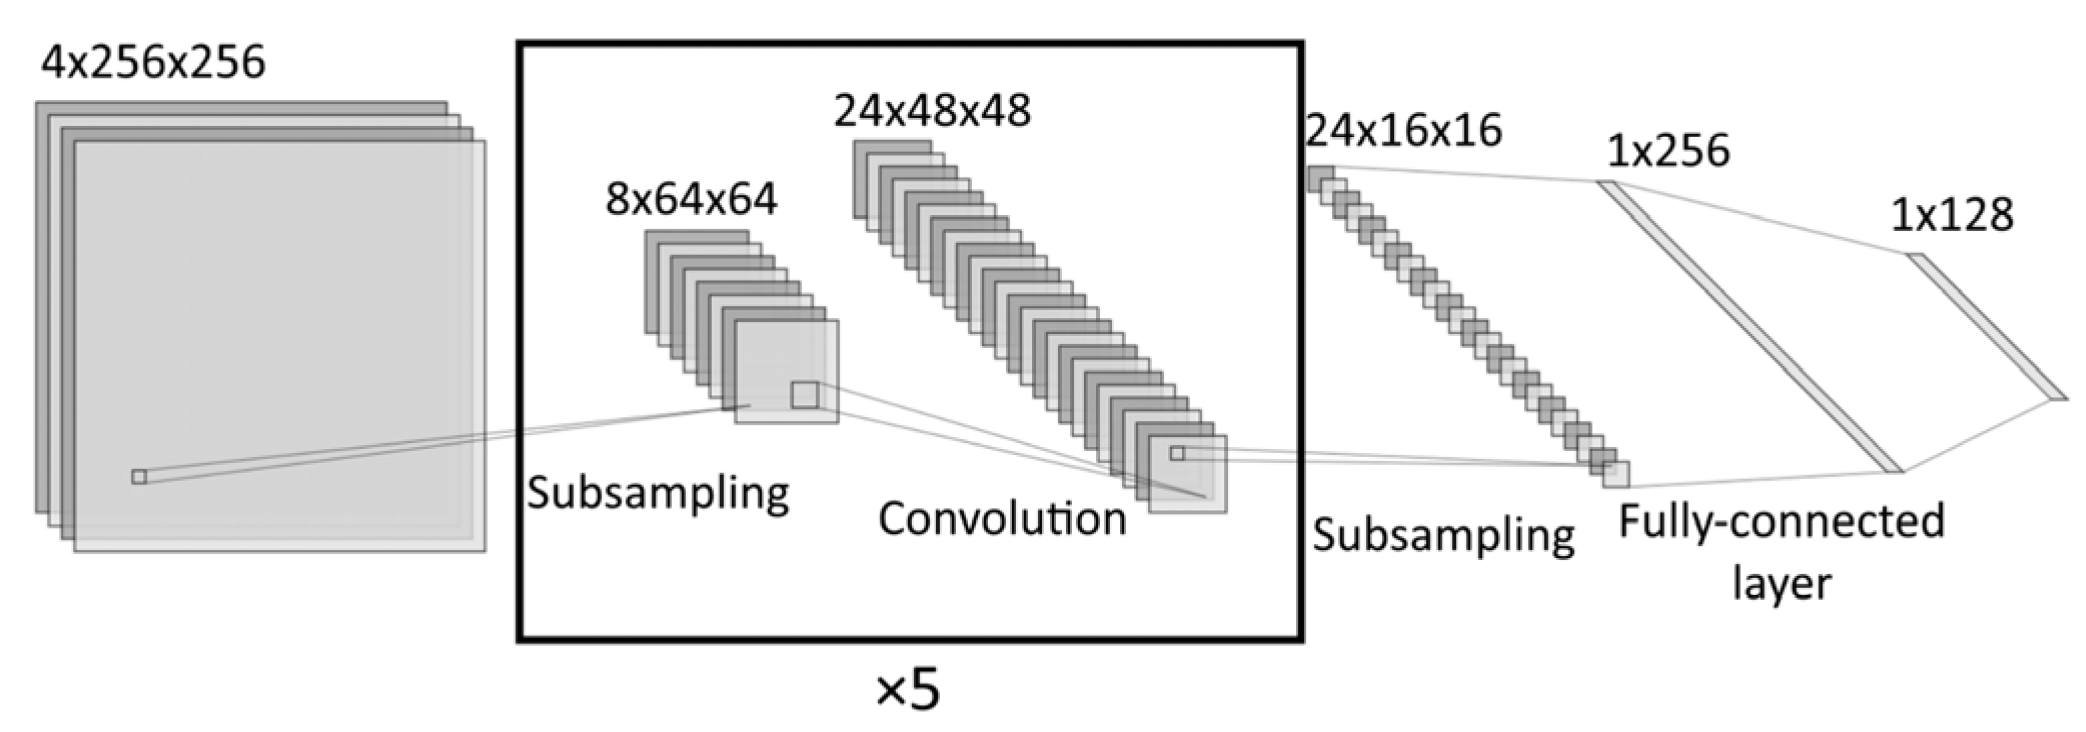
In a convolutional neural network, the overall supervised learning and inference system structure is as shown in
Figure 3.
As stated before, the optimization of the neural network itself, without taking the training dataset influence into account, will generally not provide an exhaustive result and will only allow improving the behavior of the system in some cases. Although the deepening of a neural network (generally, but not applicable in this work because of the simplicity of images, which will be shown further) leads to a better ability of this network to detect and generalize the hidden features [
26,
27,
28], but also creates many problems, such as network resource consumption increase, vanishing gradients problem, etc. Optimization must be performed, taking the properties of all “training dataset-processing module-testing dataset” system components into account.
A widespread traditional approach involves obtaining the fixed test dataset recognition accuracy by a network trained on a fixed training dataset with a given uncertainty
U0. This accuracy can be described as a single number, a scalar
P0. Accuracy
P0 is described as follows:
where
Mcorrect is the number of correctly recognized items in the testing dataset and
Mtotal is a total number of items in the testing dataset.
This scalar approach only allows estimating the local properties of the learning-recognition system, but it does not allow estimating the behavior of this system at different data uncertainties. We propose a deeper vector and matrix approach to evaluate the network stability and robustness, which includes the following two sequential steps:
(1) Obtaining an array of test dataset recognition accuracies P at various test dataset uncertainties UTS with a fixed training dataset uncertainty UTR—vector P(UTS).
(2) Obtaining a two-dimensional array of testing dataset recognition accuracies P, depending on their uncertainties and on training dataset uncertainties UTR at the same time—matrix P(UTR; UTS).
Thus, there is an increase in the informativity concerning learning-recognition system robustness and optimality estimation at each following step. With known
P(
UTR;
UTS), we can obtain
P(
UTS) and
P0:
where
NTR is the amount of various learning dataset uncertainties
UTR,
NTS is the amount of various testing dataset uncertainties
UTS.
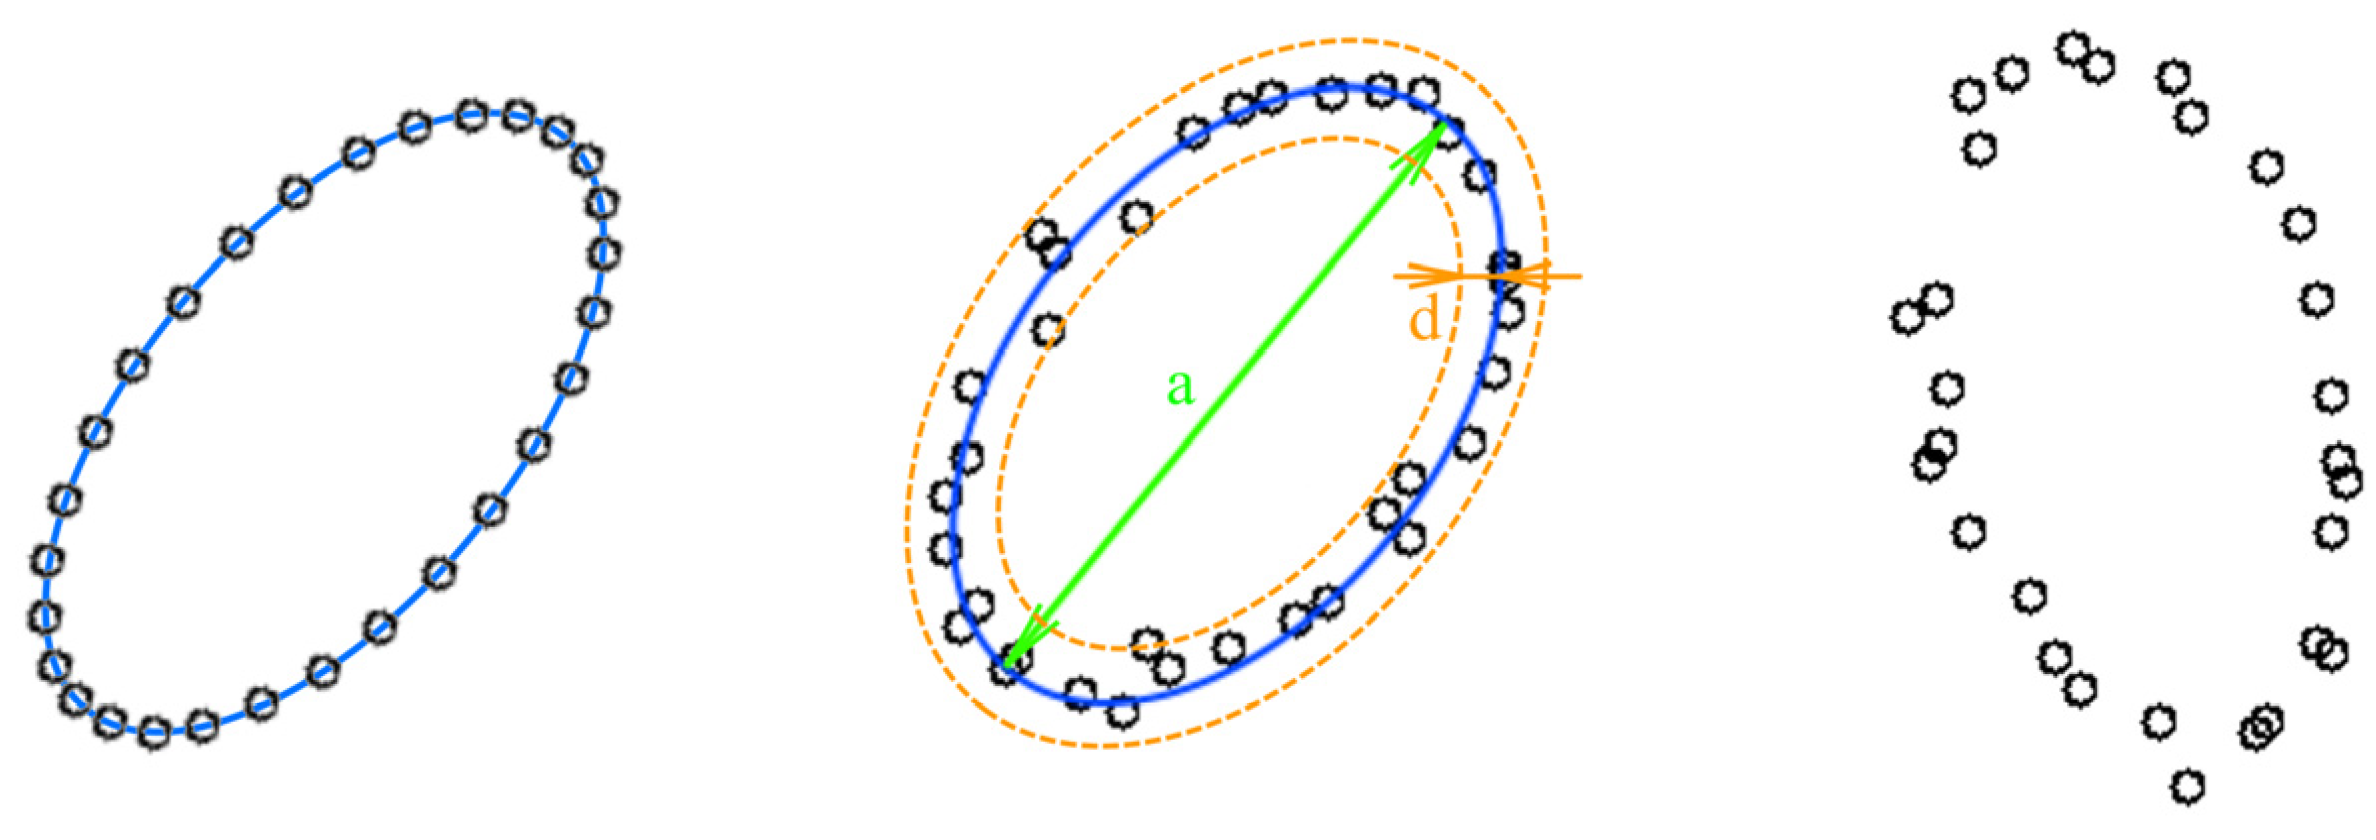
A convenient image experiment model was chosen to evaluate the external specifications of the learning and inference system. The mathematical model described in paper [
23] allows us to automatically generate the datasets used for convolutional neural network training and testing, and it also allows us to set various uncertainty parameters (for example, the point position offset relative to the shape vector model (
Figure 4). This fact allows evaluating the convolutional neural network stability to the changing dataset uncertainty parameters and to evaluate the neural network characteristics in the conditions of the factors, increasing the input data distortions. This fact allows evaluating the convolutional neural network stability to the changing dataset uncertainty parameters and evaluating the neural network characteristics in the conditions of the presence of the factors, increasing the input data distortions.
To evaluate the trained neural network noise immunity characteristics in paper [
23], we generated 200 datasets with different uncertainties (
Figure 5).
As one can see in
Figure 5, the uncertainty of the coordinates of individual points distorts the image, but the common shapes retain their characteristic features.
5. Estimation of the Recognition Quality Dependence on the Amount of Uncertainty
First, we used a neural network to recognize each testing dataset with its amount of uncertainty UTS, which allowed us to determine the dependence of the recognition accuracy on uncertainty in the testing dataset P(UTS).
To obtain more information, we trained two independent CNNs with identical structures on two training datasets, with two different amounts of uncertainty:
UTR = 0 and
UTR = [0…0.025]. The hyperparameters remained unchanged. Separate datasets with image sequence randomizations were created for each experiment. The rule for dataset generation is described in [
23]. Initial weights of CNNs were randomized as run-to-run. Trained CNNs were used for the recognition of separately generated datasets containing images with various uncertainties
UTS. All recognition probabilities
P obtained in these series of simulations were averaged over all series of experiments with fixed
UTS.
As a result, two arrays of recognition accuracies, as functions of testing dataset uncertainty
P(
UTS), were obtained. The results of this experiment are summarized in the graph shown in
Figure 8.
The comparison of two graphs allowed us to draw three main conclusions:
At UTR = 0 the accuracy curve is monotonous. It confirms the consistency and robustness of the chosen model.
At UTR = (0…0.025) the accuracy curve is “no more” monotonous; it shows a small drop of accuracy below UTS = 0.01. This phenomenon shows that changing the uncertainty proportions in the training dataset may affect the recognition of ideal images.
The maximum accuracy is achieved at UTR = 0 and UTS = 0, but the integral (overall) accuracy at all considered values of UTS is achieved at UTR = (0…0.025). This phenomenon can be explained by the limited ability of the neural network, trained only on perfect images without uncertainty, to generalize the features presented in the distorted examples with uncertainty.
It is well known that the characteristics of the training dataset strongly affect the neural network training quality and the accuracies of their future new dataset recognition tasks [
30]. To optimize the convolutional neural network training (to discover the optimal training dataset parameters to improve the recognition quality of images with different uncertainties) in this paper, we conducted experiments by training the convolutional neural network using datasets with various amounts of uncertainty. From the graphs shown in
Figure 7 and
Figure 8, we cannot make unequivocal conclusions about training optimality. In our research, we conducted more training experiments, thereby “unfolding” the results in a new dimension (amount of uncertainty in the training dataset).
Figure 9 shows the dependencies of recognition accuracy on the amount of uncertainty
UTS, obtained by the networks trained on datasets with
UTR, varying from 0 to 0.125 in increments of 0.025, shown in one graph for clarity.
Figure 9 shows that the maximum recognition accuracy is achieved at
UTS ≤
UTR. Moreover, an analysis of the graphs in
Figure 9 shows that for
UTR ≥ 0.025, the accuracy graphs change their shapes from monotonic to non-monotonic, indicating that the training is not optimal and is non-robust. The dependence of
P(UTS) should be monotonous,
due to the fall of the meaningful information quantity with rising uncertainty. This rule may be used as the criterion for training correctness and robustness.
7. Cumulative Recognition Accuracy at Different Thresholds
In practical tasks solved by neural networks, it is often not necessary to recognize data with extremely high distortions. Moreover, there are often minimal classification/recognition accuracy requirements to the developed solutions that use neural networks. Often, in practice, there is a necessity to gain a high enough “certainty” of the system. To obtain more valuable results, we selected areas that included the values of the testing dataset uncertainty with a recognition accuracy higher than
Pthr, in which the recognition accuracy was higher than the selected thresholds, which allowed estimating the acceptable coordinate uncertainties to provide the necessary recognition accuracy.
Figure 11 shows the area that included the values of the testing dataset uncertainty
UTS that provided recognition accuracy
Pthr higher than 90%.
The highlighted area in
Figure 11 is calculated as
The task of determining the optimal training dataset parameters to obtain the required recognition accuracy above threshold
Pthr arises. For each network trained on datasets with different uncertainties, we obtained the integral recognition accuracy values
Q at different thresholds:
In this case,
Q is an integral value of the classification accuracy for all test datasets (with all uncertainties), for which the recognition accuracy exceeded threshold
P ≥ Pthr. The obtained data are summarized in the graph shown in
Figure 12 below.
This graph represents the integral (overall) average rate of correct recognition for data giving the recognition probability greater than Pthr, depending on Pthr and training dataset uncertainty UTR. New data recognized with accuracies lower than the required Pthr were not counted. The colors in the graph show areas with identical mean recognition accuracies for all . There is always an optimal training dataset uncertainty UTR, depending on the lower threshold of the required recognition accuracy.
Using
Figure 12, one can determine the optimal training dataset uncertainty
UTR needed to achieve maximal integral recognition accuracy
Q for all data with local recognition probability exceeding the threshold
P ≥
Pthr. It can be illustrated in
Figure 13.
Assuming that the optimal training dataset at the required threshold of the minimum classification accuracy is the dataset that gives the highest value of integral classification accuracy
Q, the graph in
Figure 13 is convenient for determining the optimal training dataset uncertainty
UTR. If we analyze the dependence of the integral recognition accuracy
Q on the training dataset uncertainty
UTR at a fixed threshold
Pthr, we obtain a graph with a clear maximum, the position of which will indicate the optimal value of training dataset uncertainty
UTR (
Figure 13,
Qmax for various
Pthr are shown with red dots). An analysis of
Figure 13 allows us to conclude that training the network with optimal
UTR for fixed
Pthr significantly increases the integral recognition accuracy compared to training the network with an ideal dataset with
UTR = 0. For example, for
Pthr = 0.9,
Qmax exceeds
Q0 by 94% (
Qmax = 0.62 is obtained at
UTR = 0.068 and
Q0 = 0.32 is obtained at
UTR = 0).
8. Noisy Images Recognition
To generalize the results of this study, we conducted a simulation with different types of images and noise using the same CNN structure and the same approach involving an analysis of
dependence. The examples of images are shown in
Figure 14. We added white Gaussian noise with mean
μ = 0 and various standard deviations
σ to the images to generate separate datasets for training and recognition. The uncertainty
U is therefore defined via (1), where
Inoise =
σ.
We used a convolutional neural network identical to the one described before to solve the noisy image classification task. Five datasets for training were generated. The training dataset parameters are described below:
- (1)
The first dataset had UTR = 0 for all images (no noise was added).
- (2)
The second dataset was divided into three parts containing equal numbers of images; the first part had UTR = 0, the second part had UTR = 0.04, the third part had UTR = 0.08.
- (3)
The third dataset was divided into three parts containing equal numbers of images; the first part had UTR = 0, the second part had UTR = 0.12, the third part had UTR = 0.16.
- (4)
The fourth dataset was divided into three parts containing equal numbers of images; the first part had UTR = 0, the second part had UTR = 0.2, the third part had UTR = 0.4.
- (5)
The fifth dataset was divided into three parts containing equal numbers of images; the first part had UTR = 0, the second part had UTR = 0.4, the third part had UTR = 0.8.
Thus, four of five datasets had various amounts of noise added to the original images.
Five independent CNNs with identical structures were trained using five datasets described above. The hyperparameters remained unchanged. Separate datasets with image sequence randomizations were created for each experiment. Initial weights of CNNs were randomized run-to-run. Trained CNNs were used for recognition of separately generated testing datasets containing images with various uncertainty values UTS. Testing datasets had homogenous structures: all images in each dataset had the same amount of additional noise, giving us fixed UTS for the whole dataset. All recognition probabilities P obtained in these series of simulations were averaged over all series of experiments with fixed UTS.
The simulation results are shown in
Figure 15.
The results shown in
Figure 15 and
Figure 16 allow us to state that moderate training dataset uncertainty
UTR should be optimal for recognition of noisy images with high threshold recognition probability
Pthr. For the current example, the optimal training dataset is the second one, having
UTR = {0; 0.04; 0.08} for
Pthr > 0.87. A further increase of
UTR leads to the fall of integral classification accuracy for high
Pthr. This result allows us to generalize the confirmation of existence of optimal training dataset uncertainty for these types of data.
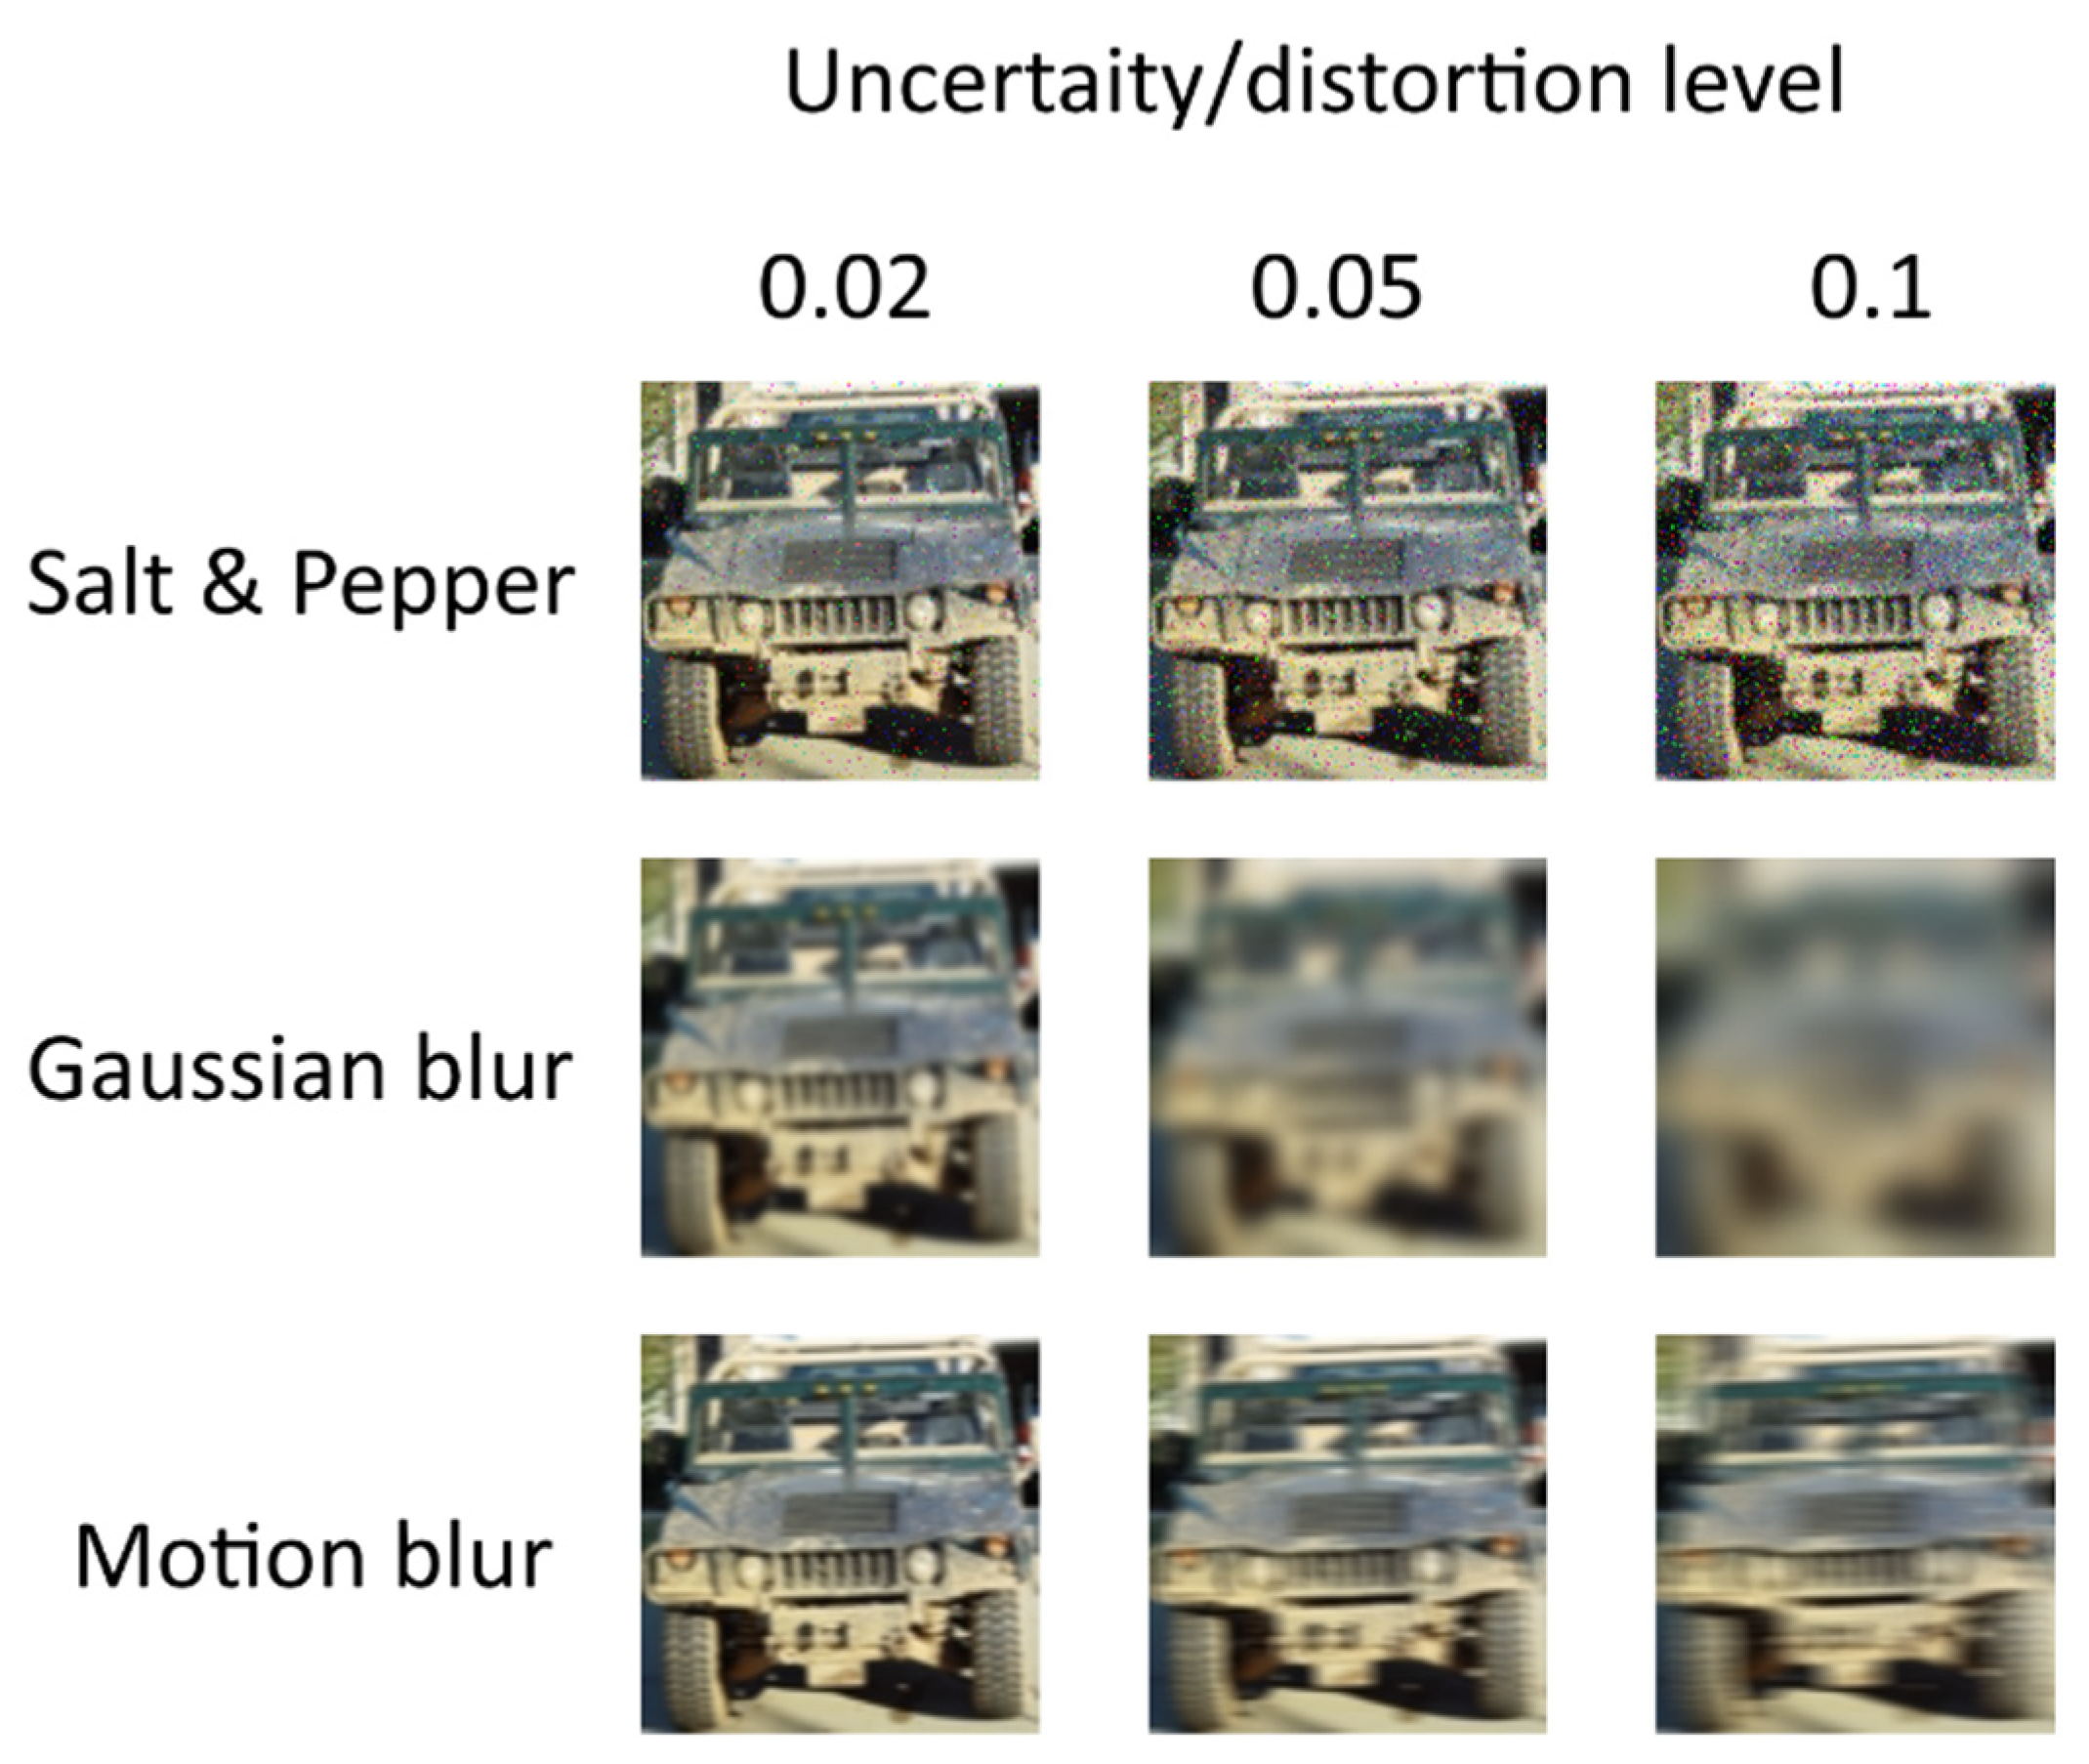
9. Additional Types of Distortion
To check the correctness of our findings, we conducted a series of experiments with various types of image distortions. We conducted these series of simulations with different types of images and noise/distortions using the same CNN structure and the same approach, involving analysis of
dependence. The examples of images are shown in
Figure 17.
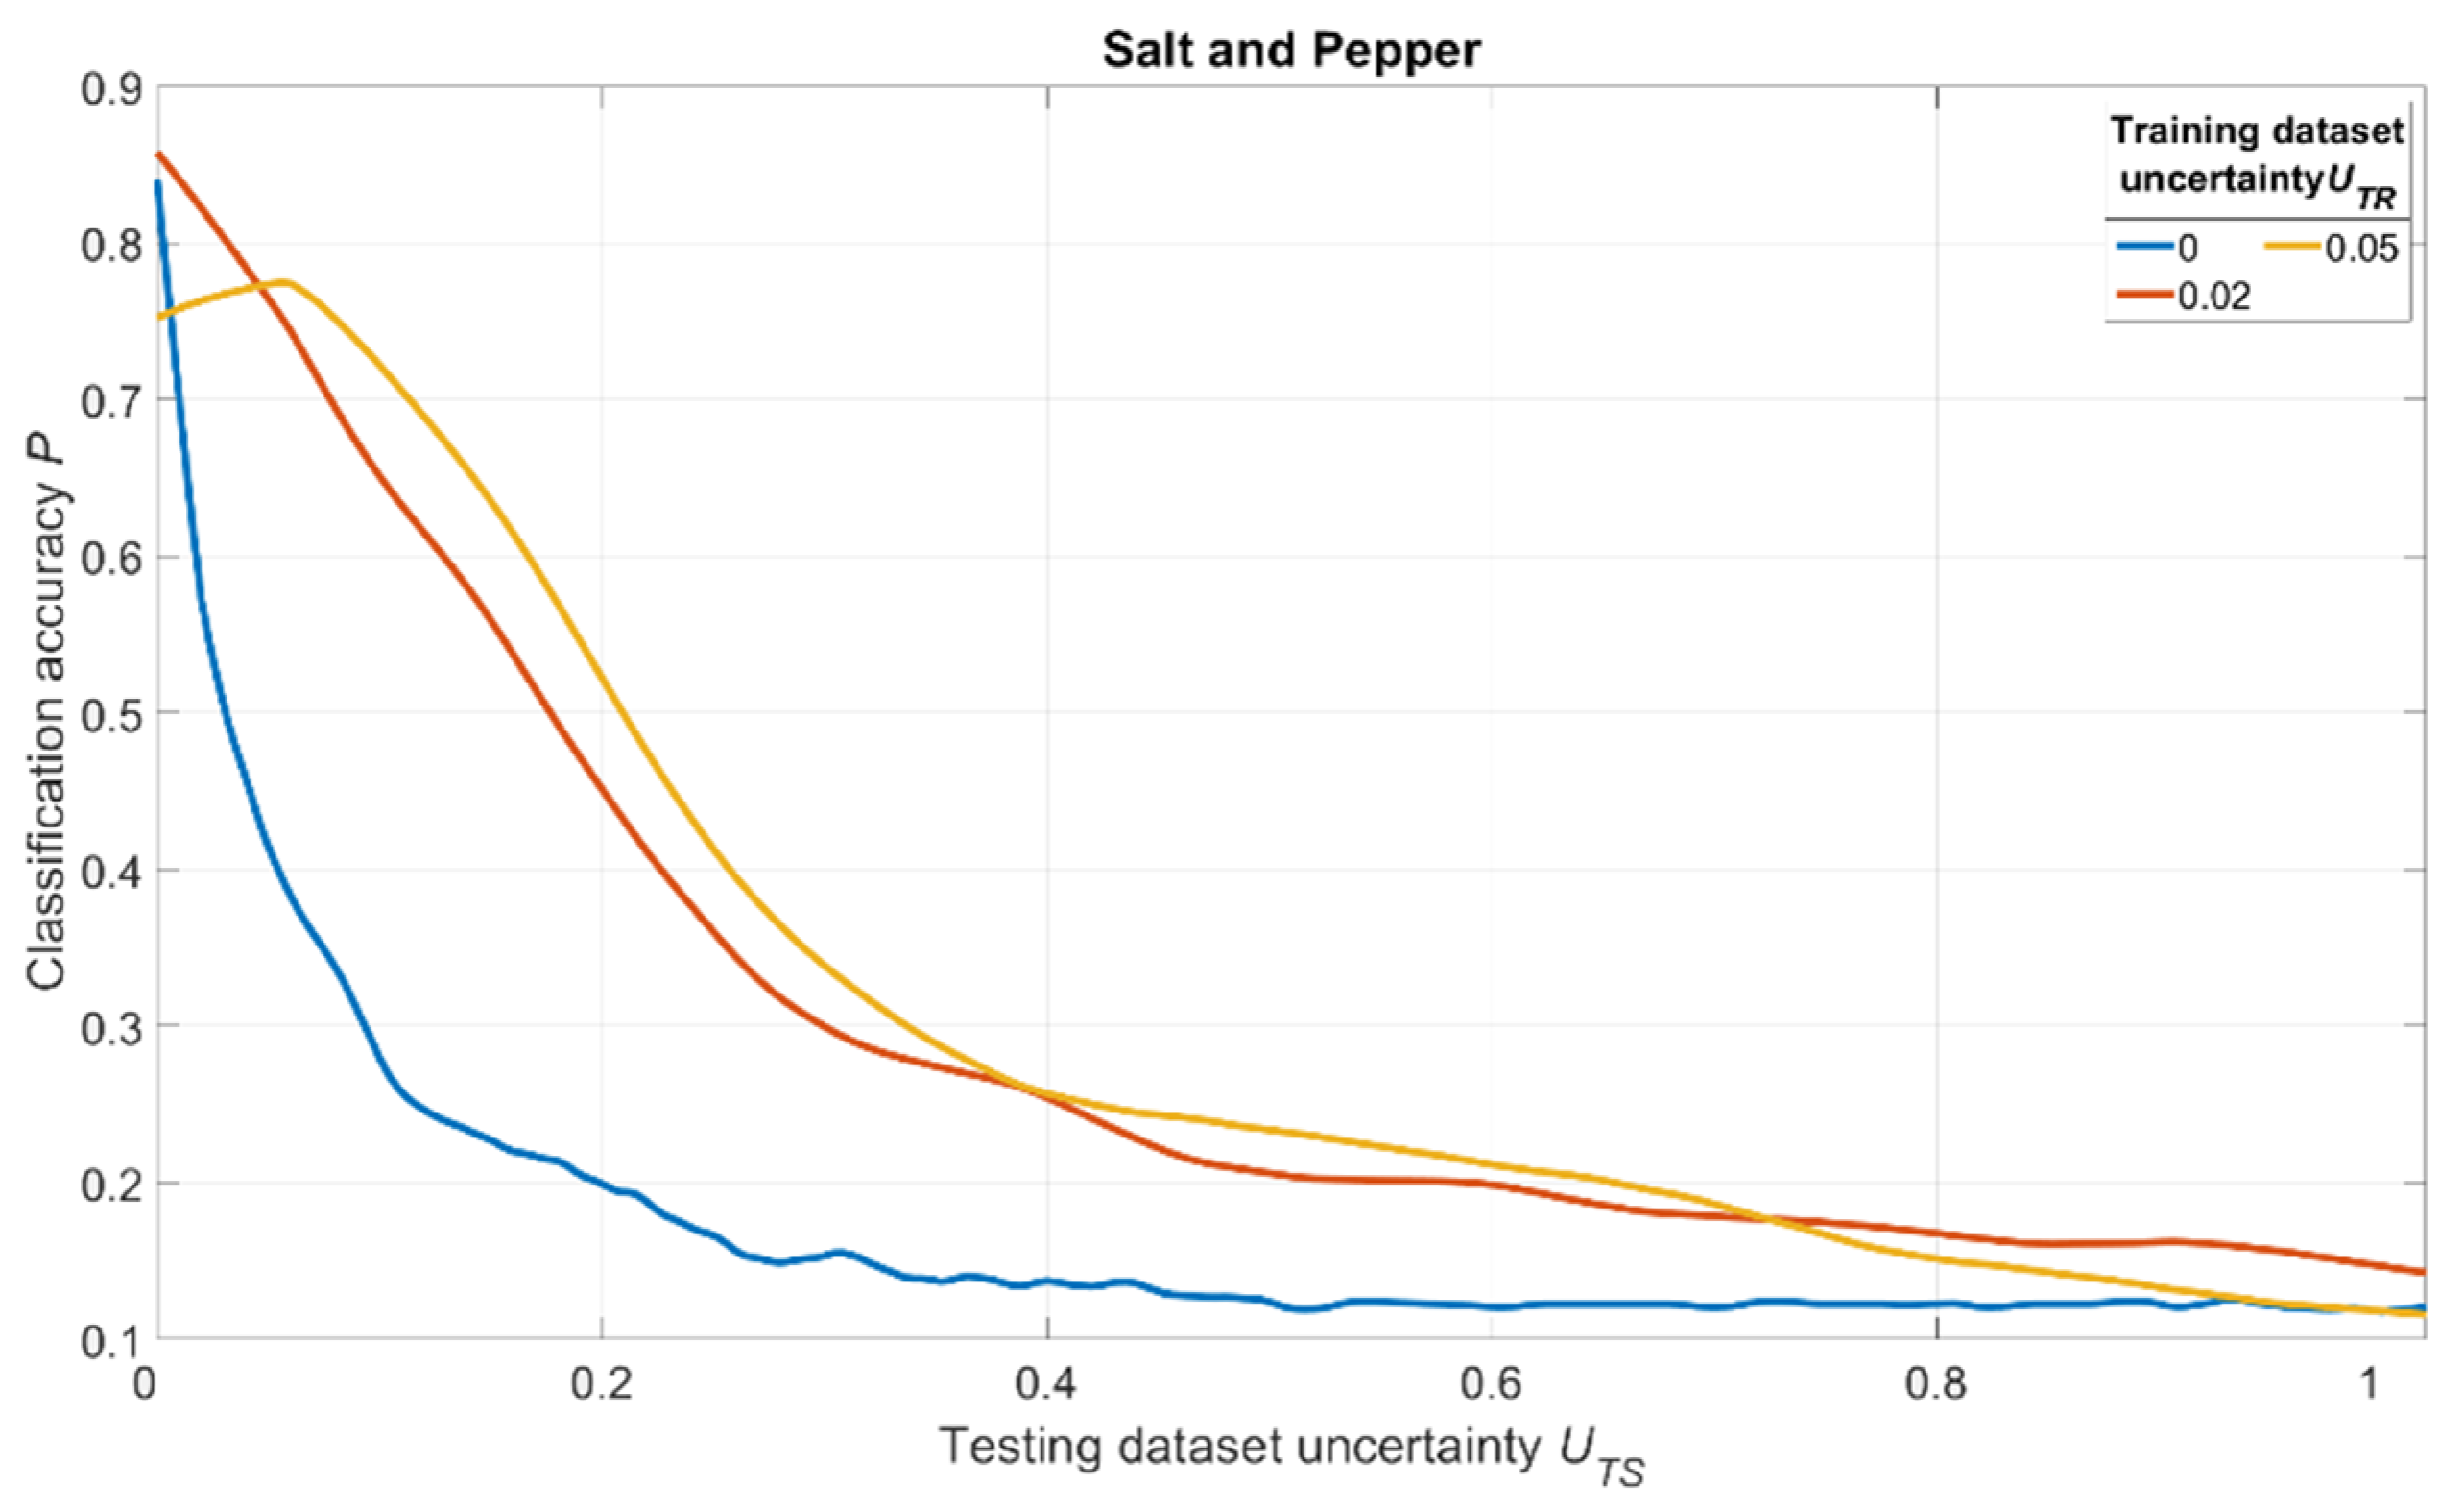
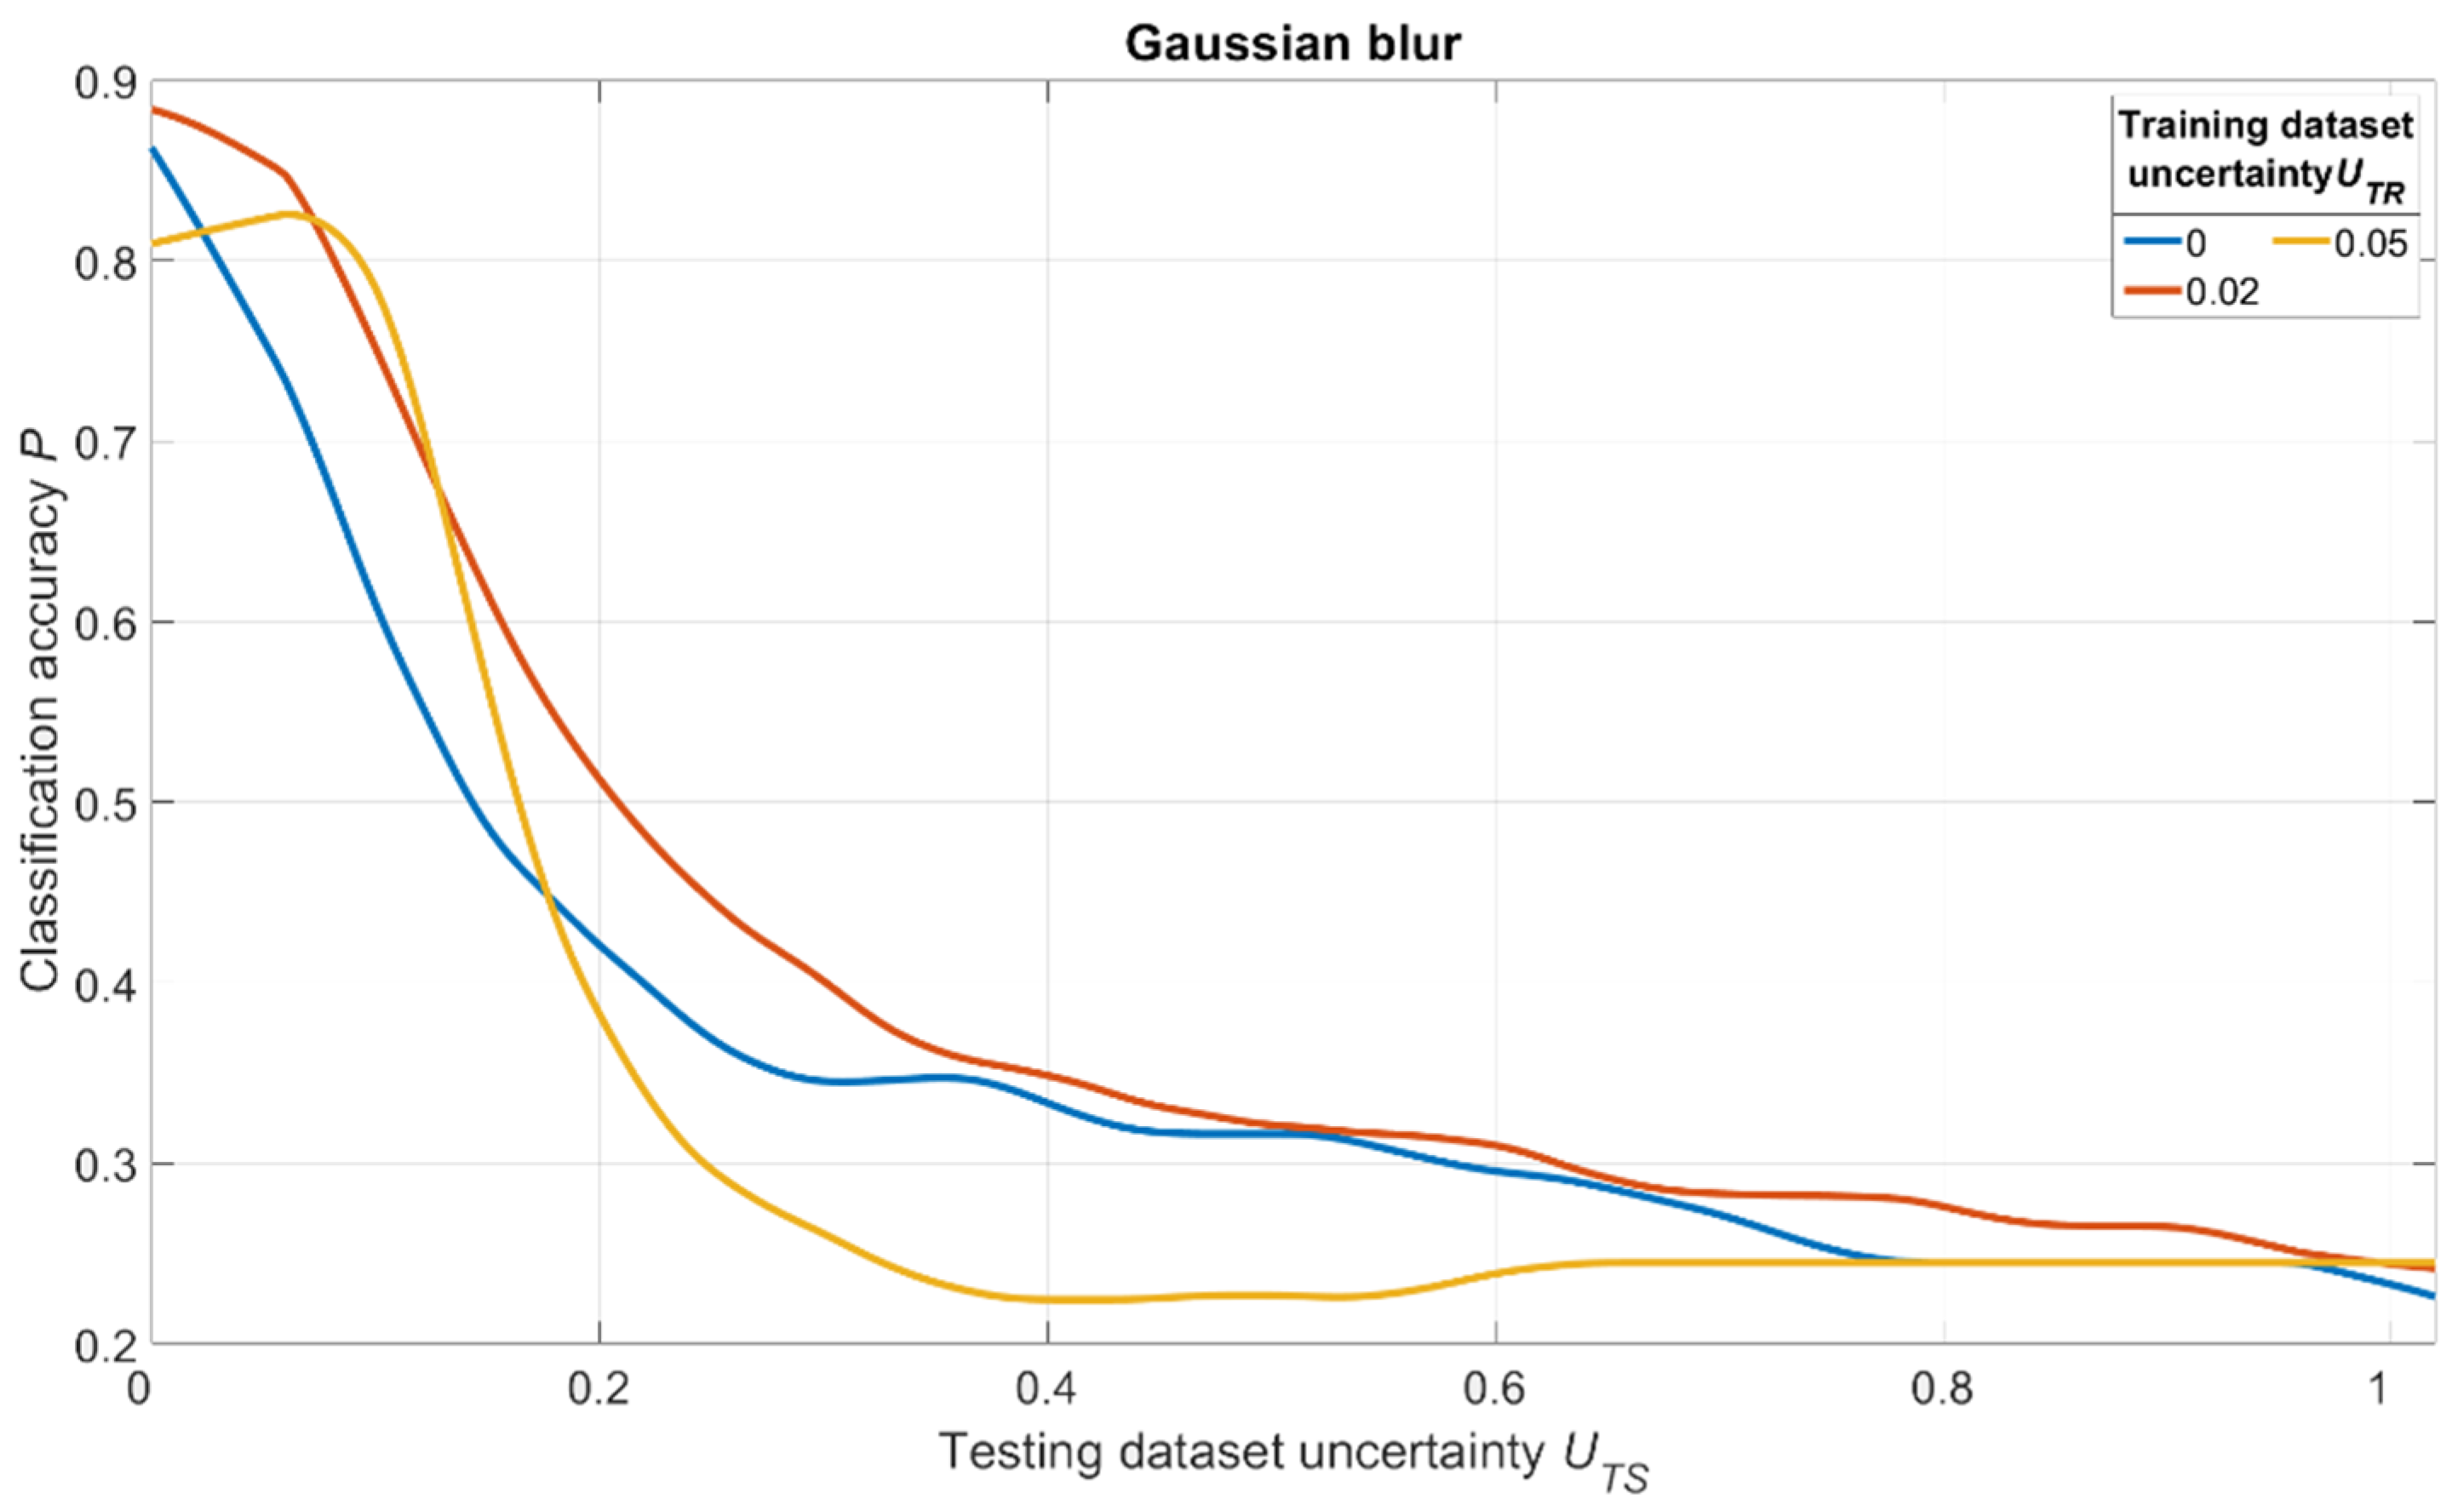
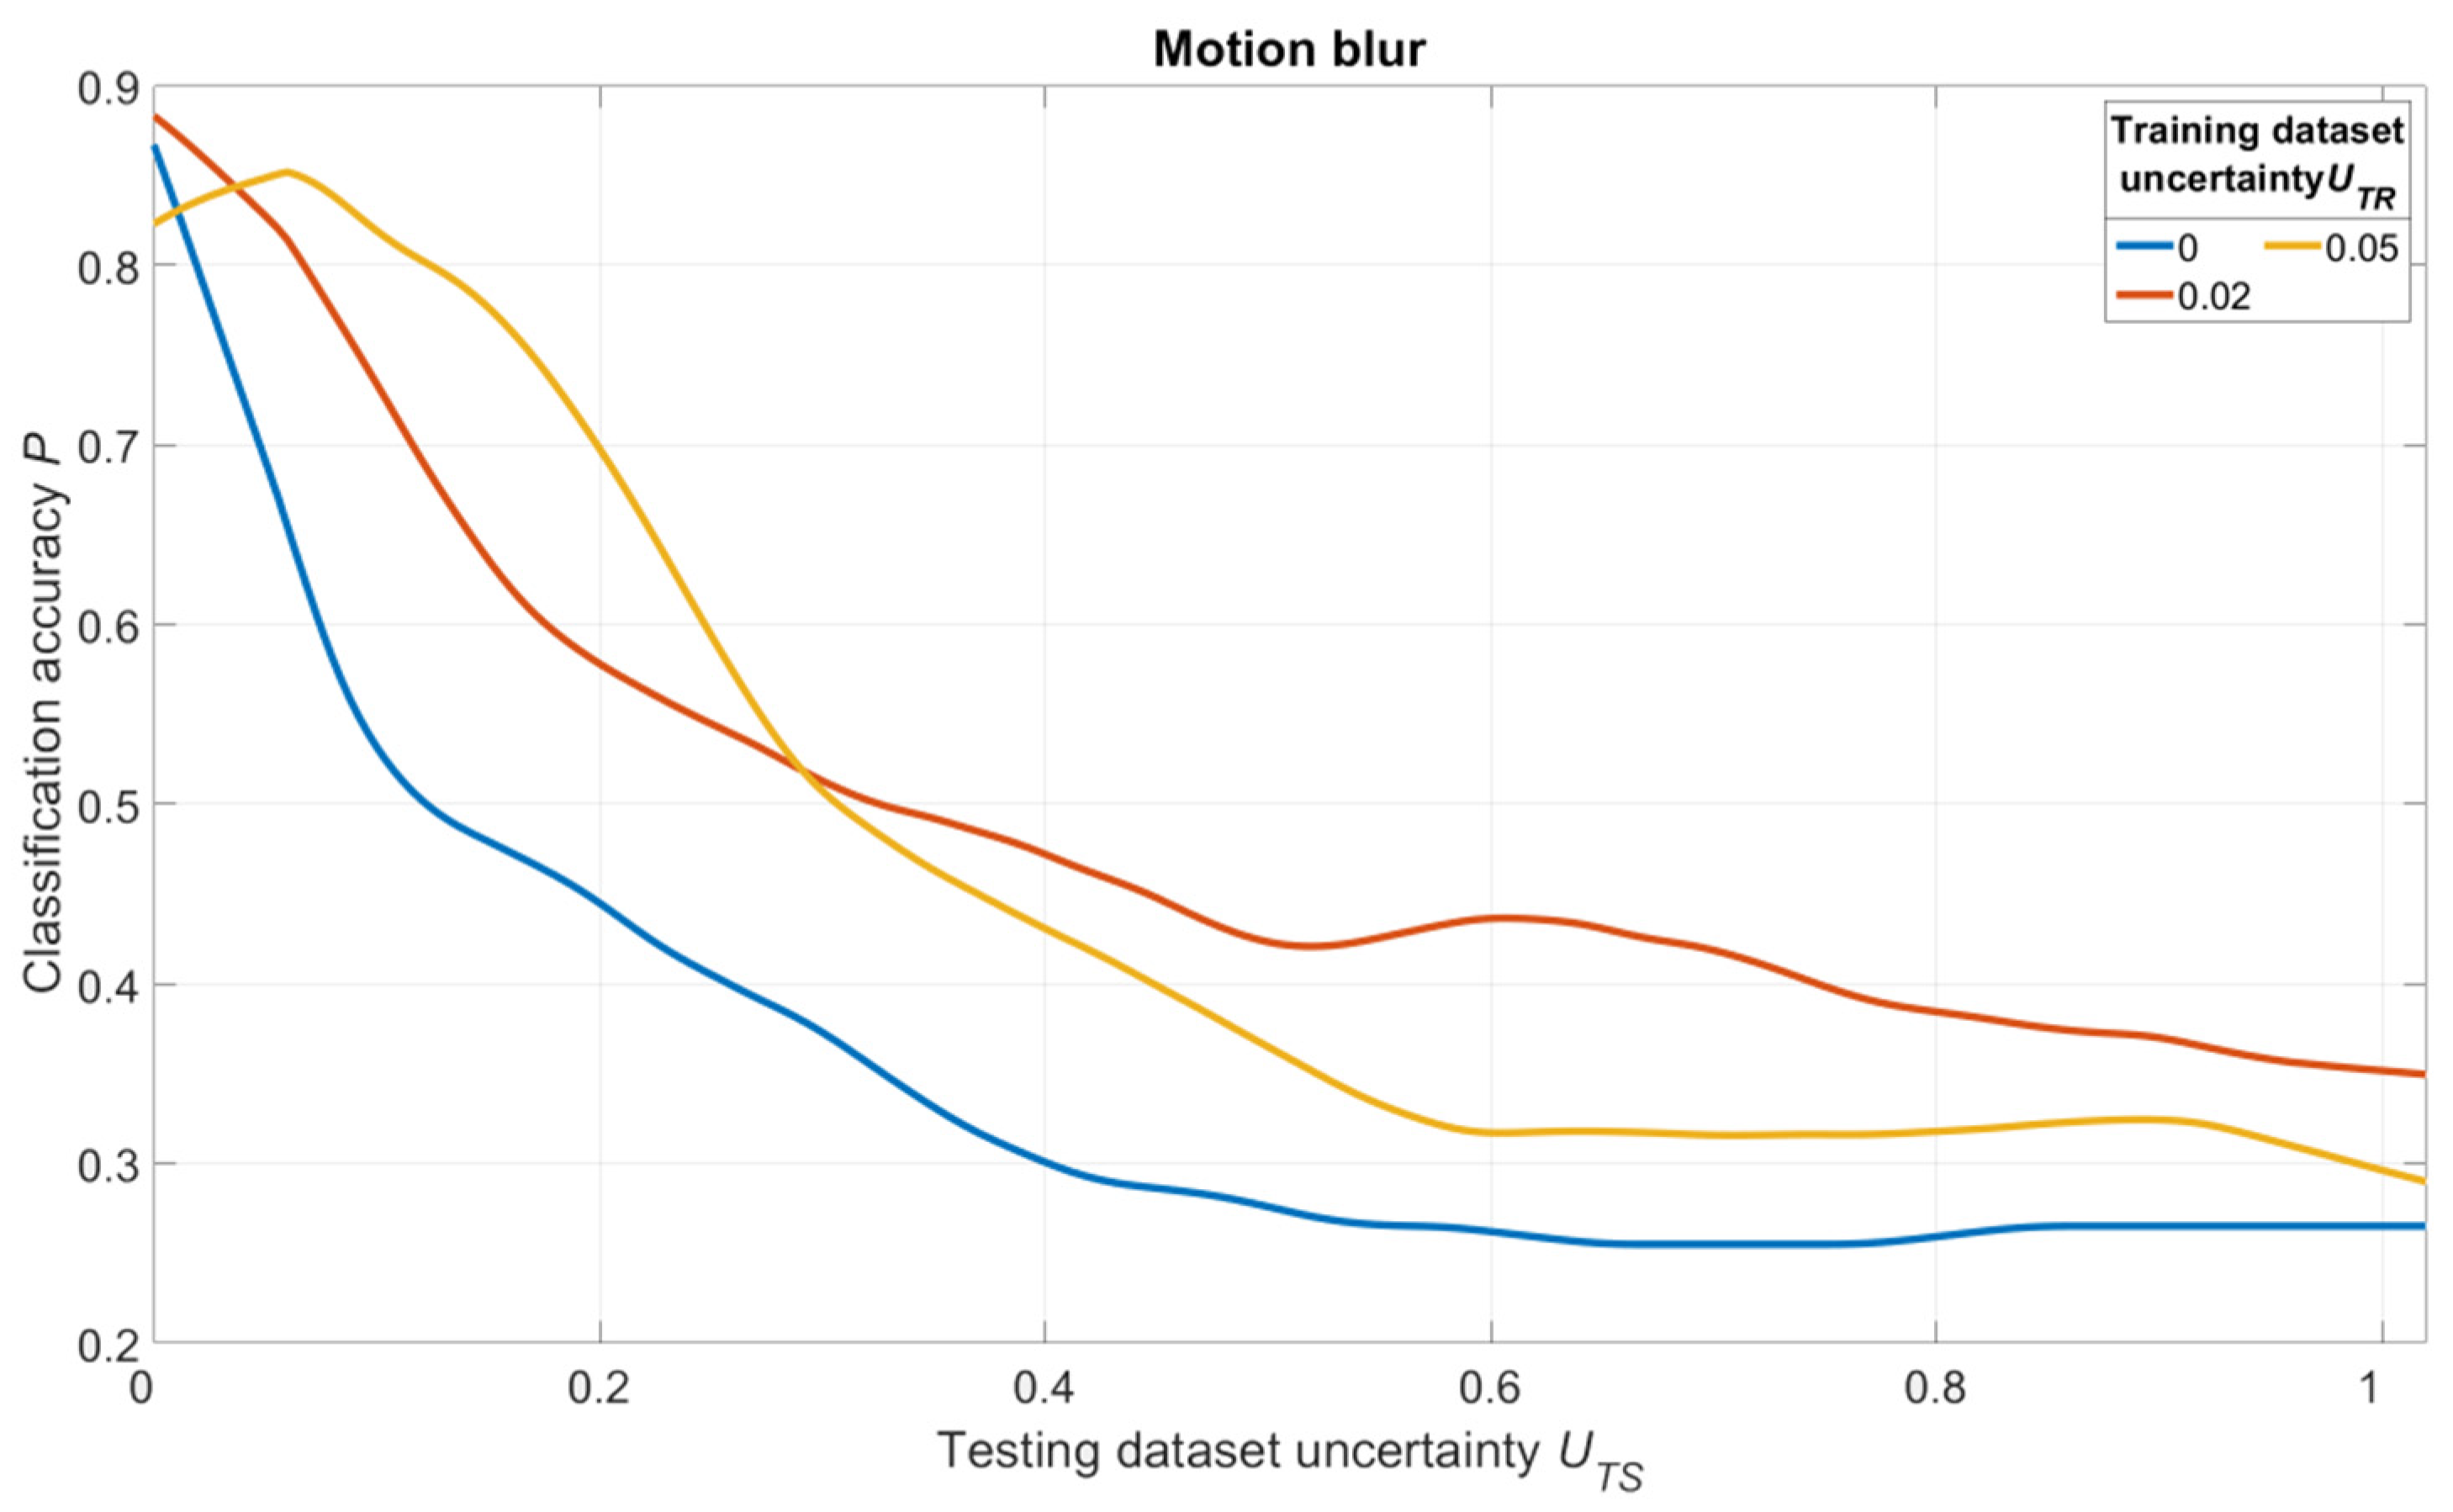
The simulation results are shown in
Figure 18,
Figure 19 and
Figure 20. For salt and pepper noise, the uncertainty was calculated using Formula (1), where
Inoise is a number of “noise” pixels and
Iinfo is the total number of pixels in the image. For Gaussian and motion blur, uncertainty was calculated as follows:
where
Skernel is the size of Gaussian and motion filter kernels and
Simage is the size of the image.
The analysis of
Figure 18,
Figure 19 and
Figure 20 shows one tendency: independently on noise/distortion type during training; its amount influences the recognition accuracy in the same way. Using images without additional uncertainty for training (
UTR = 0, blue curves) leads to a fast decrease of recognition accuracy with the rise of
UTS. This fact tells us that a CNN trained in such a manner would be vulnerable to adversarial attacks. The results also show that a moderate training dataset uncertainty
UTR (red curves) in case of salt and pepper noise, as well as of Gaussian and motion blur, should be optimal for recognition of noisy/distorted images without loss of accuracy for original image recognition. This result allows us to generalize the confirmation of the existence of optimal training dataset uncertainty for these types of data, noise, and distortion.
Thus, we conducted simulations under a variety of conditions, and all of them show the same regularity: there exists an optimal amount of uncertainty of various physical natures that, when applied to the training dataset, lead to significant improvements of trained CNN noise immunity and overall recognition quality. The excessive amount of training dataset uncertainty (yellow curves in
Figure 18,
Figure 19 and
Figure 20) makes the training non-robust. It can be seen as a non-monotonous character of the corresponding (yellow) noise immunity curves (growth of recognition accuracy with increasing
UTS).


