
Automated Lung Sound Classification Using a Hybrid CNN-LSTM Network and Focal Loss Function

 ,
,  , ,
, , 

Abstract
:1. Introduction
2. Related Work
3. Materials and Methods
3.1. Database
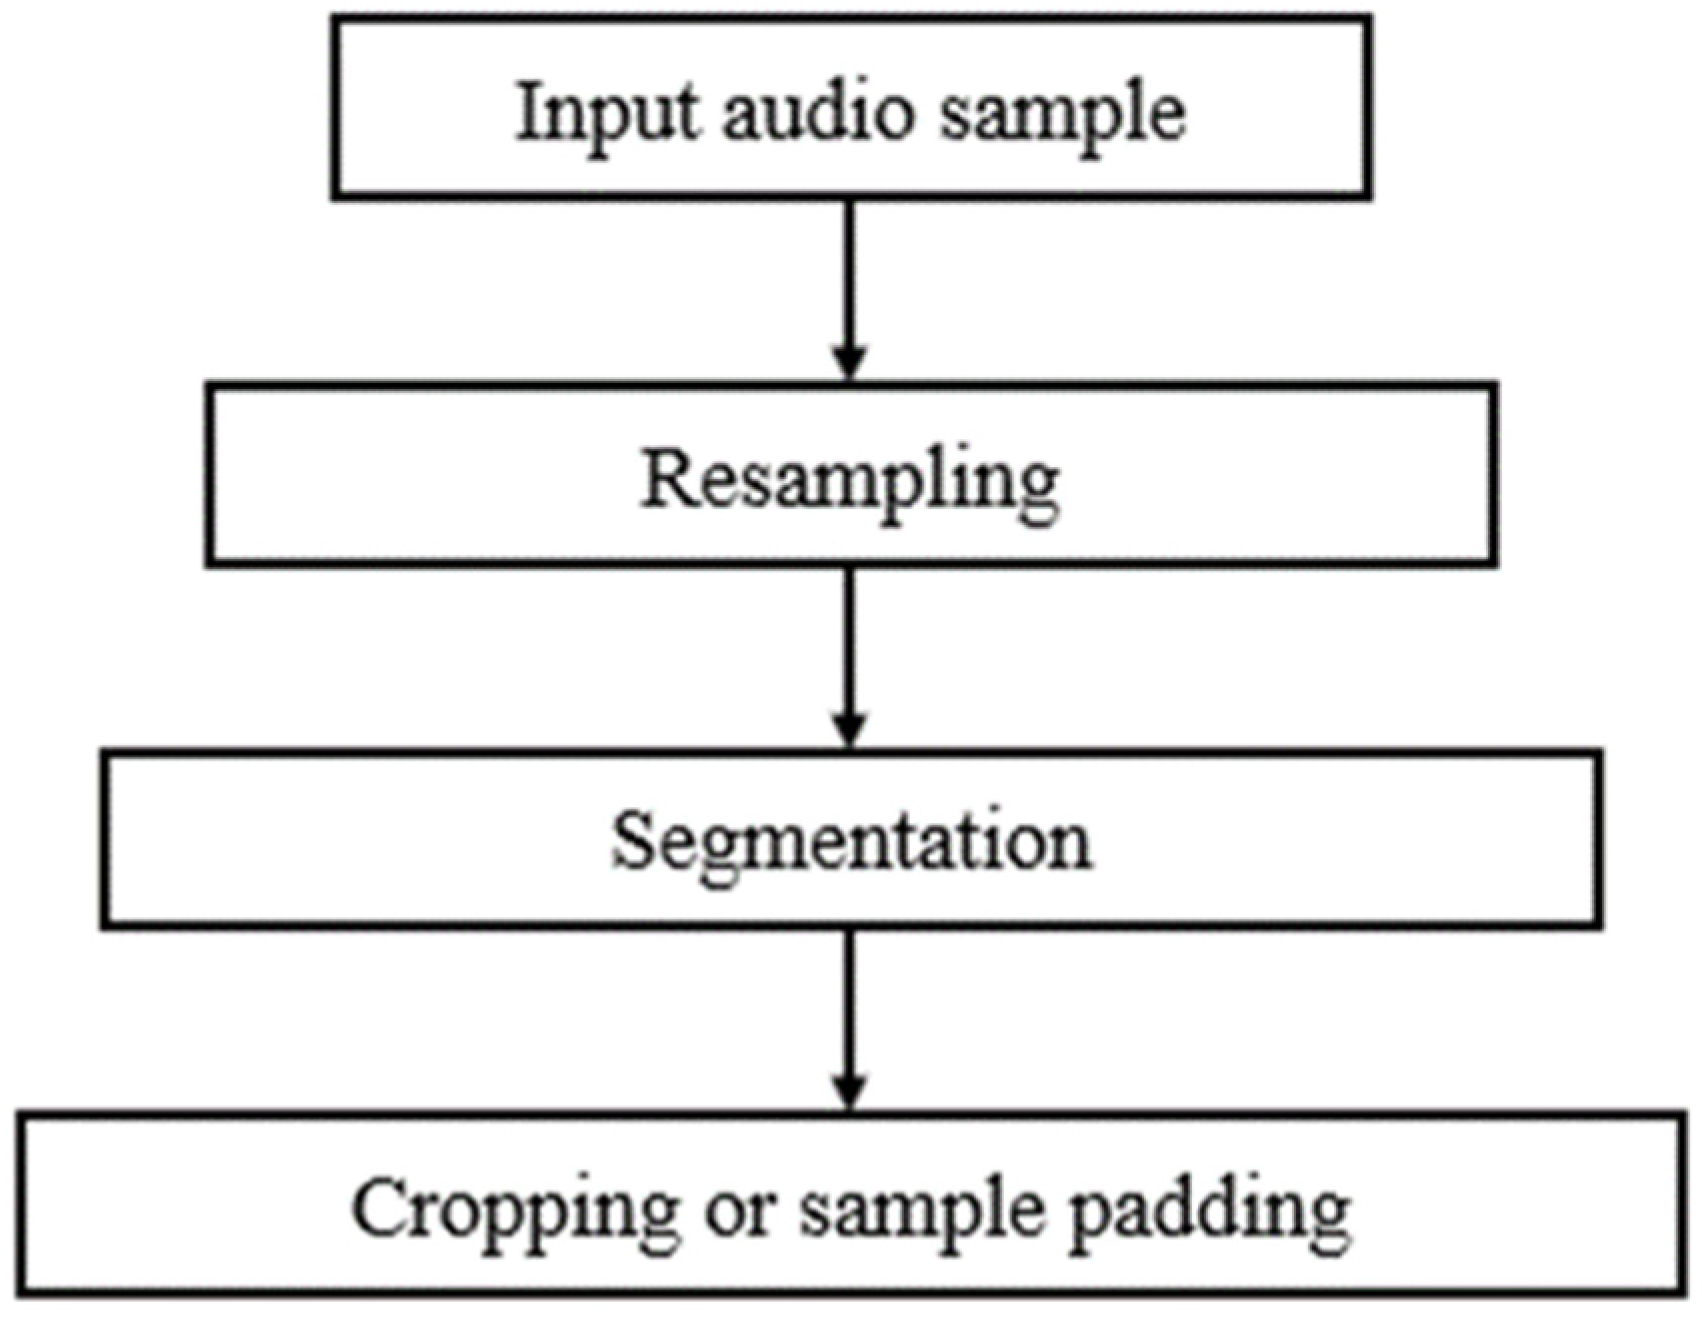
3.2. Preprocessing
3.3. Feature Extraction
3.4. Convolutional Neural Networks
3.5. Long Short-Term Memory Networks
3.6. Focal Loss Function
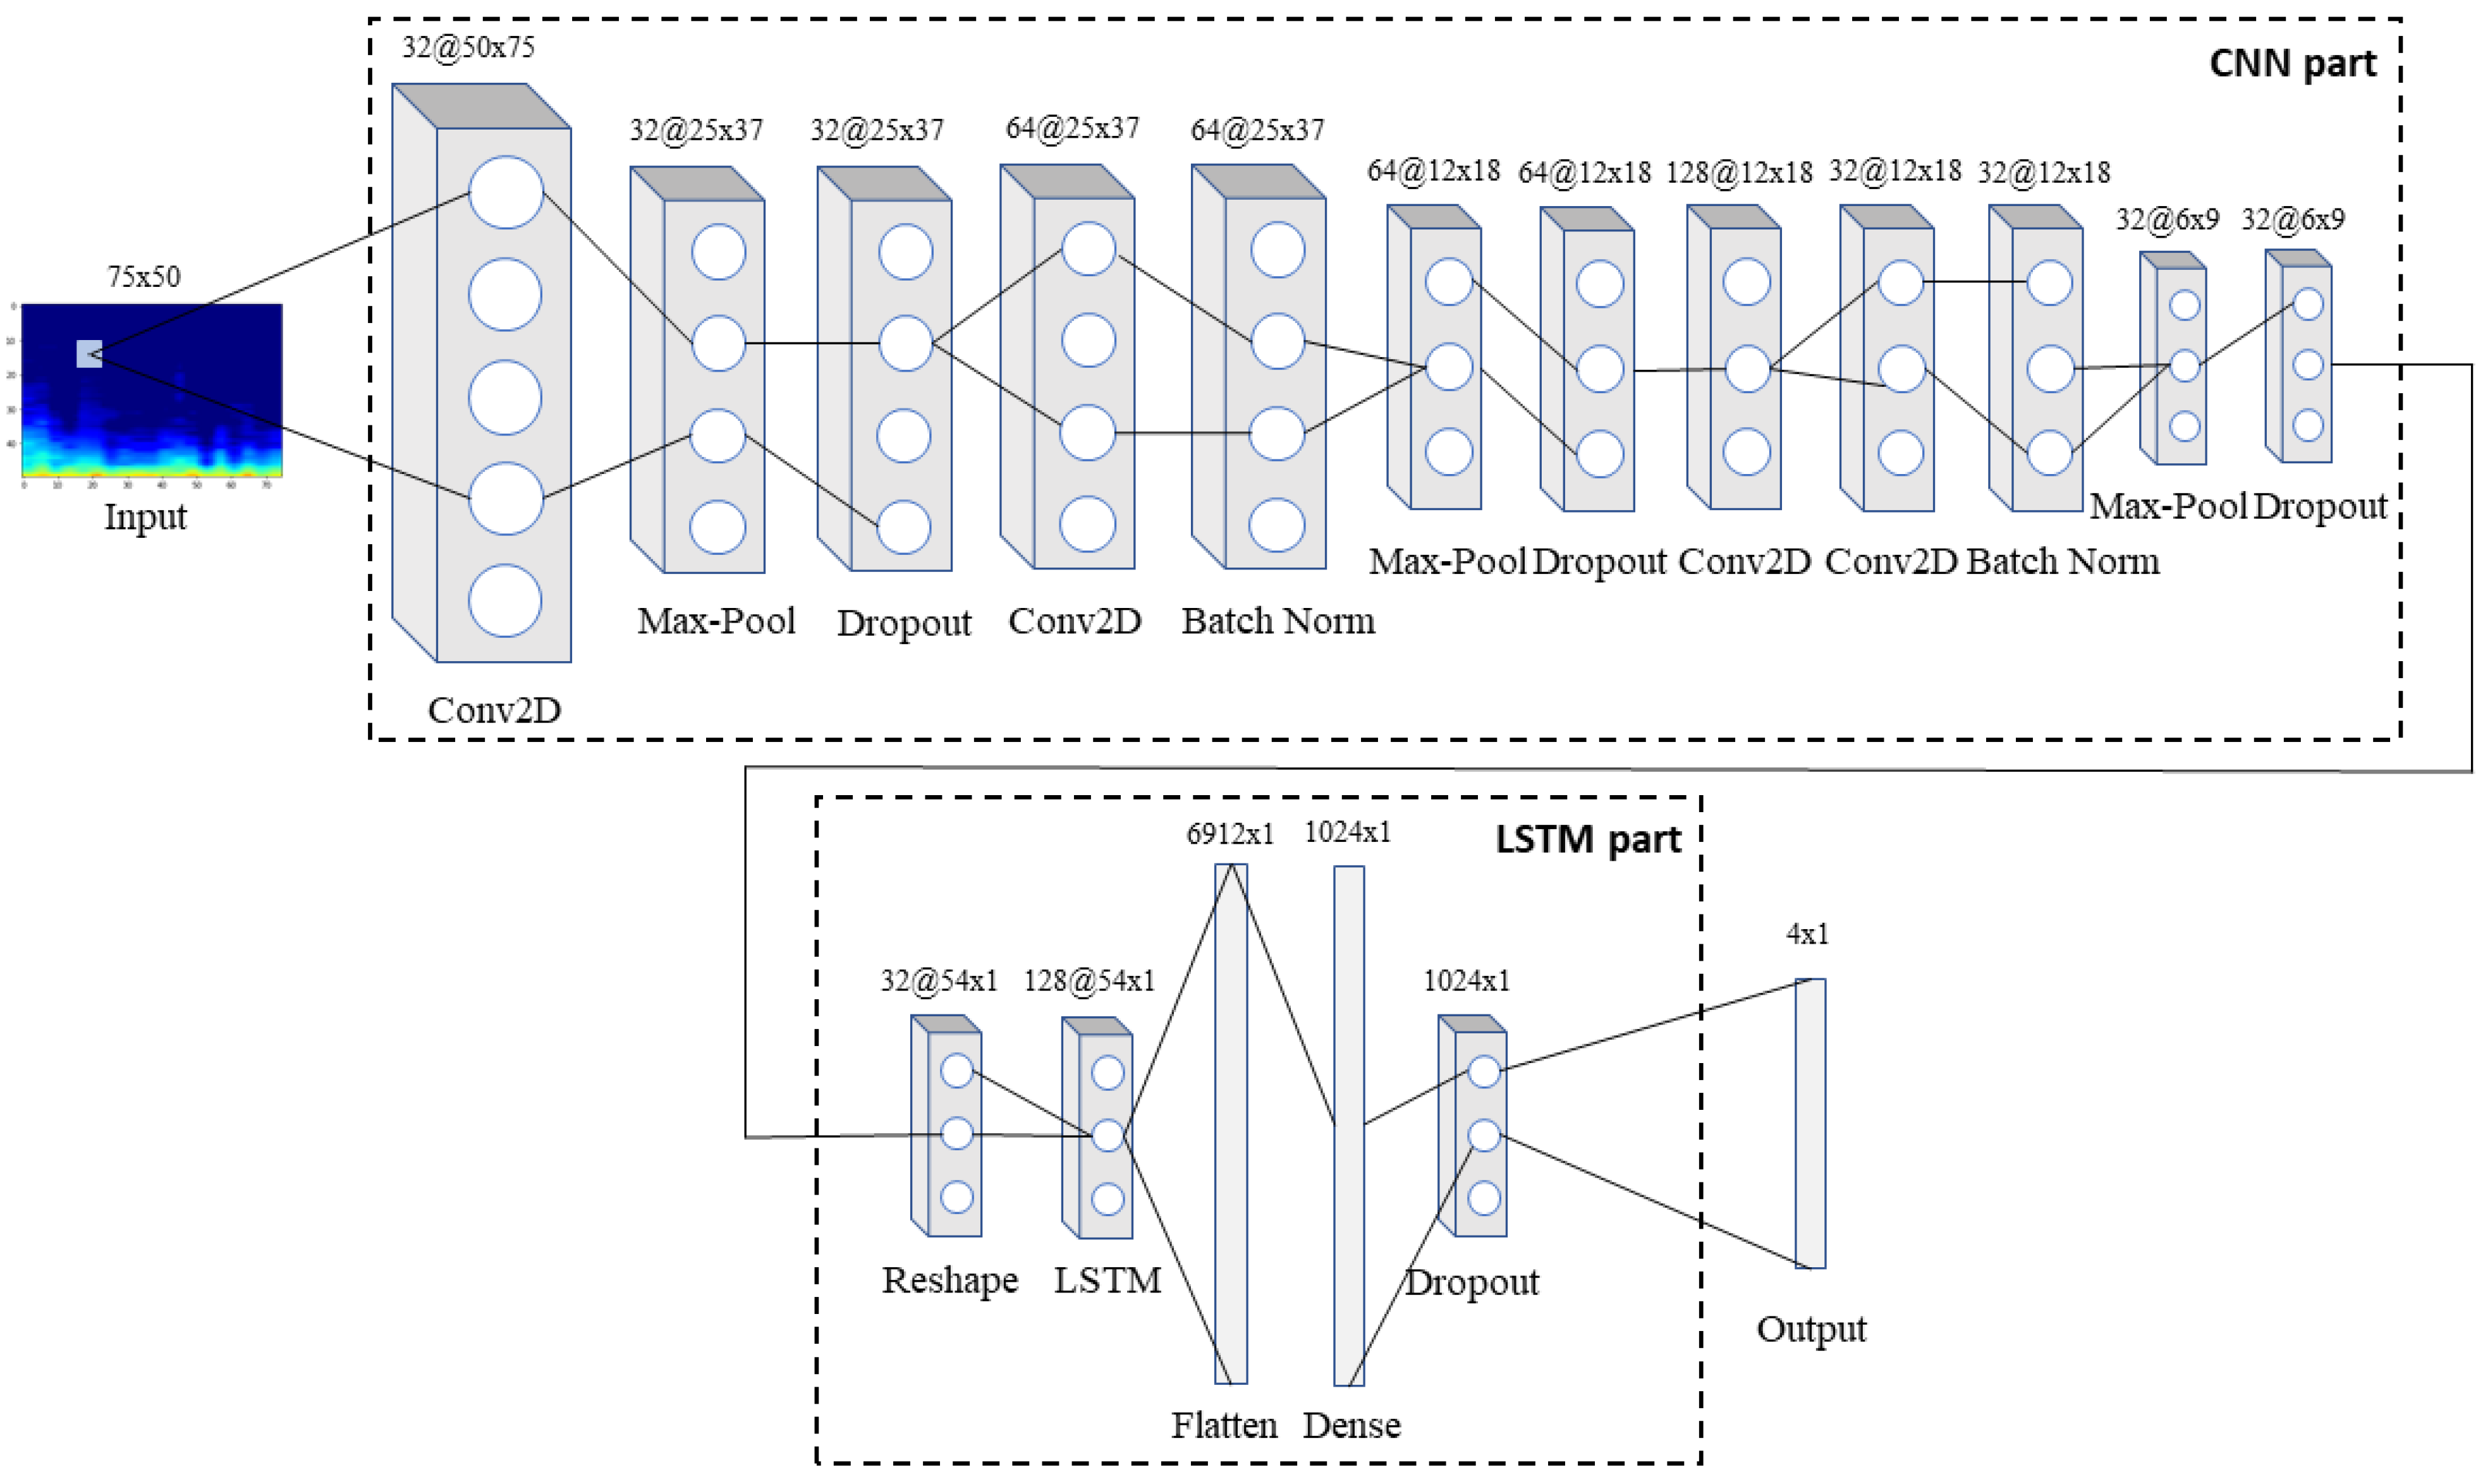
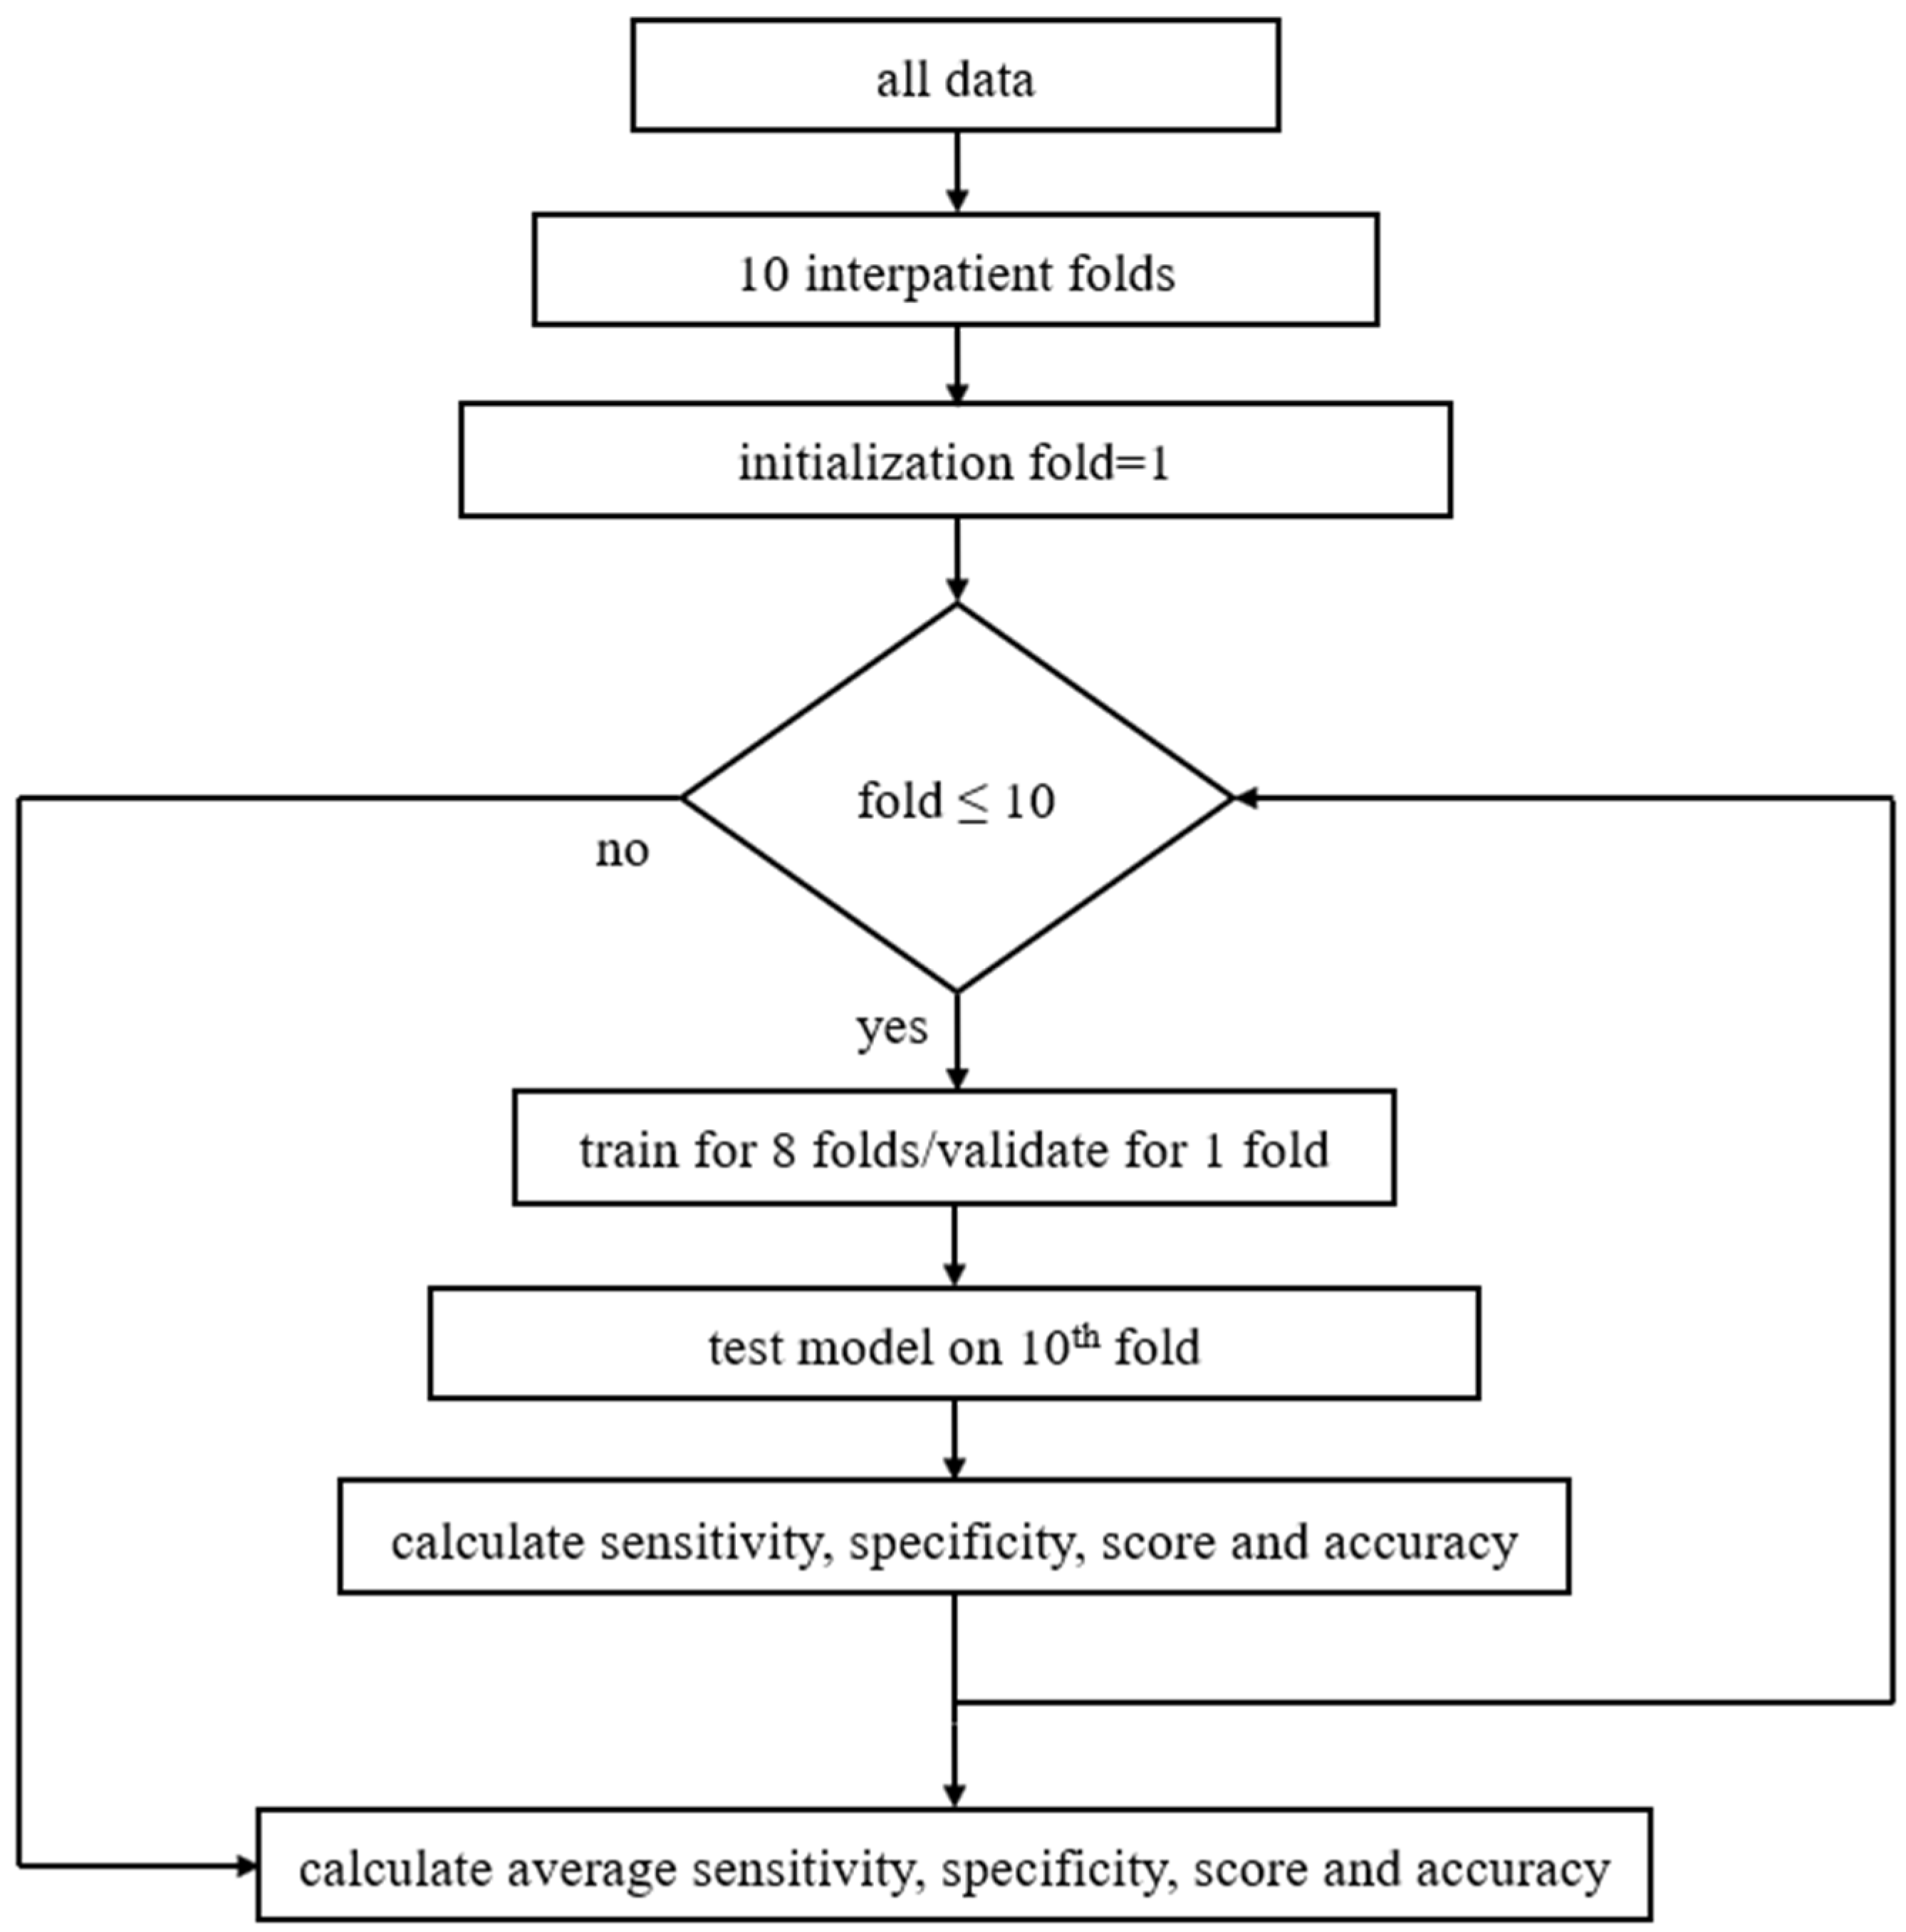
3.7. The Proposed Model
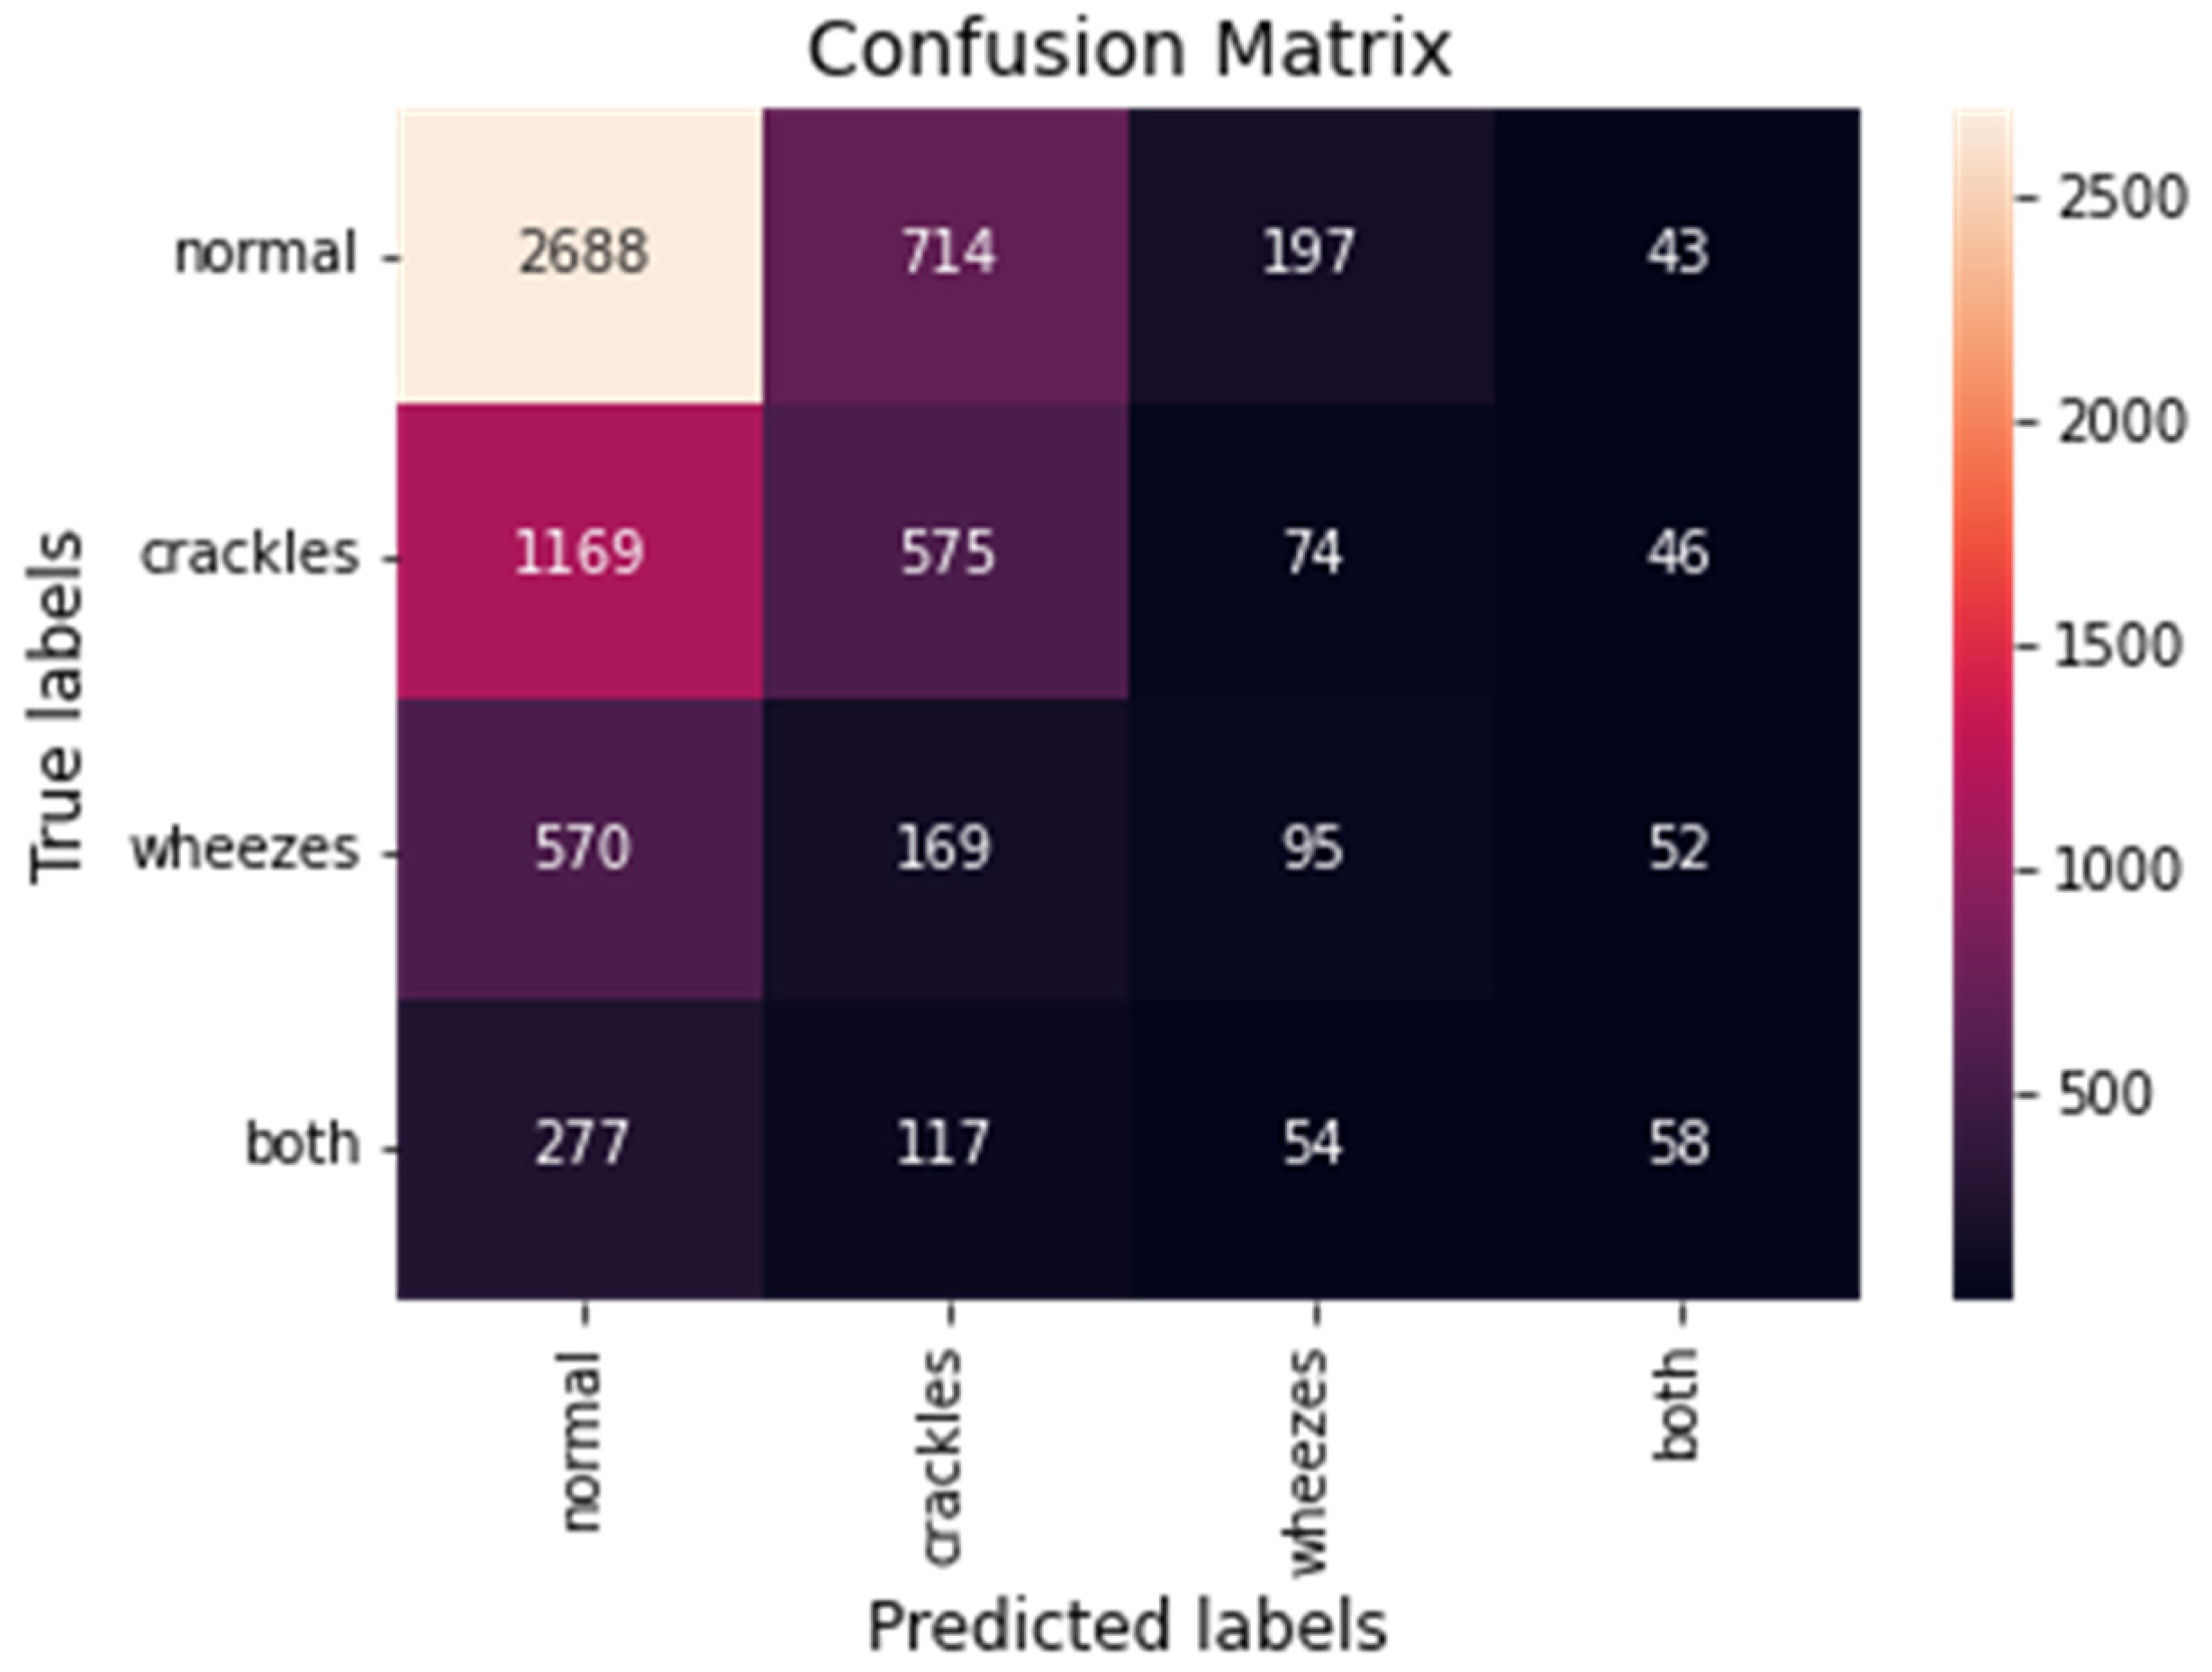
4. Results and Discussion
5. Conclusions
Author Contributions
Funding
Institutional Review Board Statement
Informed Consent Statement
Data Availability Statement
Conflicts of Interest
References
- Forum of International Respiratory Societies. The Global Impact of Respiratory Disease—Second Edition; European Respiratory Society: Sheffield, UK, 2017. [Google Scholar]
- World Health Statistics 2021: Monitoring Health for The Sdgs, Sustainable Development Goals; World Health Organization: Geneva, Switzerland, 2021.
- Rocha, B.M.; Pessoa, D.; Marques, A.; Carvalho, P.; Paiva, R.P. Automatic Classification of Adventitious Respiratory Sounds: A (Un)Solved Problem? Sensors 2020, 21, 57. [Google Scholar] [CrossRef] [PubMed]
- Padilla-Ortiz, A.L.; Ibarra, D.; Padilla, A. Lung and Heart Sounds Analysis: State-of-the-Art and Future Trends. Crit. Rev. Biomed. Eng. 2018, 46, 33–52. [Google Scholar] [CrossRef] [PubMed]
- Watt, J.; Borhani, R.; Katsaggelos, A.K. Machine Learning Refined: Foundations, Algorithms, and Applications, 2nd ed.; Cambridge University Press: Cambridge, UK, 2020. [Google Scholar] [CrossRef]
- Pramono, R.X.A.; Bowyer, S.; Rodriguez-Villegas, E. Automatic adventitious respiratory sound analysis: A systematic review. PLoS ONE 2017, 12, e0177926. [Google Scholar] [CrossRef] [PubMed] [Green Version]
- Rocha, B.M.; Filos, D.; Mendes, L.; Serbes, G.; Ulukaya, S.; Kahya, Y.P.; Jakovljevic, N.; Turukalo, T.L.; Vogiatzis, I.M.; Perantoni, E.; et al. An open access database for the evaluation of respiratory sound classification algorithms. Physiol. Meas. 2019, 40, 035001. [Google Scholar] [CrossRef] [PubMed]
- Mazić, I.; Bonković, M.; Džaja, B. Two-level coarse-to-fine classification algorithm for asthma wheezing recognition in children’s respiratory sounds. Biomed. Signal Process. Control 2015, 21, 105–118. [Google Scholar] [CrossRef]
- Matsutake, S.; Yamashita, M.; Matsunaga, S. Abnormal-respiration detection by considering correlation of observation of adventitious sounds. In Proceedings of the 23rd European Signal Processing Conference (EUSIPCO), Nice, France, 31 August–4 September 2015; pp. 634–638. [Google Scholar] [CrossRef]
- Sen, I.; Saraclar, M.; Kahya, Y.P. A Comparison of SVM and GMM-Based Classifier Configurations for Diagnostic Classification of Pulmonary Sounds. IEEE Trans. Biomed. Eng. 2015, 62, 1768–1776. [Google Scholar] [CrossRef] [PubMed]
- Mendes, L.; Vogiatzis, I.M.; Perantoni, E.; Kaimakamis, E.; Chouvarda, I.; Maglaveras, N.; Tsara, V.; Teixeira, C.; Carvalho, P.; Henriques, J.; et al. Detection of wheezes using their signature in the spectrogram space and musical features. In Proceedings of the 2015 37th Annual International Conference of the IEEE Engineering in Medicine and Biology Society (EMBC), Milan, Italy, 25–29 August 2015; pp. 5581–5584. [Google Scholar]
- Bokov, P.; Mahut, B.; Flaud, P.; Delclaux, C. Wheezing recognition algorithm using recordings of respiratory sounds at the mouth in a pediatric population. Comput. Biol. Med. 2016, 70, 40–50. [Google Scholar] [CrossRef] [PubMed]
- Chamberlain, D.; Kodgule, R.; Ganelin, D.; Miglani, V.; Fletcher, R.R. Application of semi-supervised deep learning to lung sound analysis. In Proceedings of the 2016 38th Annual International Conference of the IEEE Engineering in Medicine and Biology Society (EMBC), Orlando, FL, USA, 16–20 August 2016; pp. 804–807. [Google Scholar] [CrossRef]
- Sengupta, N.; Sahidullah, M.; Saha, G. Lung sound classification using cepstral-based statistical features. Comput. Biol. Med. 2016, 75, 118–129. [Google Scholar] [CrossRef] [PubMed]
- Serbes, G.; Ulukaya, S.; Kahya, Y.P. An Automated Lung Sound Preprocessing and Classification System Based OnSpectral Analysis Methods. In International Conference on Biomedical and Health Informatics; Springer: Singapore, 2017; pp. 45–49. [Google Scholar] [CrossRef]
- Jakovljević, N.; Lončar-Turukalo, T. Hidden Markov Model Based Respiratory Sound Classification. In Precision Medicine Powered by PHealth and Connected Health; Springer: Singapore, 2017; pp. 39–43. [Google Scholar] [CrossRef]
- Bardou, D.; Zhang, K.; Ahmad, S.M. Lung sounds classification using convolutional neural networks. Artif. Intell. Med. 2018, 88, 58–69. [Google Scholar] [CrossRef] [PubMed]
- Kochetov, K.; Putin, E.; Balashov, M.; Filchenkov, A.; Shalyto, A. Noise Masking Recurrent Neural Network for Respiratory Sound Classification. In Proceedings of the International Conference on Artificial Neural Networks 2018, Rhodes, Greece, 4–7 October 2018; pp. 208–217. [Google Scholar] [CrossRef]
- Chambres, G.; Hanna, P.; Desainte-Catherine, M. Automatic Detection of Patient with Respiratory Diseases Using Lung Sound Analysis. In Proceedings of the International Conference on Content-Based Multimedia Indexing (CBMI), La Rochelle, France, 4–6 September 2018. [Google Scholar] [CrossRef]
- Liu, R.; Cai, S.; Zhang, K.; Hu, N. Detection of Adventitious Respiratory Sounds based on Convolutional Neural Network. In Proceedings of the International Conference on Intelligent Informatics and Biomedical Sciences (ICIIBMS), Shanghai, China, 21–24 November 2019. [Google Scholar] [CrossRef]
- Minami, K.; Lu, H.; Kim, H.; Mabu, S.; Hirano, Y.; Kido, S. Automatic Classification of Large-Scale Respiratory Sound Dataset Based on Convolutional Neural Network. In Proceedings of the 2019 19th International Conference on Control, Automation and Systems (ICCAS), Jeju, Korea, 15–18 October 2019. [Google Scholar] [CrossRef]
- Ma, Y.; Xu, X.; Yu, Q.; Zhang, Y.; Li, Y.; Zhao, J.; Wang, G. LungBRN: A Smart Digital Stethoscope for Detecting Respiratory Disease Using bi-ResNet Deep Learning Algorithm. In Proceedings of the IEEE Biomedical Circuits and Systems Conference (BioCAS), Nara, Japan, 17–19 October 2019. [Google Scholar] [CrossRef]
- Demir, F.; Sengur, A.; Bajaj, V. Convolutional neural networks based efficient approach for classification of lung diseases. Health Inf. Sci. Syst. 2019, 8, 1–8. [Google Scholar] [CrossRef] [PubMed] [Green Version]
- Acharya, J.; Basu, A. Deep Neural Network for Respiratory Sound Classification in Wearable Devices Enabled by Patient Specific Model Tuning. IEEE Trans. Biomed. Circuits Syst. 2020, 14, 535–544. [Google Scholar] [CrossRef] [PubMed]
- Demir, F.; Ismael, A.M.; Sengur, A. Classification of Lung Sounds with CNN Model Using Parallel Pooling Structure. IEEE Access 2020, 8, 105376–105383. [Google Scholar] [CrossRef]
- Saraiva, A.; Santos, D.; Francisco, A.; Sousa, J.; Ferreira, N.; Soares, S.; Valente, A. Classification of Respiratory Sounds with Convolutional Neural Network. In Proceedings of the 13th International Joint Conference on Biomedical Engineering Systems and Technologies, Valletta, Malta, 24–26 February 2020. [Google Scholar] [CrossRef]
- Gairola, S.; Tom, F.; Kwatra, N.; Jain, M. Respirenet: A deep neural network for accurately detecting abnormal lung sounds in limited data setting. In Proceedings of the 2021 43rd Annual International Conference of the IEEE Engineering in Medicine & Biology Society (EMBC), Mexico City, Mexico, 1–5 November 2021; pp. 527–530. [Google Scholar]
- Ma, Y.; Xu, X.; Li, Y. LungRN+NL: An Improved Adventitious Lung Sound Classification Using Non-Local Block ResNet Neural Network with Mixup Data Augmentation. In Proceedings of the Interspeech 2020, Shanghai, China, 25–29 October 2020. [Google Scholar] [CrossRef]
- Yang, Z.; Liu, S.; Song, M.; Parada-Cabaleiro, E.; Schuller, B.W. Adventitious Respiratory Classification Using Attentive Residual Neural Networks. In Proceedings of the Interspeech 2020, Shanghai, China, 25–29 October 2020. [Google Scholar] [CrossRef]
- Pham, L.D.; Phan, H.; Palaniappan, R.; Mertins, A.; McLoughlin, I. CNN-MoE Based Framework for Classification of Respiratory Anomalies and Lung Disease Detection. IEEE J. Biomed. Health Inform. 2021, 25, 2938–2947. [Google Scholar] [CrossRef] [PubMed]
- Nguyen, T.; Pernkopf, F. Lung Sound Classification Using Co-tuning and Stochastic Normalization. arXiv 2021, arXiv:2108.01991. [Google Scholar]
- Nguyen, T.; Pernkopf, F. Lung Sound Classification Using Snapshot Ensemble of Convolutional Neural Networks. In Proceedings of the 42nd Annual International Conference of the IEEE Engineering in Medicine & Biology Society (EMBC), Montreal, QC, Canada, 20–24 July 2020. [Google Scholar] [CrossRef]
- Sejdić, E.; Djurović, I.; Jiang, J. Time–frequency feature representation using energy concentration: An overview of recent advances. Digit. Signal Process. 2009, 19, 153–183. [Google Scholar] [CrossRef]
- Vaillant, R.; Monrocq, C.; Le Cun, Y. Original approach for the localisation of objects in images. IEE Proc. Vision Image Signal Process. 1994, 141, 245–250. [Google Scholar] [CrossRef]
- Hochreiter, S.; Schmidhuber, J. Long short-term memory. Neural Comput. 1997, 9, 1735–1780. [Google Scholar] [CrossRef]
- Rumelhart, D.E.; Hinton, G.E.; Williams, R.J. Learning representations by back-propagating errors. Nature 1986, 323, 533–536. [Google Scholar] [CrossRef]
- Lin, T.-Y.; Goyal, P.; Girshick, R.; He, K.; Dollár, P. Focal Loss for Dense Object Detection. IEEE Trans. Pattern Anal. Mach. Intell. 2020, 42, 318–327. [Google Scholar] [CrossRef] [PubMed] [Green Version]
- Petmezas, G.; Haris, K.; Stefanopoulos, L.; Kilintzis, V.; Tzavelis, A.; A Rogers, J.; Katsaggelos, A.K.; Maglaveras, N. Automated Atrial Fibrillation Detection using a Hybrid CNN-LSTM Network on Imbalanced ECG Datasets. Biomed. Signal Process. Control 2020, 63, 102194. [Google Scholar] [CrossRef]


| No. of Convolutional Layers | Sensitivity | Specificity | Score | Accuracy |
|---|---|---|---|---|
| 2 | 44.96% | 81.65% | 63.31% | 72.48% |
| 3 | 47.92% | 82.64% | 65.28% | 73.96% |
| 4 | 52.78% | 84.26% | 68.52% | 76.39% |
| 5 | 45.34% | 81.78% | 63.56% | 72.67% |
| 6 | 51.17% | 83.72% | 67.45% | 75.58% |
| Dropout Rate | Sensitivity | Specificity | Score | Accuracy |
|---|---|---|---|---|
| 0 | 48.35% | 82.78% | 65.57% | 74.17% |
| 0.1 | 49.53% | 83.18% | 66.36% | 74.76% |
| 0.2 | 52.78% | 84.26% | 68.52% | 76.39% |
| 0.3 | 45.95% | 81.98% | 63.96% | 72.98% |
| 0.4 | 48.38% | 82.79% | 65.59% | 74.19% |
| 0.5 | 46.75% | 82.25% | 64.50% | 73.37% |
| Learning Rate | Sensitivity | Specificity | Score | Accuracy |
|---|---|---|---|---|
| 0.001 | 50.75% | 83.58% | 67.17% | 75.38% |
| 0.0001 | 52.78% | 84.26% | 68.52% | 76.39% |
| 0.00001 | 46.72% | 82.24% | 64.48% | 73.36% |
| Study | Splitting Strategy | Method | Performance | |||
|---|---|---|---|---|---|---|
| Sen | Spe | Score | Acc | |||
| Serbes et al. [15] | official 60/40 | SVM | - | - | - | 49.86% |
| Jakovljević and Lončar-Turukalo [16] | official 60/40 | HMM | - | - | 39.56% | - |
| Kochetov et al. [18] | interpatient 5-fold CV | RNN | 58.4% | 73% | 65.7% | - |
| Chambres et al. [19] | official 60/40 | HMM | 42.32% | 56.69% | 39.37% | 49.50% |
| SVM | 48.90% | 77.80% | 49.86% | 49.98% | ||
| Liu et al. [20] | random 75/25 | CNN | - | - | - | 81.62% |
| Minami et al. [21] | official 60/40 | CNN | 28% | 81% | 54% | - |
| Ma et al. [22] | official 60/40 | bi-ResNet | 31.12% | 69.20% | 50.16% | 52.79% |
| random 10-fold CV | 58.54% | 80.06% | 69.30% | 67.44% | ||
| Acharya and Basu [24] | interpatient 80/20 | CNN-RNN | 48.63% | 84.14% | 66.38% | - |
| Demir et al. [25] | 10-fold CV | VGG16 | - | - | - | 63.09% |
| SVM | - | - | - | 65.5% | ||
| Saraiva et al. [26] | random 70/30 | CNN | - | - | - | 74.3% |
| Gairola et al. [27] | official 60/40 | CNN | 40.1% | 72.3% | 56.2% | - |
| interpatient 80/20 | 53.7% | 83.3% | 68.5% | - | ||
| Ma et al. [28] | official 60/40 | ResNet + NL | 41.32% | 63.20% | 52.26% | - |
| interpatient 5-fold CV | 63.69% | 64.73% | 64.21% | - | ||
| Yang et al. [29] | official 60/40 | ResNet + SE + SA | 17.84% | 81.25% | 49.55% | - |
| Pham et al. [30] | official 60/40 | CNN-MoE | 26% | 68% | 47% | - |
| random 5-fold CV | 68% | 90% | 79% | - | ||
| Nguyen and Pernkopf [31] | official 60/40 | ResNet | 37.24% | 79.34% | 58.29% | - |
| This work | official 60/40 | CNN-LSTM with FL | 47.37% | 82.46% | 64.92% | 73.69% |
| Interpatient 10-fold CV | 52.78% | 84.26% | 68.52% | 76.39% | ||
| LOOCV | 60.29% | - | - | 74.57% | ||
Publisher’s Note: MDPI stays neutral with regard to jurisdictional claims in published maps and institutional affiliations. |
© 2022 by the authors. Licensee MDPI, Basel, Switzerland. This article is an open access article distributed under the terms and conditions of the Creative Commons Attribution (CC BY) license (https://creativecommons.org/licenses/by/4.0/).
Share and Cite
Petmezas, G.; Cheimariotis, G.-A.; Stefanopoulos, L.; Rocha, B.; Paiva, R.P.; Katsaggelos, A.K.; Maglaveras, N. Automated Lung Sound Classification Using a Hybrid CNN-LSTM Network and Focal Loss Function. Sensors 2022, 22, 1232. https://doi.org/10.3390/s22031232
Petmezas G, Cheimariotis G-A, Stefanopoulos L, Rocha B, Paiva RP, Katsaggelos AK, Maglaveras N. Automated Lung Sound Classification Using a Hybrid CNN-LSTM Network and Focal Loss Function. Sensors. 2022; 22(3):1232. https://doi.org/10.3390/s22031232
Chicago/Turabian StylePetmezas, Georgios, Grigorios-Aris Cheimariotis, Leandros Stefanopoulos, Bruno Rocha, Rui Pedro Paiva, Aggelos K. Katsaggelos, and Nicos Maglaveras. 2022. "Automated Lung Sound Classification Using a Hybrid CNN-LSTM Network and Focal Loss Function" Sensors 22, no. 3: 1232. https://doi.org/10.3390/s22031232
APA StylePetmezas, G., Cheimariotis, G.-A., Stefanopoulos, L., Rocha, B., Paiva, R. P., Katsaggelos, A. K., & Maglaveras, N. (2022). Automated Lung Sound Classification Using a Hybrid CNN-LSTM Network and Focal Loss Function. Sensors, 22(3), 1232. https://doi.org/10.3390/s22031232