
Electroencephalogram-Based Approaches for Driver Drowsiness Detection and Management: A Review


Abstract
:1. Introduction
- (1)
- Which is the most suitable EEG montage for DDD?
- (2)
- Which is the most suitable time window length for extracting EEG feature?
- (3)
- Which is the best EEG feature for DDD?
- (4)
- Which is the best decision-making (DM) model for DDD?
- (5)
- Which is the most reliable ground truth for DDD?
- (6)
- Which methods can be used to enhance the driver’s attention?
- (7)
- Which attention-enhancing methods has the longest duration?
- (1)
- Practical utility (addressed by questions (1, 6 and 7))
- (2)
- Early-detection of driver drowsiness (addressed by questions (2, 3 and 4))
- (3)
- Reliability (addressed by question (5))
2. Taxonomy
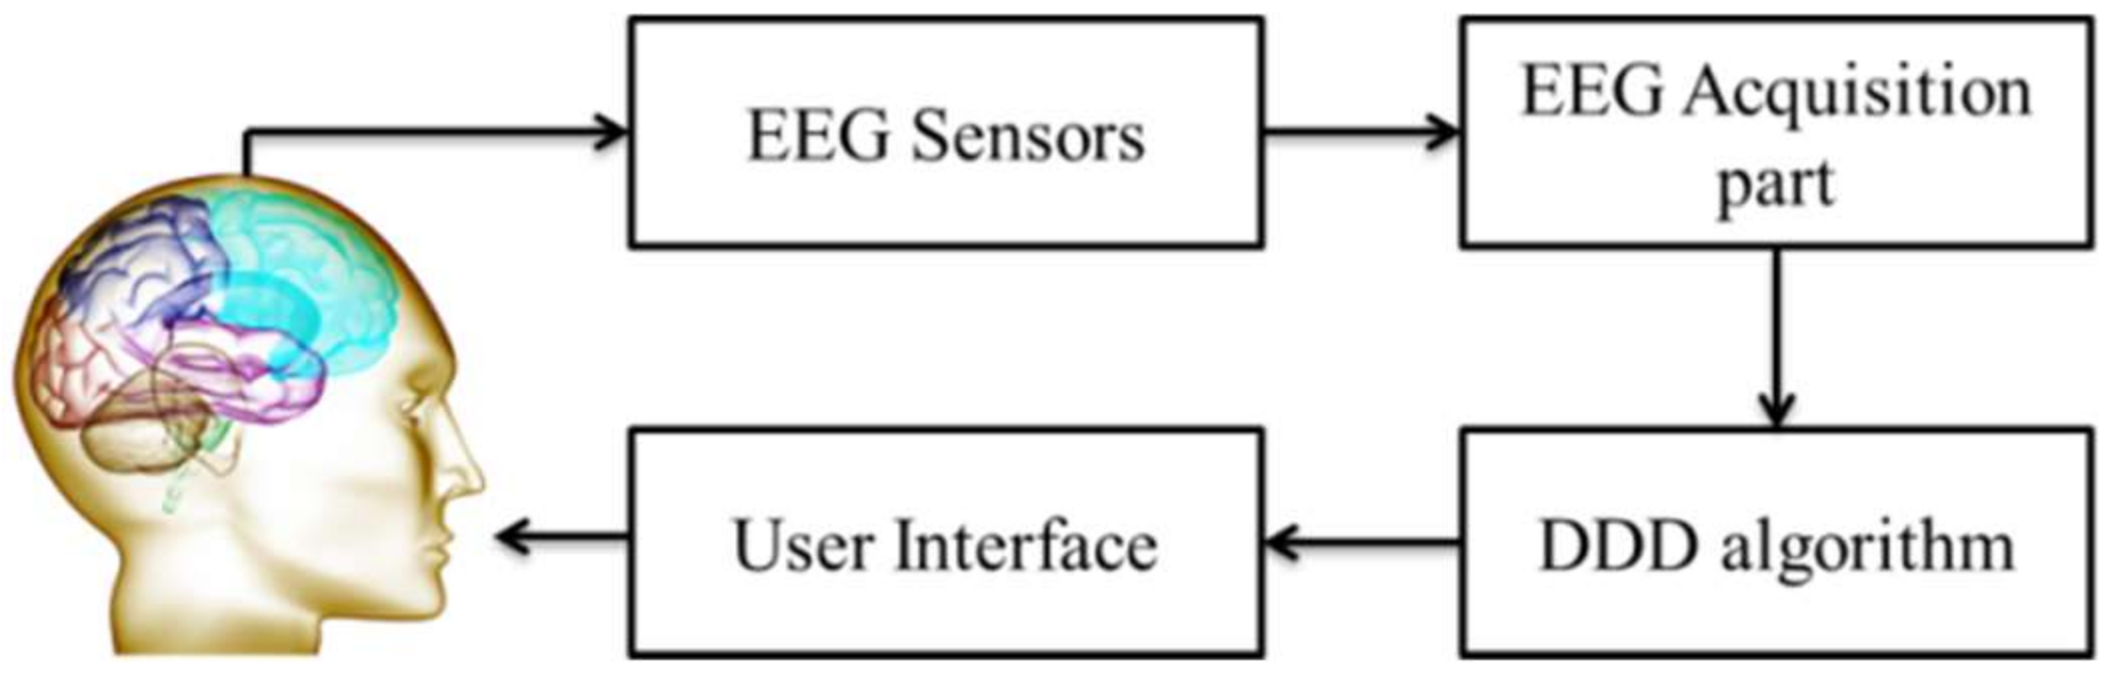
2.1. Data Sensing
2.2. Data Processing
2.3. Data-to-Knowledge
2.4. Methods to Enhance Attention
2.5. Duration of Enhanced Attention
3. Open-Loop Problems
3.1. Data Sensing
3.1.1. Number of EEG Channels
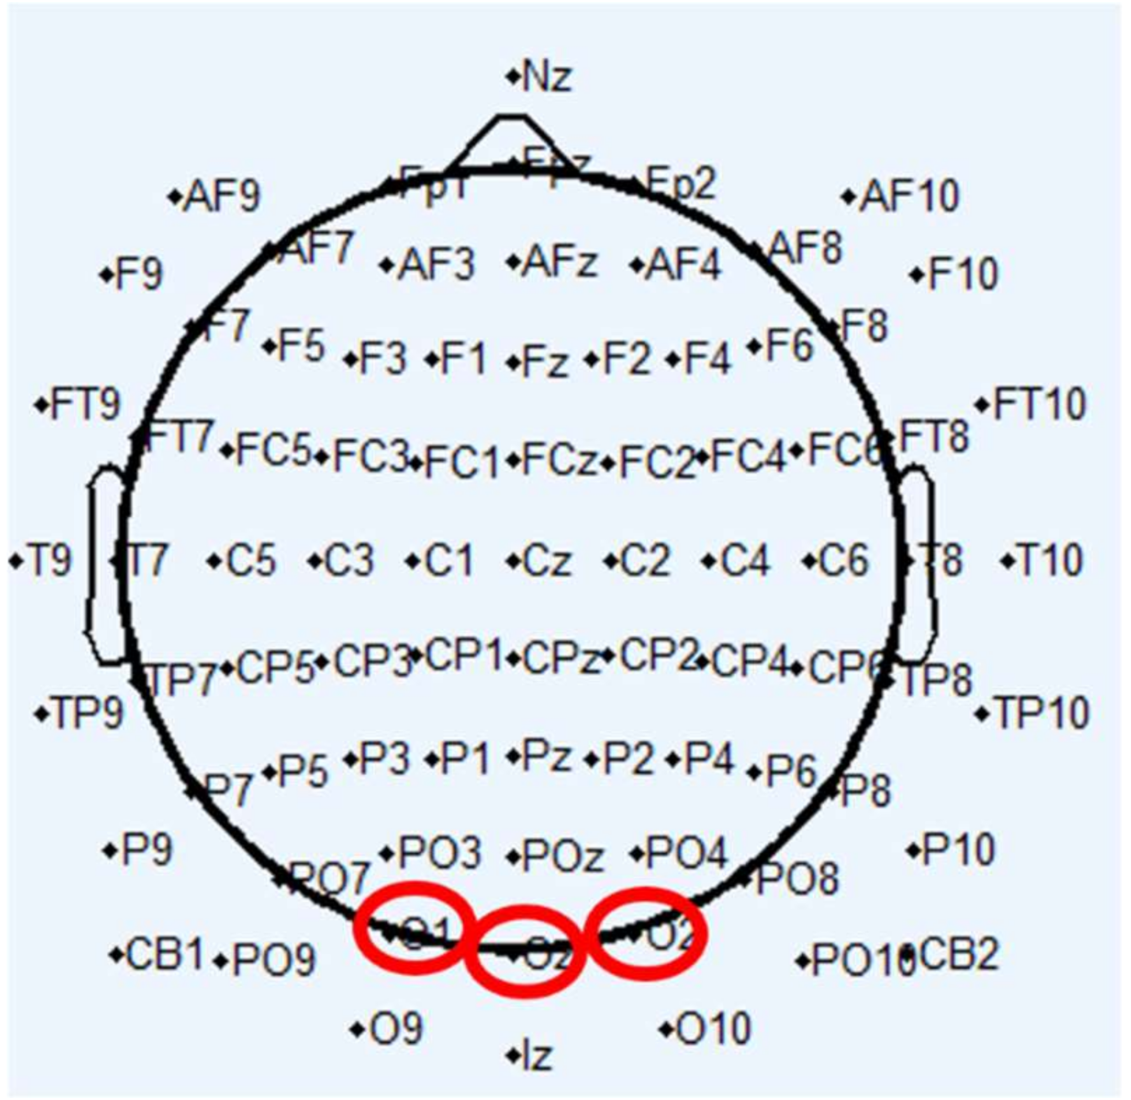
3.1.2. Location of EEG Channels
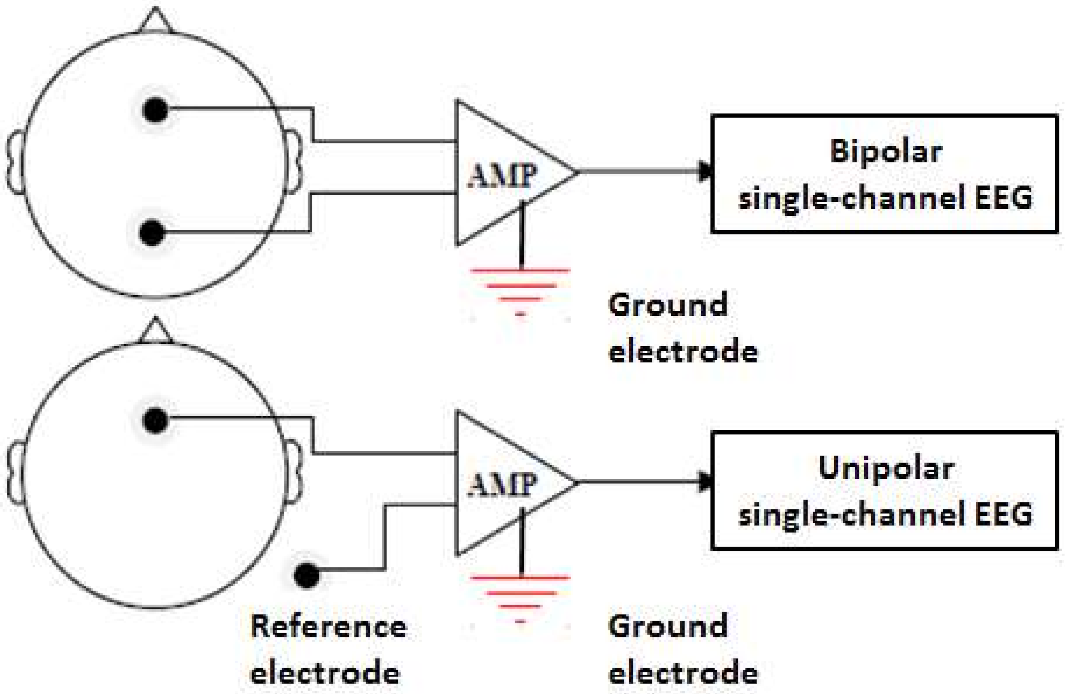
3.1.3. Type of EEG Channels
3.1.4. Discussion
3.2. Data Processing
3.2.1. Time Domain Features
Fractal Dimension (FD)
Other Time Domain Features
3.2.2. FFT-Based Features
Pure Band Power (PBP)
PBE
RBP
Single-Hz Band Power (SHBP) and LBP
FFT+
3.2.3. HOS-Based Features
3.2.4. Wavelet-Based Features
Band Power
Wavelet+
3.2.5. Other Time-Frequency-Based Features
3.2.6. Hybrid Features
3.2.7. Discussion
3.3. Data-To-Knowledge
3.3.1. Ground Truth
3.3.2. DM Models
Pure Threshold-Based Model
Binary Classification Model
Multi-Class Classification Model
Regression Model
Probabilistic Model
Transfer Model
3.3.3. Discussion
4. Closed-Loop Problems
4.1. Methods for Vigilance Enhancement
4.2. Duration of Enhanced Attention
4.3. Discussion
- (1)
- The inconvenience of using wet electrodes (usually saline-soaked sponge electrodes) on hairy regions;
- (2)
- The relatively longer stimulation time required before it takes effect (10–30 min).
5. Research Challenges
5.1. Open-Loop Algorithms
5.1.1. The Generalizability
5.1.2. The Early-Detection
5.1.3. The Practical Utility
5.2. Closed-Loop Algorithms
6. Conclusions
- (1)
- From the point of view of early detection of drivers’ drowsiness, advanced features, such as HOS (with 30-s time window) and PTFD (with 10-sec time window), are more robust than the traditional EEG frequency bands-based features. In addition, the continuous output-type DM models (e.g., probabilistic models and regression models) outperform the commonly used discrete output-type DM models (e.g., threshold, binary and multi-class classification models).
- (2)
- From the point of view of practical utility, the bipolar single channel in the occipital region is the most suitable EEG montage for DDD research. tDCS technology is most effective in boosting alertness. Its duration of enhanced attention is long-lasting, when compared to that of visual, vibrational and auditory feedback methods.
- (3)
- From the point of view of reliability, PERCLOS+ provides the most reliable ground truth for the development and verification of real-time DDD algorithms.
Author Contributions
Funding
Institutional Review Board Statement
Informed Consent Statement
Data Availability Statement
Conflicts of Interest
References
- Drowsy Driving-Publication Topic-CrashStats-NHTSA-DOT. Available online: https://crashstats.nhtsa.dot.gov/#!/PublicationList/47 (accessed on 16 November 2021).
- Drowsy Driving|NHTSA. Available online: https://www.nhtsa.gov/risky-driving/drowsy-driving (accessed on 16 November 2021).
- Cruise Launches Driverless Robotaxi Service in San Francisco|TechCrunch. Available online: https://techcrunch.com/2021/11/03/cruise-launches-driverless-robotaxi-service-for-employees-in-san-francisco/ (accessed on 13 January 2022).
- Press, A. Baidu Launches Driverless Taxi Service in Beijing. Available online: https://www.marketwatch.com/story/baidu-launches-driverless-taxi-service-in-beijing-01619996028 (accessed on 13 January 2022).
- Driverless-Car Global Market Seen Reaching $42 Billion by 2025. 2015. Available online: https://www.mercurynews.com/2015/01/08/driverless-car-global-market-seen-reaching-42-billion-by-2025/ (accessed on 27 January 2022).
- Diels, C.; Bos, J. User Interface Considerations to Prevent Self-Driving Carsickness; Association for Computing Machinery, Inc.: New York, NY, USA, 2015. [Google Scholar]
- Dobie, T.G. Motion Sickness. In Motion Sickness: A Motion Adaptation Syndrome; Dobie, T.G., Ed.; Springer Series on Naval Architecture, Marine Engineering, Shipbuilding and Shipping; Springer International Publishing: Cham, Switzerland, 2019; pp. 1–32. ISBN 978-3-319-97493-4. [Google Scholar]
- Swarnkar, V.; Abeyratne, U.; Hukins, C. Objective Measure of Sleepiness and Sleep Latency via Bispectrum Analysis of EEG. Med. Biol. Eng. Comput. 2010, 48, 1203–1213. [Google Scholar] [CrossRef] [PubMed]
- What Is BMW Active Driving Assistant? Available online: https://www.jdpower.com/cars/shopping-guides/what-is-bmw-active-driving-assistant (accessed on 16 November 2021).
- Ingre, M.; Akerstedt, T.; Peters, B.; Anund, A.; Kecklund, G. Subjective Sleepiness, Simulated Driving Performance and Blink Duration: Examining Individual Differences. J. Sleep Res. 2006, 15, 47–53. [Google Scholar] [CrossRef]
- Otmani, S.; Pebayle, T.; Roge, J.; Muzet, A. Effect of Driving Duration and Partial Sleep Deprivation on Subsequent Alertness and Performance of Car Drivers. Physiol. Behav. 2005, 84, 715–724. [Google Scholar] [CrossRef] [PubMed]
- Boyraz, P.; Hansen, J.H.L. Active Accident Avoidance Case Study: Integrating Drowsiness Monitoring System with Lateral Control and Speed Regulation in Passenger Vehicles. In Proceedings of the 2008 IEEE International Conference on Vehicular Electronics and Safety, Columbus, OH, USA, 22–24 September 2008; pp. 293–298. [Google Scholar]
- Thiffault, P.; Bergeron, J. Monotony of Road Environment and Driver Fatigue: A Simulator Study. Accid. Anal. Prev. 2003, 35, 381–391. [Google Scholar] [CrossRef]
- Dinges, D.; Grace, R. Perclos: A Valid Psychophysiological Measure of Alertness as Assessed by Psychomotor Vigilance; Federal Highway Administration: Washington, DC, USA, 1998. [Google Scholar]
- Wierwille, W.W.; Wreggit, S.S.; Kirn, C.L.; Ellsworth, L.A.; Fairbanks, R.J. Research on Vehicle-Based Driver Status/Performance Monitoring: Development, Validation, and Refinement of Algorithms for Detection of Driver Drowsiness. Final Report. 1994. Available online: https://rosap.ntl.bts.gov/view/dot/2578/dot_2578_DS1.pdf? (accessed on 27 January 2022).
- Hanowski, R.J.; Blanco, M.; Nakata, A.; Hickman, J.S.; Schaudt, W.A.; Fumero, M.C.; Olson, R.L.; Rebecca, L.; Greening, M.; Holbrook, G.T.; et al. The Drowsy Driver Warning System Field Operational Test: Data Collection Methods: Final Report. 2008. Available online: https://vtechworks.lib.vt.edu/handle/10919/55072 (accessed on 27 January 2022).
- Li, G.; Chung, W.-Y. Detection of Driver Drowsiness Using Wavelet Analysis of Heart Rate Variability and a Support Vector Machine Classifier. Sensors 2013, 13, 16494–16511. [Google Scholar] [CrossRef] [PubMed] [Green Version]
- Jung, S.-J.; Shin, H.-S.; Chung, W.-Y. Driver Fatigue and Drowsiness Monitoring System with Embedded Electrocardiogram Sensor on Steering Wheel. IET Intell. Transp. Syst. 2014, 8, 43–50. [Google Scholar] [CrossRef]
- Papadelis, C.; Kourtidou-Papadeli, C.; Bamidis, P.D.; Chouvarda, I.; Koufogiannis, D.; Bekiaris, E.; Maglaveras, N. Indicators of Sleepiness in an Ambulatory EEG Study of Night Driving. In Proceedings of the 2006 International Conference of the IEEE Engineering in Medicine and Biology Society, New York, NY, USA, 30 August–3 September 2006; pp. 6201–6204. [Google Scholar]
- Williamson, A.; Chamberlain, T. Review of On-Road Driver Fatigue Monitoring Devices. 2005. Available online: http://dmiftp.uqtr.ca/Public/FMeunier/iar6002/ProjetEEG/Review_of_on-road_driver_fatigue_monitoring_devices-2.pdf (accessed on 27 January 2022).
- Golz, M.; Sommer, D.; Trutschel, U.; Sirois, B.; Edwards, D. Evaluierung von Geräten Zur Müdigkeitsüberwachung. Somnologie 2010, 14, 187–199. [Google Scholar] [CrossRef]
- Sahayadhas, A.; Sundaraj, K.; Murugappan, M. Detecting Driver Drowsiness Based on Sensors: A Review. Sensors 2012, 12, 16937–16953. [Google Scholar] [CrossRef] [Green Version]
- Brown, T.; Lee, J.; Schwarz, C.; Fiorentino, D.; McDonald, A. Assessing the Feasibility of Vehicle-Based Sensors to Detect Drowsy Driving. 2014. Available online: https://www.nhtsa.gov/sites/nhtsa.gov/files/811886-assess_veh-based_sensors_4_drowsy-driving_detection.pdf (accessed on 27 January 2022).
- Khushaba, R.N.; Kodagoda, S.; Lal, S.; Dissanayake, G. Driver Drowsiness Classification Using Fuzzy Wavelet-Packet-Based Feature-Extraction Algorithm. IEEE Trans. Biomed. Eng. 2011, 58, 121–131. [Google Scholar] [CrossRef] [Green Version]
- Chi, Y.M.; Jung, T.-P.; Cauwenberghs, G. Dry-Contact and Noncontact Biopotential Electrodes: Methodological Review. IEEE Rev. Biomed. Eng. 2010, 3, 106–119. [Google Scholar] [CrossRef] [Green Version]
- Lopez-Gordo, M.A.; Sanchez-Morillo, D.; Valle, F.P. Dry EEG Electrodes. Sensors 2014, 14, 12847–12870. [Google Scholar] [CrossRef] [PubMed]
- Lee, S.; Shin, Y.; Woo, S.; Lee, K.K.; Lee, H.-N. Review of Wireless Brain-Computer Interface Systems; IntechOpen: London, UK, 2013; ISBN 978-953-51-1134-4. [Google Scholar]
- Koutroumbas, K.; Theodoridis, S. Pattern Recognition, 4th ed.; Elsevier: Amsterdam, The Netherlands, 2008; Available online: https://www.elsevier.com/books/pattern-recognition/koutroumbas/978-1-59749-272-0 (accessed on 16 November 2021).
- Iber, C.; Ancoli-Israel, S.; Chesson, A.L.; Quan, S. The AASM Manual for the Scoring of Sleep and Associated Events: Rules, Terminology and Technical Specifications; American Academy of Sleep Medicine: Westchest, IL, USA, 2007. [Google Scholar]
- Delorme, A.; Makeig, S. EEGLAB: An Open Source Toolbox for Analysis of Single-Trial EEG Dynamics Including Independent Component Analysis. J. Neurosci Methods 2004, 134, 9–21. [Google Scholar] [CrossRef] [PubMed] [Green Version]
- Lin, C.-T.; Wu, R.-C.; Liang, S.-F.; Chao, W.-H.; Chen, Y.-J.; Jung, T.-P. EEG-Based Drowsiness Estimation for Safety Driving Using Independent Component Analysis. IEEE Trans. Circuits Syst. I Regul. Pap. 2005, 52, 2726–2738. [Google Scholar] [CrossRef] [Green Version]
- Lin, C.-T.; Chuang, C.-H.; Wang, Y.-K.; Tsai, S.-F.; Chiu, T.-C.; Ko, L.-W. Neurocognitive Characteristics of the Driver: A Review on Drowsiness, Distraction, Navigation, and Motion Sickness. J. Neurosci. Neuroeng. 2012, 1, 61–81. [Google Scholar] [CrossRef]
- Wierwille, W.W.; Ellsworth, L.A. Evaluation of Driver Drowsiness by Trained Raters. Accid. Anal. Prev. 1994, 26, 571–581. [Google Scholar] [CrossRef]
- Li, G.; Chung, W.-Y. Estimation of Eye Closure Degree Using EEG Sensors and Its Application in Driver Drowsiness Detection. Sensors 2014, 14, 17491–17515. [Google Scholar] [CrossRef] [Green Version]
- King, L.M.; Nguyen, H.T.; Lal, S.K.L. Early Driver Fatigue Detection from Electroencephalography Signals Using Artificial Neural Networks. In Proceedings of the Annual International Conference of the IEEE Engineering in Medicine and Biology Society (EMBC), New York, NY, USA, 30 August–3 September 2006; pp. 2187–2190. [Google Scholar] [CrossRef]
- Reddy, B.S.; Basir, O.A.; Leat, S.J. Estimation of Driver Attention Using Visually Evoked Potentials. In Proceedings of the 2007 IEEE Intelligent Vehicles Symposium, Istanbul, Turkey, 13–15 June 2007; pp. 588–593. [Google Scholar]
- Yoshida, H.; Kuramoto, H.; Sunada, Y.; Kikkawa, S. EEG Analysis in Wakefulness Maintenance State against Sleepiness by Instantaneous Equivalent Bandwidths. In Proceedings of the 29th Annual International Conference of the IEEE Engineering in Medicine and Biology Society, Lyon, France, 23–26 August 2007; pp. 19–22. [Google Scholar] [CrossRef]
- Lin, C.-T.; Chen, Y.-C.; Huang, T.-Y.; Chiu, T.-T.; Ko, L.-W.; Liang, S.-F.; Hsieh, H.-Y.; Hsu, S.-H.; Duann, J.-R. Development of Wireless Brain Computer Interface With Embedded Multitask Scheduling and Its Application on Real-Time Driver’s Drowsiness Detection and Warning. IEEE Trans. Biomed. Eng. 2008, 55, 1582–1591. [Google Scholar] [CrossRef]
- Michail, E.; Kokonozi, A.; Chouvarda, I.; Maglaveras, N. EEG and HRV Markers of Sleepiness and Loss of Control during Car Driving. In Proceedings of the 30th Annual International Conference of the IEEE Engineering in Medicine and Biology Society, Vancouver, Canada, 21–24 August 2008; pp. 2566–2569. [Google Scholar] [CrossRef]
- Akin, M.; Kurt, M.B.; Sezgin, N.; Bayram, M. Estimating Vigilance Level by Using EEG and EMG Signals. Neural Comput. Appl. 2008, 17, 227–236. [Google Scholar] [CrossRef]
- Ridwan, S.D.; Thompson, R.; Jap, B.T.; Lal, S.; Fischer, P. Single Channel Wireless EEG: Proposed Application in Train Drivers. In Proceedings of the 2008 Third International Conference on Broadband Communications, Information Technology Biomedical Applications, Pretoria, South Africa, 23–26 November 2008; pp. 58–63. [Google Scholar]
- Tsai, P.-Y.; Hu, W.; Kuo, T.B.J.; Shyu, L.-Y. A Portable Device for Real Time Drowsiness Detection Using Novel Active Dry Electrode System. In Proceedings of the 2009 Annual International Conference of the IEEE Engineering in Medicine and Biology Society, Minneapolis, Minnesota, 3–6 September 2009; pp. 3775–3778. [Google Scholar]
- Lin, C.-T.; Chang, C.-J.; Lin, B.-S.; Hung, S.-H.; Chao, C.-F.; Wang, I.-J. A Real-Time Wireless Brain–Computer Interface System for Drowsiness Detection. IEEE Trans. Biomed. Circuits Syst. 2010, 4, 214–222. [Google Scholar] [CrossRef]
- Cao, L.; Li, J.; Sun, Y.; Zhu, H.; Yan, C. EEG-Based Vigilance Analysis by Using Fisher Score and PCA Algorithm. In Proceedings of the 2010 IEEE International Conference on Progress in Informatics and Computing, Shanghai, China, 10–12 December 2010; Volume 1, pp. 175–179. [Google Scholar]
- Gupta, S.; Kar, S.; Gupta, S.; Routray, A. Fatigue in Human Drivers: A Study Using Ocular, Psychometric, Physiological Signals. In Proceedings of the 2010 IEEE Students Technology Symposium (TechSym), Kharagpur, India, 3–4 April 2010; pp. 234–240. [Google Scholar]
- Garces Correa, A.; Laciar Leber, E. An Automatic Detector of Drowsiness Based on Spectral Analysis and Wavelet Decomposition of EEG Records. In Proceedings of the 32nd Annual International Conference of the IEEE Engineering in Medicine and Biology Society, Buenos Aires, Argentina, 1–4 September 2010; pp. 1405–1408. [Google Scholar] [CrossRef]
- Tantisatirapong, S.; Senavongse, W.; Phothisonothai, M. Fractal Dimension Based Electroencephalogram Analysis of Drowsiness Patterns. In Proceedings of the 2010 ECTI International Confernce on Electrical Engineering/Electronics, Computer, Telecommunications and Information Technology, Chiang Mai, Thailand, 19–21 May 2010. [Google Scholar]
- Li, M.; Zhang, C.; Yang, J.-F. An EEG-Based Method for Detecting Drowsy Driving State. In Proceedings of the 2010 Seventh International Conference on Fuzzy Systems and Knowledge Discovery, Yantai, China, 10–12 August 2010; Volume 5, pp. 2164–2167. [Google Scholar]
- Park, J.; Xu, L.; Sridhar, V.; Chi, M.; Cauwenberghs, G. Wireless Dry EEG for Drowsiness Detection. In Proceedings of the 33rd Annual International Conference of the IEEE Engineering in Medicine and Biology Society, Boston, MA, USA, 30 August–3 September 2011; pp. 3298–3301. [Google Scholar] [CrossRef] [Green Version]
- Pritchett, S.; Zilberg, E.; Xu, Z.M.; Karrar, M.; Lal, S.; Burton, D. Strengthening Association between Driver Drowsiness and Its Physiological Predictors by Combining EEG with Measures of Body Movement. In Proceedings of the 7th International Conference on Broadband Communications and Biomedical Applications, Melbourne, VIC, Australia, 21–24 November 2011; pp. 103–107. [Google Scholar]
- Jap, B.T.; Lal, S.; Fischer, P. Comparing Combinations of EEG Activity in Train Drivers during Monotonous Driving. Expert Syst. Appl. 2011, 38, 996–1003. [Google Scholar] [CrossRef]
- Punsawad, Y.; Aempedchr, S.; Wongsawat, Y.; Panichkun, M. Weighted-Frequency Index for Eeg-Based Mental Fatigue Alarm System. Available online: https://www.semanticscholar.org/paper/WEIGHTED-FREQUENCY-INDEX-FOR-EEG-BASED-MENTAL-ALARM-Punsawad-Aempedchr/7936d30738b8cd08173ed5bb835311793f7b8cdf (accessed on 16 November 2021).
- Simon, M.; Schmidt, E.A.; Kincses, W.E.; Fritzsche, M.; Bruns, A.; Aufmuth, C.; Bogdan, M.; Rosenstiel, W.; Schrauf, M. EEG Alpha Spindle Measures as Indicators of Driver Fatigue under Real Traffic Conditions. Clin. Neurophysiol. 2011, 122, 1168–1178. [Google Scholar] [CrossRef] [PubMed]
- Pritchett, S.; Zilberg, E.; Xu, Z.M.; Karrar, M.; Burton, D.; Lal, S. Comparing Accuracy of Two Algorithms for Detecting Driver Drowsiness—Single Source (EEG) and Hybrid (EEG and Body Movement). In Proceedings of the 7th International Conference on Broadband Communications and Biomedical Applications, Melbourne, VIC, Australia, 21–24 November 2011; pp. 179–184. [Google Scholar]
- Ashtiani, S.N.M.; Mardi, Z.; Mikaili, M. Spectral Characteristics Assessment in Recognition of Drivers’ Drowsiness Using Statistical Tests. In Proceedings of the 18th Iranian Conference of Biomedical Engineering (ICBME), Tehran, Iran, 14–16 December 2011. [Google Scholar] [CrossRef]
- Murata, A.; Ohkubo, Y.; Moriwaka, M.; Hayami, T. Prediction of Drowsiness Using Multivariate Analysis of Biological Information and Driving Performance. In Proceedings of the SICE Annual Conference 2011, Tokyo, Japan, 13–18 September 2011; pp. 52–57. [Google Scholar]
- Murata, A.; Matsuda, Y.; Moriwaka, M.; Hayami, T. An Attempt to Predict Drowsiness by Bayesian Estimation. In Proceedings of the SICE Annual Conference 2011, Tokyo, Japan, 13–18 September 2011; pp. 58–63. [Google Scholar]
- Chae, M.S. Portable, Wireless Drowsiness-Detection System. In Proceedings of the 2012 IEEE 55th International Midwest Symposium on Circuits and Systems (MWSCAS), Boise, ID, USA, 5–8 August 2012; pp. 762–765. [Google Scholar]
- Kim, D.; Han, H.; Cho, S.; Chong, U. Detection of Drowsiness with Eyes Open Using EEG-Based Power Spectrum Analysis. In Proceedings of the 2012 7th International Forum on Strategic Technology (IFOST), Tomsk, Russia, 18–21 September 2012; pp. 1–4. [Google Scholar]
- Yoshida, H.; Tanaka, Y.; Kikkawa, S. EEG Analysis of Frontal Lobe Area in Arousal Maintenance State against Sleepiness. In Proceedings of the 2012 Annual International Conference of the IEEE Engineering in Medicine and Biology Society, San Diego, CA, USA, 28 August–1 September 2012; pp. 2933–2936. [Google Scholar] [CrossRef]
- Picot, A.; Charbonnier, S.; Caplier, A. On-Line Detection of Drowsiness Using Brain and Visual Information. IEEE Trans. Syst. Man Cybern.-Part A Syst. Hum. 2012, 42, 764–775. [Google Scholar] [CrossRef]
- Lin, F.-C.; Ko, L.-W.; Chuang, C.-H.; Su, T.-P.; Lin, C.-T. Generalized EEG-Based Drowsiness Prediction System by Using a Self-Organizing Neural Fuzzy System. IEEE Trans. Circuits Syst. I Regul. Pap. 2012, 59, 2044–2055. [Google Scholar] [CrossRef]
- Kalauzi, A.; Vuckovic, A.; Bojić, T. EEG Alpha Phase Shifts during Transition from Wakefulness to Drowsiness. Int. J. Psychophysiol. 2012, 86, 195–205. [Google Scholar] [CrossRef]
- Daphne, R.; Raj, A. A Drowsiness Detection Architecture Using Feature Extraction Methodology. Procedia Eng. 2012, 38, 959–963. [Google Scholar] [CrossRef] [Green Version]
- Sugi, T.; Nagamine, T.; Nakamura, M.; Ikeda, A.; Shibasaki, H. Development of Real-Time Evaluation System for Qualitative Improvement of Awake EEG Records. In Proceedings of the 2012 ICME International Conference on Complex Medical Engineering (CME), Kobe, Japan, 1–4 July 2012. [Google Scholar] [CrossRef]
- Zhang, A.; Chen, Y. EEG Feature Extraction and Analysis under Drowsy State Based on Energy and Sample Entropy. In Proceedings of the 2012 5th International Conference on BioMedical Engineering and Informatics, Chongqing, China, 16–18 October 2012; pp. 501–505. [Google Scholar]
- Wang, Y.-T.; Cheng, C.-K.; Huang, K.-C.; Lin, C.-T.; Wang, Y.; Jung, T.-P. Cell-Phone Based Drowsiness Monitoring and Management System. In Proceedings of the 2012 IEEE Biomedical Circuits and Systems Conference (BioCAS), Hsinchu, Taiwan, 28–30 November 2012; pp. 200–203. [Google Scholar]
- Arnin, J.; Anopas, D.; Horapong, M.; Triponyuwasi, P.; Yamsa-ard, T.; Iampetch, S.; Wongsawat, Y. Wireless-Based Portable EEG-EOG Monitoring for Real Time Drowsiness Detection. In Proceedings of the 2013 35th Annual International Conference of the IEEE Engineering in Medicine and Biology Society (EMBC), Osaka, Japan, 3–7 July 2013; pp. 4977–4980. [Google Scholar]
- Hu, S.; Zheng, G.; Peters, B. Driver Fatigue Detection from Electroencephalogram Spectrum after Electrooculography Artefact Removal. IET Intell. Transp. Syst. 2013, 7, 105–113. [Google Scholar] [CrossRef]
- Khushaba, R.; Kodagoda, S.; Lal, S.; Dissanayake, G. Uncorrelated Fuzzy Neighborhood Preserving Analysis Based Feature Projection for Driver Drowsiness Recognition. Fuzzy Sets Syst. 2013, 221, 90–111. [Google Scholar] [CrossRef]
- Putilov, A.A.; Donskaya, O.G. Construction and Validation of the EEG Analogues of the Karolinska Sleepiness Scale Based on the Karolinska Drowsiness Test. Clin. Neurophysiol. 2013, 124, 1346–1352. [Google Scholar] [CrossRef]
- Yu, S.; Li, P.; Lin, H.; Rohani, E.; Choi, G.; Shao, B.; Wang, Q. Support Vector Machine Based Detection of Drowsiness Using Minimum EEG Features. In Proceedings of the 2013 International Conference on Social Computing, Alexandria, VA, USA, 8–14 September 2013; pp. 827–835. [Google Scholar]
- Murugappan, M.; Wali, M.K.; Ahmmad, R.B.; Murugappan, S. Subtractive Fuzzy Classifier Based Driver Drowsiness Levels Classification Using EEG. In Proceedings of the 2013 International Conference on Communication and Signal Processing, Melmaruvathur, India, 3–5 April 2013; pp. 159–164. [Google Scholar]
- Kulkarni, S.; Bs, S.; Malthish, K.; Meenakshi, M. Development of Microcontroller Based Ambulatory Instrument to Detect Drowsiness. In Proceedings of the 2013 ISSNIP Biosignals and Biorobotics Conference: Biosignals and Robotics for Better and Safer Living (BRC), Rio de Janeiro, Brazil, 18–20 February 2013; pp. 1–4. [Google Scholar]
- Aboalayon, K.A.I.; Ocbagabir, H.T.; Faezipour, M. Efficient Sleep Stage Classification Based on EEG Signals. In Proceedings of the IEEE Long Island Systems, Applications and Technology (LISAT) Conference 2014, Farmingdale, NY, USA, 2 May 2014; pp. 1–6. [Google Scholar]
- Li, G. A Low-Cost Driver Drowsiness Detection System Based on EEG Sensor and Smartphone. In Proceedings of the Korean Institute of Signal Processing and Systems Summer Conference 2014, Busan, Korea, 23–25 April 2014. [Google Scholar]
- Lin, C.-T.; Chuang, C.-H.; Huang, C.-S.; Tsai, S.-F.; Lu, S.-W.; Chen, Y.-H.; Ko, L.-W. Wireless and Wearable EEG System for Evaluating Driver Vigilance. IEEE Trans. Biomed. Circuits Syst. 2014, 8, 165–176. [Google Scholar] [CrossRef]
- Maglione, A.; Borghini, G.; Aricò, P.; Borgia, F.; Graziani, I.; Colosimo, A.; Kong, W.; Vecchiato, G.; Babiloni, F. Evaluation of the Workload and Drowsiness during Car Driving by Using High Resolution EEG Activity and Neurophysiologic Indices. In Proceedings of the 36th Annual International Conference of the IEEE Engineering in Medicine and Biology Society, Chicago, IL, USA, 26–30 August 2014; pp. 6238–6241. [Google Scholar] [CrossRef]
- Sun, Y.; Yu, X.B. An Innovative Nonintrusive Driver Assistance System for Vital Signal Monitoring. IEEE J. Biomed. Health Inf. 2014, 18, 1932–1939. [Google Scholar] [CrossRef]
- Garcés Correa, A.; Orosco, L.; Laciar, E. Automatic Detection of Drowsiness in EEG Records Based on Multimodal Analysis. Med. Eng. Phys. 2014, 36, 244–249. [Google Scholar] [CrossRef] [PubMed]
- Gurudath, N.; Riley, H.B. Drowsy Driving Detection by EEG Analysis Using Wavelet Transform and K-Means Clustering. Procedia Comput. Sci. 2014, 34, 400–409. [Google Scholar] [CrossRef] [Green Version]
- Awais, M.; Badruddin, N.; Drieberg, M. A Simulator Based Study to Evaluate Driver Drowsiness Using Electroencephalogram. In Proceedings of the 2014 5th International Conference on Intelligent and Advanced Systems (ICIAS), Kuala Lumpur, Malaysia, 3–5 June 2014; pp. 1–5. [Google Scholar]
- Van Hal, B.; Rhodes, S.; Dunne, B.; Bossemeyer, R. Low-Cost EEG-Based Sleep Detection. In Proceedings of the 36th Annual International Conference of the IEEE Engineering in Medicine and Biology Society, Chicago, IL, USA, 26–30 August 2014; pp. 4571–4574. [Google Scholar] [CrossRef]
- Murata, A.; Urakami, Y.; Moriwaka, M. An Attempt to Prevent Traffic Accidents Due to Drowsy Driving -Prediction of Drowsiness by Bayesian Estimation. In Proceedings of the 2014 Proceedings of the SICE Annual Conference (SICE), Sapporo, Japan, 9–12 September 2014; pp. 1708–1715. [Google Scholar]
- Peng, Y.; Wang, F.; Yang, Y.; Zhang, P. Design and Implementation of Virtual Driving System Fusing Driver’s Cognitive and Operating Characteristics. In Proceedings of the 2014 9th IEEE Conference on Industrial Electronics and Applications, Hangzhou, China, 9–11 June 2014; pp. 1826–1829. [Google Scholar]
- Zheng, W.-L.; Lu, B.-L. A Multimodal Approach to Estimating Vigilance Using EEG and Forehead EOG. J. Neural Eng. 2017, 14, 026017. [Google Scholar] [CrossRef] [PubMed]
- Li, G.; Lee, B.-L.; Chung, W.-Y. Smartwatch-Based Wearable EEG System for Driver Drowsiness Detection. IEEE Sens. J. 2015, 15, 7169–7180. [Google Scholar] [CrossRef]
- Li, G.; Chung, W.-Y. A Context-Aware EEG Headset System for Early Detection of Driver Drowsiness. Sensors 2015, 15, 20873–20893. [Google Scholar] [CrossRef]
- Plass-Oude Bos, D. EEG-Based Emotion Recognition-The Influence of Visual and Auditory Stimuli. Ph.D Thesis, Department of Computer Science, University of Twente, Enschedue, The Netherlands, 2007. Available online: http://citeseerx.ist.psu.edu/viewdoc/download?doi=10.1.1.226.8188&rep=rep1&type=pdf (accessed on 27 January 2022).
- Higuchi, T. Approach to an Irregular Time Series on the Basis of the Fractal Theory. Phys. D Nonlinear Phenom. 1988, 31, 277–283. [Google Scholar] [CrossRef]
- Yang, G.; Lin, Y.; Bhattacharya, P. A Driver Fatigue Recognition Model Based on Information Fusion and Dynamic Bayesian Network. Inf. Sci. 2010, 180, 1942–1954. [Google Scholar] [CrossRef]
- Liu, Y.-T.; Lin, Y.-Y.; Wu, S.-L.; Chuang, C.-H.; Prasad, M.; Lin, C.-T. EEG-Based Driving Fatigue Prediction System Using Functional-Link-Based Fuzzy Neural Network. In Proceedings of the 2014 International Joint Conference on Neural Networks (IJCNN), Beijing, China, 6–11 July 2014; pp. 4109–4113. [Google Scholar]
- Steriade, M. Central Core Modulation of Spontaneous Oscillations and Sensory Transmission in Thalamocortical Systems. Curr. Opin. Neurobiol. 1993, 3, 619–625. [Google Scholar] [CrossRef]
- Destexhe, A.; Contreras, D.; Steriade, M. Spatiotemporal Analysis of Local Field Potentials and Unit Discharges in Cat Cerebral Cortex during Natural Wake and Sleep States. J. Neurosci. 1999, 19, 4595–4608. [Google Scholar] [CrossRef] [Green Version]
- Gubbi, J.; Khandoker, A.; Palaniswami, M. Classification of Sleep Apnea Types Using Wavelet Packet Analysis of Short-Term ECG Signals. J. Clin. Monit. Comput. 2012, 26, 1–11. [Google Scholar] [CrossRef]
- Lee, B.-G.; Lee, B.-L.; Chung, W.-Y. Mobile Healthcare for Automatic Driving Sleep-Onset Detection Using Wavelet-Based EEG and Respiration Signals. Sensors 2014, 14, 17915–17936. [Google Scholar] [CrossRef] [PubMed] [Green Version]
- Heart Rate Variability. Circulation. Available online: https://www.ahajournals.org/doi/full/10.1161/01.cir.93.5.1043 (accessed on 16 November 2021).
- Wei, C.-S.; Lin, Y.-P.; Wang, Y.-T.; Jung, T.-P.; Bigdely-Shamlo, N.; Lin, C.-T. Selective Transfer Learning for EEG-Based Drowsiness Detection. In Proceedings of the 2015 IEEE International Conference on Systems, Man, and Cybernetics, Hong Kong, China, 9–12 October 2015; pp. 3229–3232. [Google Scholar]
- Lee, B.-G.; Lee, B.-L.; Chung, W.-Y. Wristband-Type Driver Vigilance Monitoring System Using Smartwatch. IEEE Sens. J. 2015, 15, 5624–5633. [Google Scholar] [CrossRef]
- Belz, S.M.; Robinson, G.S.; Casali, J.G. A New Class of Auditory Warning Signals for Complex Systems: Auditory Icons. Hum. Factors 1999, 41, 608–618. [Google Scholar] [CrossRef] [PubMed]
- Huang, K.-C.; Jung, T.-P.; Chuang, C.-H.; Ko, L.-W.; Lin, C.-T. Preventing Lapse in Performance Using a Drowsiness Monitoring and Management System. In Proceedings of the 2012 Annual International Conference of the IEEE Engineering in Medicine and Biology Society, San Diego, CA, USA, 28 August–1 September 2012; pp. 3336–3339. [Google Scholar] [CrossRef]
- Southworth, S. A Study of the Effects of Cranial Electrical Stimulation on Attention and Concentration. Integr. Physiol. Behav. Sci. 1999, 34, 43–53. [Google Scholar] [CrossRef]
- McIntire, L.K.; McKinley, R.A.; Goodyear, C.; Nelson, J. A Comparison of the Effects of Transcranial Direct Current Stimulation and Caffeine on Vigilance and Cognitive Performance during Extended Wakefulness. Brain Stimul. 2014, 7, 499–507. [Google Scholar] [CrossRef]
- Nelson, J.T.; McKinley, R.A.; Golob, E.J.; Warm, J.S.; Parasuraman, R. Enhancing Vigilance in Operators with Prefrontal Cortex Transcranial Direct Current Stimulation (TDCS). Neuroimage 2014, 85 Pt 3, 909–917. [Google Scholar] [CrossRef] [PubMed]
- Sakai, H.; Uchiyama, Y.; Tanaka, S.; Sugawara, S.K.; Sadato, N. Prefrontal Transcranial Direct Current Stimulation Improves Fundamental Vehicle Control Abilities. Behav. Brain Res. 2014, 273, 57–62. [Google Scholar] [CrossRef] [PubMed]
- Li, G.; Chung, W.-Y. Combined EEG-Gyroscope-TDCS Brain Machine Interface System for Early Management of Driver Drowsiness. IEEE Trans. Hum. Mach. Syst. 2018, 48, 50–62. [Google Scholar] [CrossRef]
- Rest Area. Wikipedia 2021. Available online: https://en.wikipedia.org/wiki/Rest_area (accessed on 27 January 2022).
- Gazzaley, A.; Rosen, L.D. The Distracted Mind: Ancient Brains in a High-Tech World; MIT Press: Cambridge, MA, USA, 2016; ISBN 978-0-262-03494-4. [Google Scholar]
- Hsu, W.-Y.; Zanto, T.P.; Gazzaley, A. Parametric Effects of Transcranial Alternating Current Stimulation on Multitasking Performance. Brain Stimul. 2019, 12, 73–83. [Google Scholar] [CrossRef]
- Hsu, W.-Y.; Zanto, T.P.; van Schouwenburg, M.R.; Gazzaley, A. Enhancement of Multitasking Performance and Neural Oscillations by Transcranial Alternating Current Stimulation. PLoS ONE 2017, 12, e0178579. [Google Scholar] [CrossRef]
- Klink, K.; Paßmann, S.; Kasten, F.H.; Peter, J. The Modulation of Cognitive Performance with Transcranial Alternating Current Stimulation: A Systematic Review of Frequency-Specific Effects. Brain Sci. 2020, 10, 932. [Google Scholar] [CrossRef] [PubMed]
- Karrer-Gauß, K.; Vöhringer-Kuhnt, T.; Baumgarten, T.; Briest, S. The Role of Individual Differences in Driver Fatigue Prediction. In Proceedings of the 3rd International Conference on Traffic and Transport Psychology, Nottingham, UK, 5-9 September 2004. [Google Scholar]
- Johnson, R.R.; Popovic, D.P.; Olmstead, R.E.; Stikic, M.; Levendowski, D.J.; Berka, C. Drowsiness/Alertness Algorithm Development and Validation Using Synchronized EEG and Cognitive Performance to Individualize a Generalized Model. Biol. Psychol. 2011, 87, 241–250. [Google Scholar] [CrossRef] [PubMed] [Green Version]
- Papadelis, C.; Chen, Z.; Kourtidou-Papadeli, C.; Bamidis, P.D.; Chouvarda, I.; Bekiaris, E.; Maglaveras, N. Monitoring Sleepiness with On-Board Electrophysiological Recordings for Preventing Sleep-Deprived Traffic Accidents. Clin. Neurophysiol. 2007, 118, 1906–1922. [Google Scholar] [CrossRef] [PubMed]
- Sommer, D.; Golz, M. Evaluation of PERCLOS Based Current Fatigue Monitoring Technologies. In Proceedings of the 2010 Annual International Conference of the IEEE Engineering in Medicine and Biology Society (EMBC 2010), Buenos Aires, Argentina, 31 August–4 September 2010; pp. 4456–4459. [Google Scholar] [CrossRef]
- SmartCap Technologies|Measure Alertness. Eliminate Fatigue. Available online: http://www.smartcaptech.com/ (accessed on 16 November 2021).


| Ref. | Number of Channel | Channel Position (1) | Time Window |
|---|---|---|---|
| [31] | 33 | - | 1 min |
| [35] | 19 | F1, F2, F7, F8, F3, F4, T3, T4, C3, C4, T5, T6, P3 | 1 s |
| [36] | 1 | O1 or O2 | 1 s |
| [37] | 1 | Fp1 | 10 s |
| [38] | 4 | - | - |
| [39] | 2 | C3, P3 | 10 s |
| [40] | 1 | C3 | 5 s |
| [41] | 1 | Fp1 & Fp2 | - |
| [42] | 6 | Fp1, Fp2, T5, T6, O1, O2 | 4 s |
| [43] | 1 | Oz | 8 s |
| [44] | 26 | - | 5 s |
| [45] | 1 | - | 2 min |
| [8] | 1 | C3 or C4 | 30 s |
| [46] | 1 | C3 & O1 | 30 s |
| [47] | 2 | F7 & T3; F4 & C4 | - |
| [48] | 16 | - | 1 min |
| [49] | 1 | O1 | 1 min |
| [50] | 2 | C4, O2 | 10 s |
| [51] | 2 | Fp1 & Fp2; T3 & T4 | - |
| [52] | 1 | Fp1 & Fp2 | 2 s |
| [53] | 29 | Frontal (F: 3, 1, z, 2, 4; Fc: 3, 1, z, 4), Central (C: 3, 1, 2, 4; Cp: 3, 1, z, 2, 4) and Posterior-occipital (P: 3, 1, z, 2, 4; Po: 3, z, 4; O: 1, z, 2) | 20 min |
| [24] | 3 | Fz, T8, Oz | 1 min |
| [54] | 2 | C4, O2 | 1 min |
| [55] | 19 | - | 2 s |
| [56] | 1 | O1 & O2 | 1 min |
| [57] | 1 | O1 & O2 | 30 s |
| [58] | 4 | Forehand | 10 min |
| [59] | 8 | Fp1, Fp2, F3, F4, P3, P4, O1, O2 | 10 s |
| [60] | 1 | Fp1 | 10 s |
| [61] | 1 | P3 | 20 s |
| [62] | 6 | Occipital | 1 s |
| [63] | 14 | F7, F8, T3, T4, T5, T6, F3, F4, C3, C4, P3, P4, O1 and O2 | 1 s |
| [64] | 2 | Fz & Cz; Pz & Oz | - |
| [65] | 21 | - | 30 |
| [66] | 1 | C4 & P4 | 1 min |
| [67] | 4 | Occipital | - |
| [68] | 1 | Fp1 & Fp2 | 2 s |
| [69] | 3 | Fz, Cz, Oz | 2 s |
| [70] | 3 | Fz, T8, Oz | 10 s |
| [71] | 2 | Fz, Oz | 1 min |
| [72] | 3 | (Fp1, C3, O1) or (Fp2, C4, O2) | 30 s |
| [73] | 14 | - | 1 s |
| [74] | 1 | O1 & O2 | <1 s |
| [75] | 2 | Fz & Cz; Pz & Oz | 1 min |
| [76] | 1 | O1 & O2 | 1 min |
| [77] | 4 | Occipital | 2 s |
| [78] | 2 | Fz, Pz | - |
| [79] | 2 | Fz, Oz | 1 min |
| [80] | 1 | - | 5 s |
| [81] | 2 | Fz & Cz; Pz & Oz | 30 s |
| [82] | 19 | - | 2 s |
| [83] | 1 | Fp1 | 1 s |
| [84] | 1 | O1 & O2 | 30 s |
| [85] | 14 | - | - |
| [86] | 18 | Posterior-occipital (CPZ, CP2, P1, PZ, P2, PO3, POZ, PO4, O1, OZ, O2) and Temporal (FT7, FT8, T7, T8, TP7, TP8) | 8 s |
| Features | Mathematic Expression | |
|---|---|---|
| Statistical measure | Maximum (Max) [80] | |
| Minimum (Min) [80] | ||
| Standard deviation (STD) [76,81,82,83] | ||
| Root mean square (RMS) [70] | ||
| Integration [42,44,75,80] | ||
| The Number of Zero-Crossing (NZC) [42,46,70,80] | ||
| Hjorth parameters [70] | ||
| Barlow parameters [70] | ||
| Auto regressive model coefficients(ARMC) [70] | where c is the intercept and φ is ARMC which specifies how much the xk contributes to the xk+1. εk+1 is assumed to be the random zero mean noise. | |
| Entropy | Shannon entropy (SE) [36,45,75] | where p(xk) represents the probability that the xk occurs anywhere in the EEG samples x. The p(xk) is estimated by a histogram method where the x is linearly divided into M bins. |
| R’enyi entropy (RE) [37,45,60] | where α is the order, α ≥ 0 and α ≠ 1 | |
| Mean comparison test (MCT) [61] | where μ1 indicates the fixed reference window, μ2(i) indicates the ith dynamic window. | |
| Mahalanobis Distance (MD) [43] | ||
| Features | Mathematic Expression | References |
|---|---|---|
| Pure Band Equation (PBE) | θ/β | [44,50,56] |
| θ/(α + β) | [51] | |
| (θ + α)/β | [44,51] | |
| (θ + α)/(α + β) | [44,51] | |
| θ/α | [73,79] | |
| δ/α | [73] | |
| α/β | [44,58,85] | |
| (0.6 * θ + 0.4 * α)/(0.5 * β) | [52,69] | |
| (α + β)/δ | [45] | |
| (δ + θ)/(α + β) | [48] | |
| Relative Band Power (RBP) | , where, zi = {δ, θ, α, β, γ}. | [19,61,66,82] |
| Log Band Power | {8, 9, 10, 11, 12 Hz} or {10, 11, 12, 13, 14 Hz} | [26] |
| Log(α − θ) | [71] |
| DM Model | No. | Ground Truth |
|---|---|---|
| Threshold/Binary | 1 | Subjects’ response time to lane departure event [43,67,92] |
| 2 | Subjects’ response time to sound simulation [42] | |
| 3 | Subjects’ collision rates with time [58] | |
| 4 | Subjects’ self-assessment [52,68] (Subjects press a button, placed next to them, when feeling drowsy) | |
| 5 | Subjects’ self-assessment [69] (Alert: KSS < 8 and KDS = 0; Fatigue: KSS ≥ 8 and KDS ≥ 50) | |
| 6 | Subjects’ self-assessment [53] (Alert: KSS < 8.5; Drowsy: KSS ≥ 8.5) | |
| 7 | Subjects’ self-assessment [42] (Alert: KSS < 7; Drowsy: KSS ≥ 7) | |
| 8 | Subjects abort driving due to severe fatigue [53,85] | |
| 9 | RK (Wake, Stage I) [46,66,76,80] | |
| 10 | Facial features that are manually identified by video recording [56] (Drowsiness: Wierewille scale ≥ 3) | |
| 11 | Authors’ self-assessment, based on the subjects’ response during the experiment (The subjects need to accurately count the number of a visual stimulus shown [36]) | |
| 12 | Authors’ self-assessment, based on the experimental video recording and the subjects’ self-assessment [44] | |
| 13 | Authors’ self-assessment, based on subjects’ eye and head movements [35] | |
| 14 | Assessment of Driver’s Vigilance and Warning according to Traffic Risk Estimation (AWAKE): Index ≥ 1 represents drowsiness [61] | |
| 15 | PERCLOS [76] | |
| Multi-class | 16 | Subjects’ self-assessment (ESS) [55,59] (Alert: ESS < 8; Drowsy: 8 ≤ ESS ≤ 11; Severe drowsy: ESS ≥ 24) |
| 17 | Facial features that are manually identified by video recording (Wierewille scale) [24,70,79] | |
| 18 | Self-assessment (KSS) [71] | |
| 19 | RK (Wake, Stage I, Stage II) [72] | |
| 20 | Authors’ self-assessment, based on their own experience [73] | |
| 21 | Unknown sleep scoring standard [40] | |
| Regression | 1 | Subjects’ response time to lane departure event [62,77] |
| 17 | Facial features that are manually identified by video recording [50] (Wierewille scale) | |
| 22 | Subjects’ driving error index [31] | |
| Probabilistic | 15 | PERCLOS [86,87] |
| 23 | Self-assessment [56,84] (Subjects press buttons on the steering wheel when feeling arousal, a little bit drowsy and drowsy) | |
| Transfer | 1 | Subjects’ response time to lane departure event [98] |
| Ref. No. | Features | Acc (%) | Sens (%) | Spec (%) | GND Truth No. |
|---|---|---|---|---|---|
| [54] | FFT+: a wide range of α band | - | 74.4 | 95.5 | 10 |
| [52] | BPE: #8 | 90.4 | - | - | 4 |
| [49] | PBP: θ~β bands | 83.8 | - | - | - |
| [43] | FFT+: MDT and MDA | 82.8 | - | - | 1 |
| [83] | FFT+: mean and STD extracted from α and β bands | 81 | - | - | 9 |
| Ref. No. | Features | Models | Acc (%) | Sens (%) | Spec (%) | GND Truth No. |
|---|---|---|---|---|---|---|
| [72] | SHBP (1~27 Hz) and BPE: #5 | RBF-SVM | 97.48 | - | - | 9 |
| [76] | RPB: α band | Linear-SVM | 95.22 | 100 | 93.8 | 15 |
| [85] | Wavelet: WPT features that are selected by CSP method | SVM | 94.2 | - | - | 8 |
| [44] | BPE: #1, 3, 4, 7 and PBP: δ~β selected by PCA and fish score | SVM | 92.2 | - | - | 12 |
| [42] | Wavelet+: NZC and IEEG extracted from θ~β bands | ANN | - | 90.91 | 79.1 | 2 |
| [77] | FFT+: IEEG, SE and STD extracted from δ~γ bands | SVM | 92.5 | 85 | 100 | 9 |
| [69] | FFT+: DF, APDP, CGF, FV and MPF extracted from δ~β bands | RBF-SVM | 75 | 86 | 64 | 5 |
| [61] | FFT+: RBP-based MCT values | FI | - | 84.6 | 82.1 | 19 |
| [80] | Hybrid: three features from time-domain (Max, Min, STD); ten features from FFT-based methods (CenF, PF, RH/L, Q1F, Q3F, spectral STD, IR, MF, AC and KC); Wavelet-based methods (IEEG and NZC from θ~β bands) | LDA-ANN | - | 83.6 | 87.4 | 9 |
| [35] | PBP: δ~β bands | ANN | 81.49 | 80.53 | 82.44 | 13 |
| [36] | FFT+: SE extracted from SSVEP-based power spectrum | Single-layer feed-forward ANN | 72.5 | - | - | 11 |
| Ref. No. | Features | Models | Acc (%) | GND Truth No. |
|---|---|---|---|---|
| [24] | Wavelet+: Normalized log energy of the wavelet-packet coefficients that are selected by FMI method | LDA | 97% (5 levels) | 17 |
| [39] | Wavelet: band power | Multilayer perceptron ANN | 95~96% (3 levels) | 21 |
| [70] | Hybrid features: TDAR, selected by FNPA | RBF-SVM | 93% (5 levels) | 17 |
| [64] | Wavelet+: Normalized log energy of the wavelet-packet coefficients selected by FMI method | SVM | 91% (5 levels) | 1 |
| [73] | Wavelet+: FFT band power and SC generated by WPT | Subtractive FI | 84.41% (4 levels) | 21 |
| Ref. No. | Features | Models | Acc (%) | GND Truth No. |
|---|---|---|---|---|
| [77] | LBP: Log-transformed SHBP (1–30 Hz) | RBF-SVR | r2 = 0.932 and RMSE = 0.124 (s) | 1 |
| [31] | Wavelet+: Normalized log energy of the wavelet-packet coefficients, selected by FMI method | MLR | r2 = 0.778 | 22 |
| [62] | PBP: θ and α power | SONFIN | r2 = 0.613 and RMSE = 0.360 (s) | 1 |
| [50] | FFT+: α burst duration, mean amplitude, relative amplitude, amplitude variance, wave duration variance, wave similarity, slope smoothness measurement | MLP | r2 = 0.272 | 17 |
| Ref. | Core Approach | Max Duration of Enhanced Vigilance Level | Technical Parameters | Intervening at Slightly Drowsiness Moment | Including Neurofeedback |
|---|---|---|---|---|---|
| [67] | Auditory | 40 s | EEG-guided 1750 Hz tone per sec | No | Yes |
| [103] | Caffeine | 2 h | - | No | No |
| [103] | tDCS | 6 h | Hairy area; 30 min and fixed 2 mA session | No | No |
| [105] | tDCS | - | Hairy area; 20 min and fixed 1.5 mA session | No | No |
| [106] | tDCS | 23 m | Non-hairy area; EEG-guided stimulation duration and fixed 2 mA | Yes | Yes |
Publisher’s Note: MDPI stays neutral with regard to jurisdictional claims in published maps and institutional affiliations. |
© 2022 by the authors. Licensee MDPI, Basel, Switzerland. This article is an open access article distributed under the terms and conditions of the Creative Commons Attribution (CC BY) license (https://creativecommons.org/licenses/by/4.0/).
Share and Cite
Li, G.; Chung, W.-Y. Electroencephalogram-Based Approaches for Driver Drowsiness Detection and Management: A Review. Sensors 2022, 22, 1100. https://doi.org/10.3390/s22031100
Li G, Chung W-Y. Electroencephalogram-Based Approaches for Driver Drowsiness Detection and Management: A Review. Sensors. 2022; 22(3):1100. https://doi.org/10.3390/s22031100
Chicago/Turabian StyleLi, Gang, and Wan-Young Chung. 2022. "Electroencephalogram-Based Approaches for Driver Drowsiness Detection and Management: A Review" Sensors 22, no. 3: 1100. https://doi.org/10.3390/s22031100
APA StyleLi, G., & Chung, W.-Y. (2022). Electroencephalogram-Based Approaches for Driver Drowsiness Detection and Management: A Review. Sensors, 22(3), 1100. https://doi.org/10.3390/s22031100