
Integrating the HFACS Framework and Fuzzy Cognitive Mapping for In-Flight Startle Causality Analysis


Abstract
1. Introduction
1.1. Research Aim and Objectives
1.2. Rationale
1.3. Contribution and Organization of Paper
2. Related Work
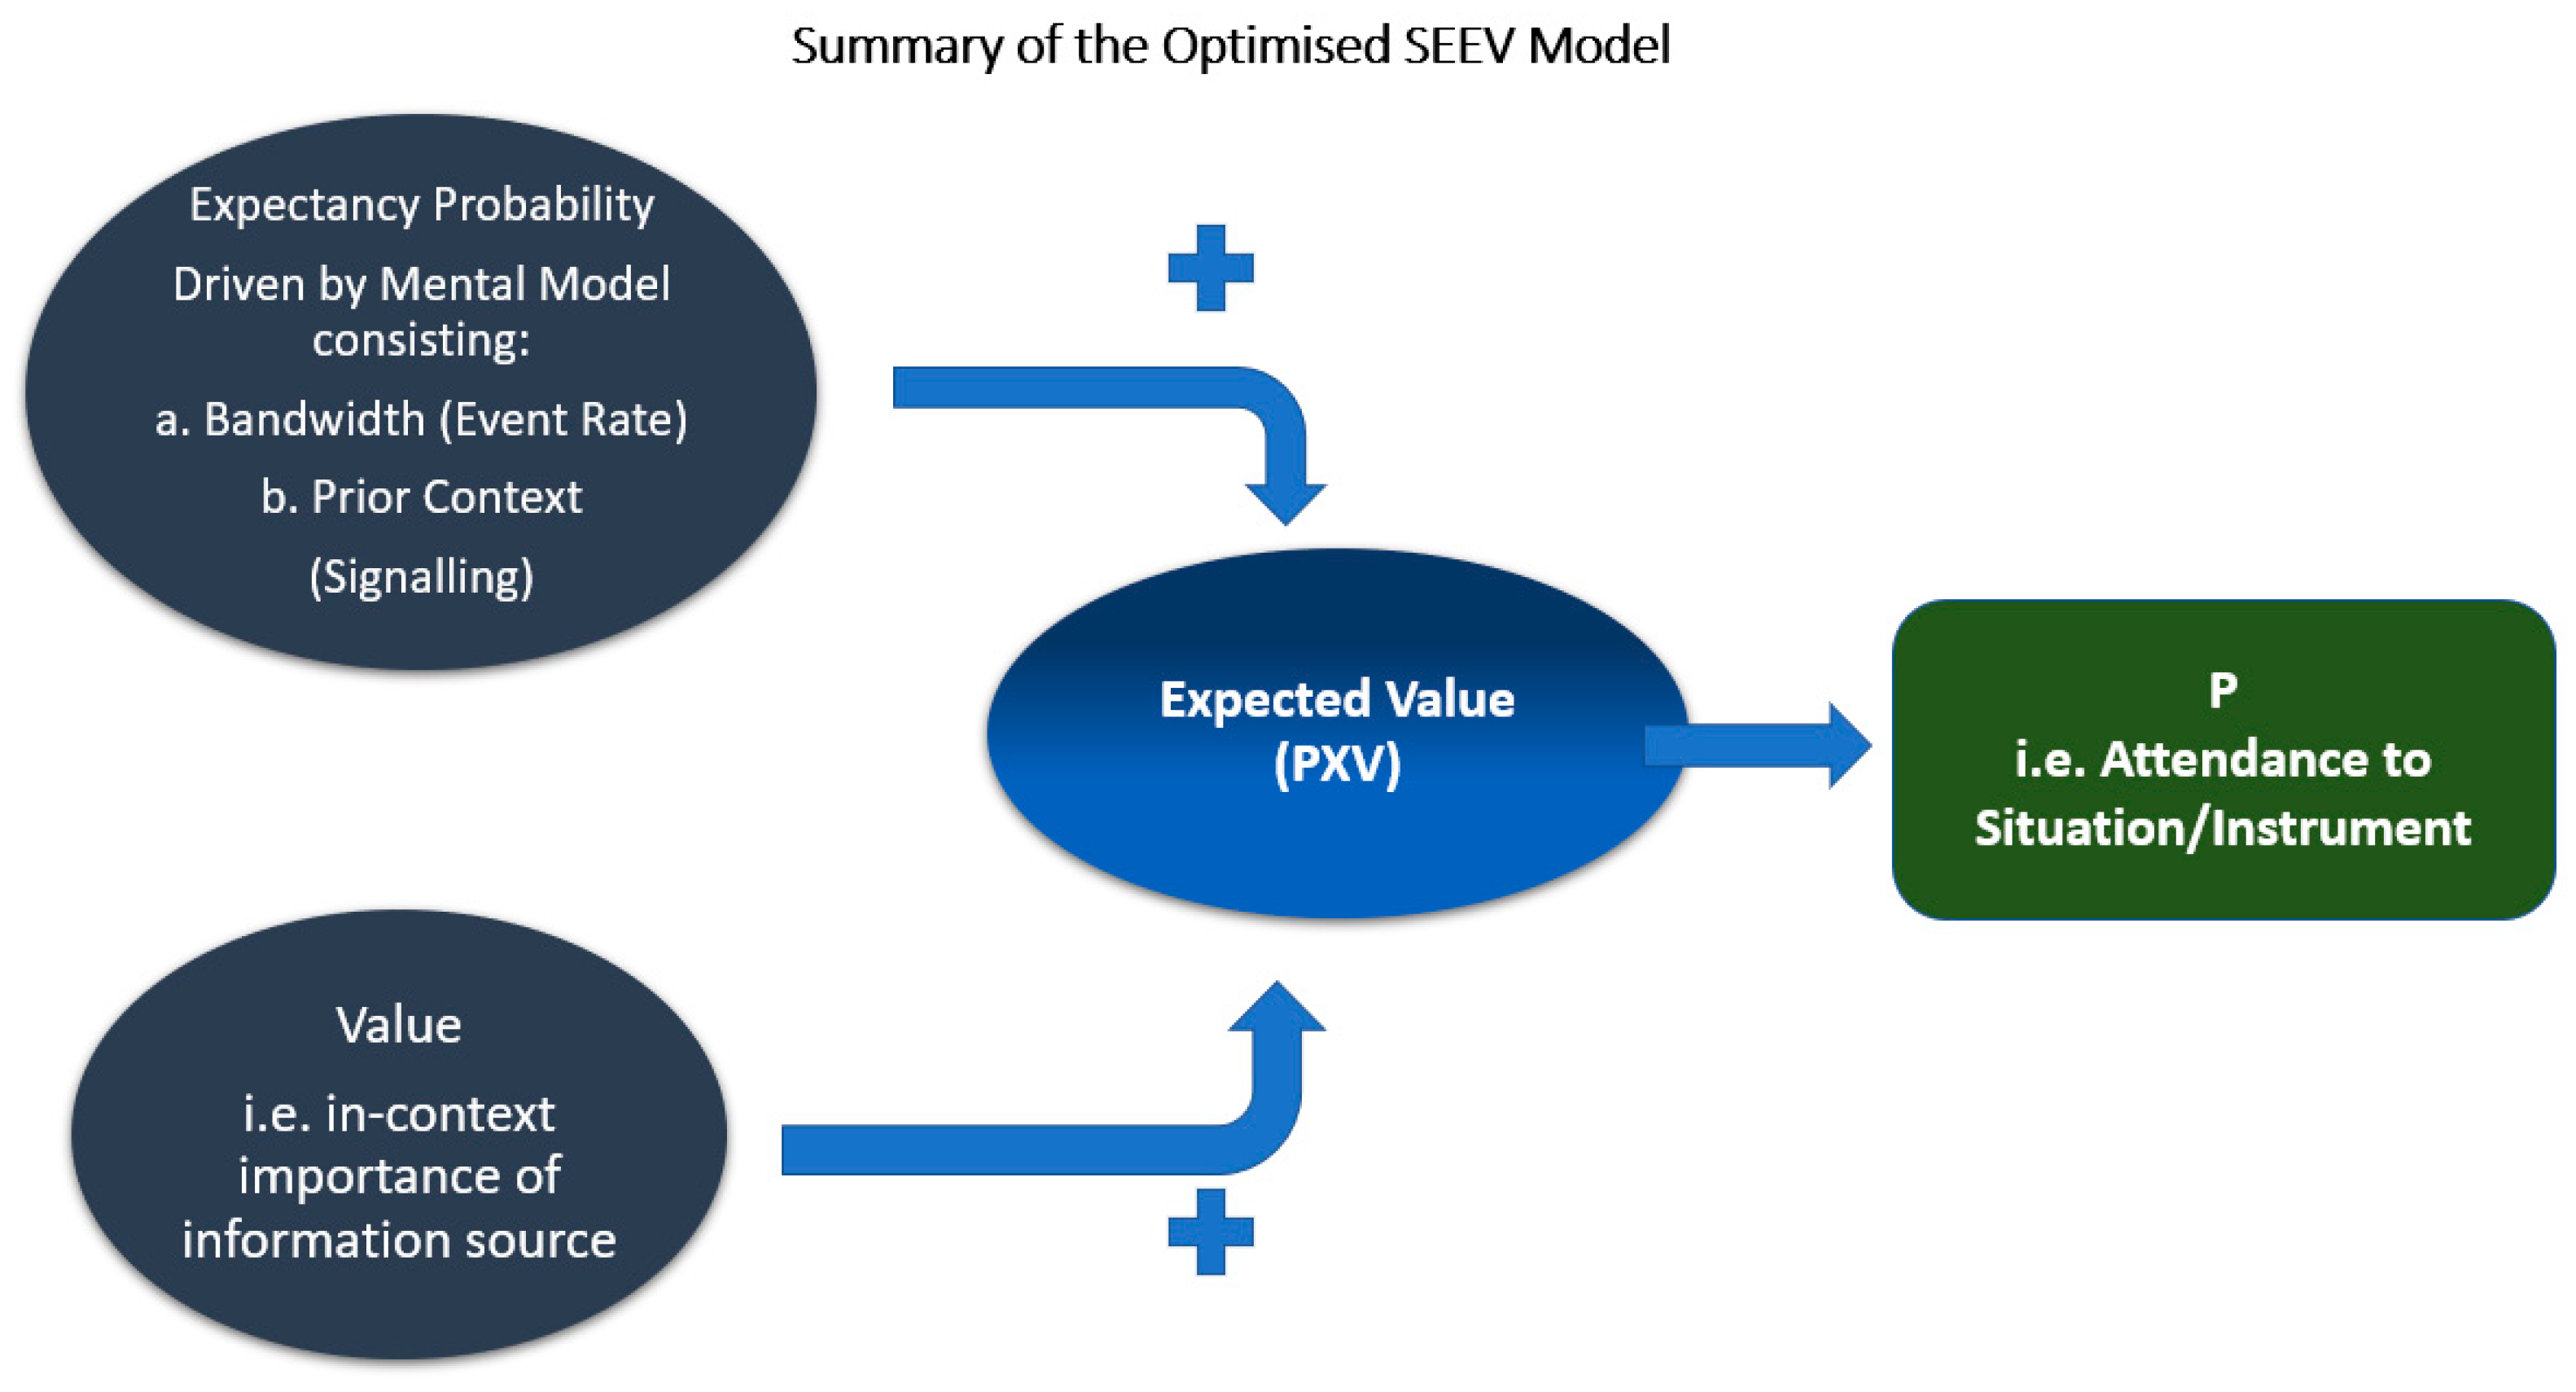
- P represents the pilot’s level of visual attendance to a problem inflight.
- “a” is the salience component representing how swiftly the pilot captures the onset of the event.
- “b” is the effort factor required to move attention around and across the relevant critical information or area of interest (AOI) in the cockpit environment. This notion of effort has great significance in the ergonomics and overall effectiveness of the cockpit as an environment involving concurrent cognitive activity in an emergency.
- “c” is a value assigned to expectancy—noted as the probability cueing of an event. Of course, this has a significant implication for understanding spatial attention while being intensely focused on a very dynamic situation, such as an airplane upset.
- “d” is simply the value placed on a task in the context of an event, such as unexpected but violent clear air turbulence (CAT).
3. Fuzzy Cognitive Maps and Modeling Startle
3.1. Underlying Concepts: Fuzzy Sets, Startle Propagation, and FCMs
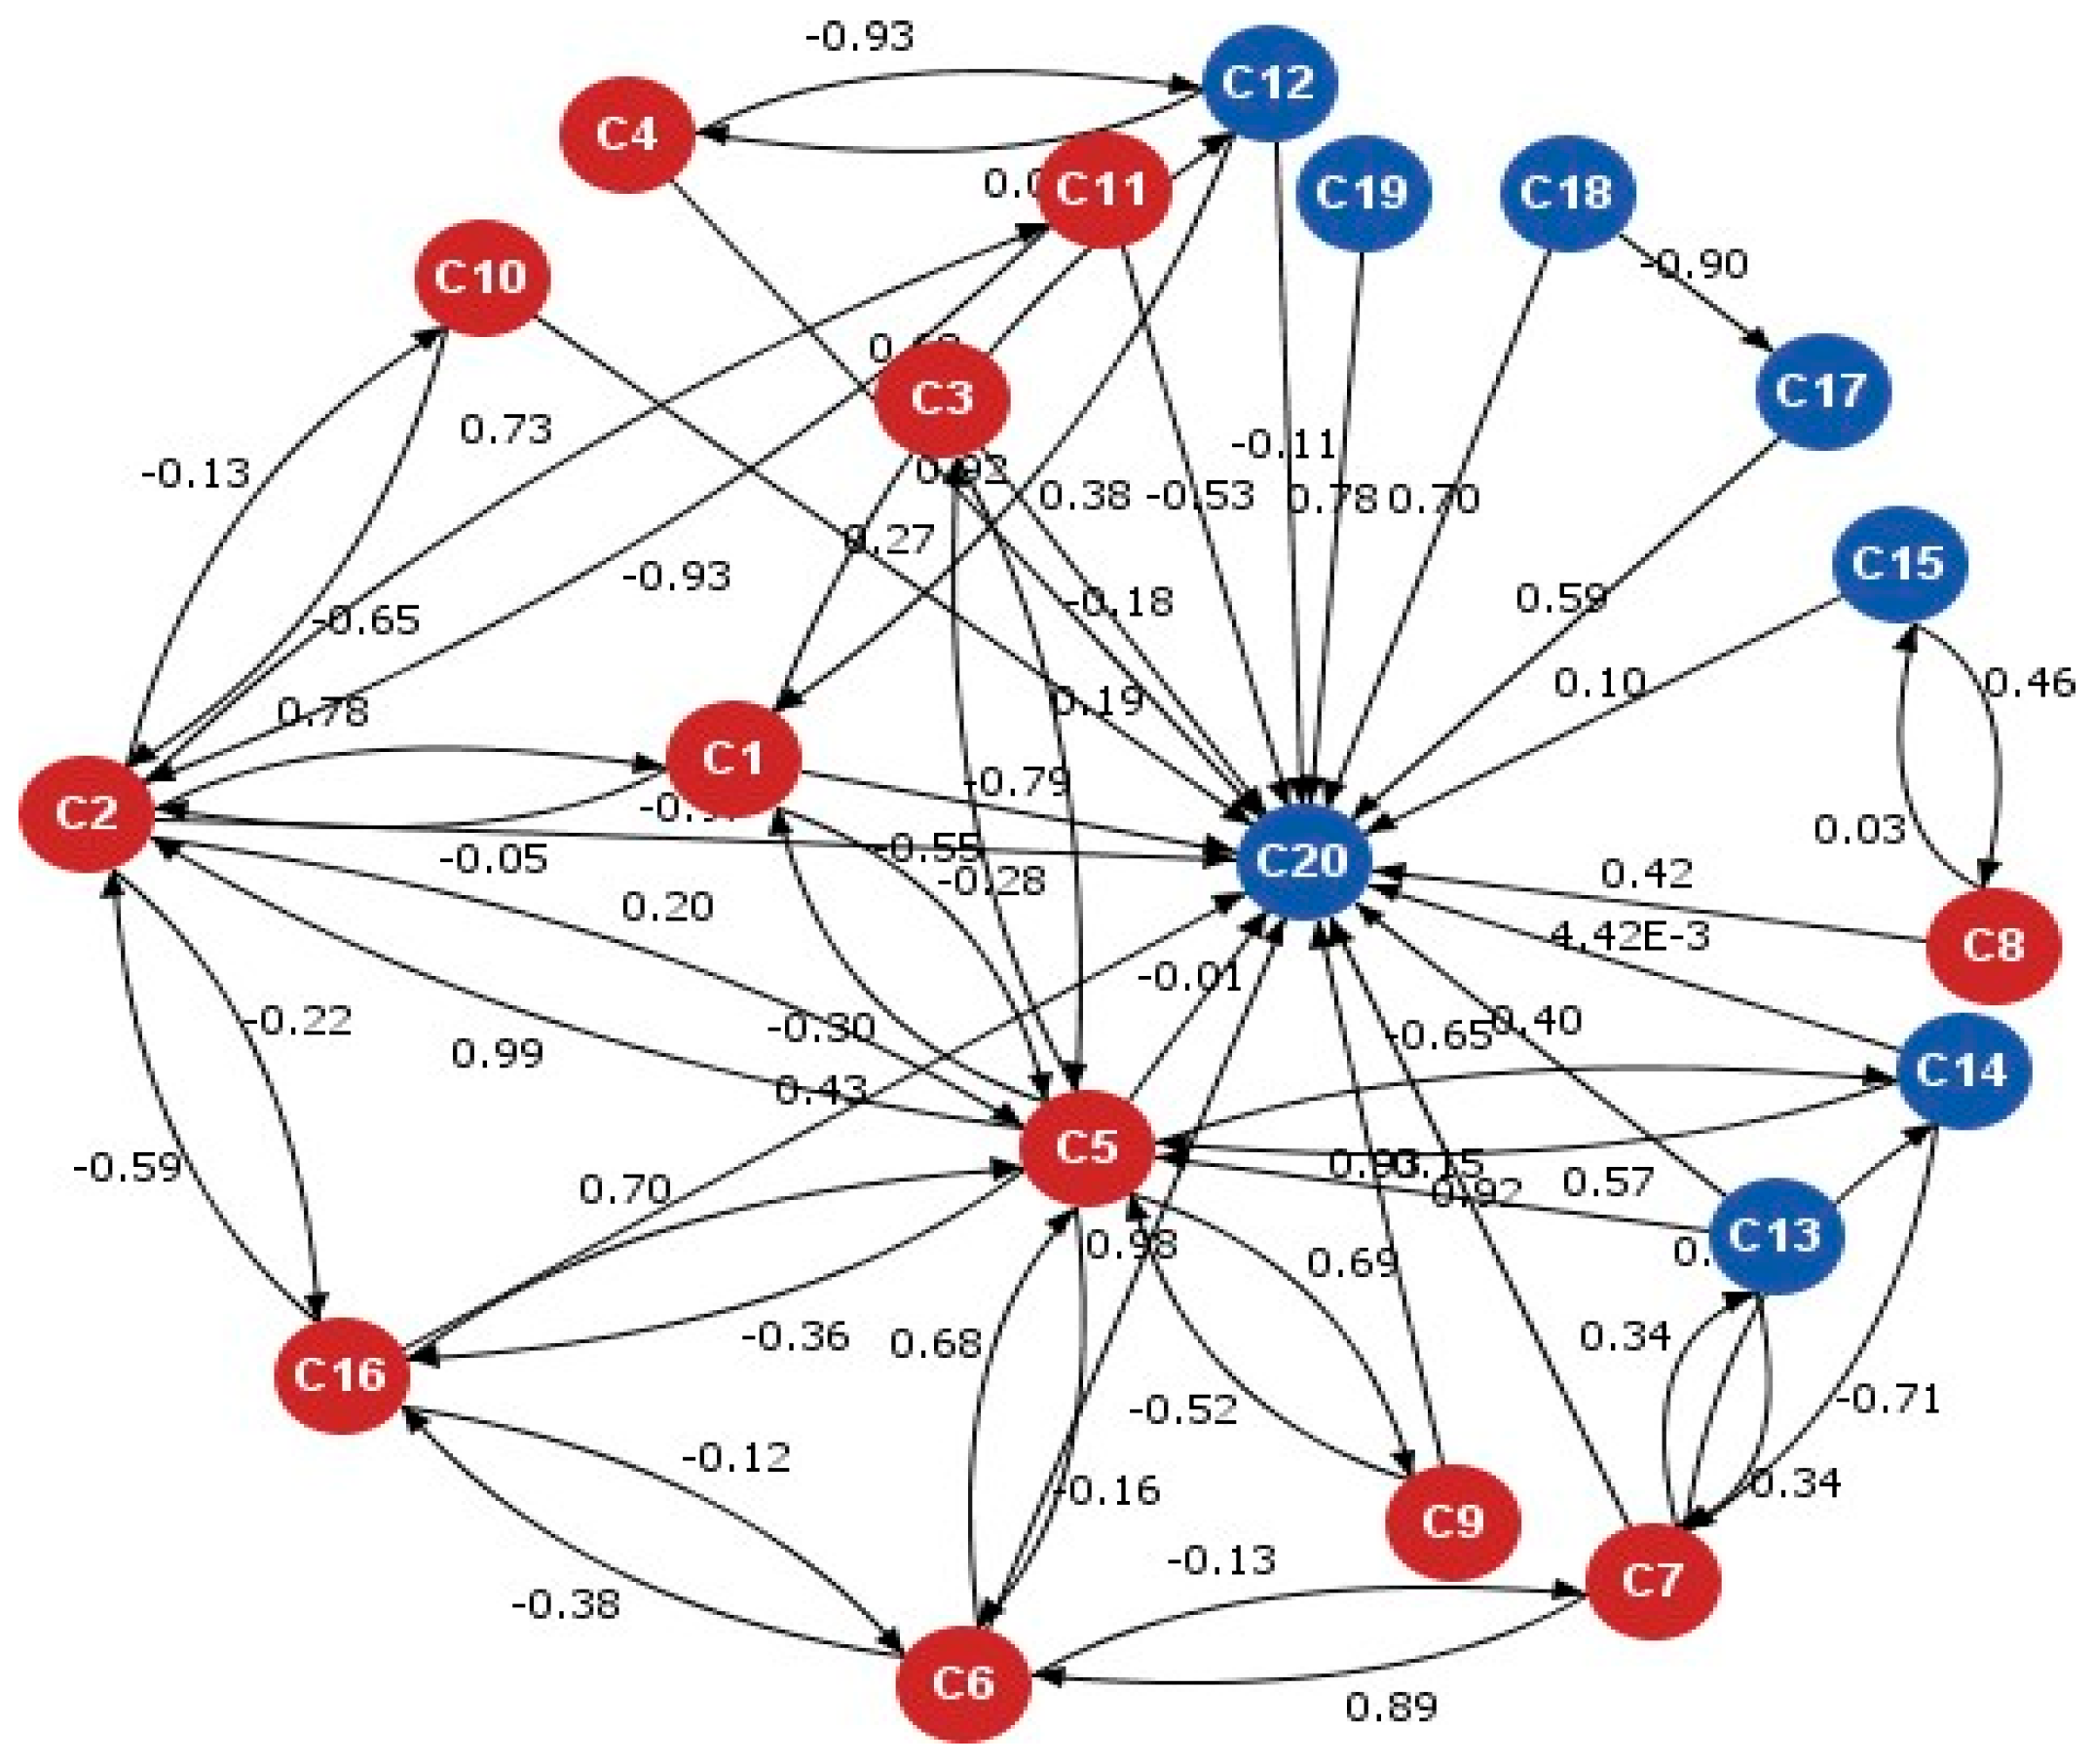
- wij > 0 indicates a positive causality, then an increase (decrease) in Ci will increment the effect concept Cj with intensity |wij|.
- wij < 0 means a negative causality, then an increase (decrease) in Ci will reduce the effect concept Cj with intensity |wij|.
- wij = 0 denotes the absence of a causal (or, in other words, neutral) relationship between concepts Ci and Cj.
3.2. Modeling Startle Causality with FCMs
3.2.1. Codification
- a.
- Choose the number N and kind of concepts Ci of the FCM. In this case, we achieve this based on the HFACS framework to determine a total “N” of 19 human factors, with each element representing a concept C.
- b.
- Determine the direction of connections and interactions amongst the concepts.
- c.
- Use an inference rule to describe the relation between two concepts and infer a fuzzy linguistic set (weight) for the interconnection between the concepts.
- d.
- Linguistic weights for every interconnection are combined and transformed into numerical weights.
3.2.2. Association
4. Discussion
FCM Results
5. Summary and Future Work
Author Contributions
Funding
Institutional Review Board Statement
Informed Consent Statement
Data Availability Statement
Conflicts of Interest
Abbreviations
| ADM | Aeronautical Decision Making |
| AHPLS | Attention-related human performance-limiting states |
| AIAA | American Institute of Aeronautics and Astronautics |
| AOI | Area of Interest |
| CAT | Clear Air Turbulence |
| CF | Causal Factors |
| ESD | Event Sequence Diagrams |
| FAA | Federal Aviation Authority |
| FCM | Fuzzy Cognitive Map |
| GA | General Aviation |
| HFACS | Human Factors Analysis and Classification System |
| ICAO | International Civil Aviation Organisation |
| ICATEE | International Committee for Aviation Training in Extended Envelopes |
| LOC | Loss of control |
| MIDAS | Man-machine Integration Design and Analysis System |
| NDM | Naturalistic Decision-Making |
| SA | Situational awareness |
| SEEV | Salience, Effort, Expectancy, Value |
Appendix A. Fuzzy Cognitive Mapping (FCM) Questionnaire
Appendix A.1. Background
Appendix A.2. Causal Factors
| Startle—LOC Causal Factors | Ranking (0–1) |
| Part 91 Rules (Potentially Less Stringent Rules) | |
| Pre-Flight Checks | |
| Faulty/Uncalibrated Instrument Readings | |
| Preparation (Flight/Route Planning Etc.) | |
| Lack of Visual References | |
| Appraisal of Evolving Situation | |
| Fatigue/Tiredness | |
| Insufficient Training/ Lack of Concurrency | |
| Unskilled Pilot | |
| Cockpit Ergonomics/Information Layout | |
| Resource Awareness/CRM | |
| Stress | |
| Communication (ATC) | |
| Distractions (Phone Call, In-Flight Conversations) | |
| Complacency (Route Familiarity) | |
| Time Pressures | |
| Lack of ADM Knowledge (Perceive—Process—Perform) | |
| Lack of Assertiveness | |
| Norms | |
| Medication/Drugs |
Appendix A.3. Causal Factors Linguistic Ratings
| Linguistic Rating Terminology (Judgement of Influence) | Triangular Fuzzy Numbers (Numerical Rating of Factor) |
| Very Low Influence | 0, 0, 0.25 |
| Low Influence | 0, 0.25, 0.50 |
| Medium | 0.25, 0.50, 0.75 |
| High Influence | 0.50, 0.75, 1.00 |
| Very High Influence | 0.75, 1.00, 1.00 |
Appendix A.4. Demographic Information
- Do you have any Federal Aviation Administration (FAA)/UK Civil Aviation Authority UK CAA pilot certifications or ratings?
- If yes, what is the highest level of certificate that you hold?
- ○
- Student Pilot
- ○
- Sport Pilot
- ○
- Recreational Pilot
- ○
- Private Pilot
- ○
- Commercial Pilot
- ○
- Airline Transport Pilot (ATP)
- ○
- Other (Please spec*):
- What category or categories of aircraft are on this highest certificate? If applicable, mark all the following that apply.
- ○
- Airplane
- ○
- Rotorcraft
- ○
- Glider
- ○
- Lighter Than Air
- ○
- Powered lift
- ○
- Powered Parachute
- ○
- Weight Shift
- What class or classes of aircraft are on this highest certificate? If applicable, mark all the following that apply.
- ○
- Single Engine Land
- ○
- Single Engine Sea
- ○
- Multi-Engine Land
- ○
- Multi-Engine Sea
- ○
- Balloon Airship
- ○
- Helicopter
- ○
- Gyroplane
- ○
- Other (Please specify):
- Do you have an instrument rating? Please indicate as necessary
- ○
- No
- ○
- Yes
- Please indicate any non-pilot Federal Aviation Administration (FAA)/ UK CAA certifications that you hold:
- ○
- None
- ○
- Flight Engineer
- ○
- Flight Navigator
- ○
- Air Traffic Control Specialist, Control Tower Operator or Equivalent
- ○
- Aircraft Dispatcher
- ○
- Mechanic, Avionics Technician, Repairman, or Equivalent
- ○
- Other (Please specify):
- What is your gender?
- ○
- Female
- ○
- Male
- ○
- Prefer not to answer
- What is your current Age?
- ○
- ___Age
- ○
- Prefer not to answer
References
- Hunter, D.R. Measuring General Aviation Pilot Jugment Using a Situational Judgment Technique. Int. J. Aviat. Psychol. 2003, 13, 37–41. [Google Scholar] [CrossRef]
- Martin, W.L.; Murray, P.S.; Bates, P.R. The Effects of Startle on Pilots During Critical Events: A Case Study Analysis. In Proceedings of the EAAP Conference, Sardinia, Italy, 24–28 September 2012; Volume 30, pp. 387–394. [Google Scholar]
- Ud-Din, S.; Yoon, Y. Analysis of Loss of Control Parameters for Aircraft Maneuvering in General Aviation. J. Adv. Transp. 2018, 2018, 7865362. [Google Scholar] [CrossRef]
- Oppenheimer, P.A.; Col, L.; Ret, U. Pilot Response in Time Critical Aircraft Upset/Loss of Control Inflight (LOC-I) Events. 1–15. Available online: https://www.apstraining.com/resource/pilot-response-time-critical-aircraft-upsetloss-control-inflight-loc-events-2/ (accessed on 16 January 2022).
- Houston, S.J.; Walton, R.O.; Conway, B.A.; Houston, S.J.; Walton, R.O.; Walton, R. Analysis of General Aviation Instructional Loss of Control Accidents. J. Aviat. Educ. Res. 2012, 22, 35–49. [Google Scholar] [CrossRef][Green Version]
- Advani, S.; McNeace, C. Loss of Control In Flight and UPRT. 2015, 1–48. Available online: https://www.icao.int/ESAF/Documents/meetings/2015/LOC-I/LOC-I-DAY1-04-%20LOC-I%20%20and%20UPRT%20by%20IDT.pdf (accessed on 16 January 2022).
- Jacobson, S. Aircraft Loss of Control Causal Factors and Mitigation Challenges. In Proceedings of the AIAA Guidance, Navigation, and Control Conference, Toronto, ON, Canada, 2–5 August 2010; pp. 1–59. [Google Scholar] [CrossRef]
- Belcastro, C.M.; Foster, J.V.; Aviation, C.; Team, S.; Aeronautics, N.; Generation, N.; Operations, A.; Transportation, N.; Board, S.; Oscillation, P.I.; et al. Aircraft Loss-of-Control Accident Analysis. In Proceedings of the AIAA Guidance, Navigation, and Control Conference, San Diego, CA, USA, 7–11 January 2019; pp. 1–41. [Google Scholar]
- Michales, A.S. Contributing Factors Among Fatal Loss of Control Accidents in Multiengine Turbine Aircraft. Aviat. Technol. Grad. Stud. Publ. 2012. Available online: https://docs.lib.purdue.edu/atgrads/17/ (accessed on 16 January 2022).
- International Air Transport Association. Loss of Control In-Flight Accident Analysis Report 2010–2014; Montreal-Geneva: International Air Transport Association: Montréal, QC, Canada, 2015; ISBN 9789292527754.
- Talone, A.B.; Jentsch, F. Evaluating Startle, Surprise, and Distraction: An Analysis of Aircraft Incident and Accident Reports. In Proceedings of the 18th International Symposium on Aviation Psychology, Dayton, OH, USA, 4–7 May 2015; pp. 278–283. [Google Scholar]
- Harrivel, A.R.; Stephens, C.L.; Milletich, R.J.; Heinich, C.M.; Last, M.C.; Napoli, N.J.; Abraham, N.; Prinzel, L.J.; Motter, M.A.; Pope, A.T. Prediction of Cognitive States during Flight Simulation using Multimodal Psychophysiological Sensing. In Proceedings of the AIAA Information Systems-AIAA Infotech@Aerospace, Grapevine, TX, USA, 9–13 January 2017; pp. 1–10. [Google Scholar] [CrossRef]
- Castillo, D. 2017, Training To Startle. Available online: https://sm4.global-aero.com/articles/training-to-startle/ (accessed on 16 January 2022).
- Landman, A.; Groen, E.L.; Van Paassen, M.M.; Bronkhorst, A.W.; Mulder, M. Dealing With Unexpected Events on the Flight Deck: A Conceptual Model of Startle and Surprise. Hum. Factors 2017, 59, 1161–1172. [Google Scholar] [CrossRef] [PubMed]
- General Aviation Joint Steering Committee (GAJSC). Loss of Control Work Group Approach and Landing; General Aviation Joint Steering Committee: 2012. Available online: https://www.gajsc.org/document-center/ (accessed on 16 January 2022).
- National Transportation Safety Board. Prevent Loss of Control in Flight in General Aviation; National Transportation Safety Board: Washington, DC, USA, 2015.
- Yusuf, A.B.; Kor, A.L.; Tawfik, H. Development of a Simulation Experiment to Investigate In-Flight Startle using Fuzzy Cognitive Maps and Pupillometry. In Proceedings of the International Joint Conference on Neural Networks, Budapest, Hungary, 14–19 July 2019; Volume 2019. in press. [Google Scholar]
- Loss of Control in General Aviation; EASA: Cologne, Germany, 2016.
- Wickens, C.D.; Mccarley, J.S.; Thomas, L.C. Attention-situation awareness (A-SA) model. In Proceedings of the NASA Aviation Safety Program Conference on Human Performance Modeling of Approach and Landing with Augmented Displays, Moffett Field, CA, USA, 6 March 2003; pp. 189–225. [Google Scholar]
- Wickens, C.D. Situation awareness: Review of Mica Endsley’s 1995 articles on situation awareness theory and measurement. Hum. Factors 2008, 50, 397–403. [Google Scholar] [CrossRef]
- Endsley, M.R. Situation awareness misconceptions and misunderstandings. J. Cogn. Eng. Decis. Mak. 2015, 9, 4–32. [Google Scholar] [CrossRef]
- Rivera, J.; Talone, A.B.; Boesser, C.T.; Jentsch, F.; Yeh, M. Startle and surprise on the flight deck: Similarities, differences, and prevalence. Proc. Hum. Factors Ergon. Soc. 2014, 2014, 1047–1051. [Google Scholar] [CrossRef]
- Nguyen, T.; Lim, C.P.; Duy Nguyen, N.; Gordon-Brown, L.; Nahavandi, S.; Nguyen, N.D.; Gordon-Brown, L.; Nahavandi, S. A Review of Situation Awareness Assessment Approaches in Aviation Environments. IEEE Syst. J. 2019, 13, 3590–3603. [Google Scholar] [CrossRef]
- Wickens, C.D. Situation awareness: Its applications value and its fuzzy dichotomies. J. Cogn. Eng. Decis. Mak. 2015, 9, 90–94. [Google Scholar] [CrossRef]
- Shappell, S.A.; Wiegmann, D.A. The Human Factors Analysis and Classification System—HFACS. Security 2000, 737, 19. [Google Scholar] [CrossRef]
- Zacharias, G.; Miao, A.; Illgen, C.; Yara, J.; Siouris, G. SAMPLE: Situation awareness model for pilot in-the-loop evaluation. In Proceedings of the 1st Annual Conference on Situation Awareness in the Tactical Air Environment, Cambridge, MA, USA, 12 December 1996. [Google Scholar]
- Horrey, W.J.; Wickens, C.D.; Consalus, K.P. SEEV Model of Visual Attention Allocation 2003. Available online: http://usd-apps.usd.edu/coglab/schieber/psyc792/ppt/Wickens2003.pdf (accessed on 16 January 2022).
- Balog, C.R. Human Cognitive Performance. ICAO Dealing with Unexpected Events (DUE) Working Group, Montreal, Canada, 20–22 May 2014. pp. 1–13. Available online: https://www.icao.int/Meetings/LOCI/Presentations/Dealing%20with%20Unexpected%20Events%20Human%20Cognitive%20Performance.pdf (accessed on 16 January 2022).
- Peysakhovich, V.; Lefrançois, O.; Dehais, F.; Causse, M. The Neuroergonomics of Aircraft Cockpits: The Four Stages of Eye-Tracking Integration to Enhance Flight Safety. Safety 2018, 4, 8. [Google Scholar] [CrossRef]
- Ancel, E.; Shih, A.T. The Analysis of the Contribution of Human Factors to the In-flight Loss of Control Accidents. In Proceedings of the 12th AIAA Aviation Technology, Integration, and Operations (ATIO) Conference and 14th AIAA/ISSMO Multidisciplinary Analysis and Optimization Conference, Indianapolis, Indiana, 17–19 September 2012; pp. 1–13. [Google Scholar]
- Lower, M.; Magott, J.; Skorupski, J. A System-Theoretic Accident Model and Process with Human Factors Analysis and Classification System taxonomy. Saf. Sci. 2018, 110, 393–410. [Google Scholar] [CrossRef]
- Milburn, N.J.; Dobbins, L.; Pounds, J.; Goldman, S. Mining for Information in Accident Data. Tech. Rep. 2006, 1–11. Available online: https://www.faa.gov/data_research/research/med_humanfacs/oamtechreports/2000s/2006/200626/ (accessed on 16 January 2022).
- Wiegmann, D.A.; Shappell, S.A. Applying the Human Factors Analysis and Classification System (HFACS) to the analysis of commercial aviation accident data. In Proceedings of the 11th International Symposium on Aviation Psychology, Columbus, OH, USA, 5–8 March 2001. [Google Scholar]
- Wiegmann, D.; Shappell, S.; Boquet, A.; Detwiler, C.; Holcomb, K.; Faaborg, T. Human Error and General Aviation Accidents: A Comprehensive, Fine-Grained Analysis Using HFACS; Technical Report No DOT/FAA/AM-05/24; Federal Aviation Administration, Office of Aerospace Medicine: Washington, DC, USA, 2005.
- Tyler, S.W.; Neukom, C.; Logan, M.; Shively, J. The MIDAS Human Performance Model. Proc. Hum. Factors Ergon. Soc. Annu. Meet. 1998, 42, 320–324. [Google Scholar] [CrossRef]
- Boring, R.L. Modeling Human Reliability Analysis Using MIDAS. In Proceedings of the International Workshop on Future Control Station Designs and Human, Halden, Norway, 8–10 May 2006. [Google Scholar]
- Gore, B.F.; Hooey, B.L.; Wickens, C.D.; Scott-Nash, S. A computational implementation of a human attention guiding mechanism in MIDAS v5. In International Conference on Digital Human Modeling; Springer: Berlin/Heidelberg, Germany, 2009; Volume 5620, pp. 237–246. [Google Scholar] [CrossRef]
- Gore, B.; Hooey, B.; Foyle, D. NASA’s Use of Human Performance Models for NextGen Concept Development and Evaluations. In Proceedings of the 20th Behavior Representation in Modeling & Simulation (BRIMS) Conference 2011, Sundance, Utah, 1–24 March 2011; Volume 20, pp. 1–5. [Google Scholar]
- Svensson, Å. Air Traffic Controllers’ Work-Pattern during Air Traffic Control Tower Simulations: A Eye-Tracking Study of Air Traffic Controllers’ Eye-Movements during Arrivals. 2015, 1–63. Available online: http://liu.diva-portal.org/smash/get/diva2:821649/FULLTEXT01.pdf (accessed on 16 January 2022).
- Graham, B. Data, Baseline and Predictability supporting the Runway Safety Team 2014. In Proceedings of the ICAO Middle East Regional Runway Safety Seminar, Dubai, United Arab Emirates, 2–4 June 2014. [Google Scholar]
- Federal Aviation Administration. National Runway Safety Report; Federal Aviation Administration: Washington, DC, USA, 2015. Available online: https://libraryonline.erau.edu/online-full-text/faa-miscellaneous/FAA-Runway-Safety-Report-2013-2014.pdf (accessed on 16 January 2022).
- Napoles, G.; Espinoza, L.M.; Grau, I. FCM Expert 1.0.0—A Software Tool for Fuzzy Cognitive Maps. 2017, 1–18. Available online: https://www.researchgate.net/project/FCM-Expert-A-software-tool-for-Fuzzy-Cognitive-Maps (accessed on 16 January 2022).
- Wickens, C.D. Noticing Events in the Visual Workplace: The SEEV and NSEEV Models. Camb. Handb. Appl. Percept. Res. 2015, 2, 749–768. [Google Scholar] [CrossRef]
- Gollan, B.; Gollan, B.; Ferscha, A. SEEV-Effort—Is it Enough to Model Human Attentional Behavior in Public Display Settings. Futur. Comput. 2016, 8, 1–7. [Google Scholar]
- Haslbeck, A.; Bengler, K. Pilots’ gaze strategies and manual control performance using occlusion as a measurement technique during a simulated manual flight task. Cogn. Technol. Work 2016, 18, 529–540. [Google Scholar] [CrossRef]
- Hooey, B.; Gore, B.; Wickens, C. Modeling Pilot Situation Awareness. In Human Modelling in Assisted Transportation; Springer: Milano, Italy, 2011; pp. 207–213. [Google Scholar] [CrossRef]
- Stylios, C.D.; Groumpos, P.P. Mathematical formulation of fuzzy cognitive maps. In Proceedings of the 7th Mediterranean Conference on Control and Automation, Haifa, Israel, 28–30 June 1999; pp. 2251–2261. [Google Scholar]
- Gray, S.A.; Gray, S.; Cox, L.J.; Henly-Shepard, S. Mental Modeler: A fuzzy-logic cognitive mapping modeling tool for adaptive environmental management. In Proceedings of the 2013 46th Hawaii International Conference on System Sciences, Wailea, HI, USA, 27–10 January 2013; pp. 965–973. [Google Scholar] [CrossRef]
- Nalchigar, S.; Nasserzadeh, S.M.R.; Akhgar, B. Simulating strategic information systems planning process using fuzzy cognitive map. Int. J. Bus. Inf. Syst. 2011, 8, 286. [Google Scholar] [CrossRef]
- Ahmadi, S.; Yeh, C.-H.; Martin, R.; Papageorgiou, E. An FCM-fuzzy AHP approach to estimating organizational readiness for implementing an ERP system. In Proceedings of the 20th Americas Conference on Information Systems, AMCIS 2014, Savannah, GA, USA, 7–9 August 2014; pp. 1–11. [Google Scholar] [CrossRef]
- Papageorgiou,, E.I. Fuzzy Cognitive Maps for Applied Sciences and Engineering; Kacprzyk, J., Jain, L.C., Eds.; Springer: Berlin/Heidelberg, Germany, 2014; ISBN 9783642397387. [Google Scholar]
- Mago, V. Fuzzy Logic and Fuzzy Cognitive Map 2011. Available online: http://www.sfu.ca/~vdabbagh/fuzzy.pdf (accessed on 16 January 2022).
- Papageorgiou, E.I. Fuzzy Cognitive Maps for Decision Support. Appl. Soft Comput. 2011, 11, 3643–3657. [Google Scholar] [CrossRef]
- Papageorgiou, E.I. Learning Algorithms for Fuzzy Cognitive Maps—A Review Study. IEEE Trans. Syst. Man Cybern. Part C Appl. Rev. 2014, 42, 150–163. [Google Scholar] [CrossRef]
- Federal Aviation Administration. Chapter 2 Aeronautical Decision-Making. In Pilots Handbook of Aeronautical Knowledge; Federal Aviation Administration: Washington, DC, USA, 2016; pp. 1–32. [Google Scholar]
- Venkatesh, T.N.; Mathew, J. The problem of clear air turbulence: Changing perspectives in the understanding of the phenomenon. Sadhana-Acad. Proc. Eng. Sci. 2013, 38, 707–722. [Google Scholar] [CrossRef]
- U.S. Department of Transportation. Federal Aviation Administration; Federal Aviation Administration Advisory Circular AC00-30C-Clear Air Turbulence Avoidance. Aviation 2016, 1, 1–9. [Google Scholar]
- Skybrary Clear Air Turbulence (CAT). Available online: https://skybrary.aero/articles/clear-air-turbulence-cat (accessed on 12 August 2020).
- Tamminga, C.A. Frontal Cortex Function. J. Clin. Neurosci. 2004, 11, 515–516. [Google Scholar] [CrossRef]
- Ferrè, E.R.; Bottini, G.; Iannetti, G.D.; Haggard, P. The balance of feelings: Vestibular modulation of bodily sensations. Cortex 2013, 49, 748–758. [Google Scholar] [CrossRef] [PubMed]
- Orasanu, J.F.U. Finding Decisions in Natural Environments: The View from the Cockpit. In Naturalistic Decision Making; Psychology Press: East Sussex, UK, 1997; pp. 343–357. [Google Scholar] [CrossRef]
- Klein, G. Naturalistic Decision Making: Implications for Design; Klein Associates Inc.: Fairborn OH, USA, 1993; Volume 37, pp. 368–371. [Google Scholar] [CrossRef]
- Klein, G.; Associates, K.; Ara, D. Libro Naturalistic Decision Making. Hum. Factors 2008, 50, 456–460. [Google Scholar] [CrossRef] [PubMed]
- Martin, W. Emergency Stress: Improving Pilot Performance during Unexpected Critical Events. Available online: https://pacdeff.com/pdfs/W%20Martin%20Queenstown%20Presentation.pdf (accessed on 16 January 2022).
- Boeing Aerodynamic Principles of Large-Airplane Upsets. Available online: http://www.boeing.com/commercial/aeromagazine/aero_03/textonly/fo01txt.html (accessed on 20 February 2014).
- Brooks, R.; Edwards, J.; Kochan, J.; Ransbury, P.; Stowell, R. Maintaining aircraft control Pilot-Induced Upsets. 2012, 1–9. Available online: https://www.safepilots.org/documents/Maintaining_Aircraft_Control_20Jun2012.pdf (accessed on 16 January 2022).
- Barbagallo, J. Advisory Circular: Upset Prevention and Recovery Training; Federal Aviation Administration: Washington, DC, USA, 2015.
- Ryffel, C.P.; Muehlethaler, C.M.; Huber, S.M.; Elfering, A. Eye tracking as a debriefing tool in upset prevention and recovery training (UPRT) for general aviation pilots. Ergonomics 2019, 62, 319–329. [Google Scholar] [CrossRef] [PubMed]
- Stylios, C.D.; Georgopoulos, V.; Groumpos, P.P. Fuzzy Cognitive Map Approach to Process Control Systems. J. Adv. Comp. Intell. 1999, 3, 409–417. [Google Scholar] [CrossRef]
- Gavalec, M.; Mls, K. Evaluation of Subjective Preferences By Fuzzy Cognitive Maps of Semi-Autonomous Decision Making Systems. In Proceedings of the International Symposium on the Analytic Hierarchy Multicriteria for Decision Making, Sorrento, Italy, 15–18 June 2011; pp. 1–6. [Google Scholar]
- Maya, D.N.; Kurt, R.E.; Turan, O. Application of fuzzy cognitive maps to investigate the contributors of maritime collision accidents. In Proceedings of the 7th Transport Research Arena (TRA) 2018, Vienna, Austria, 16–19 April 2018; p. 44. [Google Scholar]
- Stach, W.; Kurgan, L.; Pedrycz, W.; Reformat, M.Z. Evolutionary Development of Fuzzy Cognitive Maps. In Proceedings of the 14th IEEE International Conference on Fuzzy Systems, Reno, NV, USA, 25–25 May 2005; pp. 619–624. [Google Scholar] [CrossRef]
- Felix, G.; Nápoles, G.; Falcon, R.; Froelich, W.; Vanhoof, K.; Bello, R. A review on methods and software for fuzzy cognitive maps. Artif. Intell. Rev. 2017, 52, 1707–1737. [Google Scholar] [CrossRef]
- Devadoss, A.V.; Prabakaran, R.; Felix, A. A Hybrid Scenario FCM with VIKOR Technique for Ranking the Factors. Int. J. Pure Appl. Math. 2018, 119, 233–244. [Google Scholar]
- Nápoles, G.; Concepción, L.; Falcon, R.; Bello, R.; Vanhoof, K. On the accuracy-convergence tradeoff in sigmoid fuzzy cognitive maps. IEEE Trans. Fuzzy Syst. 2018, 26, 2479–2484. [Google Scholar] [CrossRef]
- Zhong, H.; Miao, C.; Shen, Z.; Feng, Y. Temporal fuzzy cognitive maps. In Proceedings of the 2008 IEEE International Conference on Fuzzy Systems (IEEE World Congress on Computational Intelligence), Hong Kong, 23 September 2008; pp. 1831–1840. [Google Scholar] [CrossRef]
- Demjén, E.; Aboši, V.; Tomori, Z. Eye tracking using artificial neural networks for human computer interaction. Physiol. Res. 2011, 60, 841–844. [Google Scholar] [CrossRef] [PubMed]
- Papageorgiou, E.I.I.; Salmeron, J.L. A Review of Fuzzy Cognitive Maps Research During the Last Decade. IEEE Trans. Fuzzy Syst. 2013, 21, 66–79. [Google Scholar] [CrossRef]
- Napoles, G.; Grau, I.; Perez-Garcia, R.; Bello, R. Learning of Fuzzy Cognitive Maps for simulation and knowledge discovery. In Studies on Knowledge Discovery, Knowledge Management and Decision Making; Atlantis Press: Paris, France, 2013; pp. 27–36. [Google Scholar] [CrossRef]
- Federal Aviation Administration. FAA-P-8740-69 Aeronautical Decision Making; Federal Aviation Administration: Washington, DC, USA, 2008; pp. 1–8.
- Lundberg, J.; Johansson, J.; Forsell, C.; Josefsson, B. The Use of Conflict Detection Tools in Air Traffic Management–An Unobtrusive Eye Tracking Field Experiment during Controller Competence Assurance Air Navigation Services of Sweden. In Proceedings of the International Conference on Human-Computer Interaction in Aerospace, Santa Clara, CA, USA, 30 July–1 August 2014. [Google Scholar] [CrossRef]
- Allsop, J.; Gray, R. Flying under pressure: Effects of anxiety on attention and gaze behavior in aviation. J. Appl. Res. Mem. Cogn. 2014, 3, 63–71. [Google Scholar] [CrossRef]
- Foyle, D.C.; Hooey, B.L.; Byrne, M.D.; Corker, K.M.; Deutsch, S.; Lebiere, C.; Leiden, K.; Wickens, C.D. Human Performance Models of Pilot Behavior. Proc. Hum. Factors Ergon. Soc. Annu. Meet. 2005, 49, 1109–1113. [Google Scholar] [CrossRef]
- Landman, A.; van Oorschot, P.; van Paassen, M.M.; Groen, E.L.; Bronkhorst, A.W.; Mulder, M. Training Pilots for Unexpected Events: A Simulator Study on the Advantage of Unpredictable and Variable Scenarios. Hum. Factors 2018, 60, 793–805. [Google Scholar] [CrossRef]
- Bailey, R.E.; Ellis, K.K.E.; Stephens, C.L. Test and evaluation metrics of crew decision-making and aircraft attitude and energy state awareness. In Proceedings of the AIAA Infotech@Aerospace (I@A) Conference, Boston, MA, USA, August 19–22 2013; pp. 1–16. [Google Scholar]
- Ellis, K.K.E. Eye Tracking Metrics for Workload Estimation in Flight Deck Operations. Master’s Thesis, The University of Iowa, Iowa City, IA, USA, 2009; p. 115. [Google Scholar]
- Dehais, F.; Behrend, J.; Peysakhovich, V.; Causse, M.; Wickens, C.D. Pilot Flying and Pilot Monitoring’s Aircraft State Awareness During Go-Around Execution in Aviation: A Behavioral and Eye Tracking Study. Int. J. Aerosp. Psychol. 2017, 27, 15–28. [Google Scholar] [CrossRef]
- Di Stasi, L.L.; McCamy, M.B.; Martinez-Conde, S.; Gayles, E.; Hoare, C.; Foster, M.; Catena, A.; Macknik, S.L. Effects of long and short simulated flights on the saccadic eye movement velocity of aviators. Physiol. Behav. 2016, 153, 91–96. [Google Scholar] [CrossRef]
- Glaholt, M.G. Eye Tracking in the Cockpit: A Review of the Relationships between Eye Movements and the Aviator’s Cognitive State; DRDC-RDDC-2014-R153: Toronto, ON, Canada, 2014; pp. 1–58. [Google Scholar]
- Biloslavo, R.; Dolinšek, S. Scenario planning for climate strategies development by integrating group Delphi, AHP and dynamic fuzzy cognitive maps. Foresight 2010, 12, 38–48. [Google Scholar] [CrossRef]


| Stages | Event Sequence | Description |
|---|---|---|
| Stage 1 | Unexpected Stressor | Event occurrence to the active frame of mental operation (Thalamus) |
| Stage 2 | Stimulus to the Amygdala | Appraisal of Events |
| Stage 3 | Event intensity perception | Visual appraisal process (sympathetic nervous system and adrenal cortical systems are activated) |
| “Fast Appraisal” pathway | Wrong/incomplete information about threat intensity is adopted | |
| Stage 4 | Suboptimal gaze pattern | Ineffective Visual Acuity (Collecting wrong/irrelevant information) |
| Stage 5 | Global understanding degraded | Understanding of scenario is suboptimal/hampered |
| Stage 6 | Fight/Flight reaction | The threat is confirmed, and the reaction is a “Knee Jerk” response |
| Stage 7 | The pilot exhibits startled behavior | Poor ADM/LOC/Poor task scores in a simulator/Physiological outputs |
| Linguistic Rating Terminology (Judgement of Influence) | Triangular Fuzzy Numbers (Numerical Rating of Factor’s Influence) |
|---|---|
| Very Low Influence | 0.00, 0.00, 0.25 |
| Low Influence | 0.00, 0.25, 0.50 |
| Medium | 0.25, 0.50, 0.75 |
| High Influence | 0.50, 0.75, 1.00 |
| Very High Influence | 0.75, 1.00, 1.00 |
| Expert | Occupation |
|---|---|
| LC | Chief Engineer (Aerospace Safety Systems) |
| AR | Aerospace Design Engineer |
| MK | Aerospace Design Engineer |
| TH | Aerospace Manufacturing Engineer |
| AH | Ex-UK CAA Safety Expert |
| RM_PPL1 | Aerospace Engineer & GA Pilot |
| SP_PPL2 | Aerospace Engineer & GA Pilot |
| JS_PPL3 | Aerospace Engineer & GA Pilot |
| Concepts of Acts and Omissions | Concept Description | Rating |
|---|---|---|
| C6 | Medication/Drugs | 0.75 |
| C10 | Preparation (Pre-Flight Checks) | 0.56 |
| C11 | Awareness (CRM) | 0.56 |
| C16 | Lack of Assertiveness | 0.47 |
| C17 | Complacency | 0.41 |
| Concepts of Preconditions & Local Factors | Concept Descriptions | Rating |
| C2 | Unskilled Pilot | 0.81 |
| C4 | Faulty/Uncalibrated Instruments | 0.75 |
| C9 | Visual References | 0.63 |
| C15 | Time Pressures | 0.53 |
| C14 | Cockpit Ergonomics (Information Layout) | 0.53 |
| C13 | Distraction (Inflight) | 0.53 |
| Concepts of Supervision and Local Management | Concept Descriptions | Rating |
| C5 | Poor Situation Appraisal | 0.75 |
| C7 | Poor Communication (ATC) | 0.66 |
| C12 | Lack of ADM Knowledge/Training | 0.56 |
| Concepts of Organizational Influences | Concept Descriptions | Rating |
| C1 | Insufficient Training | 0.84 |
| C3 | Fatigue/Tiredness | 0.78 |
| C8 | Stress | 0.66 |
| C18 | Norms (Familiarity) | 0.41 |
| C19 | Part 91 Rules | 0.25 |
| Concepts | Causal Factors (Independent Variables) | LC | AR | MK | TH | AH | RM_ PPL1 | SP_ PPL2 | JS_ PPL3 | Ranked Mean |
|---|---|---|---|---|---|---|---|---|---|---|
| C1 | Insufficient Training/Lack of Concurrency | 0.75 | 0.75 | 0.75 | 0.75 | 1.00 | 1.00 | 1.00 | 0.75 | 0.84 |
| C2 | Unskilled Pilot (Not rated for Aircraft Type for instance) | 0.75 | 1.00 | 0.75 | 0.75 | 0.75 | 1.00 | 1.00 | 0.50 | 0.81 |
| C3 | Fatigue/Tiredness | 0.50 | 0.75 | 0.50 | 1.00 | 1.00 | 1.00 | 0.75 | 0.75 | 0.78 |
| C4 | Faulty/Uncalibrated Instrument Readings | 1.00 | 0.75 | 0.75 | 1.00 | 1.00 | 1.00 | 0.25 | 0.25 | 0.75 |
| C5 | Appraisal of Evolving Situation | 0.75 | 1.00 | 0.75 | 1.00 | 1.00 | 0.50 | 0.50 | 0.50 | 0.75 |
| C6 | Medication/Drugs | 1.00 | 0.75 | 0.50 | 0.25 | 1.00 | 1.00 | 0.50 | 1.00 | 0.75 |
| C7 | Communication (ATC) | 1.00 | 0.75 | 1.00 | 0.50 | 1.00 | 0.50 | 0.25 | 0.25 | 0.66 |
| C8 | Stress | 0.50 | 0.75 | 0.75 | 0.50 | 0.75 | 0.75 | 0.75 | 0.50 | 0.66 |
| C9 | Availability of Visual References | 0.75 | 0.75 | 0.50 | 0.75 | 0.75 | 0.75 | 0.25 | 0.50 | 0.63 |
| C10 | Preparation (Flight/Route Planning, Pre-Flight checks) | 1.00 | 0.25 | 0.50 | 1.00 | 1.00 | 0.25 | 0.25 | 0.25 | 0.56 |
| C11 | Resource Awareness/Crew Resource Management (CRM) | 0.25 | 0.50 | 0.25 | 0.75 | 1.00 | 0.75 | 0.25 | 0.75 | 0.56 |
| C12 | Lack of ADM knowledge (Perceive–Process–Perform) | 0.25 | 0.50 | 0.25 | 0.50 | 1.00 | 0.50 | 0.75 | 0.75 | 0.56 |
| C13 | Distractions (Phone Call, In-Flight Conversations) | 0.75 | 0.50 | 0.5 | 0.25 | 1.00 | 0.50 | 0.5 | 0.25 | 0.53 |
| C14 | Cockpit Ergonomics/Information Layout | 0.50 | 0.50 | 0.25 | 0.75 | 1.00 | 0.25 | 0.25 | 0.75 | 0.53 |
| C15 | Time Pressures | 0.50 | 0.50 | 0.25 | 0.25 | 1.00 | 0.50 | 0.50 | 0.75 | 0.53 |
| C16 | Lack of Assertiveness | 0.50 | 0.75 | 0.25 | 0.25 | 1.00 | 0.50 | 0.25 | 0.25 | 0.47 |
| C17 | Complacency (Route Familiarity) | 0.75 | 0.50 | 0.00 | 0.25 | 1.00 | 0.50 | 0.25 | 0.00 | 0.41 |
| C18 | Norms | 0.25 | 0.50 | 0.25 | 0.25 | 1.00 | 0.25 | 0.25 | 0.50 | 0.41 |
| C19 | Part 91 Rules (Less Stringent Rules) | 0.50 | 0.00 | 0.25 | 0.00 | 0.50 | 0.25 | 0.50 | 0.00 | 0.25 |
| Mapping | Description |
|---|---|
| 1 < > 12 | Insufficient Training—Lack of ADM |
| 1 < > 5 | Insufficient Training—Poor Situation Appraisal |
| 1 < > 2 | Insufficient Training—Unskilled Pilot |
| 6 < > 5 | Medication/Drugs—Poor Situation Appraisal |
| 6 < > 7 | Medication/Drugs—Poor Communication (ATC/Other Aircraft) |
| 6 < > 16 | Medication/Drugs—Lack of Assertiveness during emergency |
| 2 < > 10 | Unskilled Pilot—Poor Preparation (Pre-Flight Checks) |
| 2 < > 16 | Unskilled Pilot—Lack of Assertiveness |
| 2 < > 11 | Unskilled Pilot—Poor Crew Resource Management (CRM) |
| 2 < > 5 | Unskilled Pilot—Poor Situation Appraisal |
| 5 < > 16 | Poor Situation Appraisal—Lack of Assertiveness |
| 15 < > 8 | Time Pressures—Stress |
| 9 < > 5 | Visual References (Unavailable due to weather)—Poor Situation Appraisal |
| 4 < > 12 | Faulty/Uncalibrated Instruments—Poor ADM |
| 13 < > 7 | Distractions—Poor Communication (with ATC/Other Aircraft) |
| 3 < > 5 | Fatigue/Tiredness—Poor Situation Appraisal |
| 14 < > 5 | Cockpit Ergonomics (Usability and effectiveness)—Poor Situation Appraisal |
| 14 < > 7 | Cockpit Ergonomics—Poor Communication |
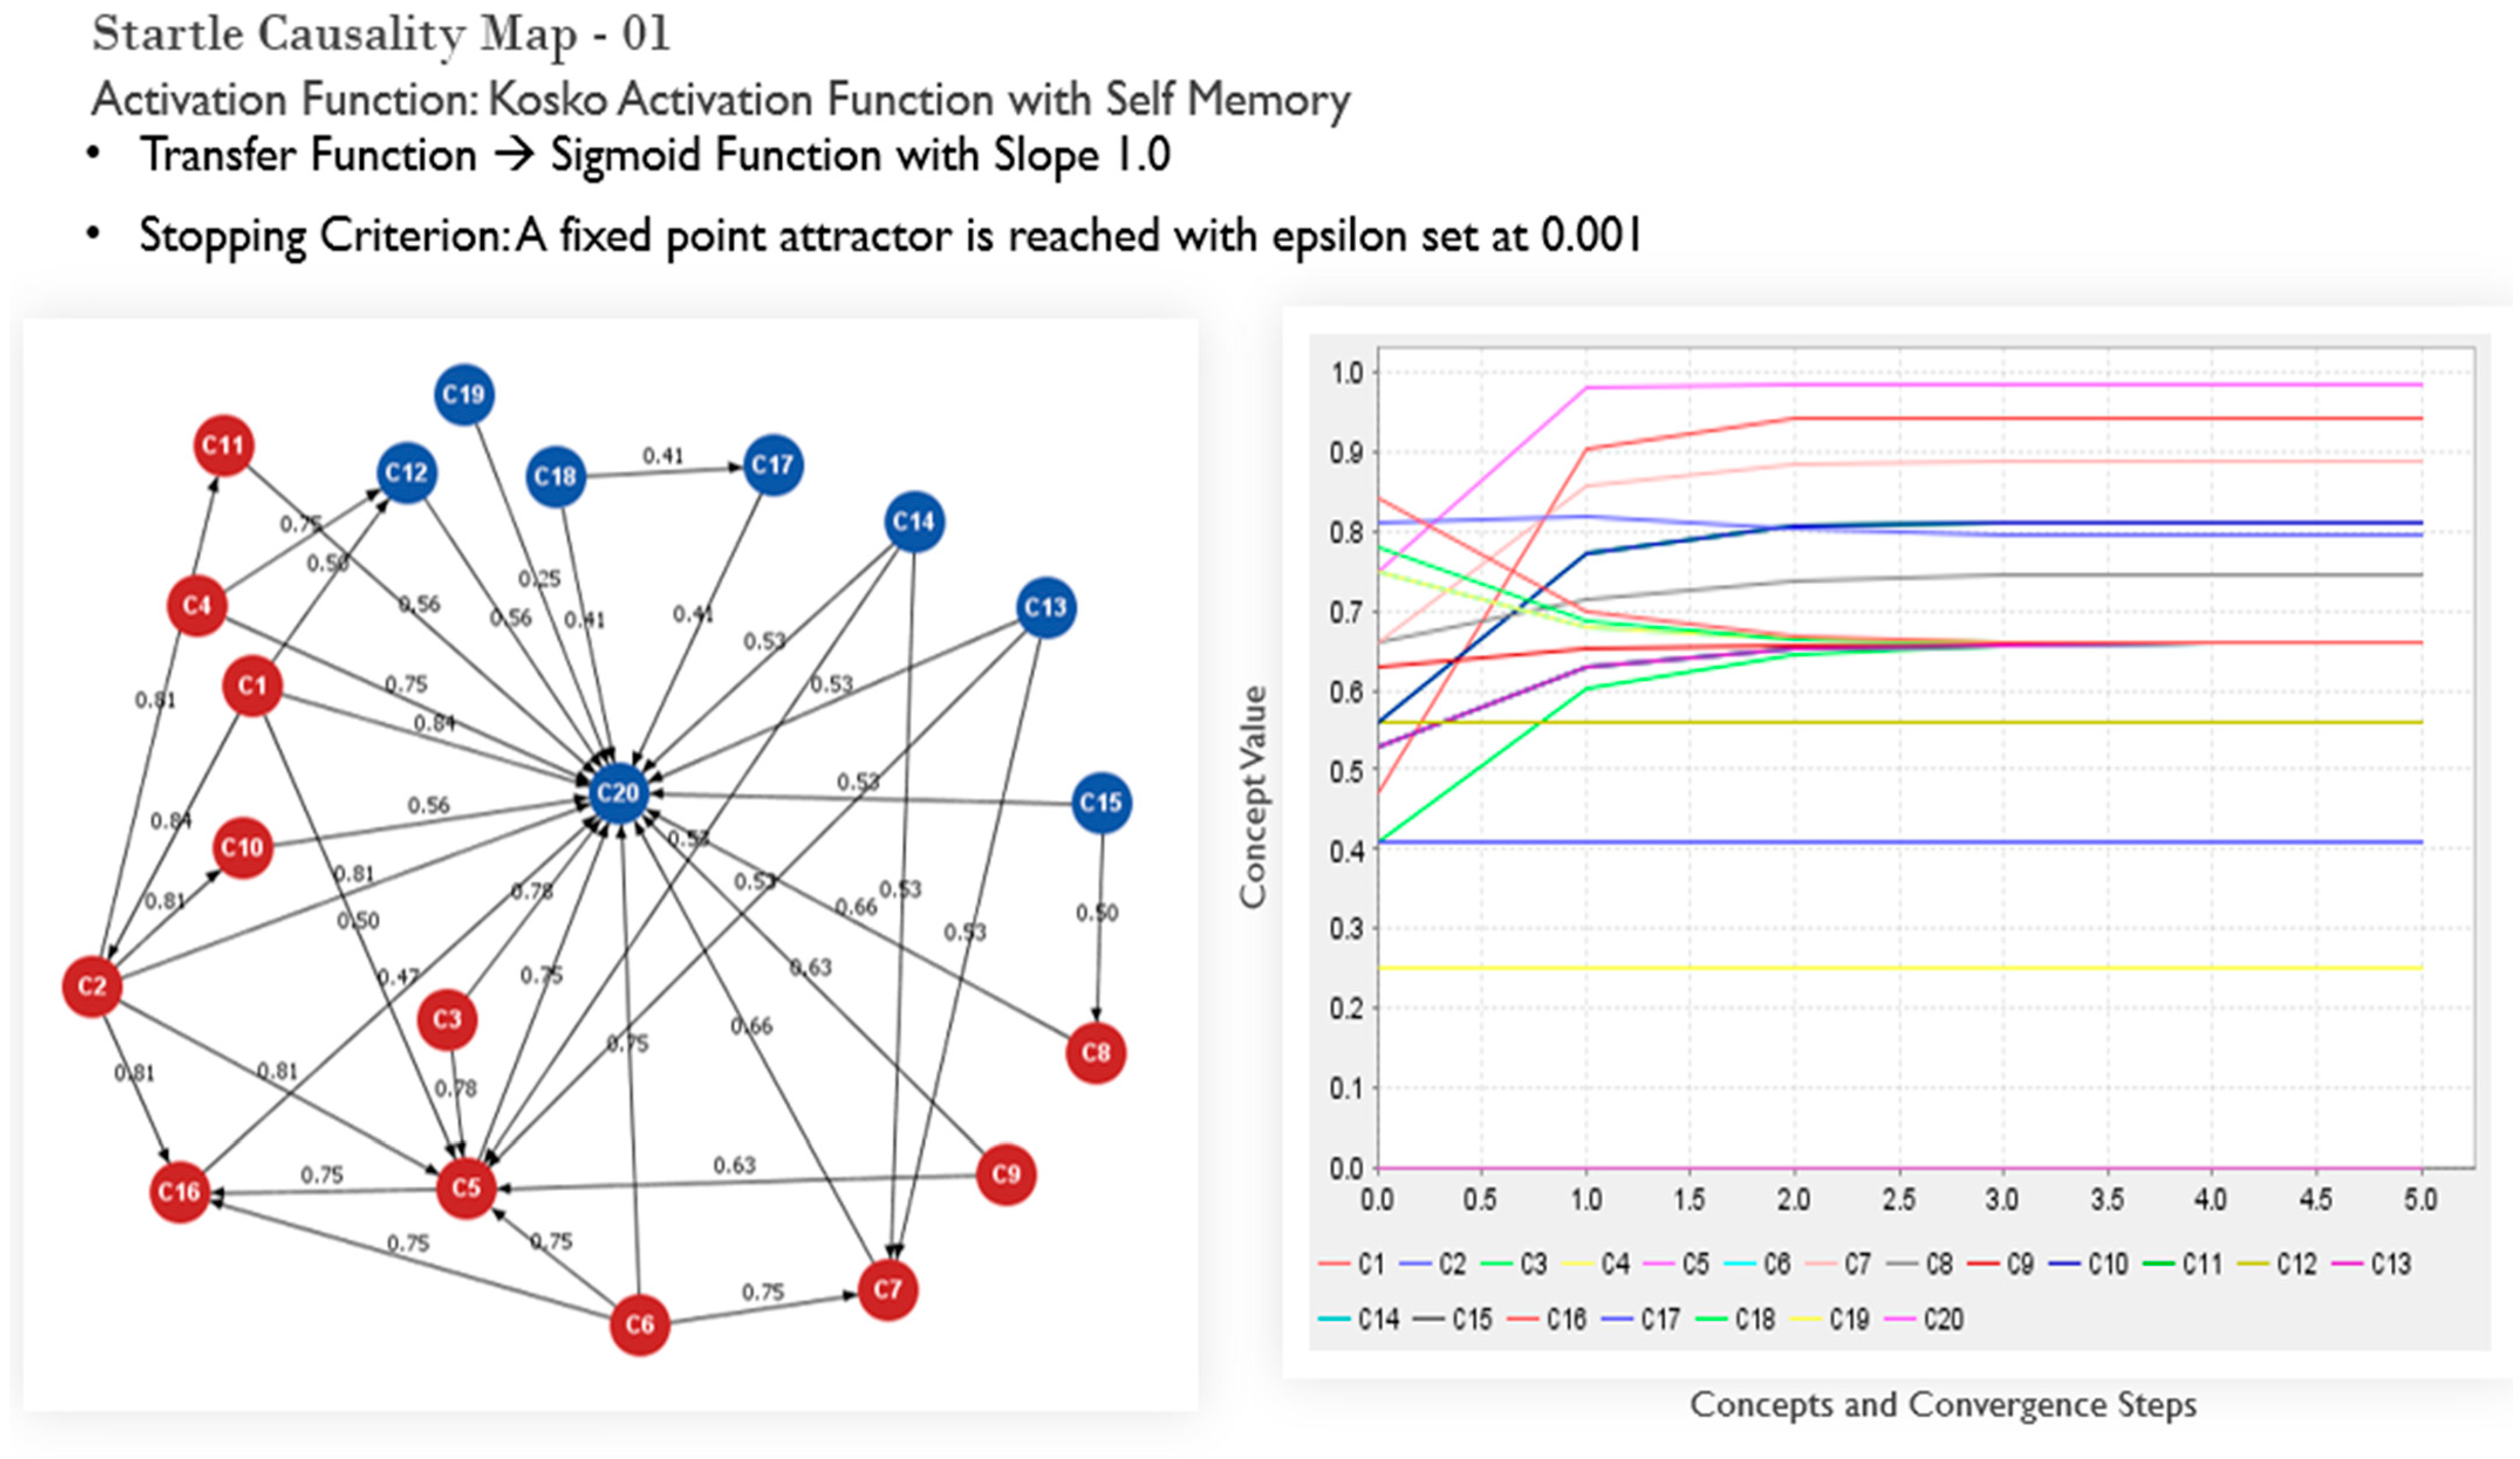
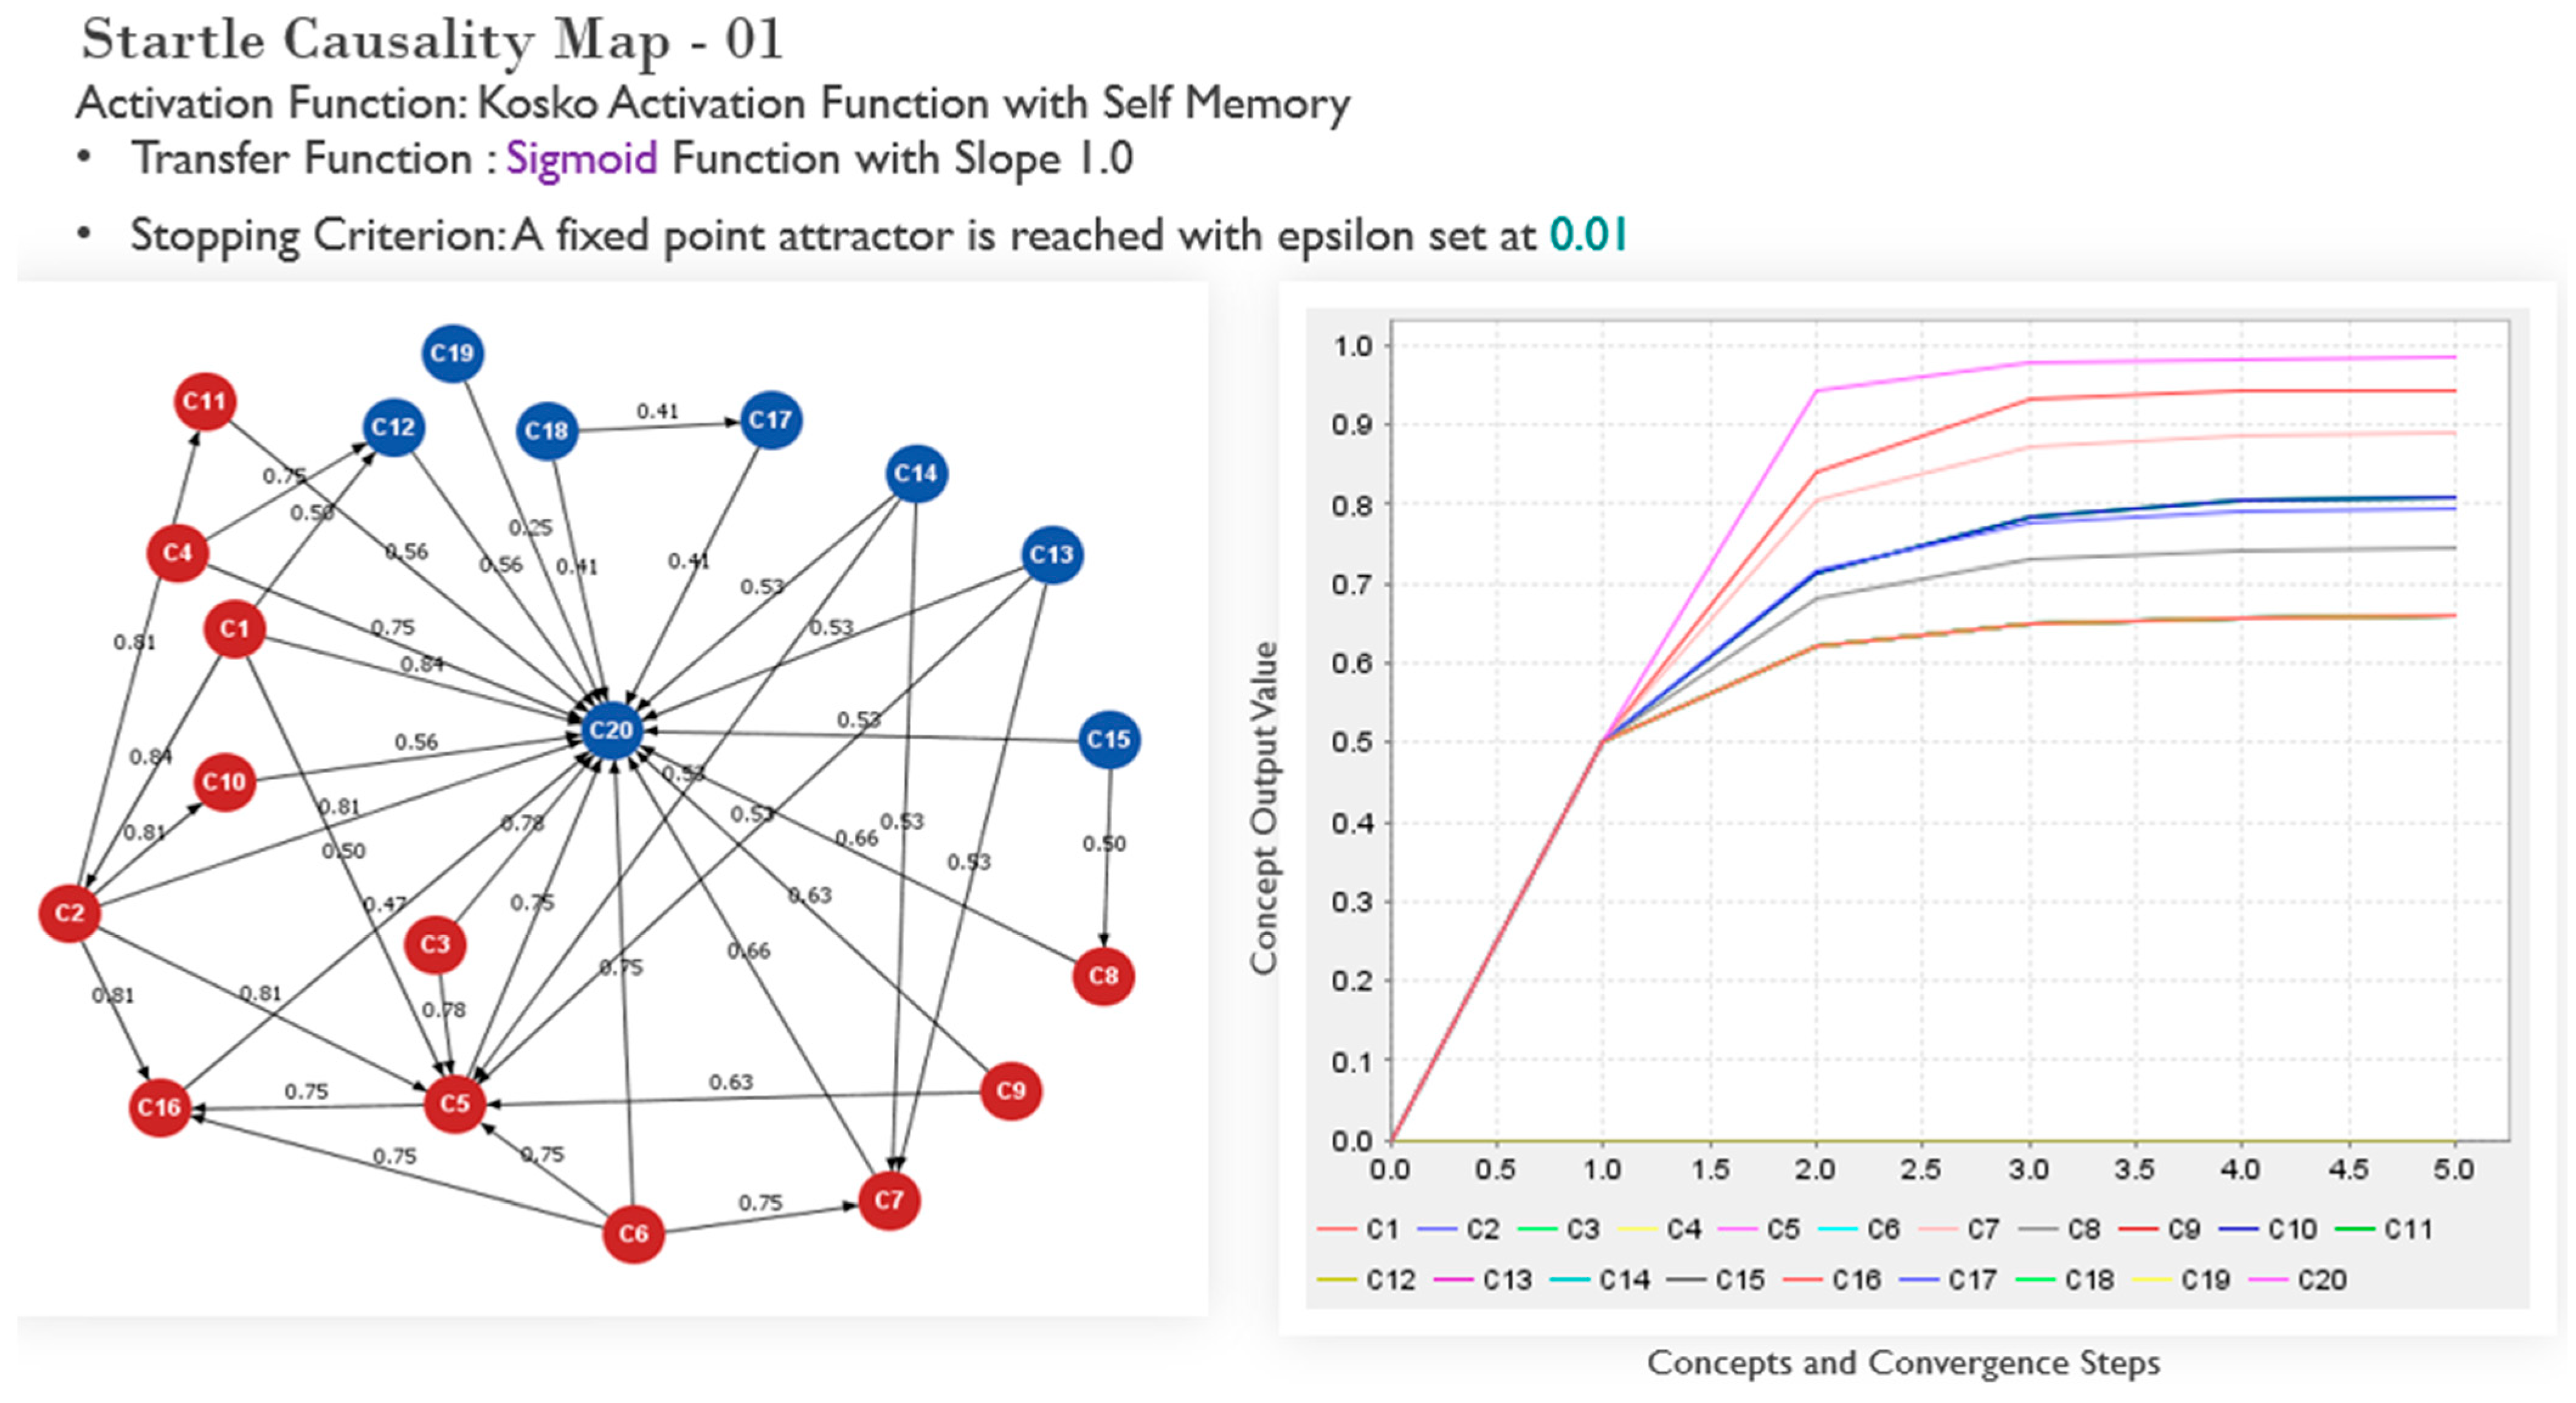
| FCM | Activation Function | Slope | Offset | Epsilon | Steps | 1st | 2nd | 3rd | 4th |
|---|---|---|---|---|---|---|---|---|---|
| Test1 | Sigmoid | 1.0 | 1.0 | 0.001 | 5 | 5 | 9 | 7 | 2 |
| Test2 | Sigmoid | 1.0 | 1.0 | 0.010 | 5 | 5 | 1 | 7 | 2 |
| Test3 | Sigmoid | 1.0 | 0.3 | 0.001 | 8 | 5 | 2 | 1 | 16 |
| Test4 | Sigmoid | 4.5 | 0.5 | 0.001 | 8 | 5 | 1 | 10 | 7 |
| Test5 | Sigmoid | 5.5 | 0.5 | 0.001 | 22 | 7 | 15 | 1 | 10 |
| FCM | Activation Function | Slope | Offset | Epsilon | Steps | 1st | 2nd | 3rd | 4th |
|---|---|---|---|---|---|---|---|---|---|
| LBTest1 | Sigmoid | 1 | 1 | 0.01 | 8 | 2 | 1 | 16 | 6 |
| LBTest2 | Sigmoid | 1 | 1 | 0.10 | 8 | 7 | 1 | 16 | 6 |
| LBTest3 | Sigmoid | 2 | 1 | 0.10 | 17 | 2 | 2 | 16 | 6 |
| FCM | Activation | Slope | Offset | Epsilon | Steps | 1st | 2nd | 3rd | 4th |
|---|---|---|---|---|---|---|---|---|---|
| LB-A-001 | Sigmoid | 2 | 1 | 0.001 | 8 | 2 | 6 | 1 | 9 |
| LB-A-002 | Sigmoid | 2 | 1 | 0.001 | 7 | 9 | 5 | 3 | 1 |
| LB-A-003 | Sigmoid | 2 | 1 | 0.001 | 8 | 6 | 1 | 10 | 2 |
| LB-A-004 | Sigmoid | 2 | 1 | 0.001 | 7 | 12 | 2 | 13 | 14 |
| LB-A-005 | Sigmoid | 2 | 1 | 0.001 | 12 | 16 | 12 | 9 | 2 |
| LB-A-006 | Sigmoid | 2 | 1 | 0.001 | 9 | 1 | 13 | 15 | 14 |
| *LB-A-007 (Chaotic) 1 | Sigmoid | 2 | 1 | 0.001 | 100 | 7 | 1 | 9 | 3 |
| LB-A-008 | Sigmoid | 2 | 1 | 0.001 | 7 | 16 | 12 | 10 | 8 |
| FCM | Steps to Convergence | 1st | 2nd | 3rd | 4th |
|---|---|---|---|---|---|
| Test Output (Mode) | 5 | 5 | 1 | 7 | 2 |
| LB Test Output (Mode) | 8 | 2 | 1 | 16 | 6 |
| LB-A (Mode) | 8 | 16 | 12 | 10 | 14/2 |
Publisher’s Note: MDPI stays neutral with regard to jurisdictional claims in published maps and institutional affiliations. |
© 2022 by the authors. Licensee MDPI, Basel, Switzerland. This article is an open access article distributed under the terms and conditions of the Creative Commons Attribution (CC BY) license (https://creativecommons.org/licenses/by/4.0/).
Share and Cite
Yusuf, A.B.; Kor, A.-L.; Tawfik, H. Integrating the HFACS Framework and Fuzzy Cognitive Mapping for In-Flight Startle Causality Analysis. Sensors 2022, 22, 1068. https://doi.org/10.3390/s22031068
Yusuf AB, Kor A-L, Tawfik H. Integrating the HFACS Framework and Fuzzy Cognitive Mapping for In-Flight Startle Causality Analysis. Sensors. 2022; 22(3):1068. https://doi.org/10.3390/s22031068
Chicago/Turabian StyleYusuf, Abiodun Brimmo, Ah-Lian Kor, and Hissam Tawfik. 2022. "Integrating the HFACS Framework and Fuzzy Cognitive Mapping for In-Flight Startle Causality Analysis" Sensors 22, no. 3: 1068. https://doi.org/10.3390/s22031068
APA StyleYusuf, A. B., Kor, A.-L., & Tawfik, H. (2022). Integrating the HFACS Framework and Fuzzy Cognitive Mapping for In-Flight Startle Causality Analysis. Sensors, 22(3), 1068. https://doi.org/10.3390/s22031068