
Could an Internet-Based Foot–Ankle Therapeutic Exercise Program Modify Clinical Outcomes and Gait Biomechanics in People with Diabetic Neuropathy? A Clinical Proof-of-Concept Study
 , , , and
Abstract
1. Introduction
2. Method
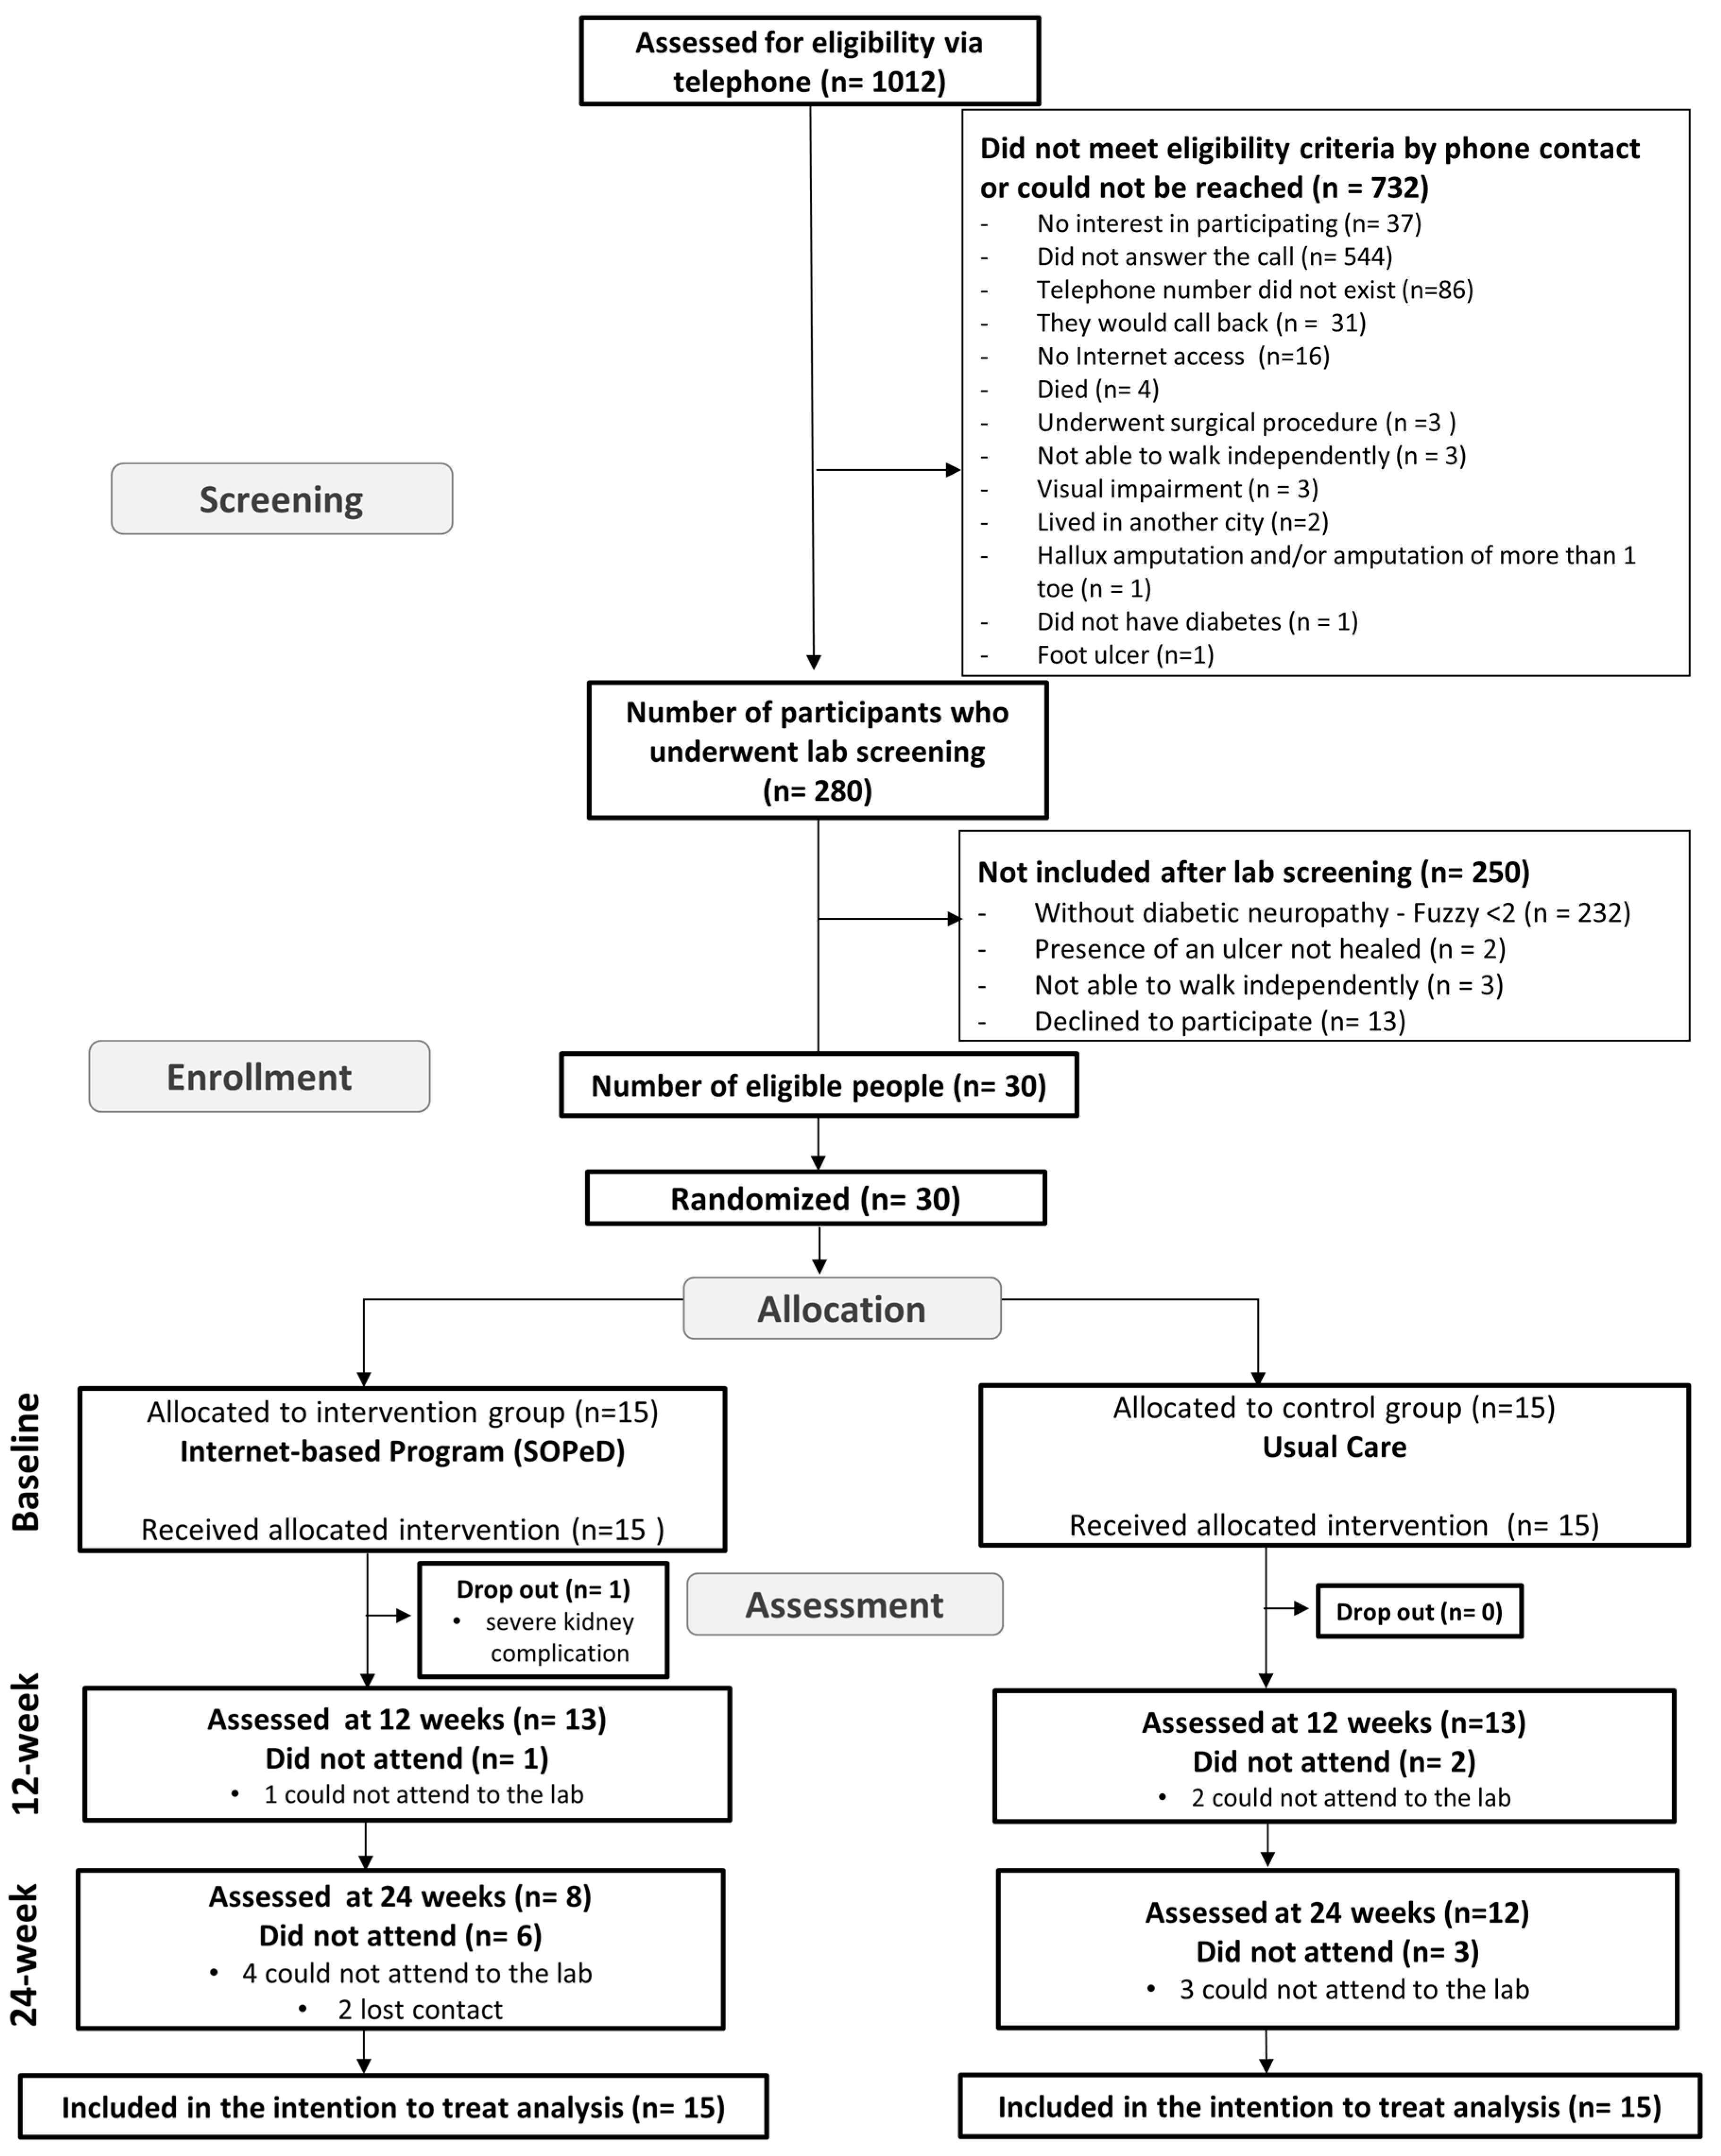
2.1. Study Design
2.2. Participants
2.3. Treatment Arms
2.4. Outcome Measures
2.5. Statistical Analysis
3. Results
4. Discussion
5. Conclusions
Supplementary Materials
Author Contributions
Funding
Institutional Review Board Statement
Informed Consent Statement
Data Availability Statement
Acknowledgments
Conflicts of Interest
References
- Pop-Busui, R.; Boulton, A.J.; Feldman, E.L.; Bril, V.; Freeman, R.; Malik, R.A.; Sosenko, J.M.; Ziegler, D. Diabetic Neuropathy: A Position Statement by the American Diabetes Association. Diabetes Care 2017, 40, 136–154. [Google Scholar] [CrossRef]
- Gordois, A.; Scuffham, P.; Shearer, A.; Oglesby, A.; Tobian, J.A. The health care costs of diabetic peripheral neuropathy in the US. Diabetes Care 2003, 26, 1790–1795. [Google Scholar] [CrossRef]
- Shun, C.T.; Chang, Y.C.; Wu, H.P.; Hsieh, S.C.; Lin, W.M.; Lin, Y.H.; Tai, T.Y.; Hsieh, S.T. Skin denervation in type 2 diabetes: Correlations with diabetic duration and functional impairments. Brain 2004, 127 Pt 7, 1593–1605. [Google Scholar] [CrossRef] [PubMed]
- Abate, M.; Schiavone, C.; Pelotti, P.; Salini, V. Limited joint mobility in diabetes and ageing: Recent advances in pathogenesis and therapy. Int. J. Immunopathol. Pharmacol. 2010, 23, 997–1003. [Google Scholar] [CrossRef] [PubMed]
- Sinacore, D.R.; Gutekunst, D.J.; Hastings, M.K.; Strube, M.J.; Bohnert, K.L.; Prior, F.W.; Johnson, J.E. Neuropathic midfoot deformity: Associations with ankle and subtalar joint motion. J. Foot Ankle Res. 2013, 6, 11. [Google Scholar] [CrossRef] [PubMed]
- Rao, S.R.; Saltzman, C.L.; Wilken, J.; Yak, H.J. Increased passive ankle stiffness and reduced dorsiflexion range of motion in individuals with diabetes mellitus. Foot Ankle Int. 2006, 27, 617–622. [Google Scholar] [CrossRef]
- Park, S.W.; Goodpaster, B.H.; Strotmeyer, E.S.; Kuller, L.H.; Broudeau, R.; Kammerer, C.; de Rekeneire, N.; Harris, T.B.; Schwartz, A.V.; Tylavsky, F.A.; et al. Accelerated loss of skeletal muscle strength in older adults with type 2 diabetes: The health, aging, and body composition study. Diabetes Care 2007, 30, 1507–1512. [Google Scholar] [CrossRef]
- Ferreira, J.S.S.P.; Panighel, J.P.; Silva, É.; Monteiro, R.L.; Cruvinel Júnior, R.H.; Sacco, I.C.N. Foot function and strength of patients with diabetes grouped by ulcer risk classification (IWGDF). Diabetol. Metab. Syndr. 2019, 11, 89. [Google Scholar] [CrossRef]
- Cheuy, V.A.; Hastings, M.K.; Commean, P.K.; Ward, S.R.; Mueller, M.J. Intrinsic foot muscle deterioration is associated with metatarsophalangeal joint angle in people with diabetes and neuropathy. Clin. Biomech. 2013, 28, 1055–1060. [Google Scholar] [CrossRef]
- Andreassen, C.S.; Jakobsen, J.; Ringgaard, S.; Ejskjaer, N.; Andersen, H. Accelerated atrophy of lower leg and foot muscles--a follow-up study of long-term diabetic polyneuropathy using magnetic resonance imaging (MRI). Diabetologia 2009, 52, 1182–1191. [Google Scholar] [CrossRef]
- Andersen, H.; Gjerstad, M.D.; Jakobsen, J. Atrophy of foot muscles: A measure of diabetic neuropathy. Diabetes Care 2004, 27, 2382–2385. [Google Scholar] [CrossRef] [PubMed]
- Mahieu, R.; Coenen, M.N.; van Bemmel, T.; van der Zaag-Loonen, H.J.; Theuvenet, W.J. Detecting intrinsic muscle weakness of the hallux as an addition to early-stage screening of the feet in patients with diabetes. Diabetes Res. Clin. Pract. 2016, 119, 83–87. [Google Scholar] [CrossRef] [PubMed]
- Bacarin, T.A.; Sacco, I.C.; Hennig, E.M. Plantar pressure distribution patterns during gait in diabetic neuropathy patients with a history of foot ulcers. Clinics 2009, 64, 113–120. [Google Scholar] [CrossRef]
- Sacco, I.C.; Hamamoto, A.N.; Tonicelli, L.M.; Watari, R.; Ortega, N.R.; Sartor, C.D. Abnormalities of plantar pressure distribution in early, intermediate, and late stages of diabetic neuropathy. Gait Posture 2014, 40, 570–574. [Google Scholar] [CrossRef] [PubMed]
- Fernando, M.E.; Crowther, R.G.; Lazzarini, P.A.; Yogakanthi, S.; Sangla, K.S.; Buttner, P.; Jones, R.; Golledge, J. Plantar pressures are elevated in people with longstanding diabetes-related foot ulcers during follow-up. PLoS ONE 2017, 12, e0181916. [Google Scholar] [CrossRef]
- Veves, A.; Murray, H.J.; Young, M.J.; Boulton, A.J. The risk of foot ulceration in diabetic patients with high foot pressure: A prospective study. Diabetologia 1992, 35, 660–663. [Google Scholar] [CrossRef]
- Monteiro-Soares, M.; Boyko, E.J.; Ribeiro, J.; Ribeiro, I.; Dinis-Ribeiro, M. Predictive factors for diabetic foot ulceration: A systematic review. Diabetes Metab. Res. Rev. 2012, 28, 574–600. [Google Scholar] [CrossRef]
- Chappell, F.M.; Crawford, F.; Horne, M.; Leese, G.P.; Martin, A.; Weller, D.; Boulton, A.J.M.; Abbott, C.; Monteiro-Soares, M.; Veves, A.; et al. Development and validation of a clinical prediction rule for development of diabetic foot ulceration: An analysis of data from five cohort studies. BMJ Open Diabetes Res. Care 2021, 9, e002150. [Google Scholar] [CrossRef]
- van Netten, J.J.; Sacco, I.C.N.; Lavery, L.A.; Monteiro-Soares, M.; Rasmussen, A.; Raspovic, A.; Bus, S.A. Treatment of modifiable risk factors for foot ulceration in persons with diabetes: A systematic review. Diabetes Metab. Res. Rev. 2020, 36 (Suppl. 1), e3271. [Google Scholar] [CrossRef]
- Cerrahoglu, L.; Koşan, U.; Sirin, T.C.; Ulusoy, A. Range of Motion and Plantar Pressure Evaluation for the Effects of Self-Care Foot Exercises on Diabetic Patients with and Without Neuropathy. J. Am. Podiatr. Med. Assoc. 2016, 106, 189–200. [Google Scholar] [CrossRef]
- Kanchanasamut, W.; Pensri, P. Effects of weight-bearing exercise on a mini-trampoline on foot mobility, plantar pressure and sensation of diabetic neuropathic feet; a preliminary study. Diabet. Foot Ankle 2017, 8, 1287239. [Google Scholar] [CrossRef] [PubMed]
- Goldsmith, J.R.; Lidtke, R.H.; Shott, S. The effects of range-of-motion therapy on the plantar pressures of patients with diabetes mellitus. J. Am. Podiatr. Med. Assoc. 2002, 92, 483–490. [Google Scholar] [CrossRef] [PubMed]
- Bus, S.A.; Lavery, L.A.; Monteiro-Soares, M.; Rasmussen, A.; Raspovic, A.; Sacco, I.C.N.; van Netten, J.J.; on behalf of the International Working Group on the Diabetic Foot. Guidelines on the prevention of foot ulcers in persons with diabetes (IWGDF 2019 update). Diabetes Metab. Res. Rev. 2020, 36 (Suppl. 1), e3269. [Google Scholar] [CrossRef] [PubMed]
- Brennan, D.; Tindall, L.; Theodoros, D.; Brown, J.; Campbell, M.; Christiana, D.; Smith, D.; Cason, J.; Lee, A. A blueprint for telerehabilitation guidelines. Int. J. Telerehabil. 2010, 2, 31–34. [Google Scholar] [CrossRef]
- van Egmond, M.A.; van der Schaaf, M.; Vredeveld, T.; Vollenbroek-Hutten, M.M.R.; van Berge Henegouwen, M.I.; Klinkenbijl, J.H.G.; Engelbert, R.H.H. Effectiveness of physiotherapy with telerehabilitation in surgical patients: A systematic review and meta-analysis. Physiotherapy 2018, 104, 277–298. [Google Scholar] [CrossRef]
- Bennell, K.L.; Nelligan, R.; Dobson, F.; Rini, C.; Keefe, F.; Kasza, J.; French, S.; Bryant, C.; Dalwood, A.; Abbott, J.H.; et al. Effectiveness of an Internet-Delivered Exercise and Pain-Coping Skills Training Intervention for Persons With Chronic Knee Pain: A Randomized Trial. Ann. Intern. Med. 2017, 166, 453–462. [Google Scholar] [CrossRef]
- Cruvinel Júnior, R.H.; Ferreira, J.S.S.P.; Beteli, R.I.; Silva, É.; Veríssimo, J.L.; Monteiro, R.L.; Suda, E.Y.; Sacco, I.C.N. Foot–ankle functional outcomes of using the Diabetic Foot Guidance System (SOPeD) for people with diabetic neuropathy: A feasibility study for the single-blind randomized controlled FOotCAre (FOCA) trial I. Pilot Feasibility Stud. 2021, 7, 87. [Google Scholar] [CrossRef]
- Jack, K.; McLean, S.M.; Moffett, J.K.; Gardiner, E. Barriers to treatment adherence in physiotherapy outpatient clinics: A systematic review. Man. Ther. 2010, 15, 220–228. [Google Scholar] [CrossRef]
- Ferreira, J.S.S.P.; Sacco, I.C.N.; Siqueira, A.A.; Almeida, M.H.M.; Sartor, C.D. Rehabilitation technology for self-care: Customised foot and ankle exercise software for people with diabetes. PLoS ONE 2019, 14, e0218560. [Google Scholar] [CrossRef]
- Eysenbach, G.; Group, C.-E. CONSORT-EHEALTH: Improving and standardizing evaluation reports of Web-based and mobile health interventions. J. Med. Internet Res. 2011, 13, e126. [Google Scholar] [CrossRef]
- Ferreira, J.S.S.P.; Cruvinel Junior, R.H.; Silva, E.Q.; Veríssimo, J.L.; Monteiro, R.L.; Pereira, D.S.; Suda, E.Y.; Sartor, C.D.; Sacco, I.C.N. Study protocol for a randomized controlled trial on the effect of the Diabetic Foot Guidance System (SOPeD) for the prevention and treatment of foot musculoskeletal dysfunctions in people with diabetic neuropathy: The FOotCAre (FOCA) trial I. Trials 2020, 21, 73. [Google Scholar] [CrossRef] [PubMed]
- Altman, D.G.; Bland, J.M. How to randomise. BMJ 1999, 319, 703–704. [Google Scholar] [CrossRef] [PubMed]
- Watari, R.; Sartor, C.D.; Picon, A.P.; Butugan, M.K.; Amorim, C.F.; Ortega, N.R.; Sacco, I.C. Effect of diabetic neuropathy severity classified by a fuzzy model in muscle dynamics during gait. J. Neuroeng. Rehabil. 2014, 11, 11. [Google Scholar] [CrossRef]
- Schaper, N.C.; van Netten, J.J.; Apelqvist, J.; Bus, S.A.; Hinchliffe, R.J.; Lipsky, B.A.; Board, I.E. Practical Guidelines on the prevention and management of diabetic foot disease (IWGDF 2019 update). Diabetes Metab. Res. Rev. 2020, 36 (Suppl. 1), e3266. [Google Scholar] [CrossRef]
- King, D.; Greaves, F.; Exeter, C.; Darzi, A. ‘Gamification’: Influencing health behaviours with games. J. R. Soc. Med. 2013, 106, 76–78. [Google Scholar] [CrossRef]
- Peek, K.; Sanson-Fisher, R.; Mackenzie, L.; Carey, M. Interventions to aid patient adherence to physiotherapist prescribed self-management strategies: A systematic review. Physiotherapy 2016, 102, 127–135. [Google Scholar] [CrossRef]
- Monteiro, R.L.; Ferreira, J.S.S.P.; Silva, É.; Cruvinel-Júnior, R.H.; Veríssimo, J.L.; Bus, S.A.; Sacco, I.C.N. Foot–ankle therapeutic exercise program can improve gait speed in people with diabetic neuropathy: A randomized controlled trial. Sci. Rep. 2022, 12, 7561. [Google Scholar] [CrossRef]
- Sartor, C.D.; Oliveira, M.D.; Campos, V.; Ferreira, J.S.S.P.; Sacco, I.C.N. Cross-cultural adaptation and measurement properties of the Brazilian Version of the Michigan Neuropathy Screening Instrument. Braz. J. Phys. Ther. 2018, 22, 222–230. [Google Scholar] [CrossRef]
- Ferreira, A.F.; Laurindo, I.M.; Rodrigues, P.T.; Ferraz, M.B.; Kowalski, S.C.; Tanaka, C. Brazilian version of the foot health status questionnaire (FHSQ-BR): Cross-cultural adaptation and evaluation of measurement properties. Clinics 2008, 63, 595–600. [Google Scholar] [CrossRef]
- Mickle, K.J.; Munro, B.J.; Lord, S.R.; Menz, H.B.; Steele, J.R. ISB Clinical Biomechanics Award 2009: Toe weakness and deformity increase the risk of falls in older people. Clin. Biomech. 2009, 24, 787–791. [Google Scholar] [CrossRef]
- Menz, H.B. Analysis of paired data in physical therapy research: Time to stop double-dipping? J. Orthop. Sports Phys. Ther. 2005, 35, 477–478. [Google Scholar] [CrossRef]
- Stebbins, J.; Harrington, M.; Thompson, N.; Zavatsky, A.; Theologis, T. Repeatability of a model for measuring multi-segment foot kinematics in children. Gait Posture 2006, 23, 401–410. [Google Scholar] [CrossRef]
- Elkins, M.R.; Pinto, R.Z.; Verhagen, A.; Grygorowicz, M.; Söderlund, A.; Guemann, M.; Gómez-Conesa, A.; Blanton, S.; Brismée, J.M.; Agarwal, S.; et al. Statistical inference through estimation: Recommendations from the International Society of Physiotherapy Journal Editors. J. Man. Manip. Ther. 2022, 30, 133–138. [Google Scholar] [CrossRef]
- Zimny, S.; Schatz, H.; Pfohl, M. The role of limited joint mobility in diabetic patients with an at-risk foot. Diabetes Care 2004, 27, 942–946. [Google Scholar] [CrossRef]
- Simmons, R.W.; Richardson, C.; Deutsch, K. Limited joint mobility of the ankle in diabetic patients with cutaneous sensory deficit. Diabetes Res. Clin. Pract. 1997, 37, 137–143. [Google Scholar] [CrossRef]
- Giacomozzi, C.; D'Ambrogi, E.; Cesinaro, S.; Macellari, V.; Uccioli, L. Muscle performance and ankle joint mobility in long-term patients with diabetes. BMC Musculoskelet. Disord. 2008, 9, 99. [Google Scholar] [CrossRef]
- Birke, J.A.; Franks, B.D.; Foto, J.G. First ray joint limitation, pressure, and ulceration of the first metatarsal head in diabetes mellitus. Foot Ankle Int. 1995, 16, 277–284. [Google Scholar] [CrossRef]
- Mueller, M.J.; Minor, S.D.; Sahrmann, S.A.; Schaaf, J.A.; Strube, M.J. Differences in the gait characteristics of patients with diabetes and peripheral neuropathy compared with age-matched controls. Phys. Ther. 1994, 74, 299–308; discussion 309–213. [Google Scholar] [CrossRef]
- Sacco, I.C.; Picon, A.P.; Macedo, D.O.; Butugan, M.K.; Watari, R.; Sartor, C.D. Alterations in the lower limb joint moments precede the peripheral neuropathy diagnosis in diabetes patients. Diabetes Technol. Ther. 2015, 17, 405–412. [Google Scholar] [CrossRef]
- Allet, L.; Armand, S.; de Bie, R.A.; Golay, A.; Monnin, D.; Aminian, K.; Staal, J.B.; de Bruin, E.D. The gait and balance of patients with diabetes can be improved: A randomised controlled trial. Diabetologia 2010, 53, 458–466. [Google Scholar] [CrossRef]
- Silva, É.; Santos, D.P.; Beteli, R.I.; Monteiro, R.L.; Ferreira, J.S.S.P.; Cruvinel-Junior, R.H.; Donini, A.; Verissímo, J.L.; Suda, E.Y.; Sacco, I.C.N. Feasibility of a home-based foot–ankle exercise programme for musculoskeletal dysfunctions in people with diabetes: Randomised controlled FOotCAre (FOCA) Trial II. Sci. Rep. 2021, 11, 12404. [Google Scholar] [CrossRef]
- Chuter, V.H.; Spink, M.J.; David, M.; Lanting, S.; Searle, A. Clinical foot measurements as a proxy for plantar pressure testing in people with diabetes. J. Foot Ankle Res. 2021, 14, 56. [Google Scholar] [CrossRef] [PubMed]
- Sartor, C.D.; Hasue, R.H.; Cacciari, L.P.; Butugan, M.K.; Watari, R.; Pássaro, A.C.; Giacomozzi, C.; Sacco, I.C. Effects of strengthening, stretching and functional training on foot function in patients with diabetic neuropathy: Results of a randomized controlled trial. BMC Musculoskelet. Disord. 2014, 15, 137. [Google Scholar] [CrossRef] [PubMed]
- Bus, S.A.; Waaijman, R.; Arts, M.; de Haart, M.; Busch-Westbroek, T.; van Baal, J.; Nollet, F. Effect of custom-made footwear on foot ulcer recurrence in diabetes: A multicenter randomized controlled trial. Diabetes Care 2013, 36, 4109–4116. [Google Scholar] [CrossRef]
- McDonald, K.A.; Stearne, S.M.; Alderson, J.A.; North, I.; Pires, N.J.; Rubenson, J. The Role of Arch Compression and Metatarsophalangeal Joint Dynamics in Modulating Plantar Fascia Strain in Running. PLoS ONE 2016, 11, e0152602. [Google Scholar] [CrossRef] [PubMed]
- Kelly, L.A.; Cresswell, A.G.; Farris, D.J. The energetic behaviour of the human foot across a range of running speeds. Sci. Rep. 2018, 8, 10576. [Google Scholar] [CrossRef] [PubMed]
- Kelly, L.A.; Farris, D.J.; Cresswell, A.G.; Lichtwark, G.A. Intrinsic foot muscles contribute to elastic energy storage and return in the human foot. J. Appl. Physiol. 2019, 126, 231–238. [Google Scholar] [CrossRef]
- Kelders, S.M.; Kok, R.N.; Ossebaard, H.C.; Van Gemert-Pijnen, J.E. Persuasive system design does matter: A systematic review of adherence to web-based interventions. J. Med. Internet Res. 2012, 14, e2104. [Google Scholar] [CrossRef]
- Grossman, M. The demand for health turns 50: Reflections. Health Econ. 2022, 31, 1807–1822. [Google Scholar] [CrossRef]


| Control Group (n = 15) Mean (SD) | Intervention Group (n = 15) Mean (SD) | |
|---|---|---|
| Age (years) | 56.5 (9.9) | 51.1 (10.2) |
| Body mass (kg) | 81.5 (18.6) | 80.0 (16.5) |
| Height (cm) | 161.0 (0.1) | 169.0 (0.1) |
| Body mass index (kg/m2) | 31.8 (8.1) | 28.0 (5.1) |
| Sex (Female) (n, %) | (F = 10/66.6%) | (F = 8/53.3%) |
| Type 2 Diabetes (number of participants, %) | 14 (93%) | 13 (86.6%) |
| Time of onset of diabetes (years) | 10.8 (7.4) | 18.8 (11.8) |
| Education (number of participants, %) | ||
| Elementary education incomplete | 0 (0%) | 1 (6.6%) |
| Elementary education complete | 2 (13.3%) | 0 (0%) |
| High school incomplete | 3 (20.1%) | 0 (0%) |
| High school complete | 7 (46.7%) | 5 (33.4%) |
| Higher education incomplete | 1 (6.6%) | 0 (0%) |
| Higher education complete | 2 (13.3%) | 9 (60.0%) |
| Socioeconomic status (number of participants, %) | ||
| 1 to 3 Brazilian minimum salary/month | 13 (86.7%) | 7 (46.7%) |
| 3 to 5 Brazilian minimum salary/month | 2 (13.3%) | 1 (6.6%) |
| Up to 5 Brazilian minimum salary/month | 0 (0%) | 7 (46.7%) |
| DPN symptoms (MNSI score) | 6.9 (1.5) | 7.3 (1.8) |
| DPN severity (Fuzzy score) | 3.5 (1.8) | 4.3 (2.3) |
| Tactile sensitivity (number of areas, Median [IQR]) | 0 [0–0] | 0 [0–1] |
| Vibration Perception (number of participants, %) | ||
| absent-L | 1 (6.6%) | 5 (33.3%) |
| reduced-L | 0 (0%) | 3 (20%) |
| absent-R | 3 (20%) | 3 (20%) |
| reduced-R | 2 (13.3%) | 4 (26.6%) |
| FHSQ (score) | ||
| Foot pain | 39.8 (21.3) | 50.9 (22.5) |
| Foot function | 56.2 (27.2) | 68.7 (24.1) |
| Shoes | 41.7 (37.8) | 59.4 (37.8) |
| Foot health | 22.5 (19.8) | 15.8 (12.0) |
| Foot Strength (%BW) | ||
| Hallux | 17.0 (6.8) | 10.9 (4.1) |
| Toe | 10.3 (5.2) | 8.2 (3.8) |
| Intervention Group (n = 15) | Control Group (n = 15) | Between-Group Difference (CI 95%) | GEE Analysis (p-Values) | ||||||||
|---|---|---|---|---|---|---|---|---|---|---|---|
| Variables | Baseline Estimated Mean (SE) | 12-Week Estimated Mean (SE) | 24-Week Estimated Mean (SE) | Baseline Estimated Mean (SE) | 12-Week Estimated Mean (SE) | 24-Week Estimated Mean (SE) | 12-Week (Intervention X Control Group) | 24-Week (Intervention X Control Group) | Group | Time | Group X Time (Interaction Effect) |
| DPN symptoms (MNSI score) | 7.3 (0.4) | 5.1 (0.6) | 5.0 (0.6) | 6.9 (0.4) | 6.1 (0.6) | 5.4 (0.4) | −0.9 (−2.6 to 0.7) | −0.4 (−1.9 to 1.1) | 0.545 | <0.001 | 0.152 |
| DPN severity (Fuzzy score) | 4.3 (0.6) | 3.5 (0.7) | 3.7 (0.8) | 3.5 (0.5) | 3.2 (0.5) | 3.3 (0.5) | 0.2 (−1.4 to 1.9) | 0.3 (−1.5 to 2.2) | 0.534 | 0.096 | 0.534 |
| FHSQ Foot pain (score) | 50.9 (5.6) | 72.6 (6.4) * | 72.0 (8.7) | 39.8 (5.3) | 47.7 (5.8) * | 51.3 (7.8) | 24.9 (8.0 to 41.8) * | 20.7 (−43.5 to 2.1) | 0.023* | 0.002 | 0.514 |
| FHSQ Foot function (score) | 68.7 (6.0) | 80.8 (6.6) | 84.1 (6.3) # | 56.2 (6.8) | 69.6 (7.0) | 63.3 (7.9) # | 11.2 (−7.8 to 30.1) | 20.7 (0.9 to 40.5) # | 0.083 | 0.001 | 0.619 |
| FHSQ Shoes (score) | 68.6 (8.4) | 61.5 (9.1) | 68.3 (10.2) | 52.1 (9.7) | 60.9 (8.2) | 55.1 (7.7) | 0.6 (−23.4 to 24.7) | 13.2 (−11.8 to 38.2) | 0.271 | 0.976 | 0.414 |
| FHSQ Foot health (score) | 23.7 (1.2) | 41.9 (6.3) | 43.50 (7.7) | 30.7 (4.7) | 37.7 (4.5) | 42.0 (6.3) | 4.2 (−11.1 to 19.5) | 1.4 (−18.0 to 21.0) | 0.781 | 0.001 | 0.234 |
| Hallux strength—(%BW) | 10.9 (1.0) | 14.4 (1.3) | 10.0 (1.1) | 14.9 (1.7) | 14.7 (1.7) | 12.1 (1.1) | −0.3 (−4.4 to 3.8) | −2.0 (−5.0 to 0.9) | 0.640 | 0.002 | 0.064 |
| Toes strength—(%BW) | 8.2 (0.9) | 7.9 (1.0) | 8.5 (1.1) | 10.3 (1.3) | 8.7 (1.1) | 8.1 (1.4) | −0.8 (−3.7 to 2.1) | 0.4 (−3.1 to 4.0) | 0.594 | 0.343 | 0.207 |
| Intervention Group (n = 15) | Control Group (n = 15) | Between-Group Difference (CI 95%) | GEE Analysis (p-Values) | |||||||||
|---|---|---|---|---|---|---|---|---|---|---|---|---|
| Region of Interest | Variables | Baseline Estimated Mean (SE) | 12-Week Estimated Mean (SE) | 24-Week Estimated Mean (SE) | Baseline Estimated Mean (SE) | 12-Week Estimated Mean (SE) | 24-Week Estimated Mean (SE) | 12-Week (Intervention X Control Group) | 24-Week (Intervention X Control Group) | Group | Time | Group X Time (Interaction Effect) |
| Toes | Contact Area [cm2] | 9.96 (0.67) | 9.90 (0.65) | 8.15 (1.48) | 10.86 (0.86) | 10.93 (0.90) | 10.89 (1.31) | −1.02 (−3.22 to 1.16) | −2.73 (−6.63 to 1.16) | 0.173 | 0.579 | 0.607 |
| Peak [kPa] | 282.94 (38.86) | 350.65 (54.87) | 362.50 (75.14) | 307.61 (45.61) | 302.11 (47.54) | 343.86 (49.21) | 48.53 (−93.75 to 190.83) | 18.63 (−157.42 to 194.70) | 0.838 | 0.194 | 0.209 | |
| Pressure-time integral [(kPa) * s] | 88.80 (14.17) | 90.89 (14.19) | 97.32 (22.45) | 95.52 (15.72) | 90.13 (15.12) | 117.53 (21.07) | 0.76 (−39.88 to 41.41) | −20.21 (−80.57 to 40.14) | 0.683 | 0.385 | 0.593 | |
| Hallux | Contact Area [cm2] | 7.63 (0.66) | 7.94 (0.71) | 6.37 (0.40) | 8.41 (0.59) | 8.34 (0.57) | 6.71 (0.49) | −0.39 (−2.19 to 1.39) | −0.33 (−1.59 to 0.56) | 0.441 | <0.001 | 0.911 |
| Peak [kPa] | 337.00 (35.28) | 378.33 (54.69) | 186.89 (26.25) | 304.11 (31.19) | 361.34 (36.73) | 193.88 (20.39) | 16.98 (−112.15 to 146.13) | −6.99 (−72.15 to 58.16) | 0.765 | <0.001 | 0.731 | |
| Pressure-time integral [(kPa) * s] | 100.35 (11.03) | 102.16 (20.56) | 52.86 (6.89) | 89.67 (13.45) | 95.86 (11.27) | 62.64 (6.75) | 6.29 (−39.67 to 52.26) | −9.78 (−28.29 to 9.12) | 0.990 | <0.001 | 0.363 | |
| Medial forefoot | Contact Area [cm2] | 18.18 (0.83) | 18.39 (0.98) | 22.49 (0.84) | 19.29 (0.61) | 19.53 (0.81) | 23.81 (0.92) | −1.14 (−3.65 to 1.36) | −1.32 (−3.78 to 1.14) | 0.244 | <0.001 | 0.997 |
| Peak [kPa] | 488.72 (46.36) | 502.26 (52.29) | 542.34 (43.35) | 378.16 (26.13) | 421.85 (32.08) | 462.98 (28.43) | 80.40 (−39.85 to 200.65) | 79.36 (−22.25 to 180.97) | 0.060 | <0.001 | 0.181 | |
| Pressure-time integral [(kPa) * s] | 175.21 (15.40) | 169.81 (20.84) | 193.26 (13.94) * | 134.42 (11.49) | 145.85 (12.04) | 161.42 (8.09) * | 23.96 (−23.22 to 71.14) | 31.84 (0.25 to 63.44) * | 0.004 * | 0.066 | 0.124 | |
| Central forefoot | Contact Area [cm2] | 21.67 (0.42) | 21.05 (0.73) | 16.13 (1.20) | 22.21 (0.45) | 22.35 (0.51) | 17.73 (1.31) | −1.30 (−3.05 to 0.44) | −1.59 (−5.09 to 1.89) | 0.228 | <0.001 | 0.228 |
| Peak [kPa] | 496.72 (42.08) | 473.09 (37.50) | 474.92 (41.43) | 425.27 (33.56) | 496.47 (50.99) | 382.98 (28.44) | −23.37 (−147.44 to 100.69) | 91.93 (−6.56 to 190.44) | 0.278 | 0.159 | 0.073 | |
| Pressure-time integral [(kPa) * s] | 180.73 (12.57) | 159.71 (12.08) | 165.24 (12.76) | 157.37 (11.41) | 169.43 (16.21) | 139.13 (9.45) | −9.71 (−49.34 to 29.91) | 26.11 (−5.02 to 57.25) | 0.341 | 0.097 | 0.086 | |
| Lateral forefoot | Contact Area [cm2] | 14.48 (0.73) | 12.93 (1.08) | 7.82 (0.96) | 13.23 (0.96) | 14.14 (0.93) | 9.39 (0.91) | −1.21 (−4.02 to 1.59) | −1.57 (−4.18 to 1.03) | 0.558 | 0.000 | 0.128 |
| Peak [kPa] | 286.22 (55.89) | 303.63 (64.53) | 146.13 (38.34) | 216.22 (18.87) | 224.48 (26.17) | 102.29 (12.62) | 79.14 (−57.34 to 215.63) | 43.84 (−35.26 to 122.95) | 0.155 | 0.000 | 0.942 | |
| Pressure-time integral [(kPa) * s] | 99.08 (15.76) | 97.46 (17.97) | 44.78 (13.51) | 80.90 (7.27) | 81.92 (9.50) | 39.52 (5.58) | 15.53 (−24.31 to 55.39) | 5.25 (−23.40 to 33.92) | 0.444 | 0.000 | 0.941 | |
| Midfoot | Contact Area [cm2] | 24.54 (0.80) | 23.26 (1.25) | 29.79 (1.49) | 24.58 (1.10) | 24.66 (1.08) | 32.08 (1.45) | −1.40 (−4.67 to 1.84) | −2.29 (−6.37 to 1.79) | 0.428 | 0.000 | 0.422 |
| Peak [kPa] | 284.33 (38.70) | 284.64 (37.30) | 380.68 (43.88) | 241.88 (13.83) | 242.24 (15.79) | 299.93 (23.23) | 42.39 (−37.00 to 121.80) | 80.75 (−16.57 to 178.07) | 0.156 | 0.000 | 0.793 | |
| Pressure-time integral [(kPa) * s] | 97.75 (16.31) | 80.99 (12.51) | 124.26 (16.44) | 77.57 (6.36) | 77.97 (7.71) | 106.94 (9.32) | 3.01 (−25.79 to 31.82) | 17.31 (−19.74 to 54.38) | 0.388 | 0.000 | 0.083 | |
| Heel | Contact Area [cm2] | 38.19 (1.05) | 32.53 (1.17) | 28.38 (1.50) | 36.72 (1.65) | 29.14 (1.95) | 27.17 (1.40) | 3.38 (−1.09 to 7.86) | 1.20 (−2.82 to 5.23) | 0.266 | 0.000 | 0.506 |
| Peak [kPa] | 238.76 (17.85) | 420.95 (33.05) | 477.34 (42.44) | 217.59 (19.37) | 384.48 (29.89) | 373.75 (32.45) | 36.46 (−50.88 to 123.81) | 103.59 (−1.12 to 208.32) | 0.097 | 0.000 | 0.338 | |
| Pressure-time integral [(kPa) * s] | 338.91 (36.91) | 130.80 (12.97) | 145.55 (14.57) | 354.94 (35.86) | 126.30 (10.72) | 122.06 (10.39) | 4.50 (−28.49 to 37.49) | 23.49 (−11.59 to 58.57) | 0.596 | 0.000 | 0.413 | |
| Intervention Group (n = 15) | Control Group (n = 15) | Between-Group Difference (CI 95%) | GEE Analysis (p-Values) | ||||||||
|---|---|---|---|---|---|---|---|---|---|---|---|
| Variables | Baseline Estimated Mean (SE) | 12-Week Estimated Mean (SE) | 24-Week Estimated Mean (SE) | Baseline Estimated Mean (SE) | 12-Week Estimated Mean (SE) | 24-Week Estimated Mean (SE) | 12-Week (Intervention X Control Group) | 24-Week (Intervention X Control Group) | Group | Time | Group x Time (Interaction Effect) |
| ANKLE | |||||||||||
| Ankle ROM (degree) | 23.14 (1.14) | 32.53 (1.17) | 28.38 (1.50) | 22.82 (0.65) | 29.14 (1.95) | 27.17 (1.40) | 3.38 (−1.09 to 7.86) | 1.20 (−2.82 to 5.23) | 0.630 | 0.001 | 0.839 |
| Ankle dorsiflexion at heel strike (degree) | 3.14 (0.64) | 2.18 (0.40) | 3.36 (0.85) | 3.13 (0.57) | 3.47 (1.09) | 4.54 (0.84) | −1.28 (−3.56 to 0.99) | −1.17 (−3.53 to 1.18) | 0.249 | 0.194 | 0.525 |
| Ankle plantarflexion at push off (degree) | 1.73 (0.01) | 4.44 (0.78) & | 4.14 (0.68) & | 2.14 (0.68) | 2.20 (0.66) & | 2.15 (1.05) & | 2.74 (1.19 to 4.28) & | 2.40 (1.05 to 3.75) & | 0.001 | 0.001 | 0.049& |
| Ankle flexor moment at heel strike (Nm/(BM * Height) | −0.04 (0.01) | −0.05 (0.01) | −0.04 (0.02) | −0.03 (0.01) | −0.04 (0.01) | −0.03 (0.00) | −0.01 (−0.05 to 0.02) | −0.01 (−0.04 to 0.01) | 0.224 | 0.419 | 0.898 |
| Ankle extensor moment at push off (Nm/(BM * Height) | 1.36 (0.04) | 1.41 (0.03) | 1.43 (0.04) | 1.30 (0.03) | 1.35 (0.04) | 1.37 (0.03) | 0.06 (−0.03 to 0.16) | 0.05 (−0.05 to 0.16) | 0.171 | 0.160 | 0.948 |
| Ankle peak eccentric power at the push off (W/BM * Height) | 2.49 (0.14) | 2.58 (0.9) | 2.36 (0.15) | 2.45 (0.16) | 2.48 (0.11) | 2.34 (0.15) | −0.1 (−0.56 to 0.31) | −0.2 (−0.46 to 0.25) | 0.397 | 0.198 | 0.591 |
| OXFORD FOOT MODEL | |||||||||||
| Hindfoot to tibia ROM (degree) | 23.12 (1.55) | 21.68 (1.09) | 23.01 (2.76) | 23.48 (1.21) | 23.15 (1.32) | 24.92 (1.25) | −1.46 (−4.83 to 1.90) | −1.90 (−7.86 to 4.04) | 0.495 | 0.410 | 0.801 |
| Hindfoot to tibia peak angle (degree) | 16.62 (2.34) | 17.31 (3.09) | 15.01 (1.31) * | 22.79 (7.91) | 14.92 (1.31) | 9.32 (1.72) * | 2.38 (−4.21 to 8.98) | 5.68 (1.43 to 9.94) * | 0.011 | 0.017 | 0.038* |
| Forefoot to hindfoot ROM (degree) | 17.82 (2.75) | 16.08 (1.86) | 14.62 (0.79) | 14.23 (0.99) | 14.40 (1.79) | 13.43 (0.69) | 1.68 (−3.38 to 6.75) | 1.18 (−0.88 to 3.25) | 0.191 | 0.283 | 0.658 |
| Forefoot to hindfoot peak angle (degree) | 8.62 (1.35) | 8.15 (0.80) | 8.75 (1.20) | 14.24 (6.17) | 7.84 (1.27) | 7.48 (1.13) | 0.30 (−2.64 to 3.26) | 1.26 (−1.97 to 4.51) | 0.595 | 0.411 | 0.338 |
| Hallux to forefoot ROM (degree) | 23.34 (2.23) | 26.03 (2.49) | 28.76 (1.70) # | 21.06 (1.93) | 21.07 (1.10) | 21.65 (1.62) # | 4.96 (−0.37 to 10.30) | 7.10 (2.48 to 11.73) # | 0.028 # | 0.186 | 0.346 |
| Hallux to forefoot peak angle (degree) | 22.06 (1.67) | 26.78 (1.49) a | 27.12 (2.19) a | 21.94 (2.11) | 21.15 (1.79) a | 20.50 (1.85) a | 5.63 (1.05 to 10.21) a | 6.61 (0.98 to 12.24) a | 0.049 a | 0.402 | 0.073 |
| Maximum arch height (cm) | 11.05 (0.35) | 10.58 (0.26) b | 11.49 (0.89) | 11.70 (0.38) | 12.19 (0.60) b | 11.24 (0.44) | −1.61 (−2.91 to −0.31) b | 0.25 (−1.70 to 2.21) | 0.049 b | 0.198 | 0.139 |
| Minimum arch height (cm) | 8.78 (0.34) | 8.38 (0.37) c | 8.60 (0.79) | 9.75 (0.34) | 9.87 (0.51) c | 8.95 (0.41) | −1.48 (−2.73 to −0.23) c | −0.34 (−2.10 to 1.41) | 0.044 c | 0.476 | 0.327 |
Publisher’s Note: MDPI stays neutral with regard to jurisdictional claims in published maps and institutional affiliations. |
© 2022 by the authors. Licensee MDPI, Basel, Switzerland. This article is an open access article distributed under the terms and conditions of the Creative Commons Attribution (CC BY) license (https://creativecommons.org/licenses/by/4.0/).
Share and Cite
Cruvinel-Júnior, R.H.; Ferreira, J.S.S.P.; Veríssimo, J.L.; Monteiro, R.L.; Suda, E.Y.; Silva, É.Q.; Sacco, I.C.N. Could an Internet-Based Foot–Ankle Therapeutic Exercise Program Modify Clinical Outcomes and Gait Biomechanics in People with Diabetic Neuropathy? A Clinical Proof-of-Concept Study. Sensors 2022, 22, 9582. https://doi.org/10.3390/s22249582
Cruvinel-Júnior RH, Ferreira JSSP, Veríssimo JL, Monteiro RL, Suda EY, Silva ÉQ, Sacco ICN. Could an Internet-Based Foot–Ankle Therapeutic Exercise Program Modify Clinical Outcomes and Gait Biomechanics in People with Diabetic Neuropathy? A Clinical Proof-of-Concept Study. Sensors. 2022; 22(24):9582. https://doi.org/10.3390/s22249582
Chicago/Turabian StyleCruvinel-Júnior, Ronaldo H., Jane S. S. P. Ferreira, Jady L. Veríssimo, Renan L. Monteiro, Eneida Y. Suda, Érica Q. Silva, and Isabel C. N. Sacco. 2022. "Could an Internet-Based Foot–Ankle Therapeutic Exercise Program Modify Clinical Outcomes and Gait Biomechanics in People with Diabetic Neuropathy? A Clinical Proof-of-Concept Study" Sensors 22, no. 24: 9582. https://doi.org/10.3390/s22249582
APA StyleCruvinel-Júnior, R. H., Ferreira, J. S. S. P., Veríssimo, J. L., Monteiro, R. L., Suda, E. Y., Silva, É. Q., & Sacco, I. C. N. (2022). Could an Internet-Based Foot–Ankle Therapeutic Exercise Program Modify Clinical Outcomes and Gait Biomechanics in People with Diabetic Neuropathy? A Clinical Proof-of-Concept Study. Sensors, 22(24), 9582. https://doi.org/10.3390/s22249582