

Considerations and Challenges for Real-World Deployment of an Acoustic-Based COVID-19 Screening System

Abstract
1. Introduction
2. Methods
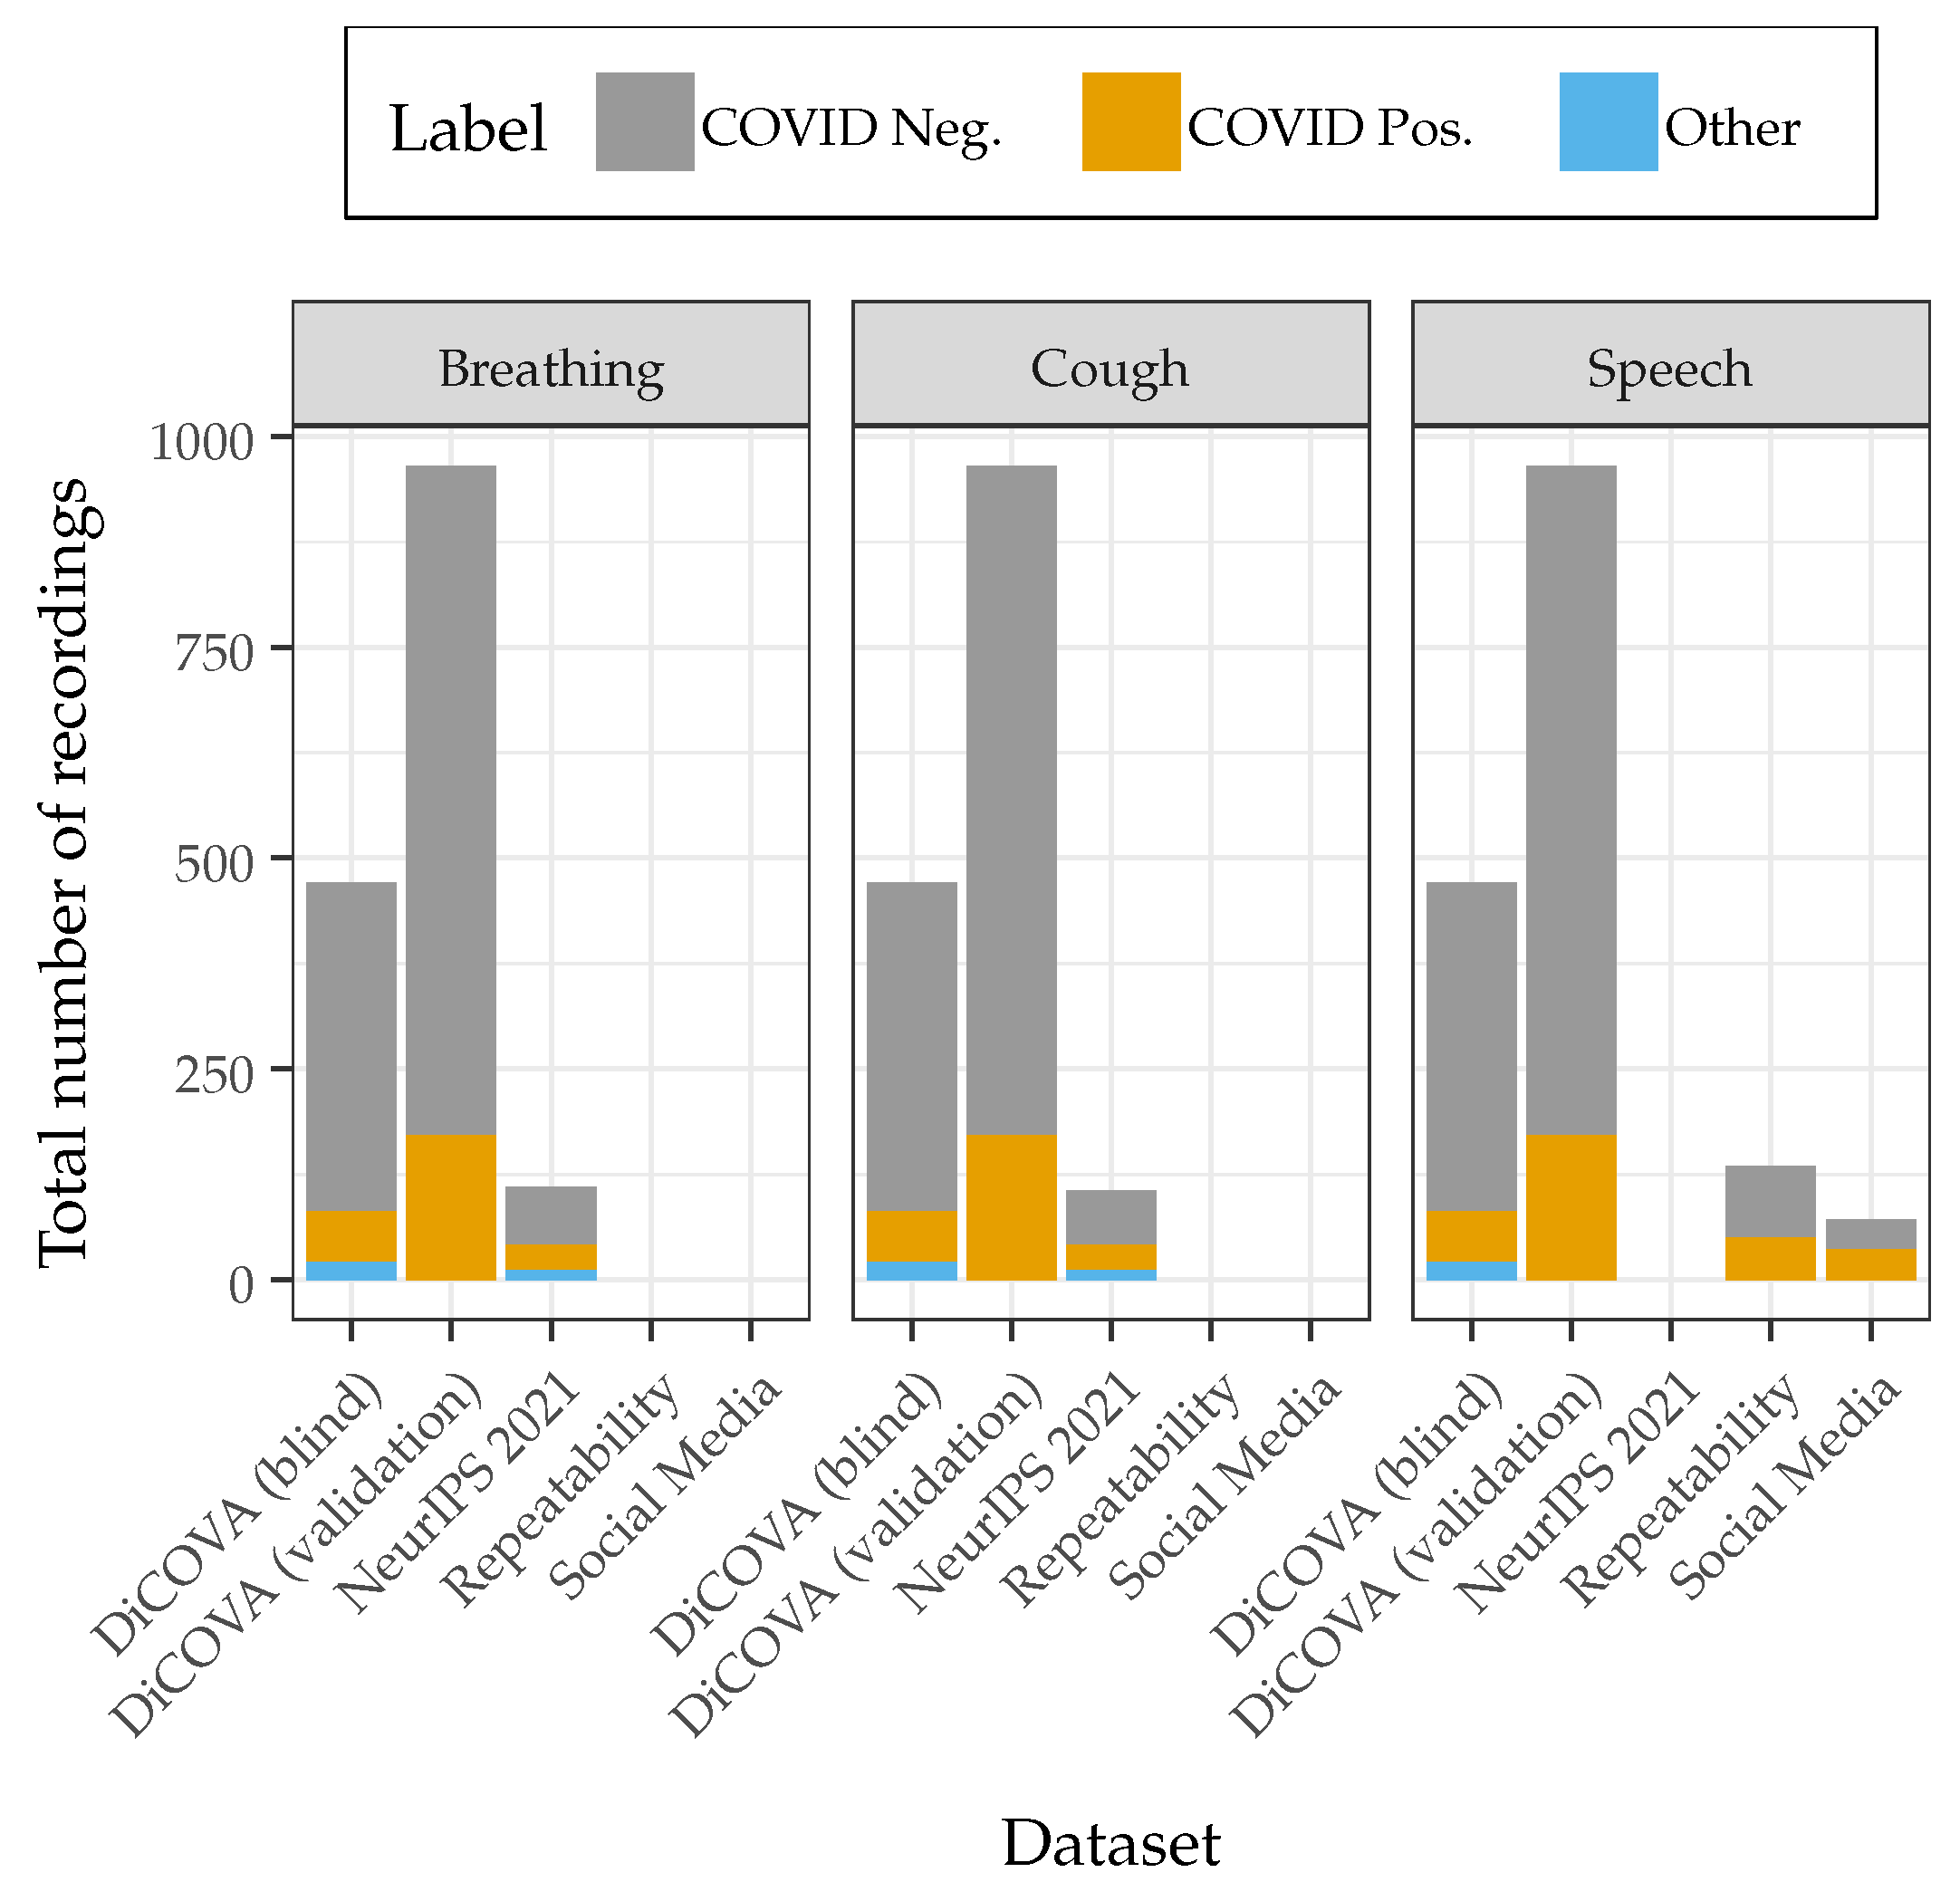
2.1. Datasets
2.1.1. DiCOVA Validation and Blind Datasets
2.1.2. NeurIPS 2021 Dataset
2.1.3. Social Media Dataset
2.1.4. Repeatability Dataset
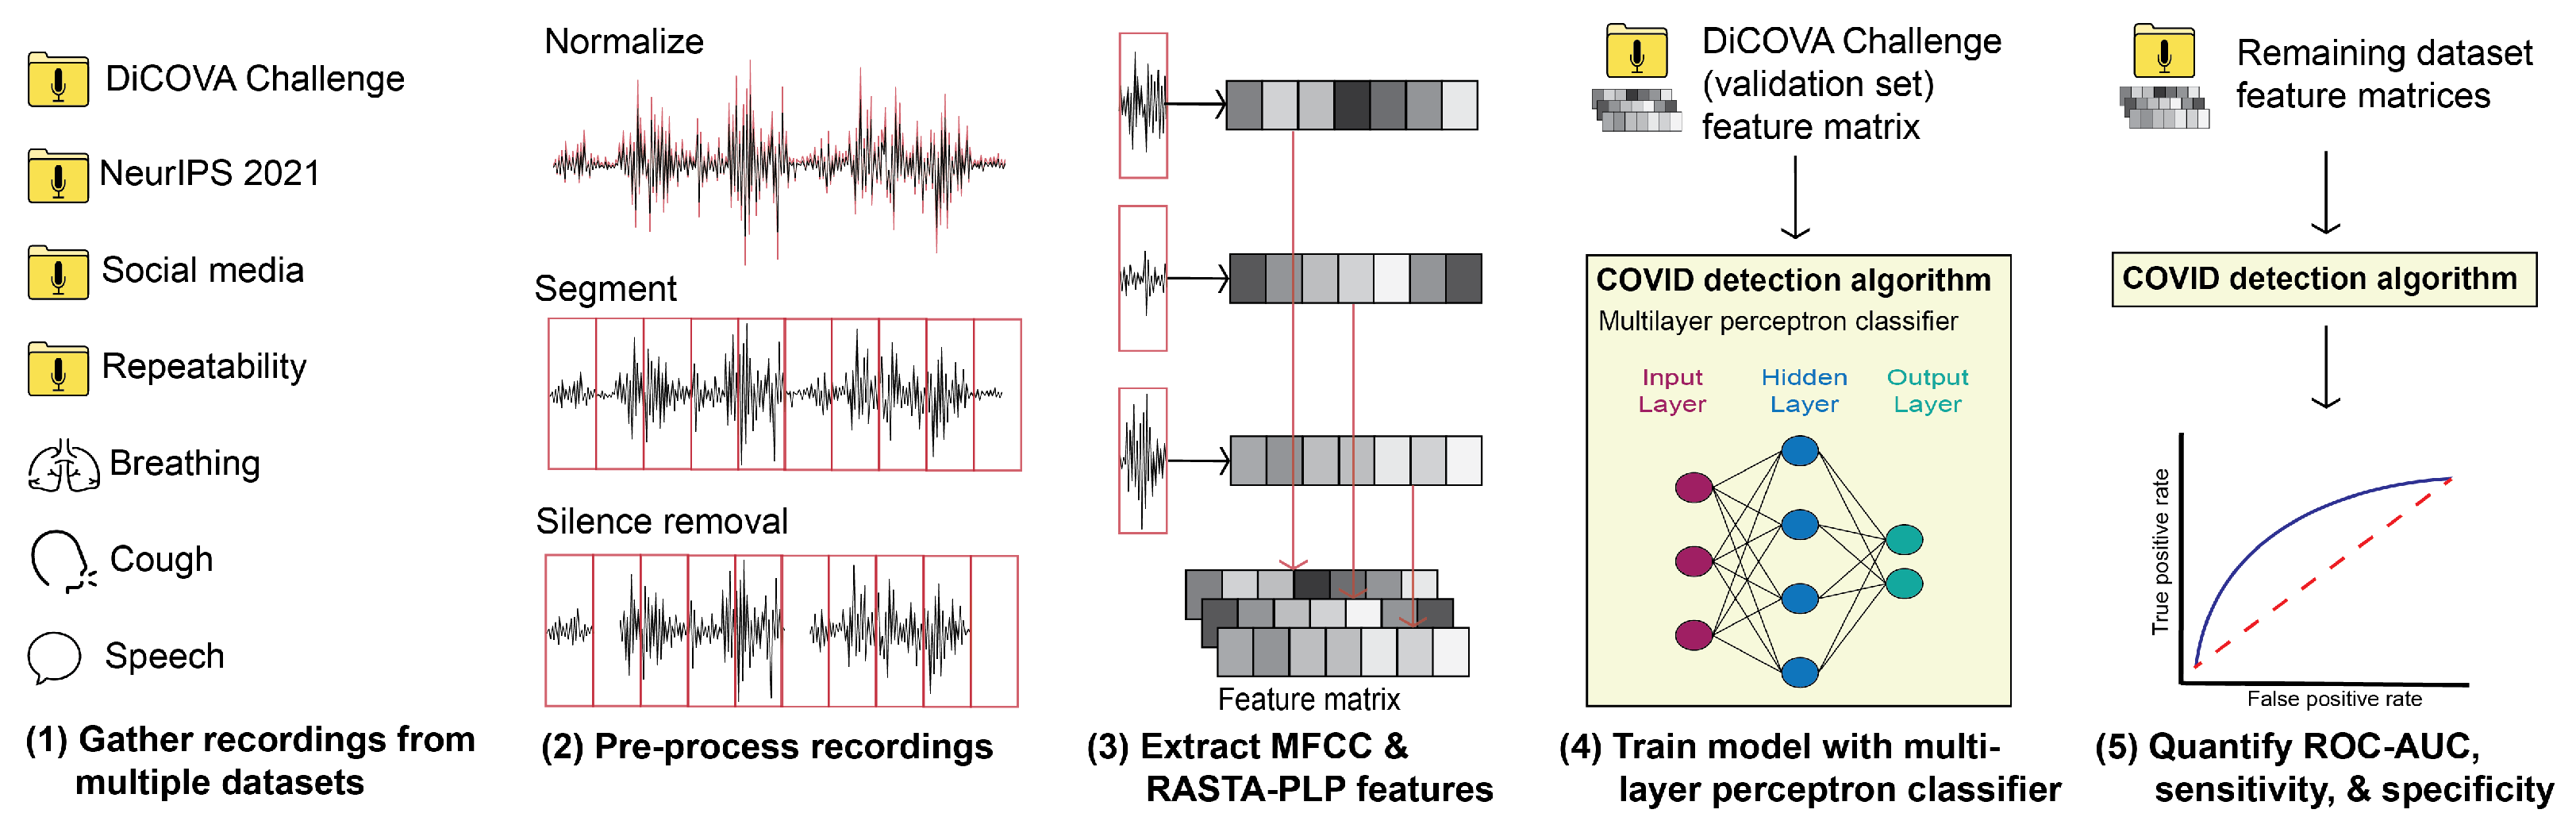
2.2. Classification Schema
2.2.1. Pre-Processing
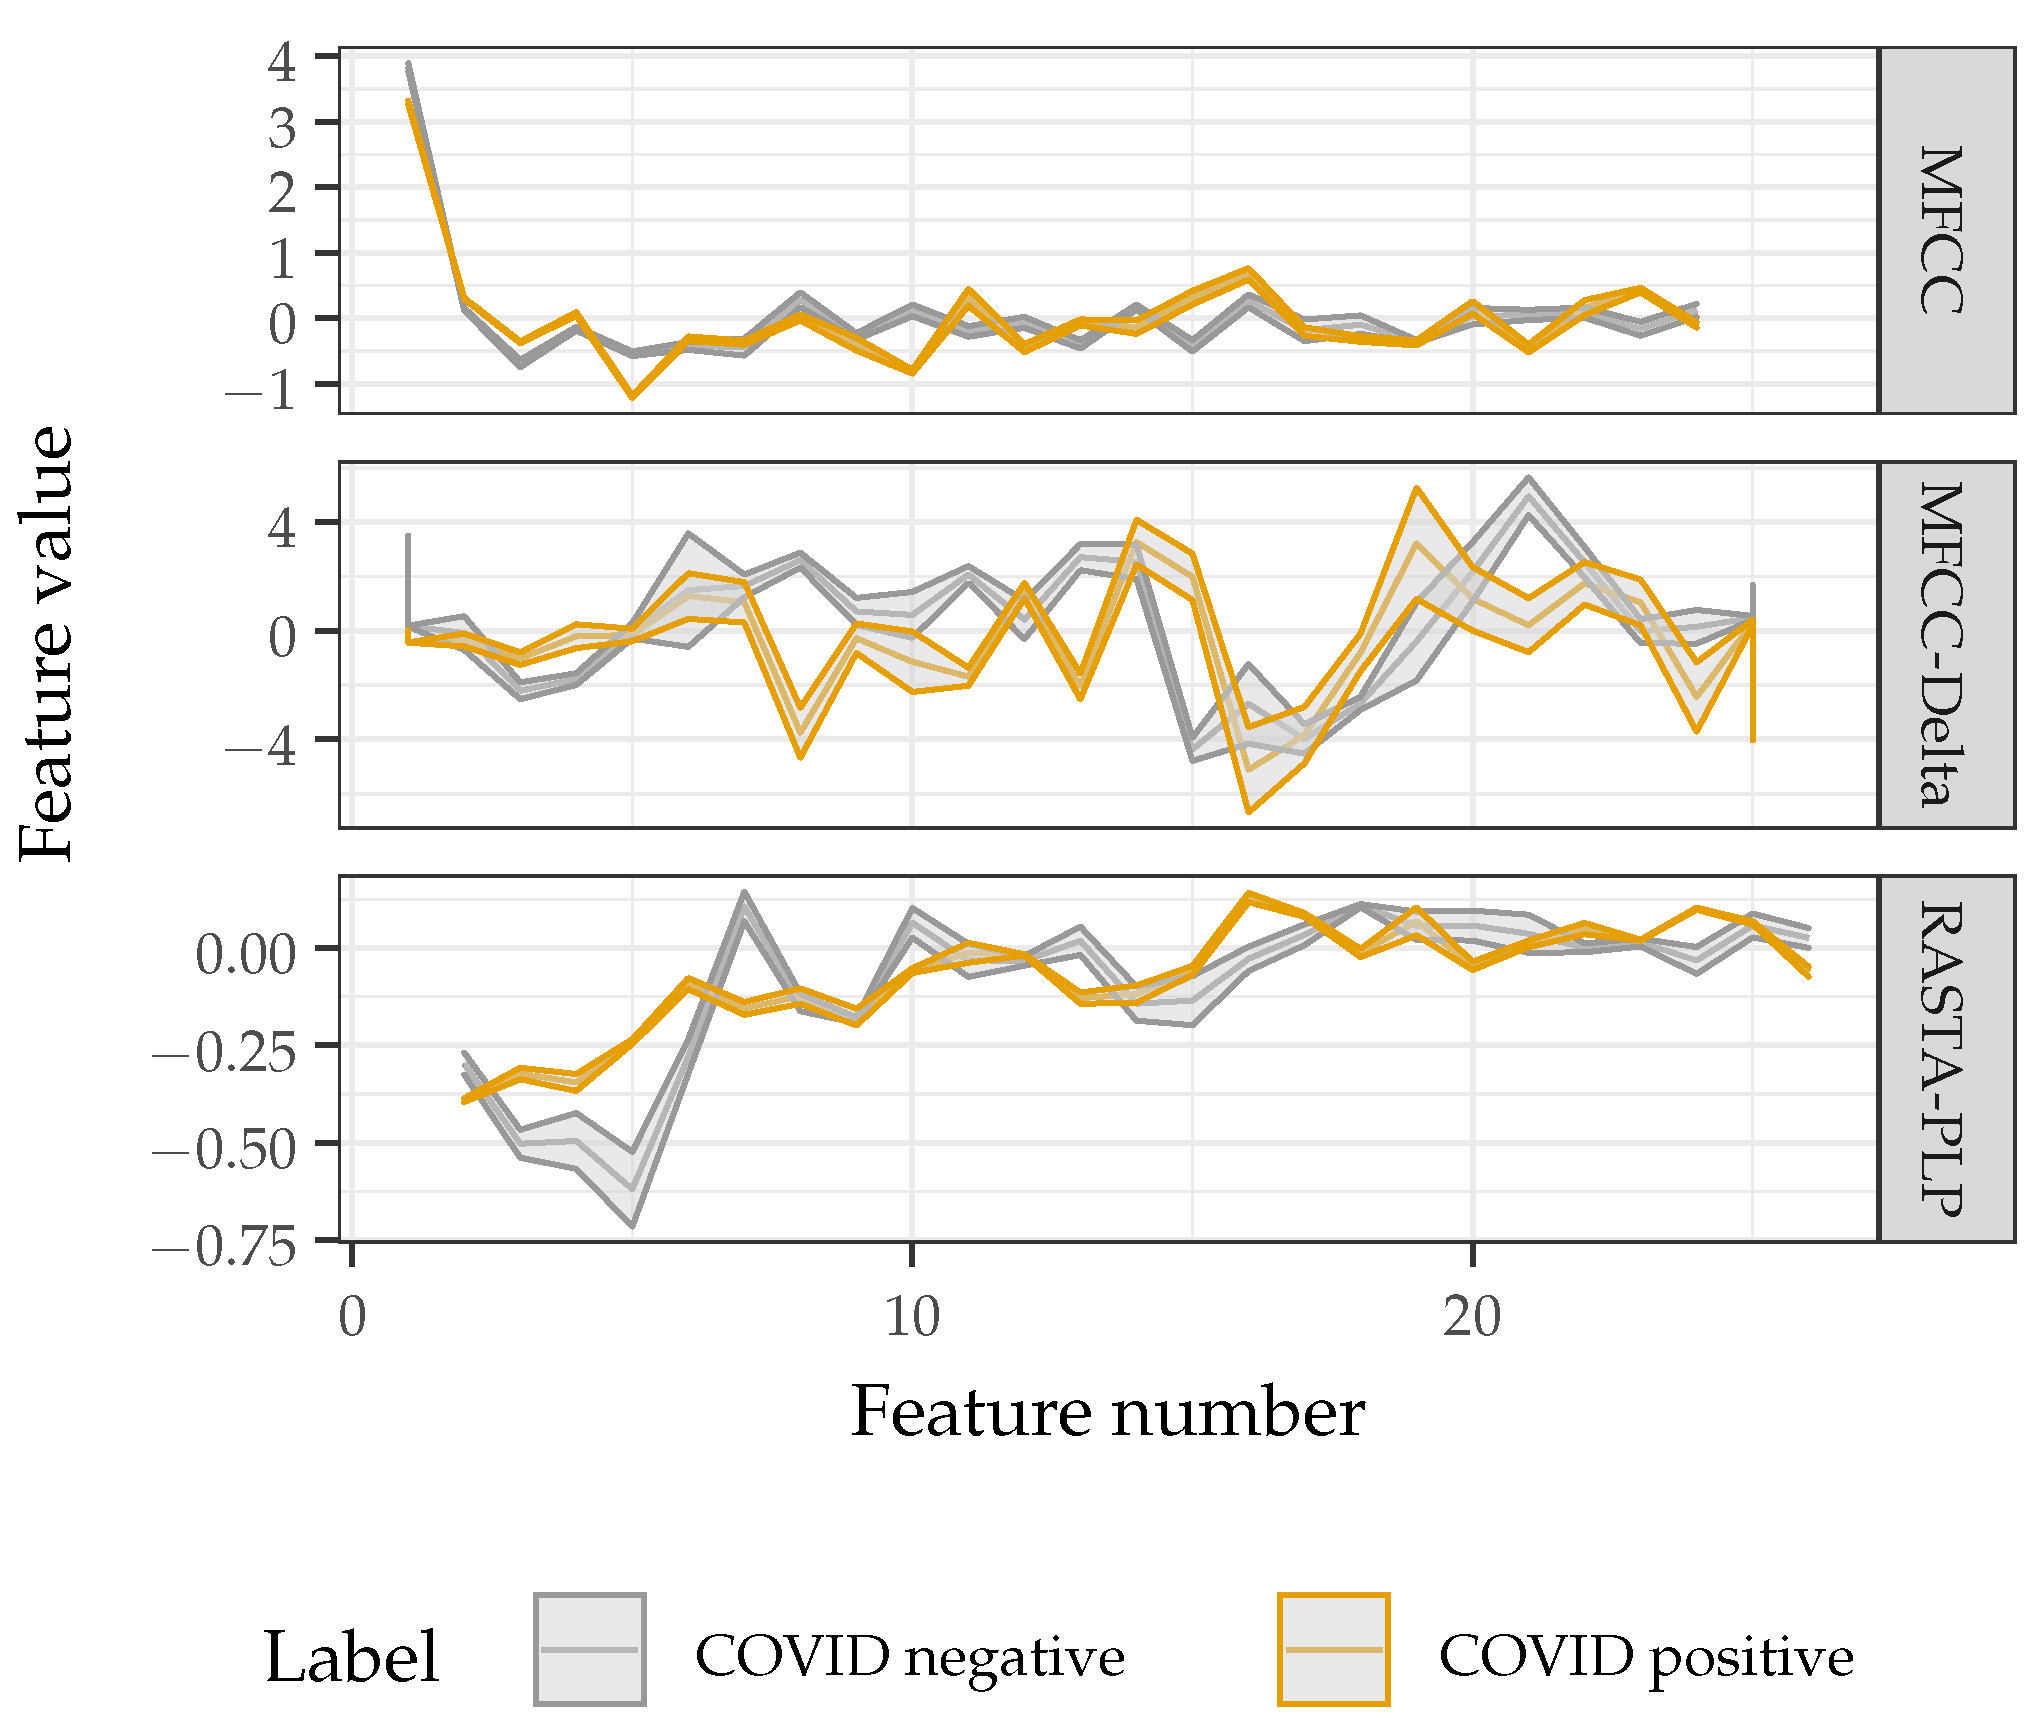
2.2.2. Feature Extraction
2.2.3. Classifier Description
2.2.4. Performance Evaluation
2.3. Real-World Deployability Testing
2.3.1. Recording Device
2.3.2. Model Generalizability
2.3.3. Model Complexity
2.3.4. Confounding Factors
2.3.5. Additive Noise Injection
2.3.6. Single Speaker Repeatability and Discrimination
3. Results and Discussion
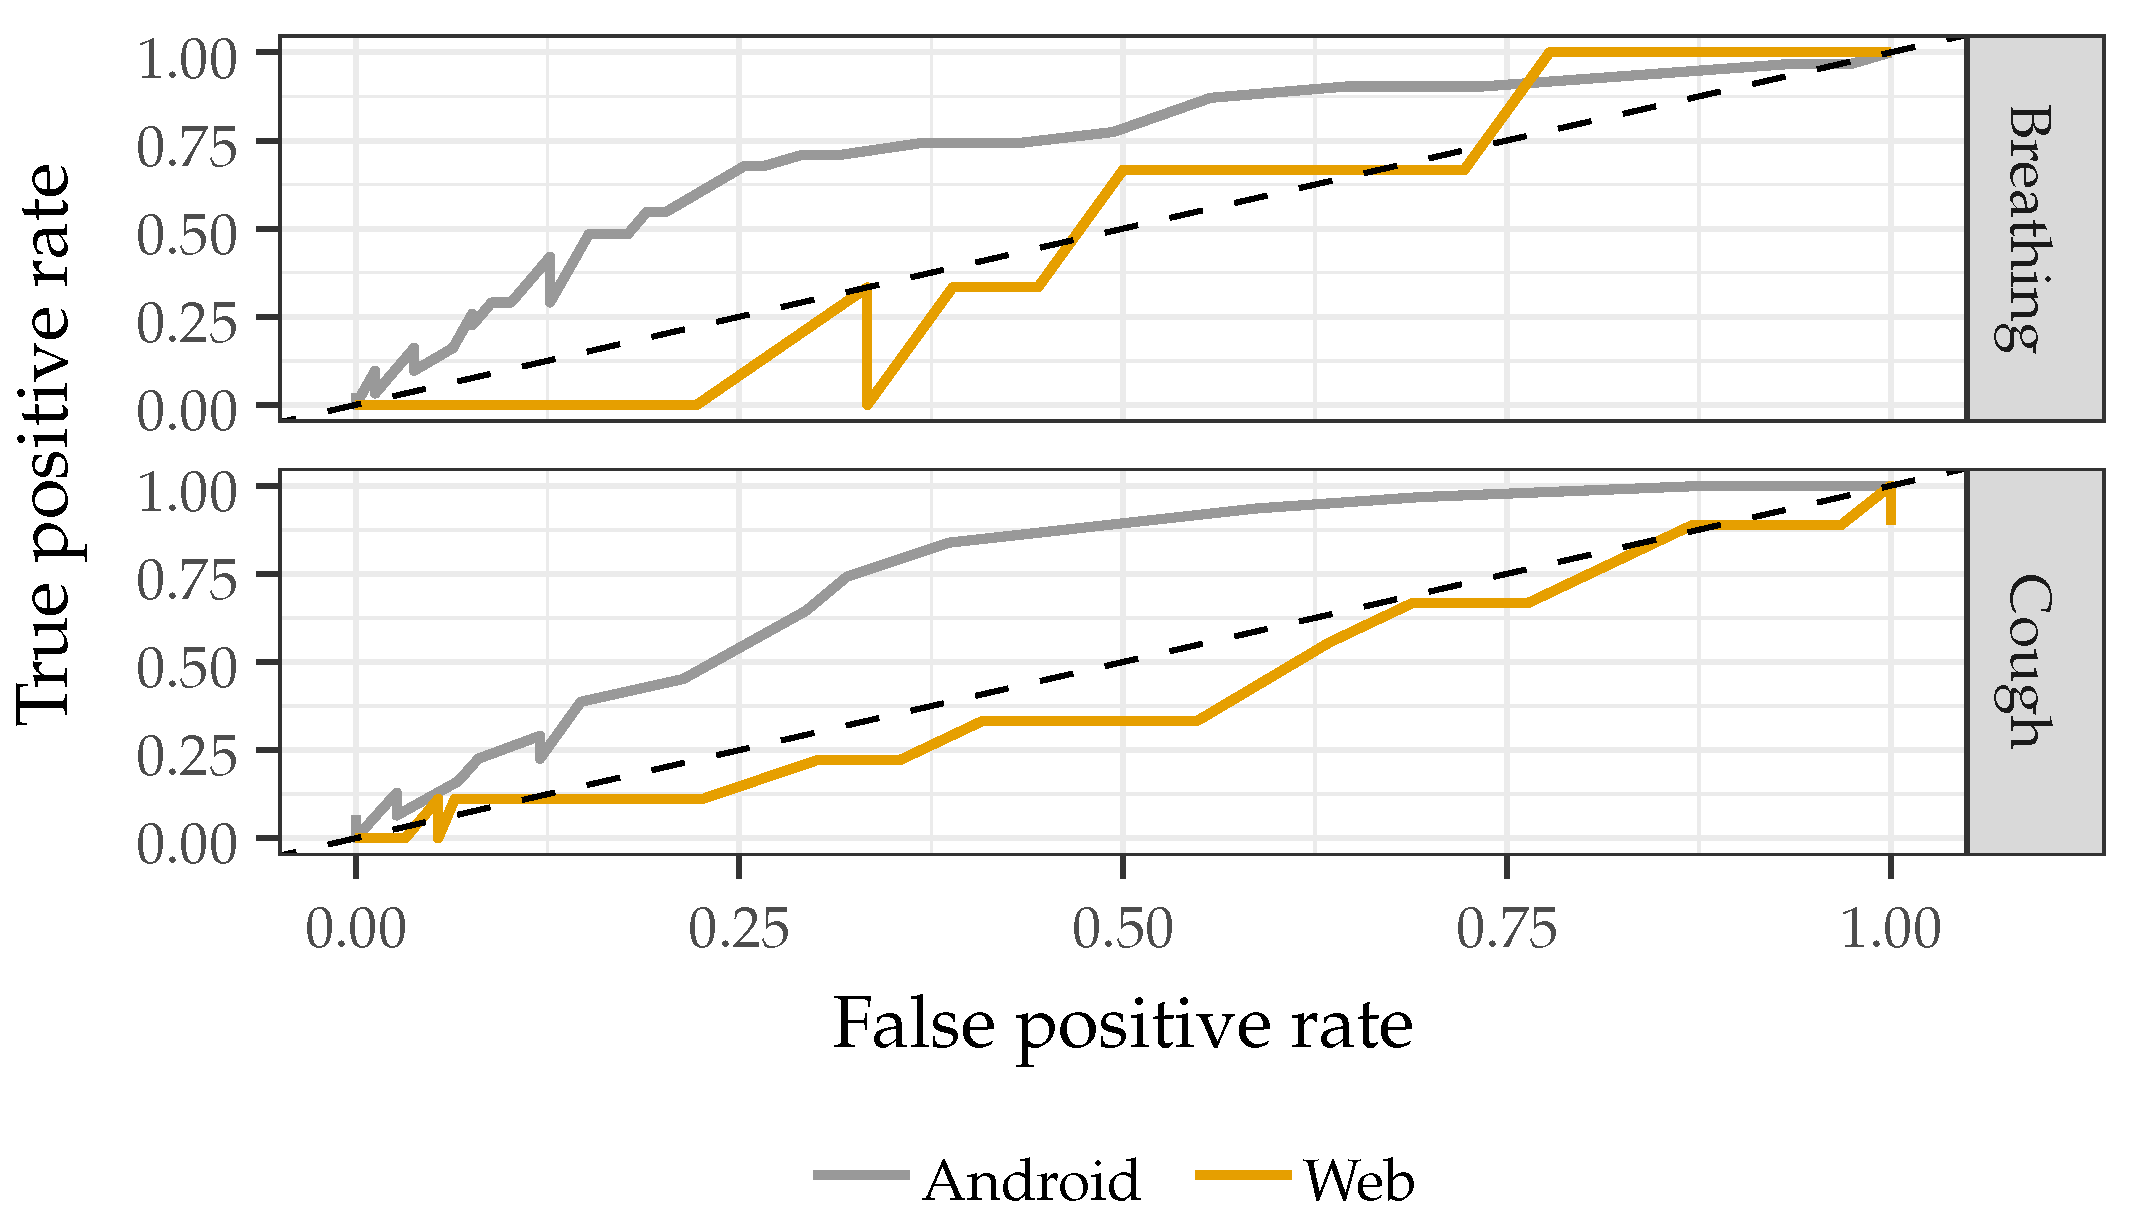
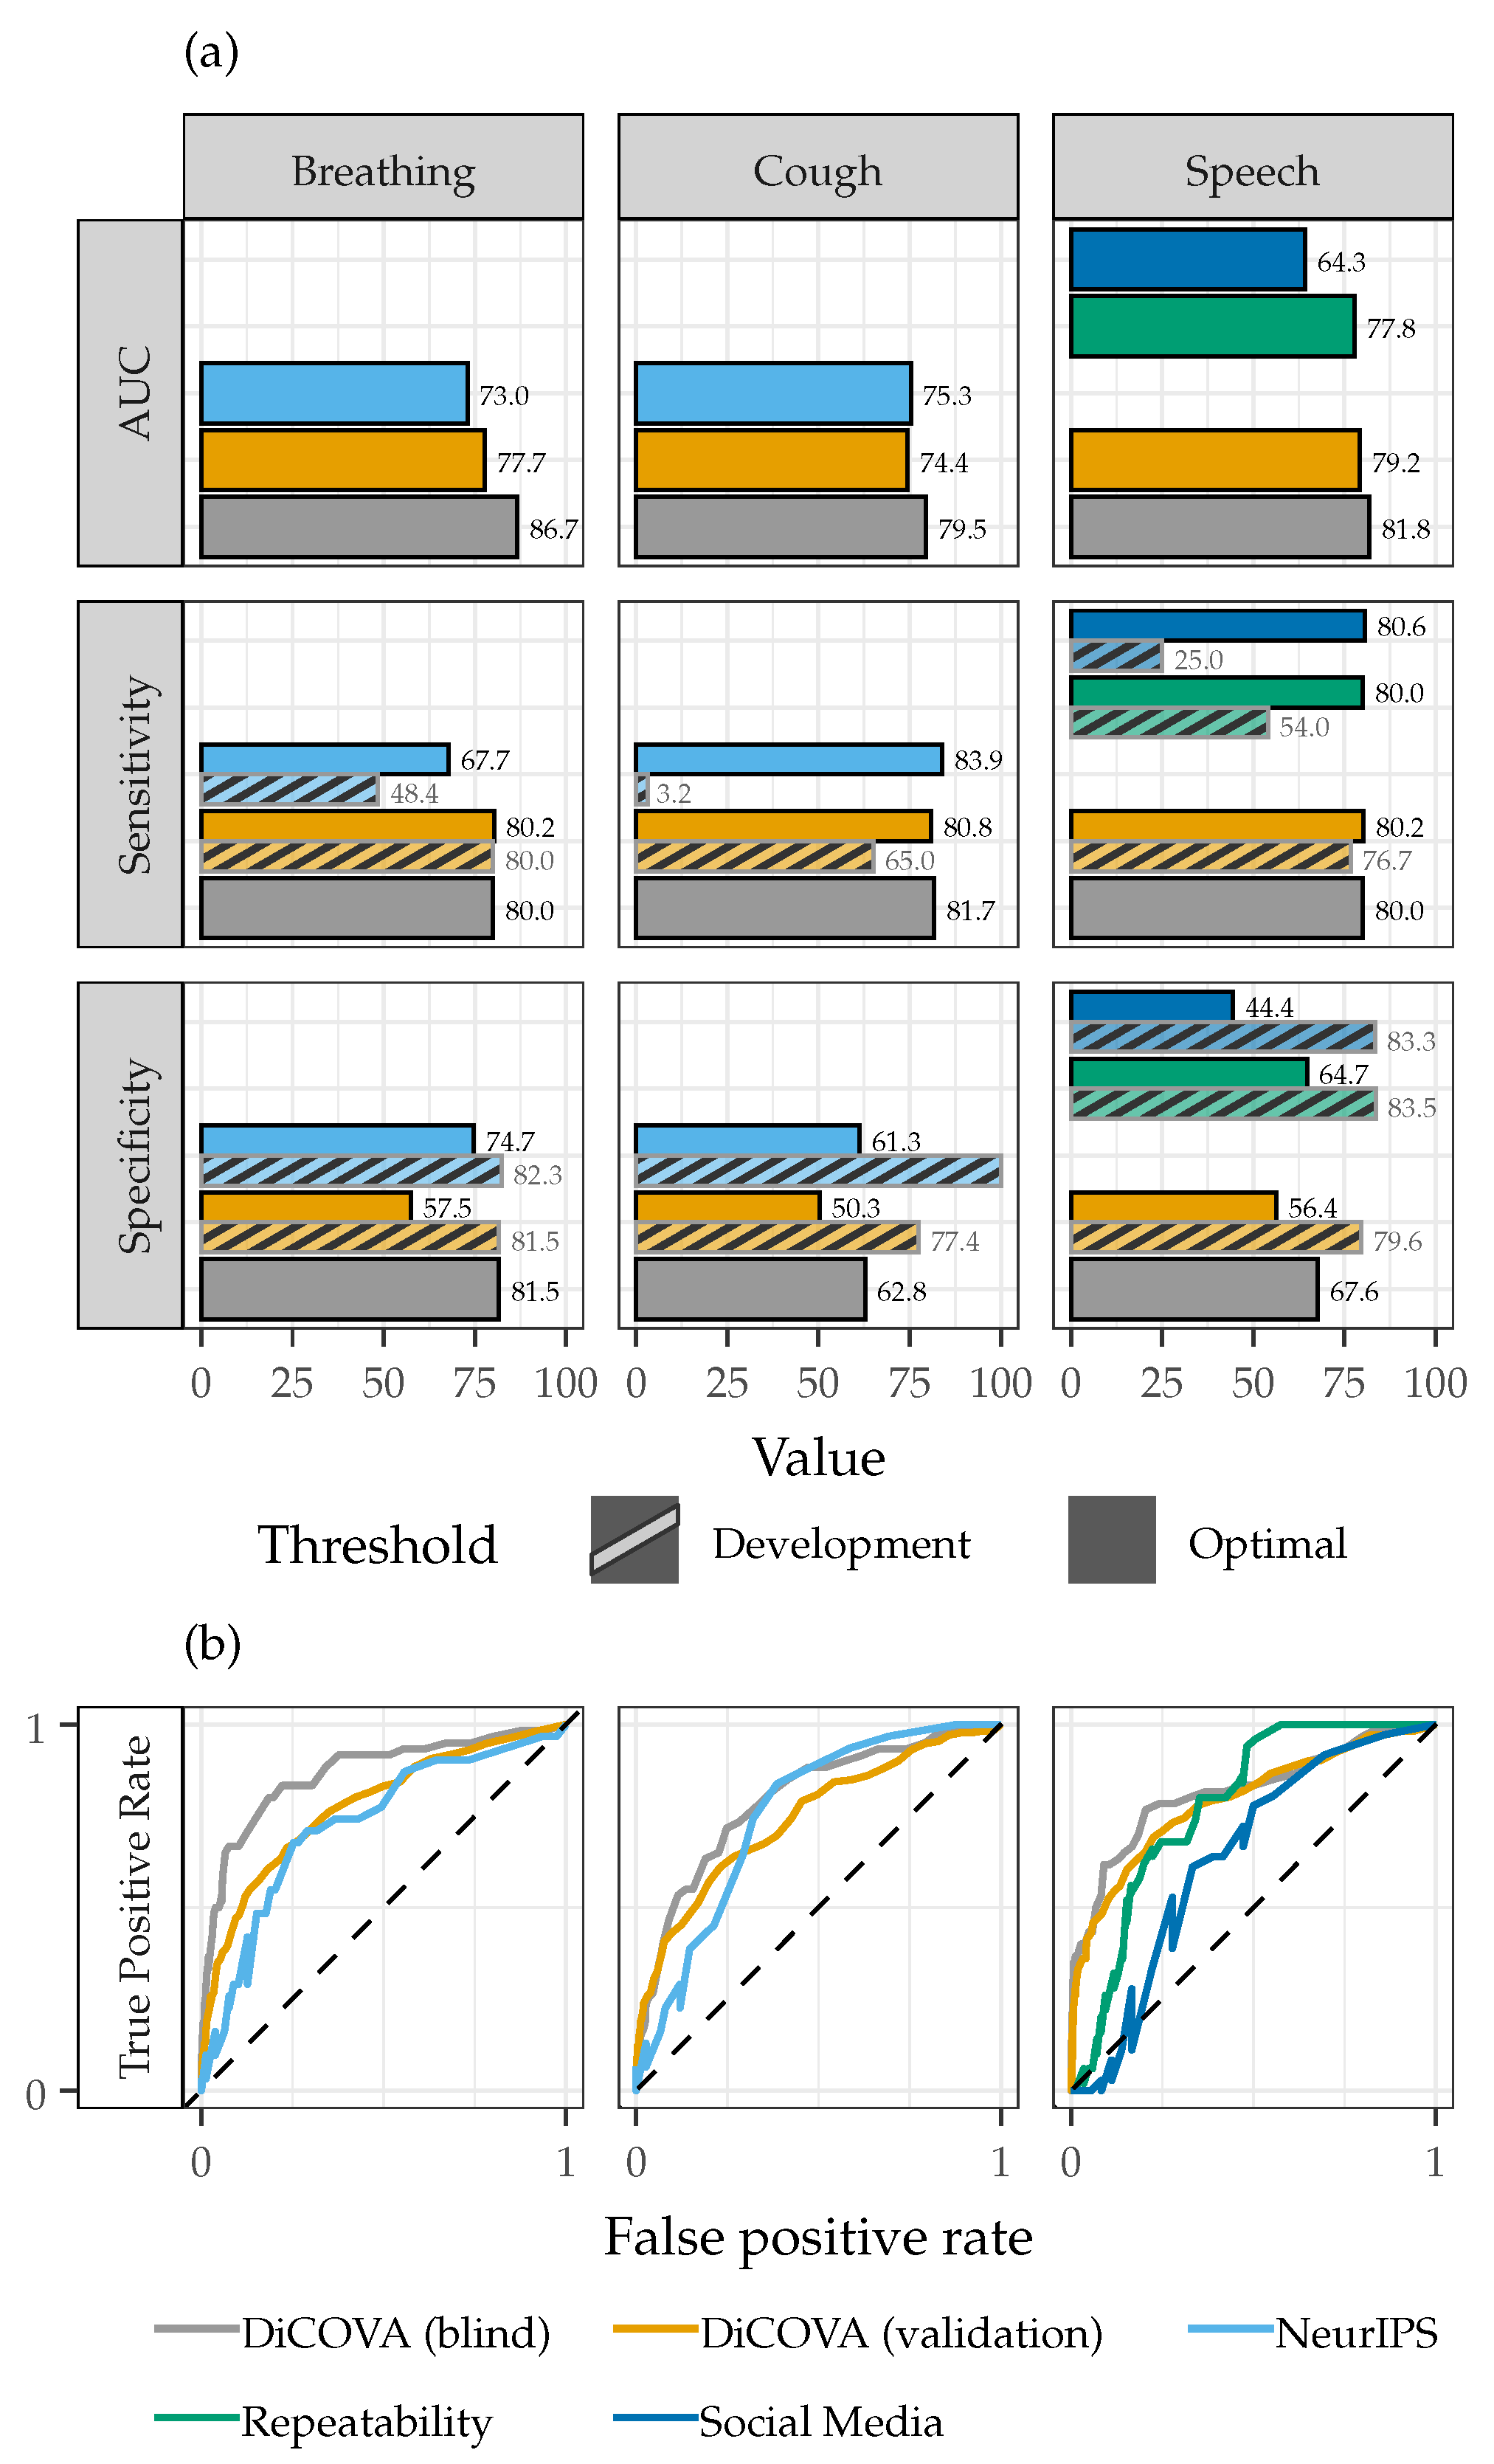
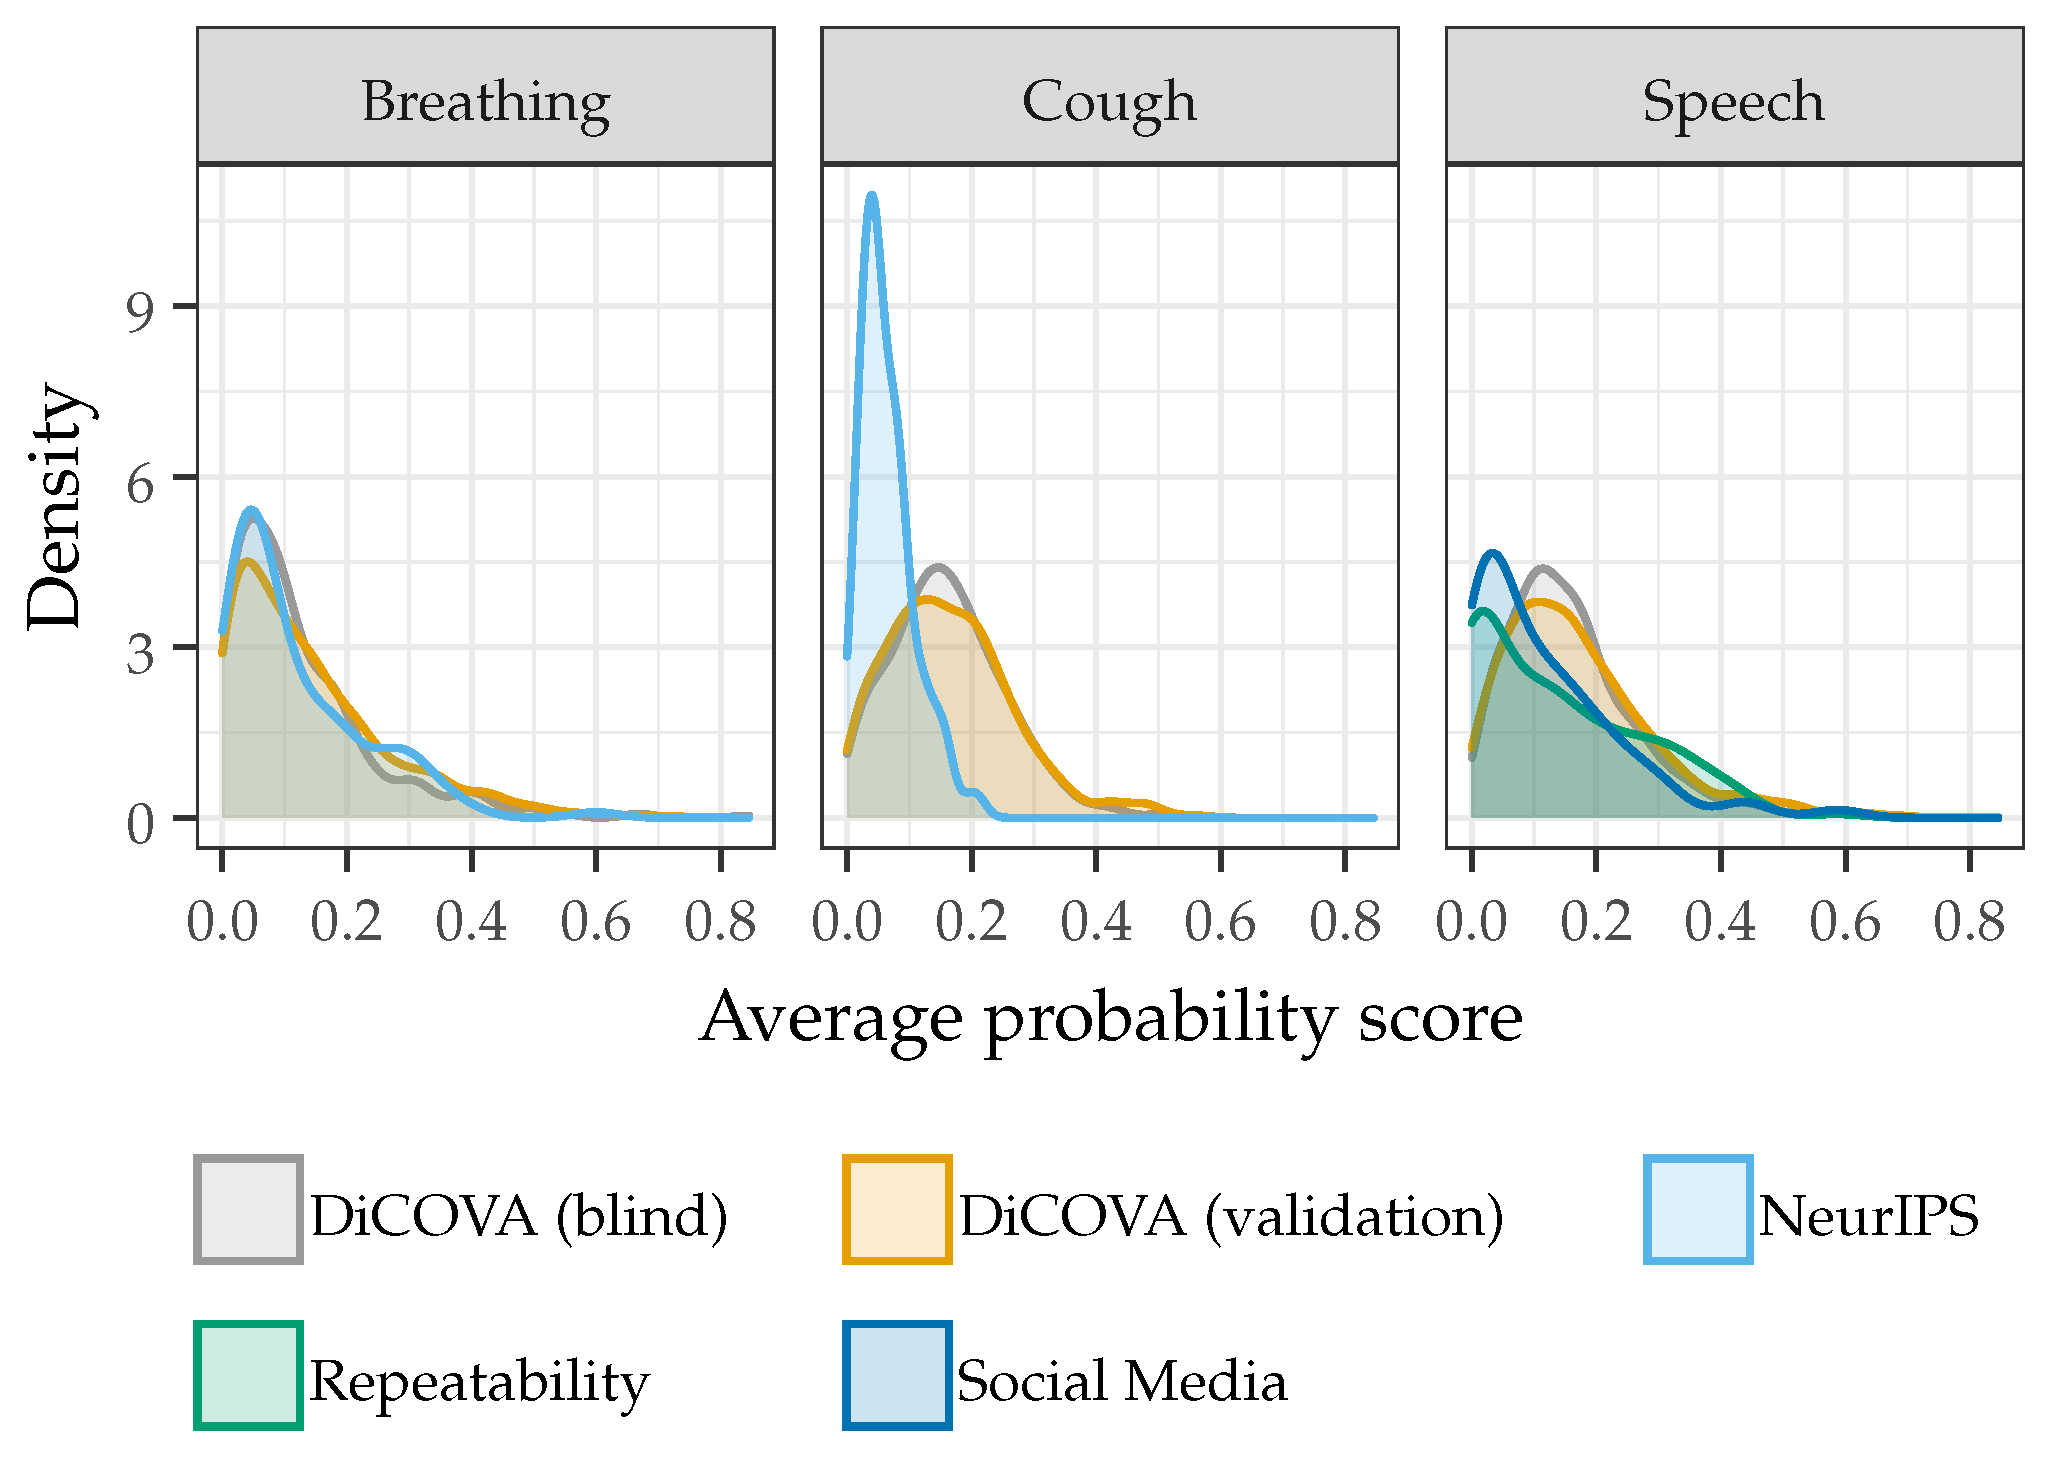
3.1. Recording Device
3.2. Model Generalizability
3.3. Model Complexity
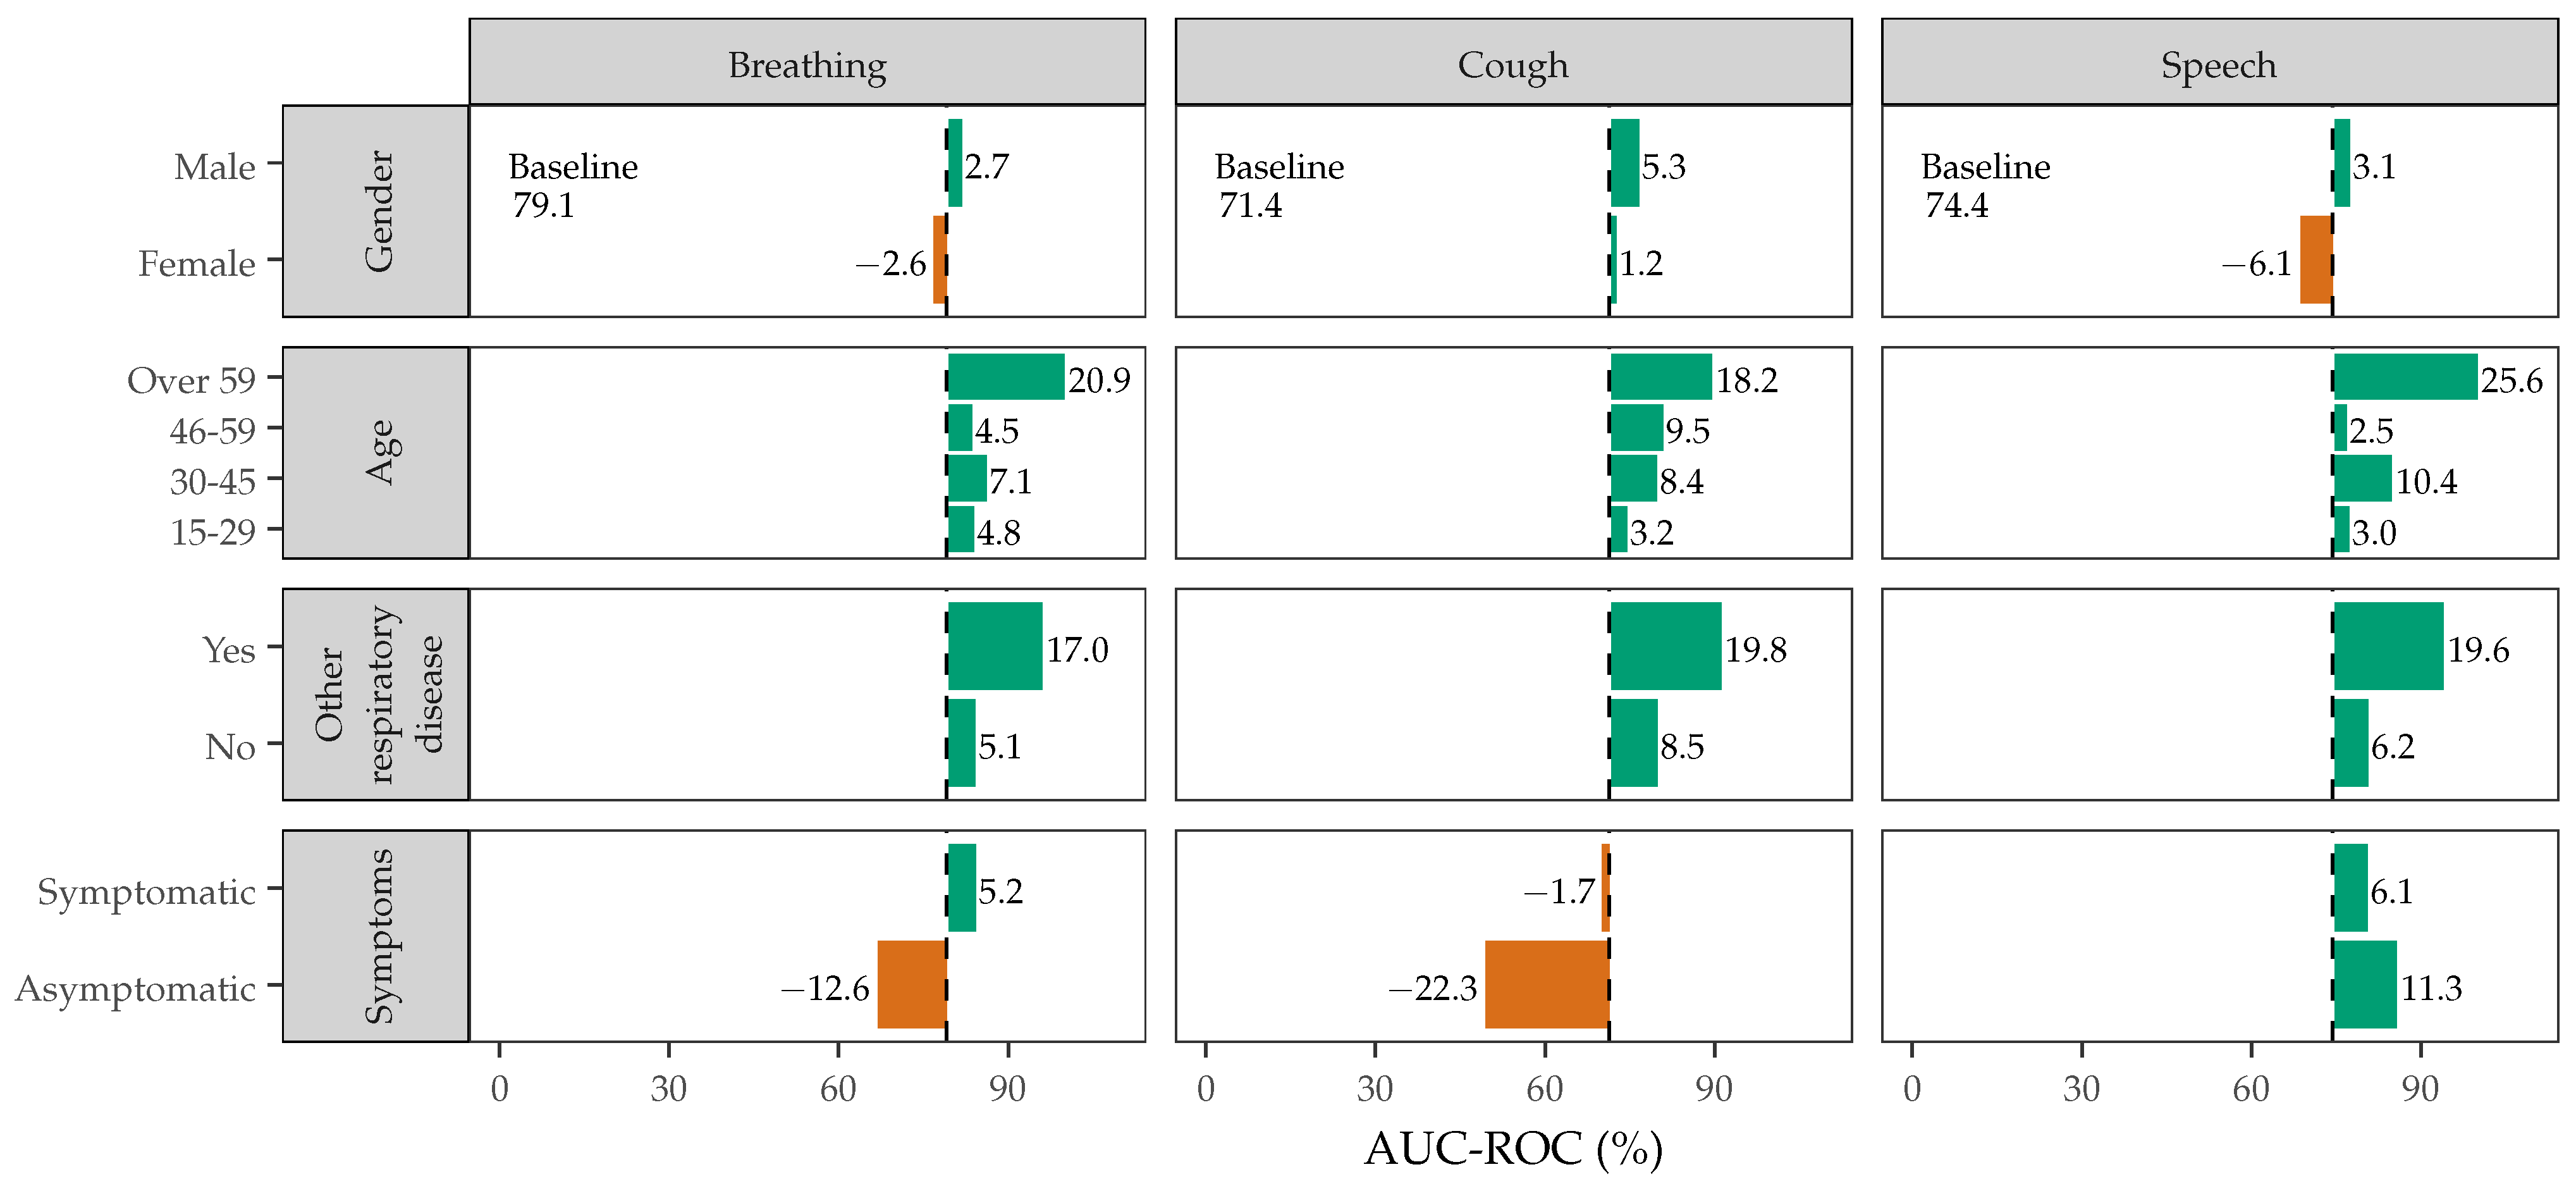
3.4. Confounding Factors
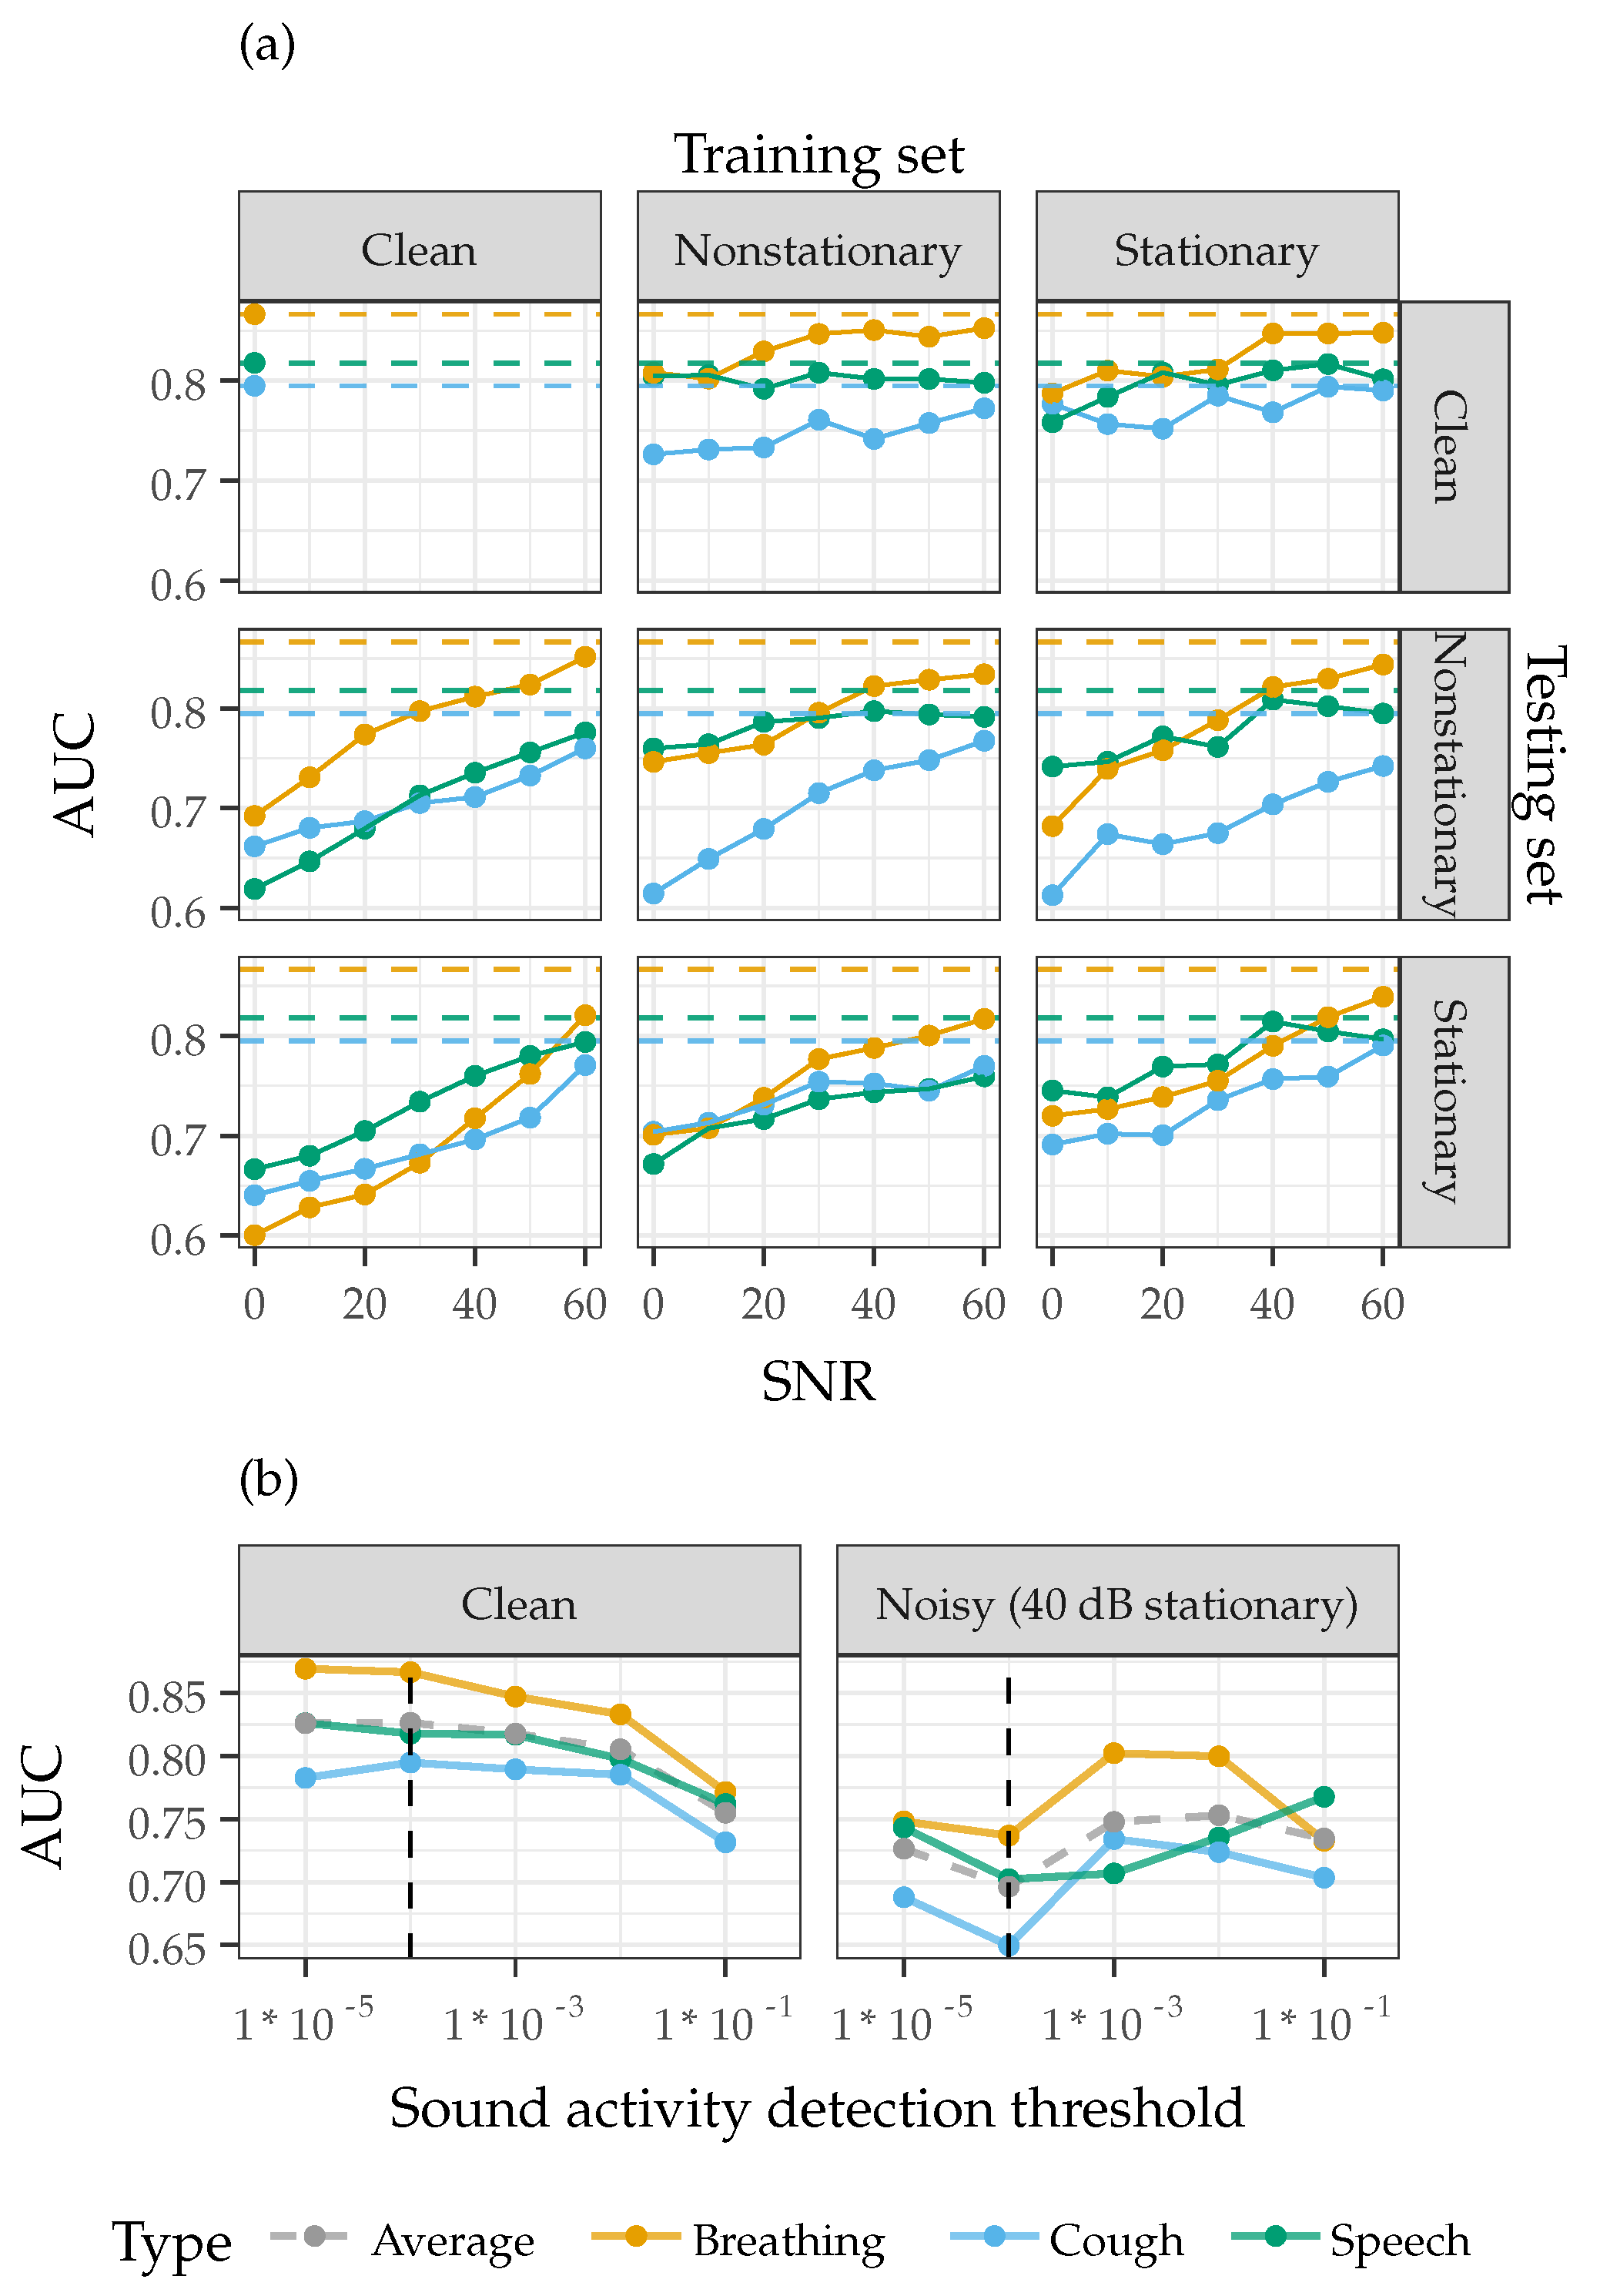
3.5. Additive Noise Injection
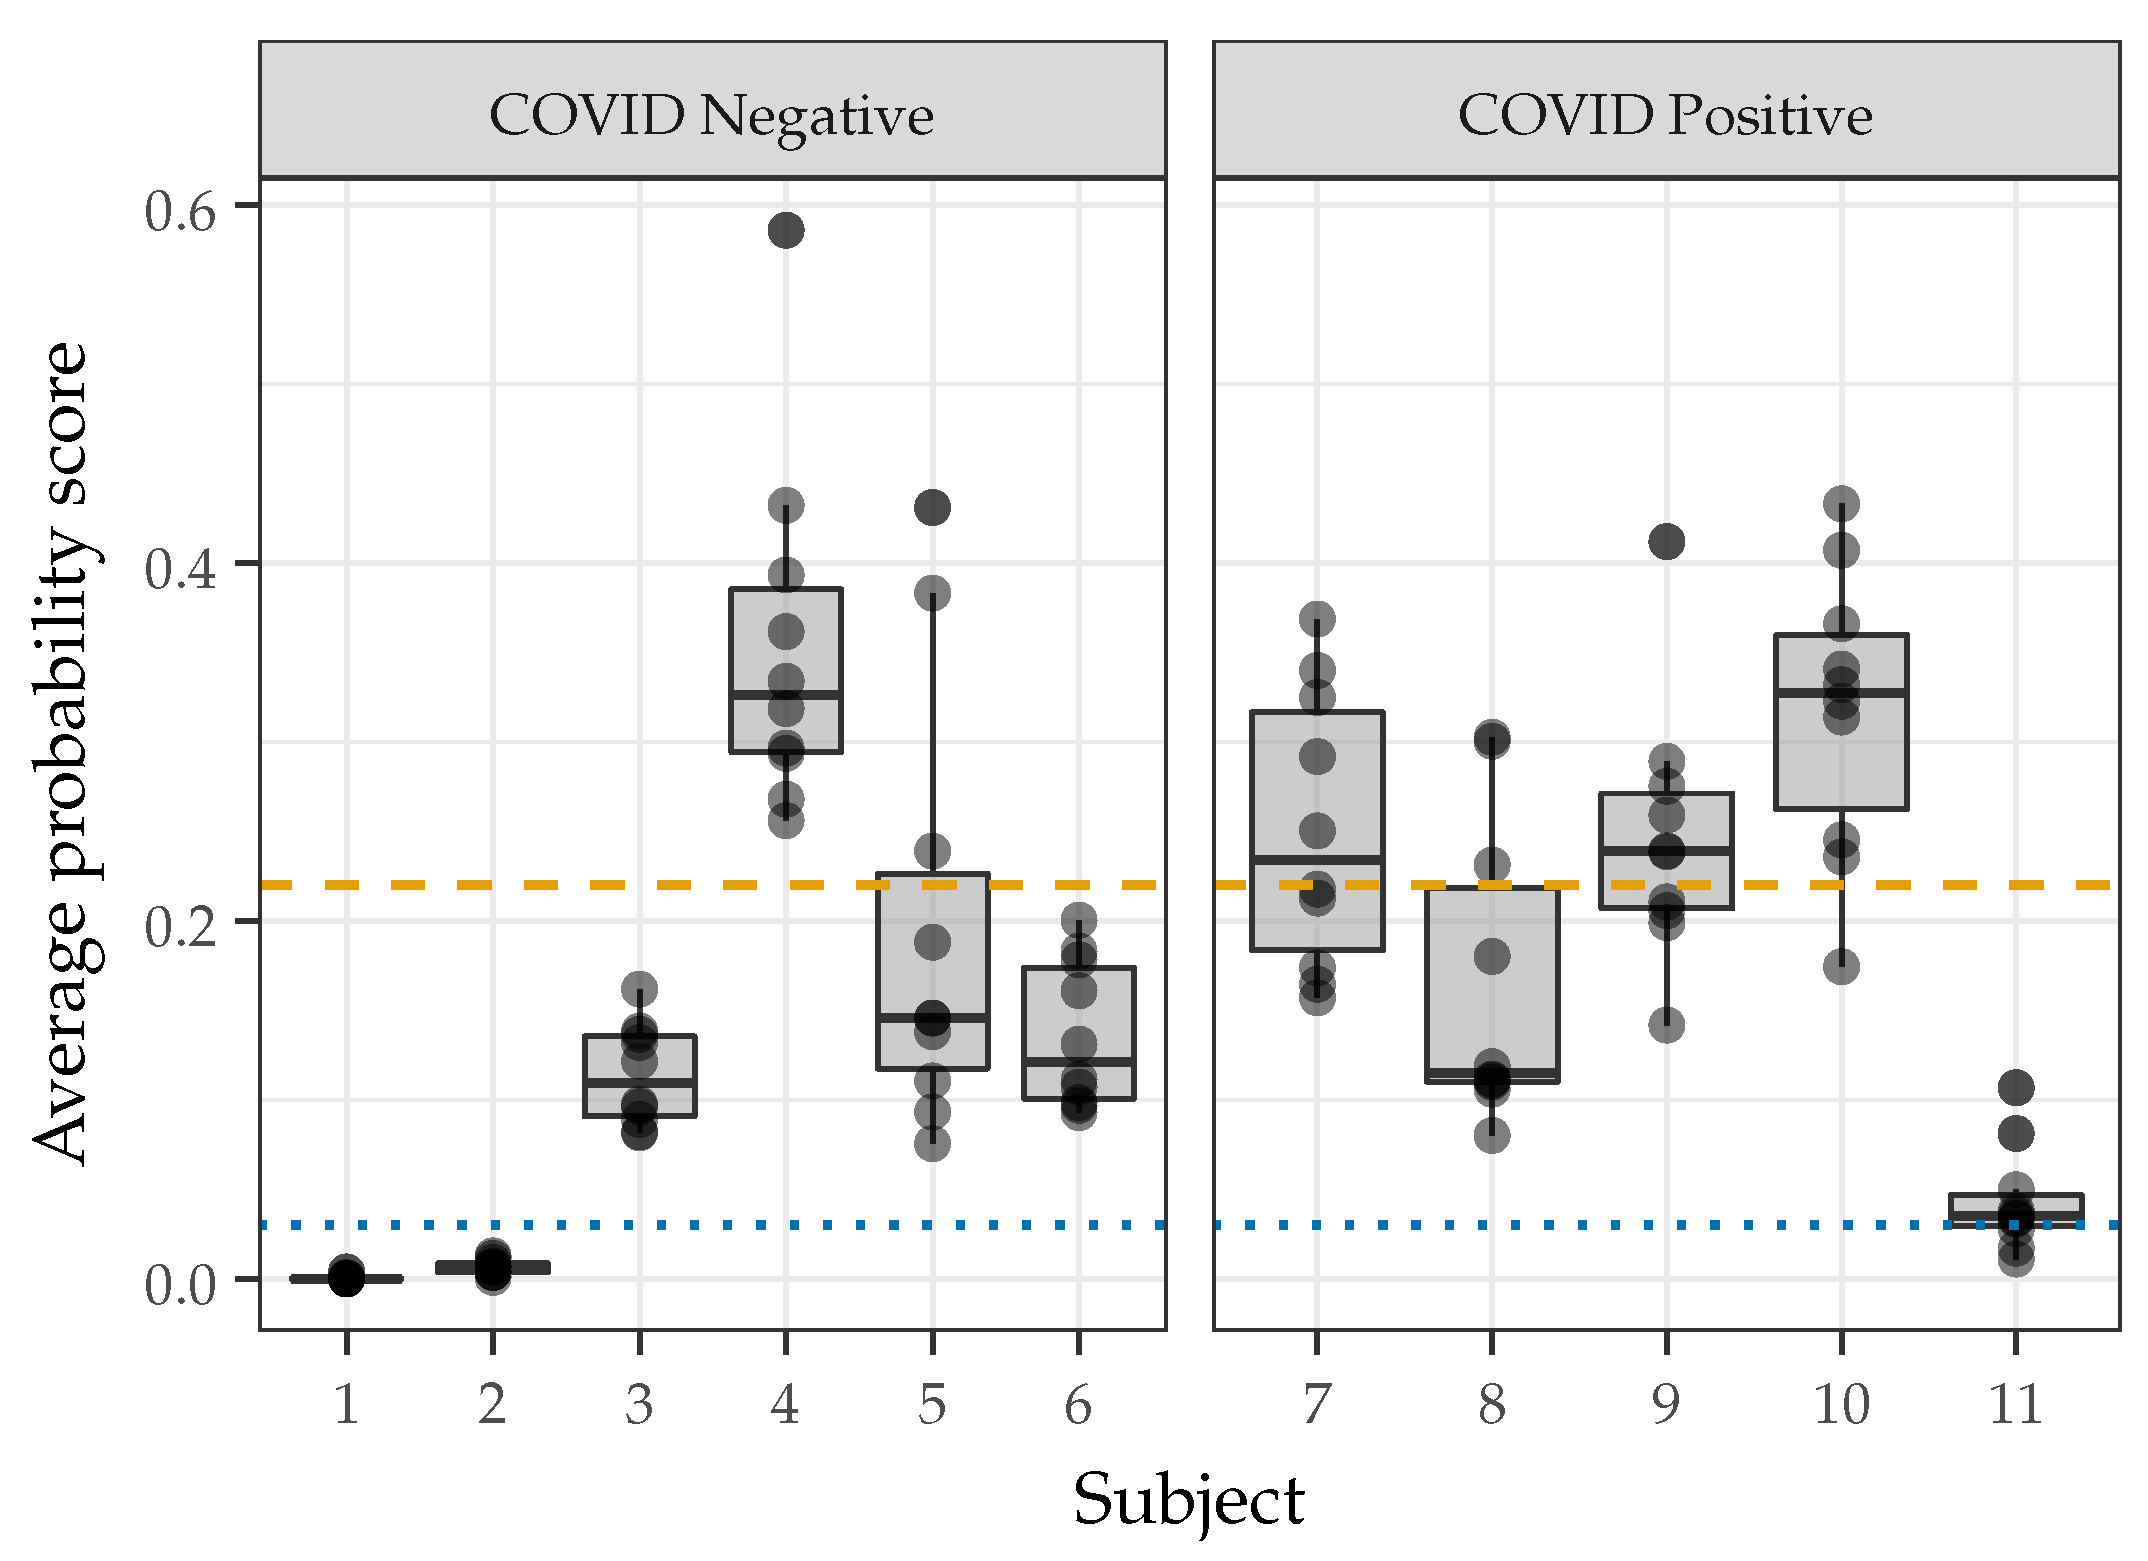
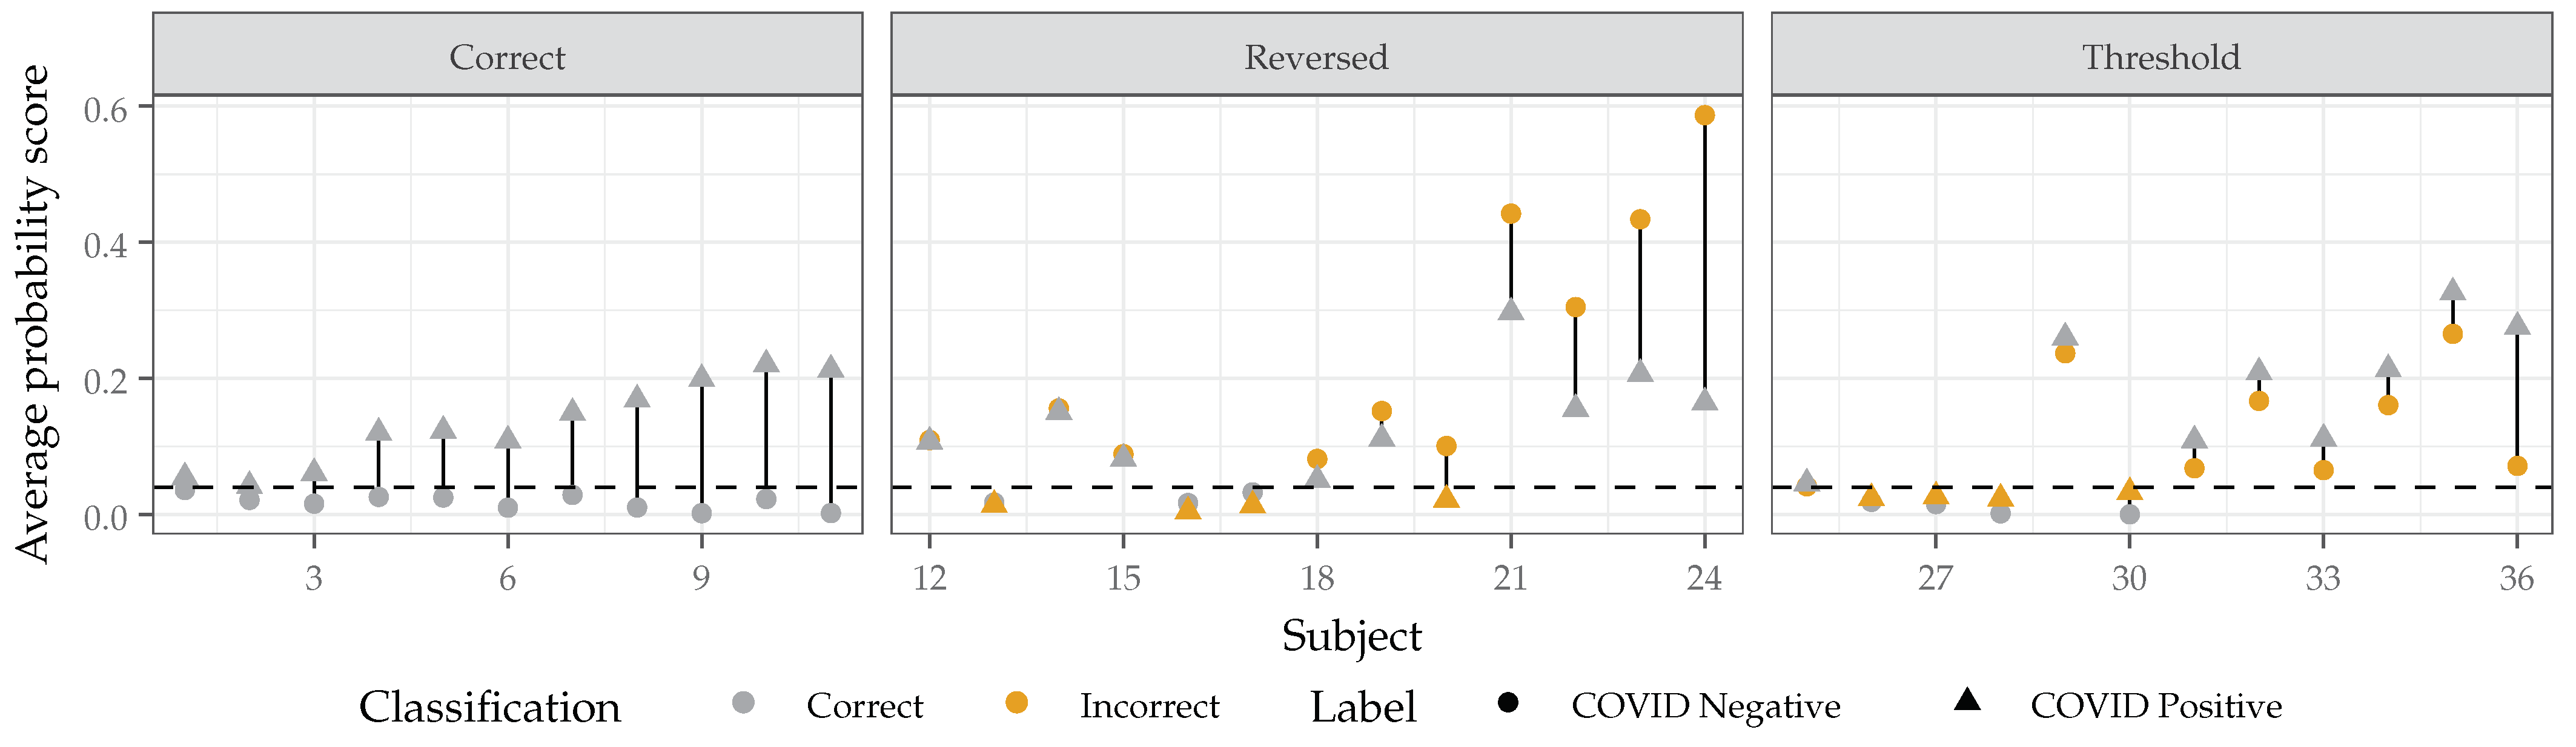
3.6. Single Speaker Repeatability and Discrimination
3.7. Summary and Limitations
4. Conclusions
Author Contributions
Funding
Institutional Review Board Statement
Informed Consent Statement
Data Availability Statement
Acknowledgments
Conflicts of Interest
References
- Self, W.H.; Tenforde, M.W.; Rhoads, J.P.; Gaglani, M.; Ginde, A.A.; Douin, D.J.; Olson, S.M.; Talbot, H.K.; Casey, J.D.; Mohr, N.M.; et al. Comparative Effectiveness of Moderna, Pfizer-BioNTech, and Janssen (Johnson & Johnson) Vaccines in Preventing COVID-19 Hospitalizations Among Adults Without Immunocompromising Conditions—United States, March–August 2021. Morb. Mortal. Wkly. Rep. 2021, 70, 1337–1343. [Google Scholar] [CrossRef]
- Johansson, M.A.; Quandelacy, T.M.; Kada, S.; Prasad, P.V.; Steele, M.; Brooks, J.T.; Slayton, R.B.; Biggerstaff, M.; Butler, J.C. SARS-CoV-2 Transmission From People Without COVID-19 Symptoms. JAMA Netw. Open 2021, 4, e2035057. [Google Scholar] [CrossRef] [PubMed]
- Medicine, T.L.R. Future pandemics: Failing to prepare means preparing to fail. Lancet Respir. Med. 2022, 10, 221–222. [Google Scholar] [CrossRef] [PubMed]
- Haldane, V.; Jung, A.S.; Neill, R.; Singh, S.; Wu, S.; Jamieson, M.; Verma, M.; Tan, M.; De Foo, C.; Abdalla, S.M.; et al. From response to transformation: How countries can strengthen national pandemic preparedness and response systems. BMJ 2021, 375, e067507. [Google Scholar] [CrossRef] [PubMed]
- Tromberg, B.J.; Schwetz, T.A.; Pérez-Stable, E.J.; Hodes, R.J.; Woychik, R.P.; Bright, R.A.; Fleurence, R.L.; Collins, F.S. Rapid scaling up of COVID-19 diagnostic testing in the United States—the NIH RADx initiative. N. Engl. J. Med. 2020, 383, 1071–1077. [Google Scholar] [CrossRef]
- Okoye, N.C.; Barker, A.P.; Curtis, K.; Orlandi, R.R.; Snavely, E.A.; Wright, C.; Hanson, K.E.; Pearson, L.N. Performance Characteristics of BinaxNOW COVID-19 Antigen Card for Screening Asymptomatic Individuals in a University Setting. J. Clin. Microbiol. 2021, 59, e03282-20. [Google Scholar] [CrossRef]
- Ford, L.; Lee, C.; Pray, I.W.; Cole, D.; Bigouette, J.P.; Abedi, G.R. Epidemiologic characteristics associated with SARS-CoV-2 antigen-based test results, rRT-PCR cycle threshold values, subgenomic RNA, and viral culture results from university testing. Clin. Infect. Dis. 2021, ciab303, 33846714. [Google Scholar]
- Lab Advisory: SARS-CoV-2 Variant Classification Updates. 2021. Available online: https://www.cdc.gov/locs/2021/09-22-2021-lab-advisory-CDC-Updates-SARS-CoV-2-Variant-Classifications_1.html (accessed on 14 April 2022).
- Laguarta, J.; Hueto, F.; Subirana, B. COVID-19 Artificial Intelligence Diagnosis Using Only Cough Recordings. IEEE Open J. Eng. Med. Biol. 2020, 1, 275–281. [Google Scholar] [CrossRef]
- Imran, A.; Posokhova, I.; Qureshi, H.N.; Masood, U.; Riaz, M.S.; Ali, K.; John, C.N.; Hussain, M.I.; Nabeel, M. AI4COVID-19: AI enabled preliminary diagnosis for COVID-19 from cough samples via an app. Inform. Med. Unlocked 2020, 20, 100378. [Google Scholar] [CrossRef]
- Pahar, M.; Klopper, M.; Warren, R.; Niesler, T. COVID-19 Detection in Cough, Breath and Speech using Deep Transfer Learning and Bottleneck Features. arXiv 2021, arXiv:2104.02477. [Google Scholar] [CrossRef]
- Pinkas, G.; Karny, Y.; Malachi, A.; Barkai, G.; Bachar, G.; Aharonson, V. SARS-CoV-2 Detection From Voice. IEEE Open J. Eng. Med. Biol. 2020, 1, 268–274. [Google Scholar] [CrossRef] [PubMed]
- Sharma, N.; Karny, Y.; Malachi, A.; Barkai, G.; Bachar, G.; Aharonson, V. Coswara–A Database of Breathing, Cough, and Voice Sounds for COVID-19 Diagnosis. arXiv 2020, arXiv:2005.10548. [Google Scholar]
- Muguli, A.; Pinto, L.; Sharma, N.; Krishnan, P.; Ghosh, P.K.; Kumar, R.; Bhat, S.; Chetupalli, S.R.; Ganapathy, S.; Ramoji, S.; et al. DiCOVA Challenge: Dataset, task, and baseline system for COVID-19 diagnosis using acoustics. arXiv 2021, arXiv:2103.09148. [Google Scholar]
- Xia, T.; Spathis, D.; Ch, J.; Grammenos, A.; Han, J.; Hasthanasombat, A.; Bondareva, E.; Dang, T.; Floto, A.; Cicuta, P.; et al. COVID-19 Sounds: A Large-Scale Audio Dataset for Digital Respiratory Screening. In Proceedings of the Thirty-fifth Conference on Neural Information Processing Systems Datasets and Benchmarks Track (Round 2), Virtual, 6–14 December 2021. [Google Scholar]
- Orlandic, L.; Teijeiro, T.; Atienza, D. The COUGHVID crowdsourcing dataset, a corpus for the study of large-scale cough analysis algorithms. Sci. Data 2021, 8, 156. [Google Scholar] [CrossRef]
- Mohammed, E.A.; Keyhani, M.; Sanati-Nezhad, A.; Hejazi, S.H.; Far, B.H. An ensemble learning approach to digital corona virus preliminary screening from cough sounds. Sci. Rep. 2021, 11, 15404. [Google Scholar] [CrossRef]
- Aly, M.; Rahouma, K.H.; Ramzy, S.M. Pay attention to the speech: COVID-19 diagnosis using machine learning and crowdsourced respiratory and speech recordings. Alex. Eng. J. 2022, 61, 3487–3500. [Google Scholar] [CrossRef]
- Fathan, A.; Alam, J.; Kang, W.H. An Ensemble Approach for the Diagnosis of COVID-19 from Speech and Cough Sounds. In Proceedings of the International Conference on Speech and Computer, St. Petersburg, Russia, 27–30 September 2021; Springer: Berlin/Heidelberg, Germany, 2021; pp. 190–201. [Google Scholar]
- Mouawad, P.; Dubnov, T.; Dubnov, S. Robust Detection of COVID-19 in Cough Sounds. SN Comput. Sci. 2021, 2, 34. [Google Scholar] [CrossRef]
- Grant, D.; McLane, I.; West, J. Rapid and Scalable COVID-19 Screening using Speech, Breath, and Cough Recordings. In Proceedings of the 2021 IEEE EMBS International Conference on Biomedical and Health Informatics (BHI), Athens, Greece, 27–30 July 2021; pp. 1–6. [Google Scholar] [CrossRef]
- Sharma, N.K.; Chetupalli, S.R.; Bhattacharya, D.; Dutta, D.; Mote, P.; Ganapathy, S. The Second DiCOVA Challenge: Dataset and performance analysis for COVID-19 diagnosis using acoustics. arXiv 2021, arXiv:2110.01177. [Google Scholar]
- Zhao, W.; Singh, R. Speech-Based Parameter Estimation of an Asymmetric Vocal Fold Oscillation Model and its Application in Discriminating Vocal Fold Pathologies. In Proceedings of the ICASSP 2020—2020 IEEE International Conference on Acoustics, Speech and Signal Processing (ICASSP), Barcelona, Spain, 4–8 May 2020; pp. 7344–7348. [Google Scholar] [CrossRef]
- Al Ismail, M.; Deshmukh, S.; Singh, R. Detection of COVID-19 through the analysis of vocal fold oscillations. In Proceedings of the ICASSP 2021—2021 IEEE International Conference on Acoustics, Speech and Signal Processing (ICASSP), Virtual, 6–12 June 2021; pp. 1035–1039. [Google Scholar]
- Coronavirus: COVID-19 Detecting Apps Face Teething Problems. BBC News, 8 April 2020.
- Sami, T. Pfizer Revises Resapp Offer on Heels of Failed Data Confirmation Study. Results from Data Confirmation Study. Available online: http://www.iupac.org/dhtml_home.html (accessed on 2 December 2022).
- Khanzada, A.; Hegde, S.; Sreeram, S.; Bower, G.; Wang, W.; Mediratta, R.P.; Meister, K.D.; Rameau, A. Challenges and opportunities in deploying COVID-19 cough AI systems. J. Voice 2021, 35, 811–812. [Google Scholar] [CrossRef]
- Coppock, H.; Jones, L.; Kiskin, I.; Schuller, B. COVID-19 detection from audio: Seven grains of salt. Lancet Digit. Health 2021, 3, e537–e538. [Google Scholar] [CrossRef] [PubMed]
- Han, J.; Xia, T.; Spathis, D.; Bondareva, E.; Brown, C.; Chauhan, J.; Dang, T.; Grammenos, A.; Hasthanasombat, A.; Floto, A.; et al. Sounds of COVID-19: Exploring realistic performance of audio-based digital testing. arXiv 2021, arXiv:2106.15523. [Google Scholar] [CrossRef] [PubMed]
- Sharma, G.; Umapathy, K.; Krishnan, S. Trends in audio signal feature extraction methods. Appl. Acoust. 2020, 158, 107020. [Google Scholar] [CrossRef]
- Brown, C.; Chauhan, J.; Grammenos, A.; Han, J.; Hasthanasombat, A.; Spathis, D.; Xia, T.; Cicuta, P.; Mascolo, C. Exploring Automatic Diagnosis of COVID-19 from Crowdsourced Respiratory Sound Data. arXiv 2020, arXiv:2006.05919. [Google Scholar]
- Yumoto, E.; Gould, W.; Baer, T. Harmonics-to-noise ratio as an index of the degree of hoarseness. J. Acoust. Soc. Am. 1982, 71, 1544–1550. [Google Scholar] [CrossRef]
- Al-Shoshan, A.I. Speech and Music Classification and Separation: A Review. J. King Saud Univ. Eng. Sci. 2006, 19, 95–132. [Google Scholar] [CrossRef]
- Hermansky, H.; Cohen, J.R.; Stern, R.M. Perceptual Properties of Current Speech Recognition Technology. Proc. IEEE 2013, 101, 1968–1985. [Google Scholar] [CrossRef]
- Taylor, P. Text-to-Speech Synthesis; Cambridge University Press: Cambridge, UK, 2009. [Google Scholar]
- Mitrović, D.; Zeppelzauer, M.; Breiteneder, C. Chapter 3—Features for Content-Based Audio Retrieval. In Advances in Computers: Improving the Web; Elsevier: Amsterdam, The Netherlands, 2010; Volume 78, pp. 71–150. [Google Scholar] [CrossRef]
- Chu, S.; Narayanan, S.; Kuo, C.C.J. Environmental Sound Recognition With Time–Frequency Audio Features. IEEE Trans. Audio Speech Lang. Process. 2009, 17, 1142–1158. [Google Scholar] [CrossRef]
- Nakagawa, S.; Wang, L.; Ohtsuka, S. Speaker Identification and Verification by Combining MFCC and Phase Information. IEEE Trans. Audio Speech Lang. Process. 2012, 20, 1085–1095. [Google Scholar] [CrossRef]
- Abushariah, A.A.M.; Gunawan, T.S.; Khalifa, O.O.; Abushariah, M.A.M. English digits speech recognition system based on Hidden Markov Models. In Proceedings of the International Conference on Computer and Communication Engineering (ICCCE’10), Kuala Lumpur, Malaysia, 11–12 May 2010; pp. 1–5. [Google Scholar] [CrossRef]
- Martinez, J.; Perez, H.; Escamilla, E.; Suzuki, M.M. Speaker recognition using Mel frequency Cepstral Coefficients (MFCC) and Vector quantization (VQ) techniques. In Proceedings of the CONIELECOMP 2012, 22nd International Conference on Electrical Communications and Computers, Cholula, Mexico, 27–29 February 2012; pp. 248–251. [Google Scholar] [CrossRef]
- Hermansky, H.; Morgan, N. RASTA processing of speech. IEEE Trans. Speech Audio Process. 1994, 2, 578–589. [Google Scholar] [CrossRef]
- O’Shaughnessy, D.D. Linear predictive coding. IEEE Potentials 1988, 7, 29–32. [Google Scholar] [CrossRef]
- Vydana, H.K.; Vuppala, A.K. Investigative study of various activation functions for speech recognition. In Proceedings of the 2017 Twenty-third National Conference on Communications (NCC), Guwahati, India, 23–26 February 2017; pp. 1–5. [Google Scholar] [CrossRef]
- Pedregosa, F.; Varoquaux, G.; Gramfort, A.; Michel, V.; Thirion, B.; Grisel, O.; Blondel, M.; Prettenhofer, P.; Weiss, R.; Dubourg, V.; et al. Scikit-learn: Machine Learning in Python. J. Mach. Learn. Res. 2011, 12, 2825–2830. [Google Scholar]
- Bouthillier, X.; Delaunay, P.; Bronzi, M.; Trofimov, A.; Nichyporuk, B.; Szeto, J.; Sepahv, M.N.; Raff, E.; Madan, K.; Voleti, V.; et al. Accounting for Variance in Machine Learning Benchmarks. Proc. Mach. Learn. Syst. 2021, 3, 747–769. [Google Scholar]
- Florkowski, C.M. Sensitivity, specificity, receiver-operating characteristic (ROC) curves and likelihood ratios: Communicating the performance of diagnostic tests. Clin. Biochem. Rev. 2008, 29 (Suppl. S1), S83–S87. [Google Scholar]
- Parikh, R.; Mathai, A.; Parikh, S.; Chandra Sekhar, G.; Thomas, R. Understanding and using sensitivity, specificity and predictive values. Indian J. Ophthalmol. 2008, 56, 45–50. [Google Scholar] [CrossRef] [PubMed]
- Flach, P.A. ROC Analysis. In Encyclopedia of Machine Learning; Sammut, C., Webb, G.I., Eds.; Springer: Boston, MA, USA, 2010; pp. 869–875. [Google Scholar] [CrossRef]
- Menardi, G.; Torelli, N. Training and assessing classification rules with imbalanced data. Data Min. Knowl. Discov. 2012, 28, 92–122. [Google Scholar] [CrossRef]
- Hajian-Tilaki, K. Receiver Operating Characteristic (ROC) Curve Analysis for Medical Diagnostic Test Evaluation. Casp. J. Intern. Med. 2013, 4, 627–635. [Google Scholar]
- Pellegrino, E.; Jacques, C.; Beaufils, N.; Nanni, I.; Carlioz, A.; Metellus, P.; Ouafik, L.H. Machine learning random forest for predicting oncosomatic variant NGS analysis. Sci. Rep. 2021, 11, 21820. [Google Scholar] [CrossRef]
- Fluss, R.; Faraggi, D.; Reiser, B. Estimation of the Youden Index and its Associated Cutoff Point. Biom. J. 2005, 47, 458–472. [Google Scholar] [CrossRef]
- Reddy, C.K.; Beyrami, E.; Pool, J.; Cutler, R.; Srinivasan, S.; Gehrke, J. A scalable noisy speech dataset and online subjective test framework. arXiv 2019, arXiv:1909.08050. [Google Scholar]
- McLane, I.; Emmanouilidou, D.; West, J.E.; Elhilali, M. Design and comparative performance of a robust lung auscultation system for noisy clinical settings. IEEE J. Biomed. Health Inform. 2021, 25, 2583–2594. [Google Scholar] [CrossRef] [PubMed]
- Kirchhoff, K.; Bilmes, J. Statistical Acoustic Indications Of Coarticulation. Proc. ICPhS 1999, 99, 1–4. [Google Scholar]
- ZWICKER, E.; ZWICKER, U.T. Audio Engineering and Psychoacoustics: Matching Signals to the Final Receiver, the Human Auditory System. In Readings in Multimedia Computing and Networking; Jeffay, K., Zhang, H., Eds.; The Morgan Kaufmann Series in Multimedia Information and Systems; Morgan Kaufmann: San Francisco, CA, USA, 2002; pp. 11–22. [Google Scholar] [CrossRef]
- Pozo, R.F.; Murillo, J.L.B.; Gómez, L.H.; Gonzalo, E.L.; Ramírez, J.A.; Toledano, D.T. Assessment of Severe Apnoea through Voice Analysis, Automatic Speech, and Speaker Recognition Techniques. EURASIP J. Adv. Signal Process. 2009, 2009, 982531. [Google Scholar] [CrossRef]
- Stasak, B.; Huang, Z.; Razavi, S.; Joachim, D.; Epps, J. Automatic Detection of COVID-19 Based on Short-Duration Acoustic Smartphone Speech Analysis. J. Healthc. Inform. Res. 2021, 5, 201–217. [Google Scholar] [CrossRef] [PubMed]
- Stowell, D.; Wood, M.D.; Pamuła, H.; Stylianou, Y.; Glotin, H. Automatic acoustic detection of birds through deep learning: The first Bird Audio Detection challenge. Methods Ecol. Evol. 2019, 10, 368–380. [Google Scholar] [CrossRef]
- Hoang, T.; Pham, L.; Ngo, D.; Nguyen, H.D. A Cough-based deep learning framework for detecting COVID-19. In Proceedings of the 2022 44th Annual International Conference of the IEEE Engineering in Medicine & Biology Society (EMBC), Glasgow, UK, 11–15 July 2022; pp. 3422–3425. [Google Scholar] [CrossRef]
- Mallol-Ragolta, A.; Cuesta, H.; Gómez, E.; Schuller, B.W. EIHW-MTG: Second DiCOVA Challenge System Report. arXiv 2021, arXiv:2110.09239. [Google Scholar]
- Kamble, M.R.; Patino, J.; Zuluaga, M.A.; Todisco, M. Exploring Auditory Acoustic Features for The Diagnosis of COVID-19. In Proceedings of the ICASSP 2022–2022 IEEE International Conference on Acoustics, Speech and Signal Processing (ICASSP), Virtual, 7–13 May 2022; pp. 566–570. [Google Scholar] [CrossRef]
- Mouliou, D.S.; Gourgoulianis, K.I. False-positive and false-negative COVID-19 cases: Respiratory prevention and management strategies, vaccination, and further perspectives. Expert Rev. Respir. Med. 2021, 15, 993–1002. [Google Scholar] [CrossRef]
- Graf, S.; Herbig, T.; Buck, M.; Schmidt, G. Features for voice activity detection: A comparative analysis. EURASIP J. Adv. Signal Process. 2015, 2015, 91. [Google Scholar] [CrossRef]
- Lee, L.; Loudon, R.G.; Jacobson, B.H.; Stuebing, R. Speech breathing in patients with lung disease. Am. Rev. Respir. Dis. 1993, 147, 1199–1206. [Google Scholar] [CrossRef]
- Saeed, U.; Shah, S.Y.; Ahmad, J.; Imran, M.A.; Abbasi, Q.H.; Shah, S.A. Machine learning empowered COVID-19 patient monitoring using non-contact sensing: An extensive review. J. Pharm. Anal. 2022, 12, 193–204. [Google Scholar] [CrossRef]


| COVID | Gender | Age Group | COVID Symptoms | Other Respiratory | |||||||||||
|---|---|---|---|---|---|---|---|---|---|---|---|---|---|---|---|
| Condition | |||||||||||||||
| Positive | Female | Male | N/A | 15–29 | 30–45 | 46–59 | >60 | N/A | Asymptomatic | Symptomatic | N/A | Yes | No | N/A | |
| Breathing | 17.0 | 23.4 | 69.5 | 7.1 | 14.7 | 11.3 | 3.8 | 0.7 | 69.5 | 4.2 | 24.3 | 71.5 | 2.2 | 28.9 | 68.8 |
| Cough | 17.1 | 23.4 | 69.7 | 6.9 | 14.7 | 11.3 | 3.8 | 0.7 | 69.5 | 4.2 | 24.3 | 71.5 | 2.2 | 29.1 | 68.7 |
| Speech | 19.7 | 27.5 | 72.5 | 0 | 15.9 | 12.7 | 4.2 | 1.9 | 65.3 | 3.5 | 15.4 | 81.1 | 1.4 | 27.3 | 71.3 |
| Reference | Sound Event | Classification Model | Complexity | AUC-ROC |
|---|---|---|---|---|
| Sharma et al. [22] | Cough | bidirectional Long Short-Term Memory | Moderate | 0.75 |
| Hoang et al. [60] | Cough | TRIpLet Loss Network based Light Gradient Boosting Machine | High | 0.81 |
| Ragolta et al. [61] | Cough | Contextual Attention based Convolutional Neural Network | High | 0.68 |
| Kamble et al. [62] | Cough | bidirectional Long Short-Term Memory | Moderate | 0.77 |
| Proposed System | Cough | Multilayer Perceptron | Low | 0.79 |
Publisher’s Note: MDPI stays neutral with regard to jurisdictional claims in published maps and institutional affiliations. |
© 2022 by the authors. Licensee MDPI, Basel, Switzerland. This article is an open access article distributed under the terms and conditions of the Creative Commons Attribution (CC BY) license (https://creativecommons.org/licenses/by/4.0/).
Share and Cite
Grant, D.; McLane, I.; Rennoll, V.; West, J. Considerations and Challenges for Real-World Deployment of an Acoustic-Based COVID-19 Screening System. Sensors 2022, 22, 9530. https://doi.org/10.3390/s22239530
Grant D, McLane I, Rennoll V, West J. Considerations and Challenges for Real-World Deployment of an Acoustic-Based COVID-19 Screening System. Sensors. 2022; 22(23):9530. https://doi.org/10.3390/s22239530
Chicago/Turabian StyleGrant, Drew, Ian McLane, Valerie Rennoll, and James West. 2022. "Considerations and Challenges for Real-World Deployment of an Acoustic-Based COVID-19 Screening System" Sensors 22, no. 23: 9530. https://doi.org/10.3390/s22239530
APA StyleGrant, D., McLane, I., Rennoll, V., & West, J. (2022). Considerations and Challenges for Real-World Deployment of an Acoustic-Based COVID-19 Screening System. Sensors, 22(23), 9530. https://doi.org/10.3390/s22239530