

Deep Learning Anomaly Classification Using Multi-Attention Residual Blocks for Industrial Control Systems

Abstract
:1. Introduction
2. Background
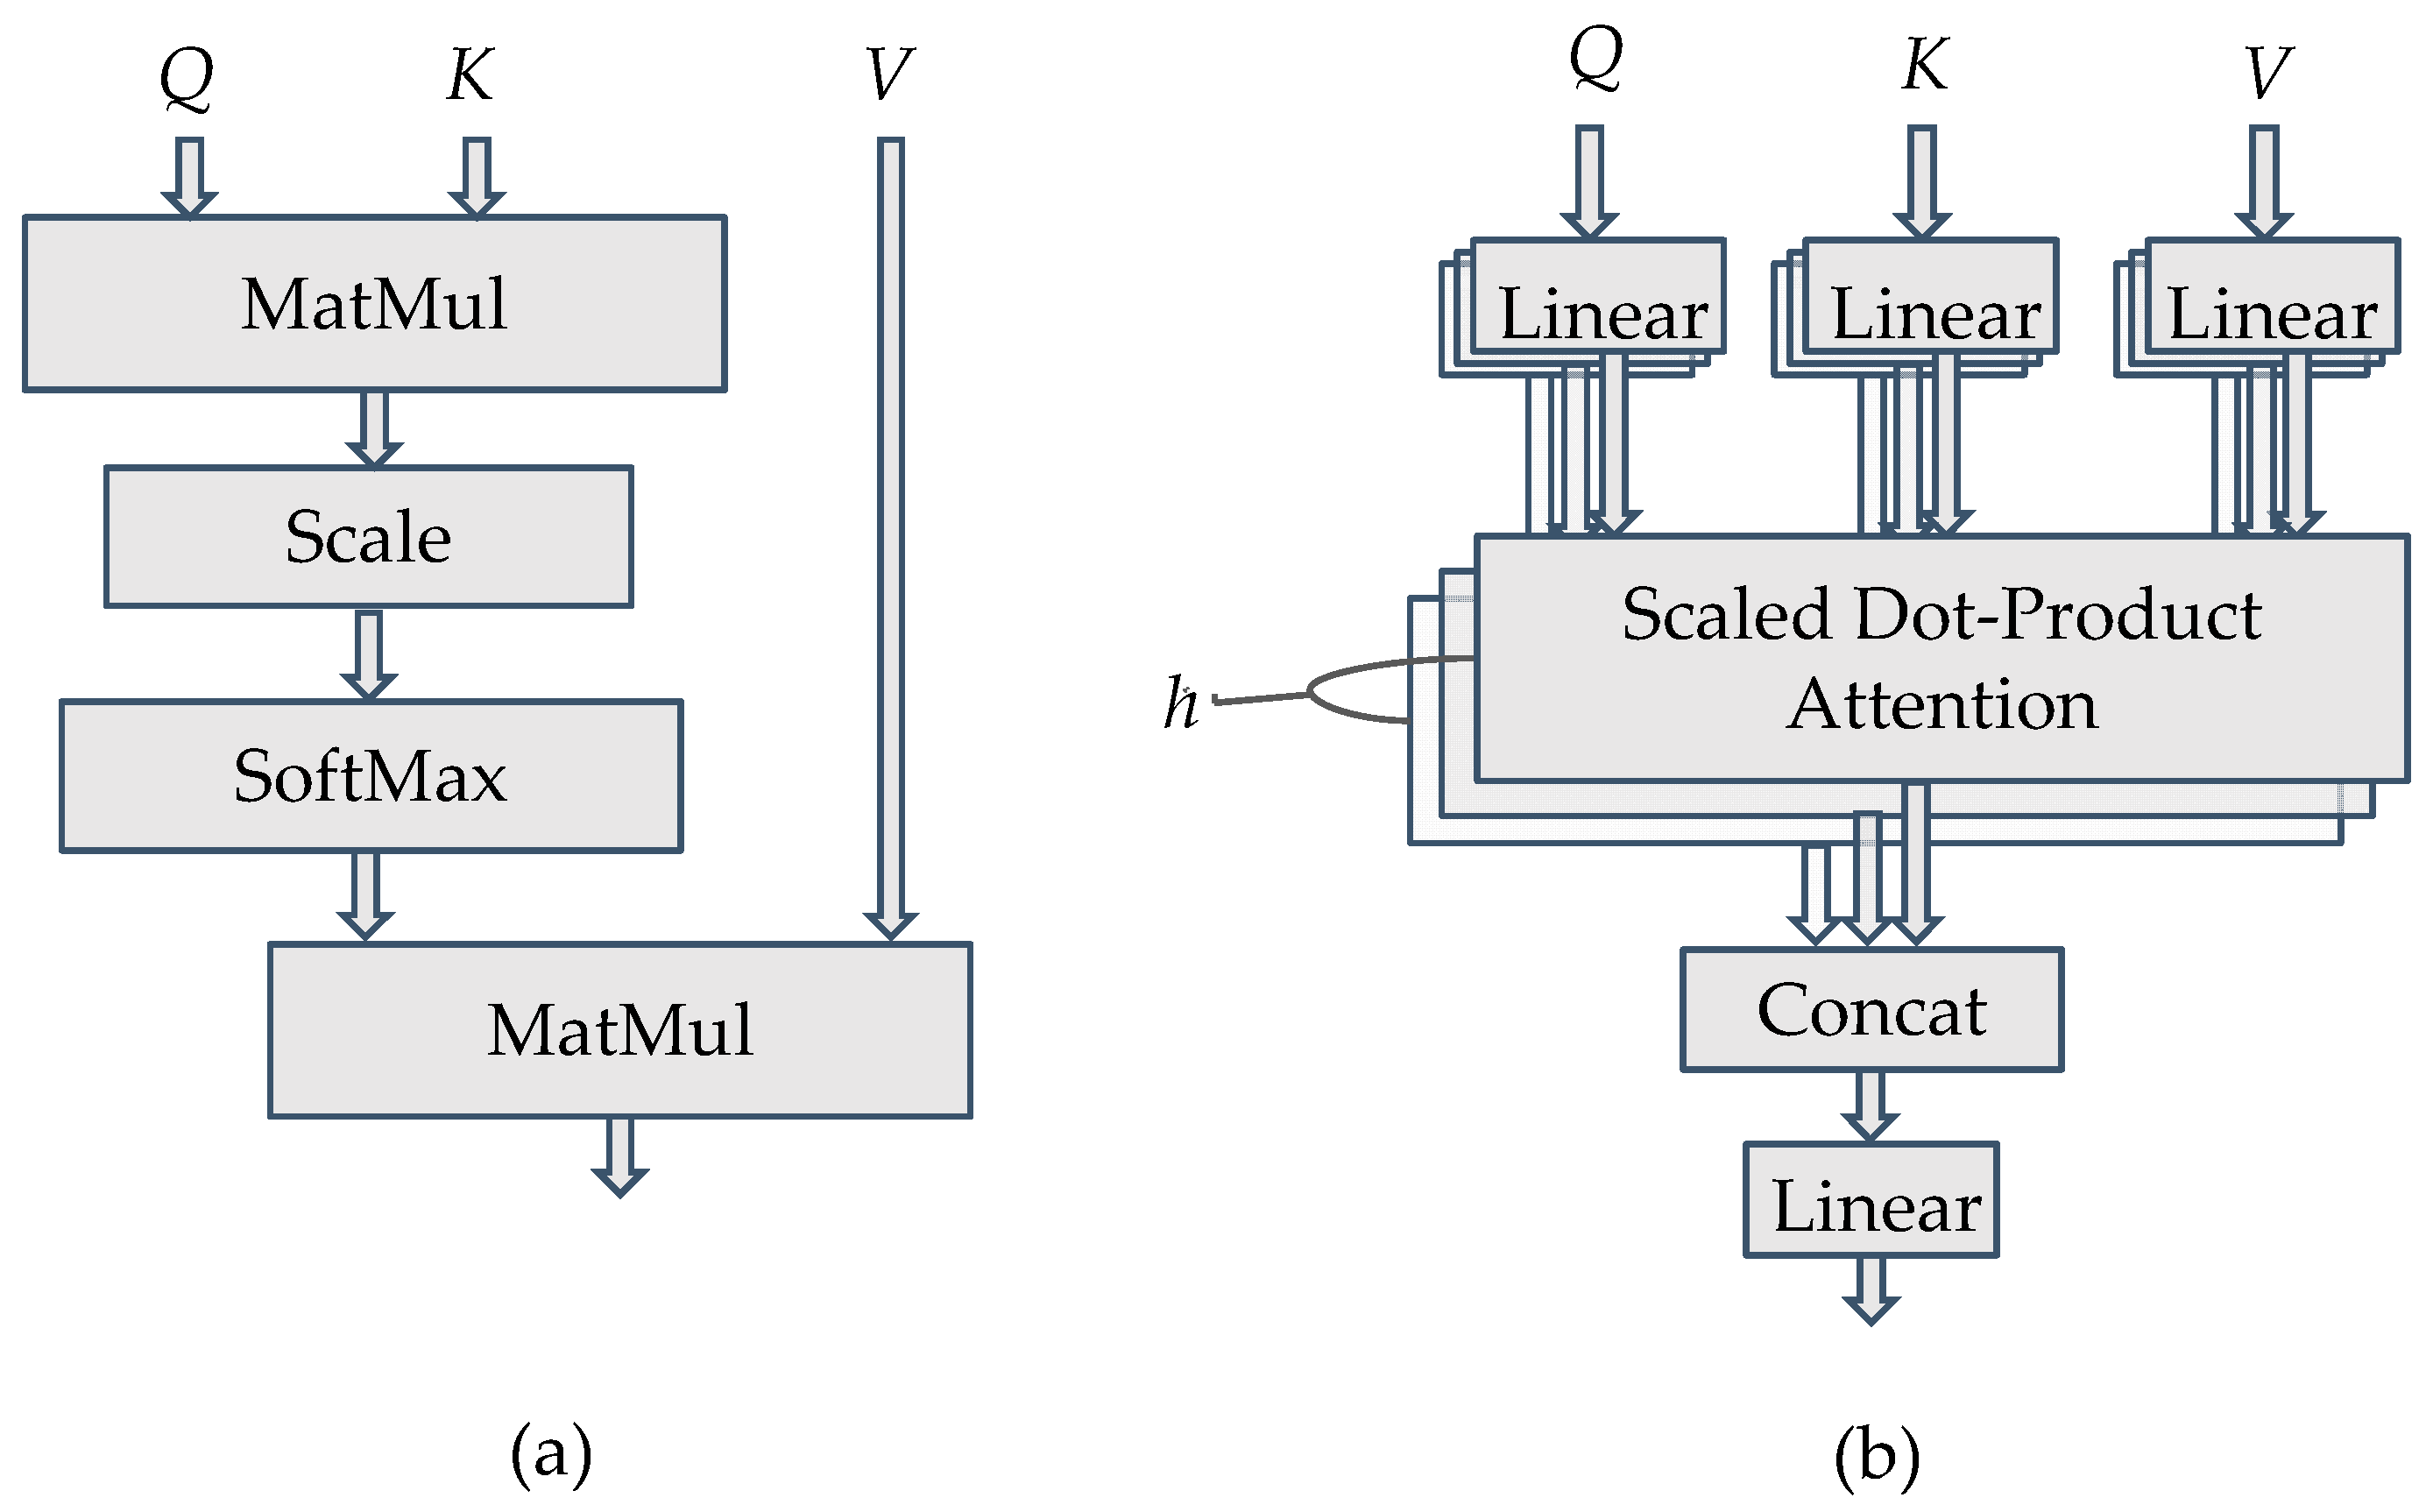
2.1. Multi-Attention Block
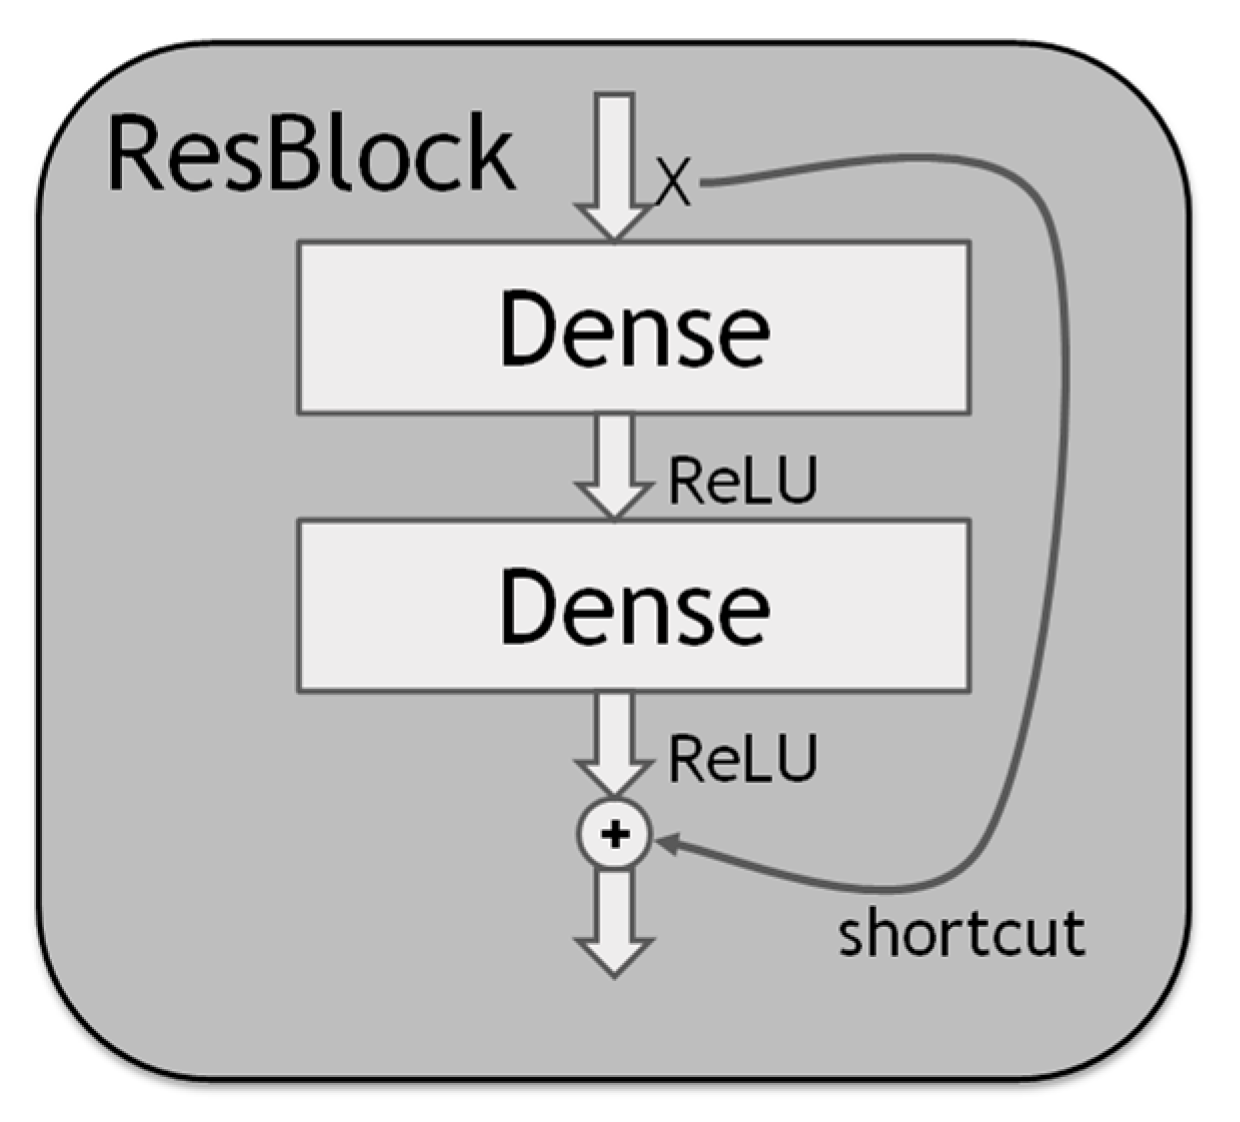
2.2. Residual Block
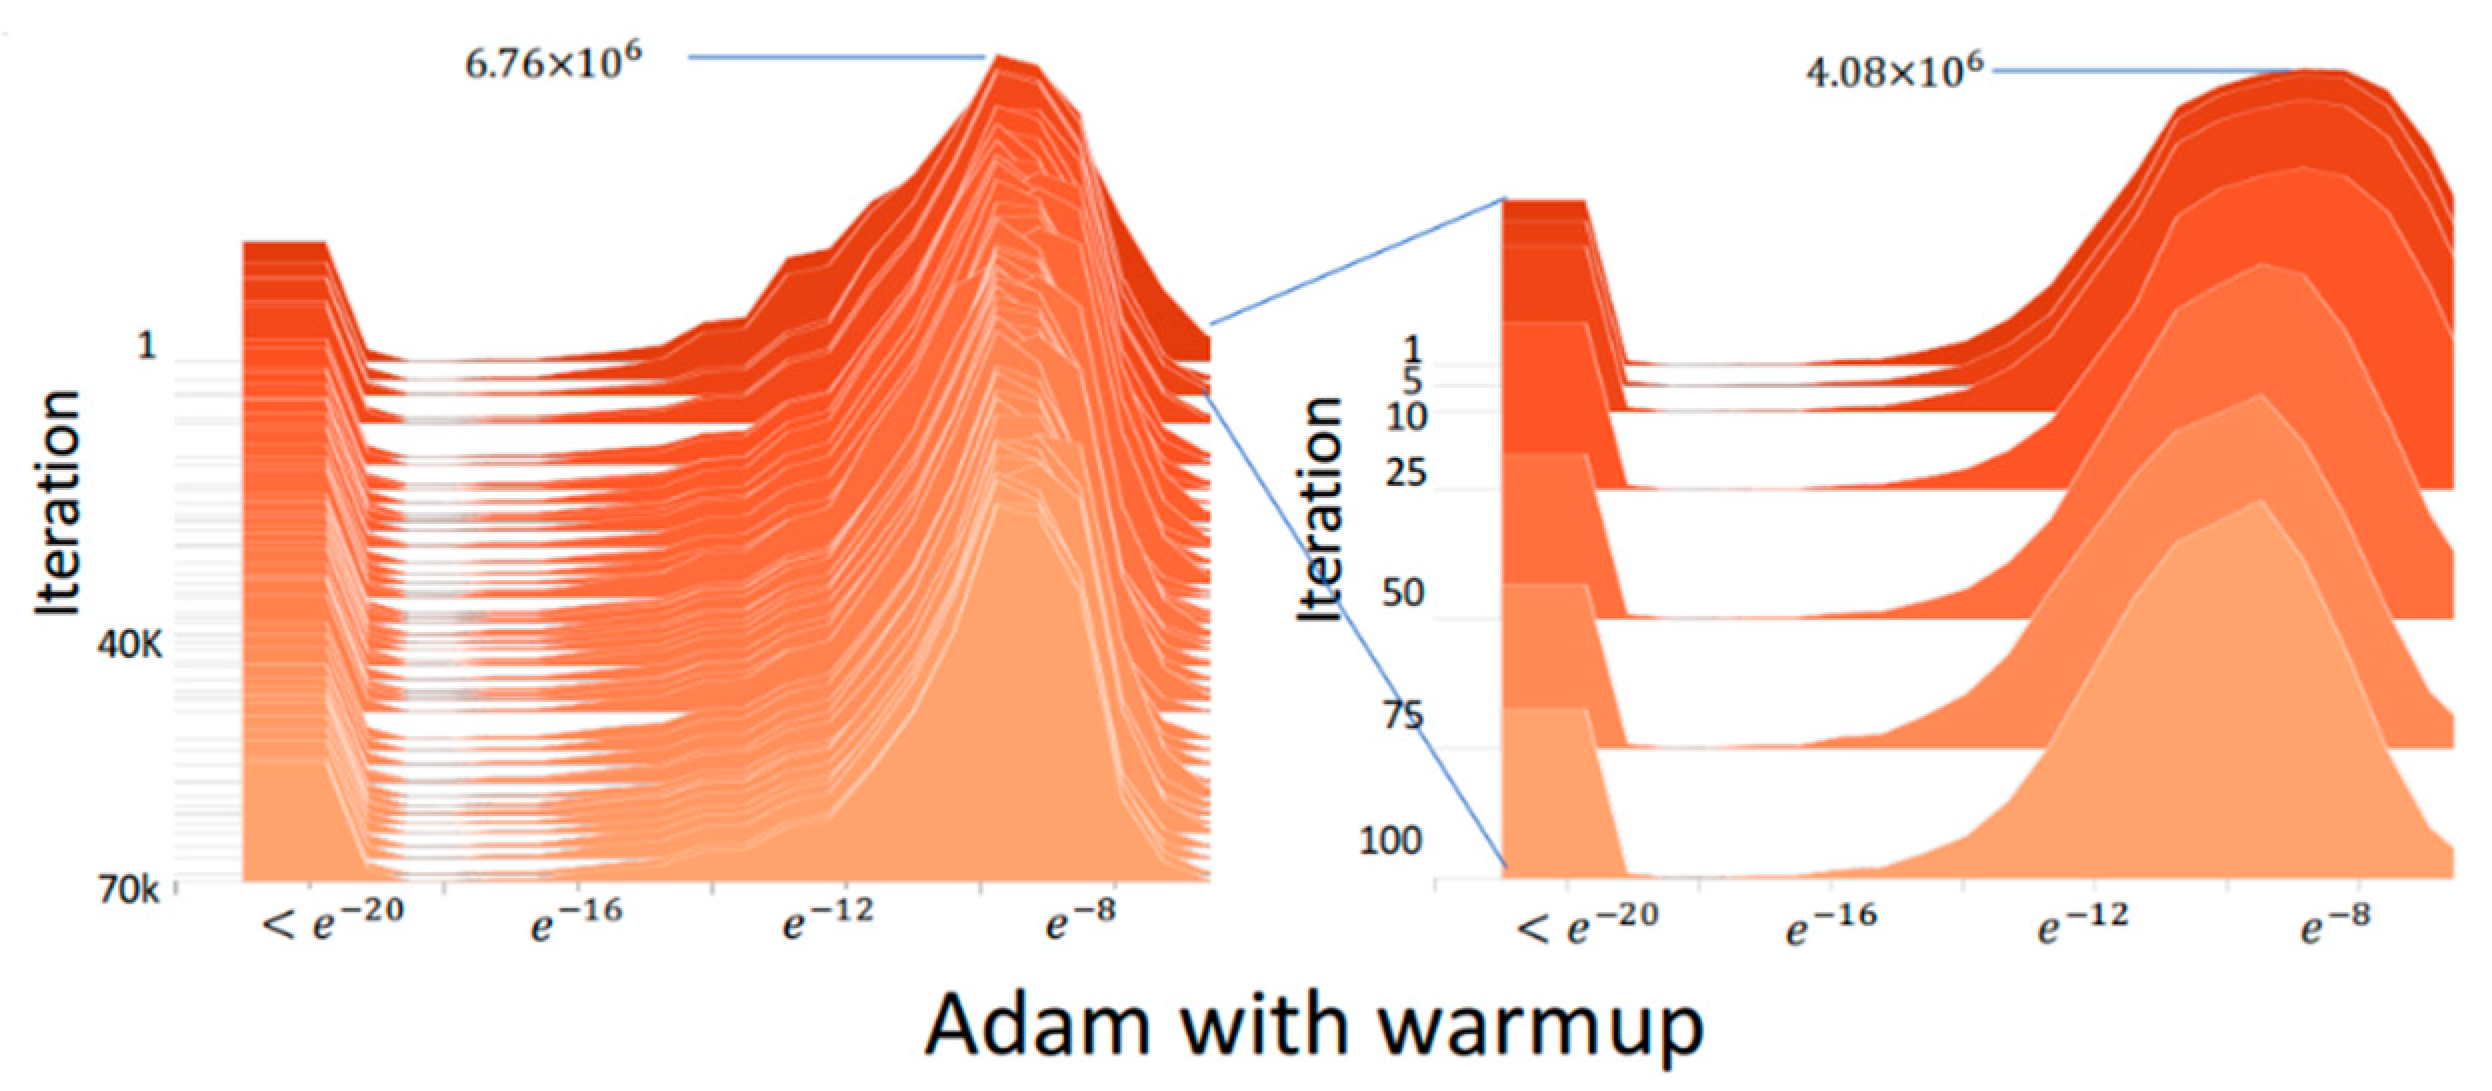
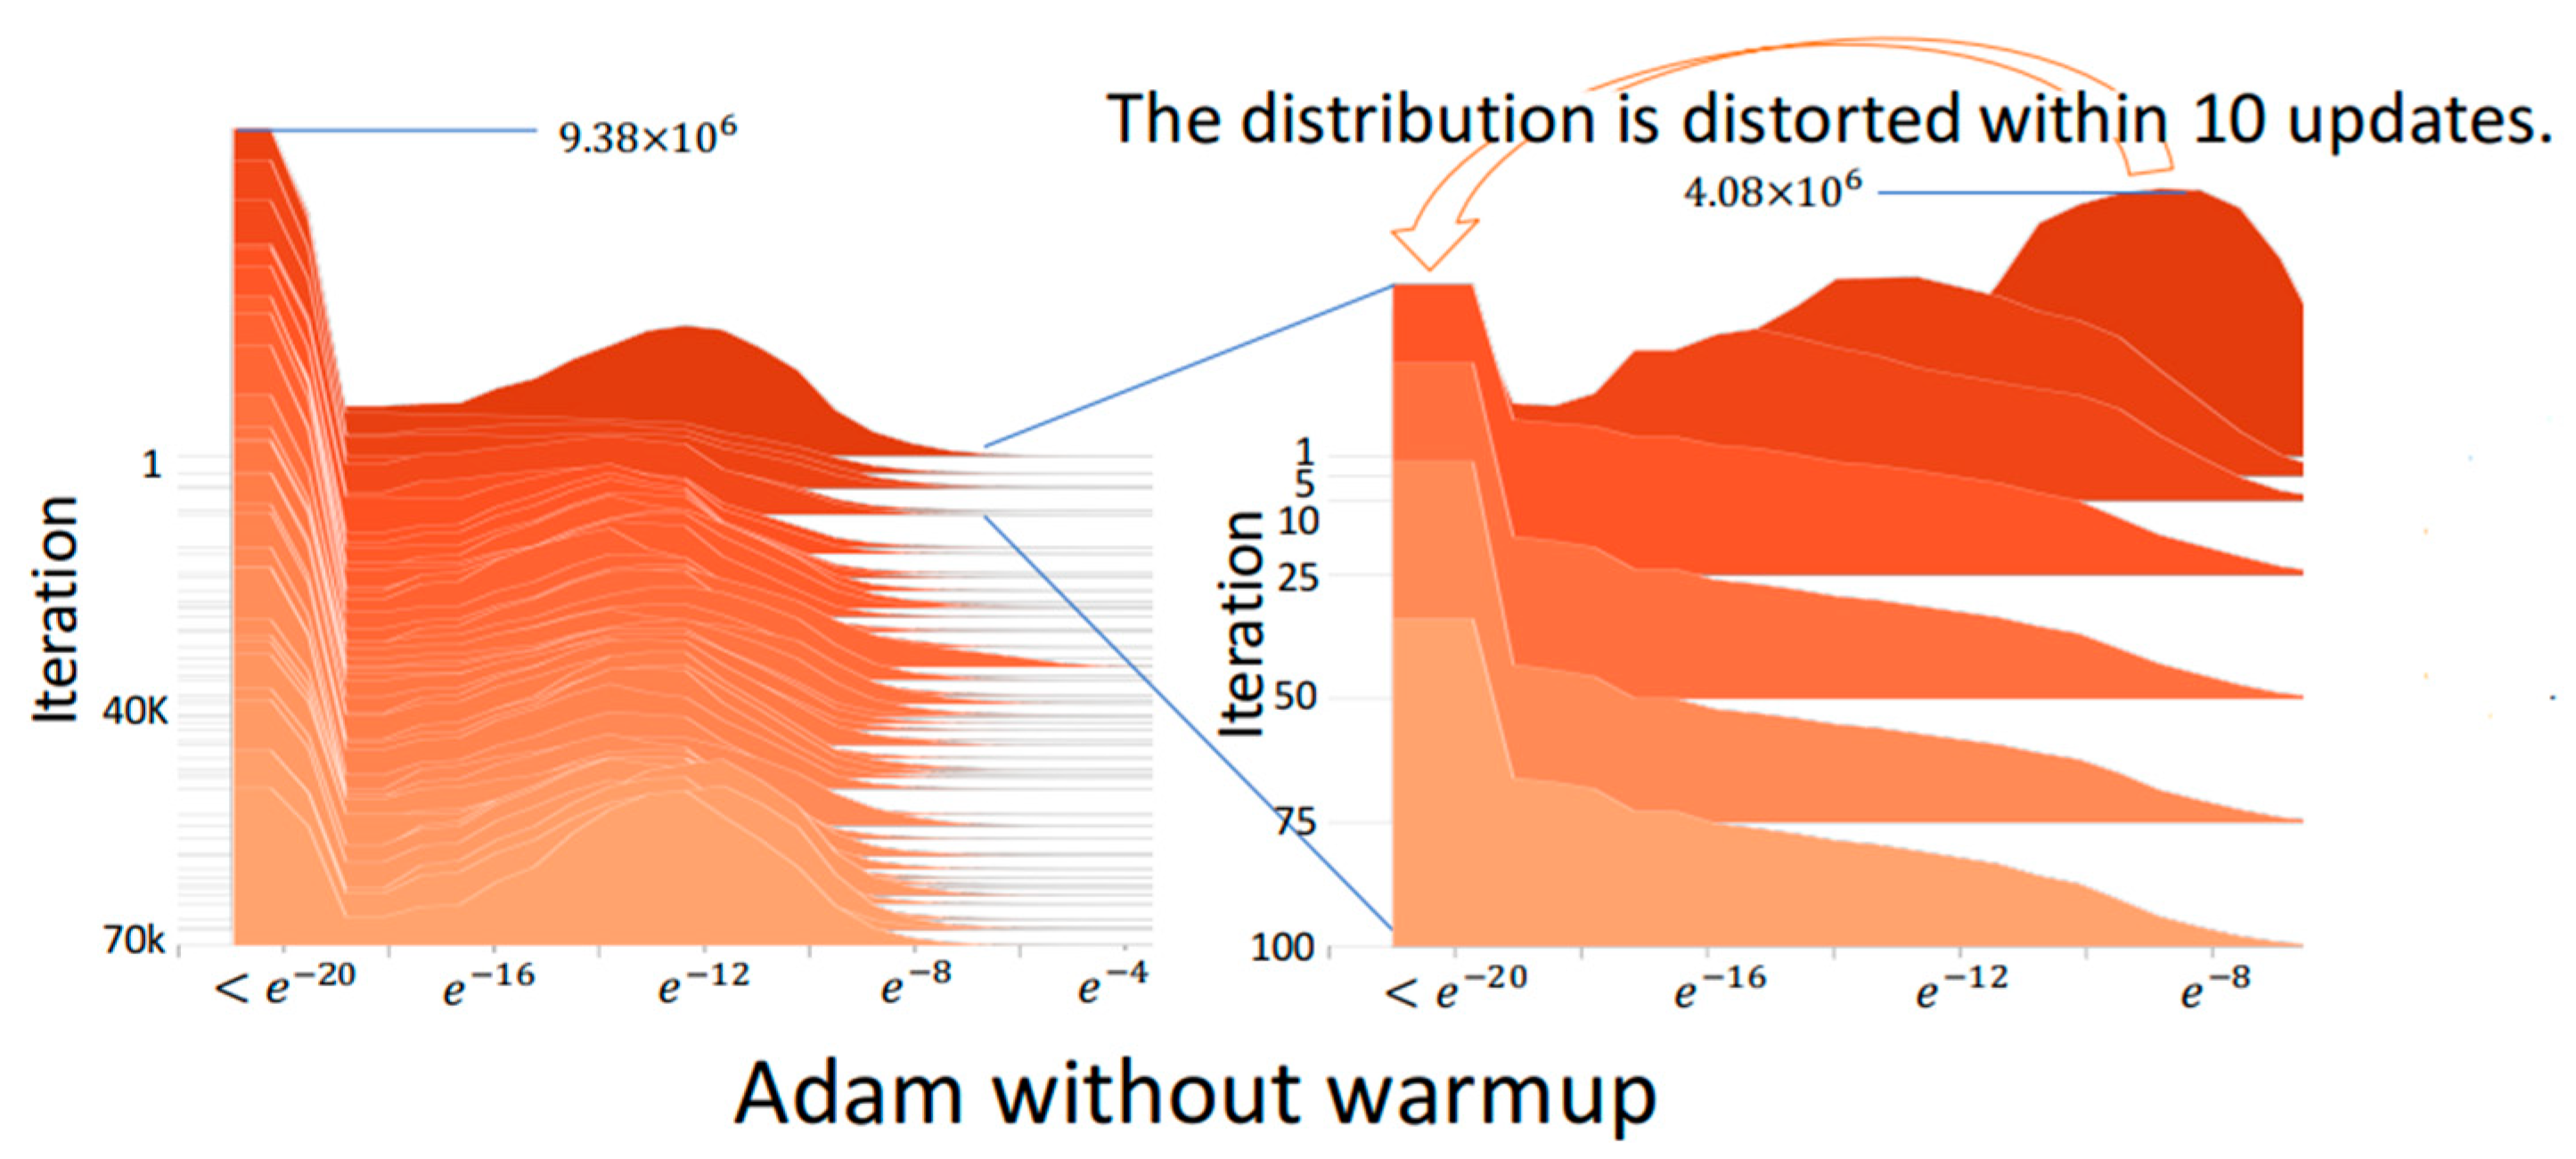
2.3. RAdam
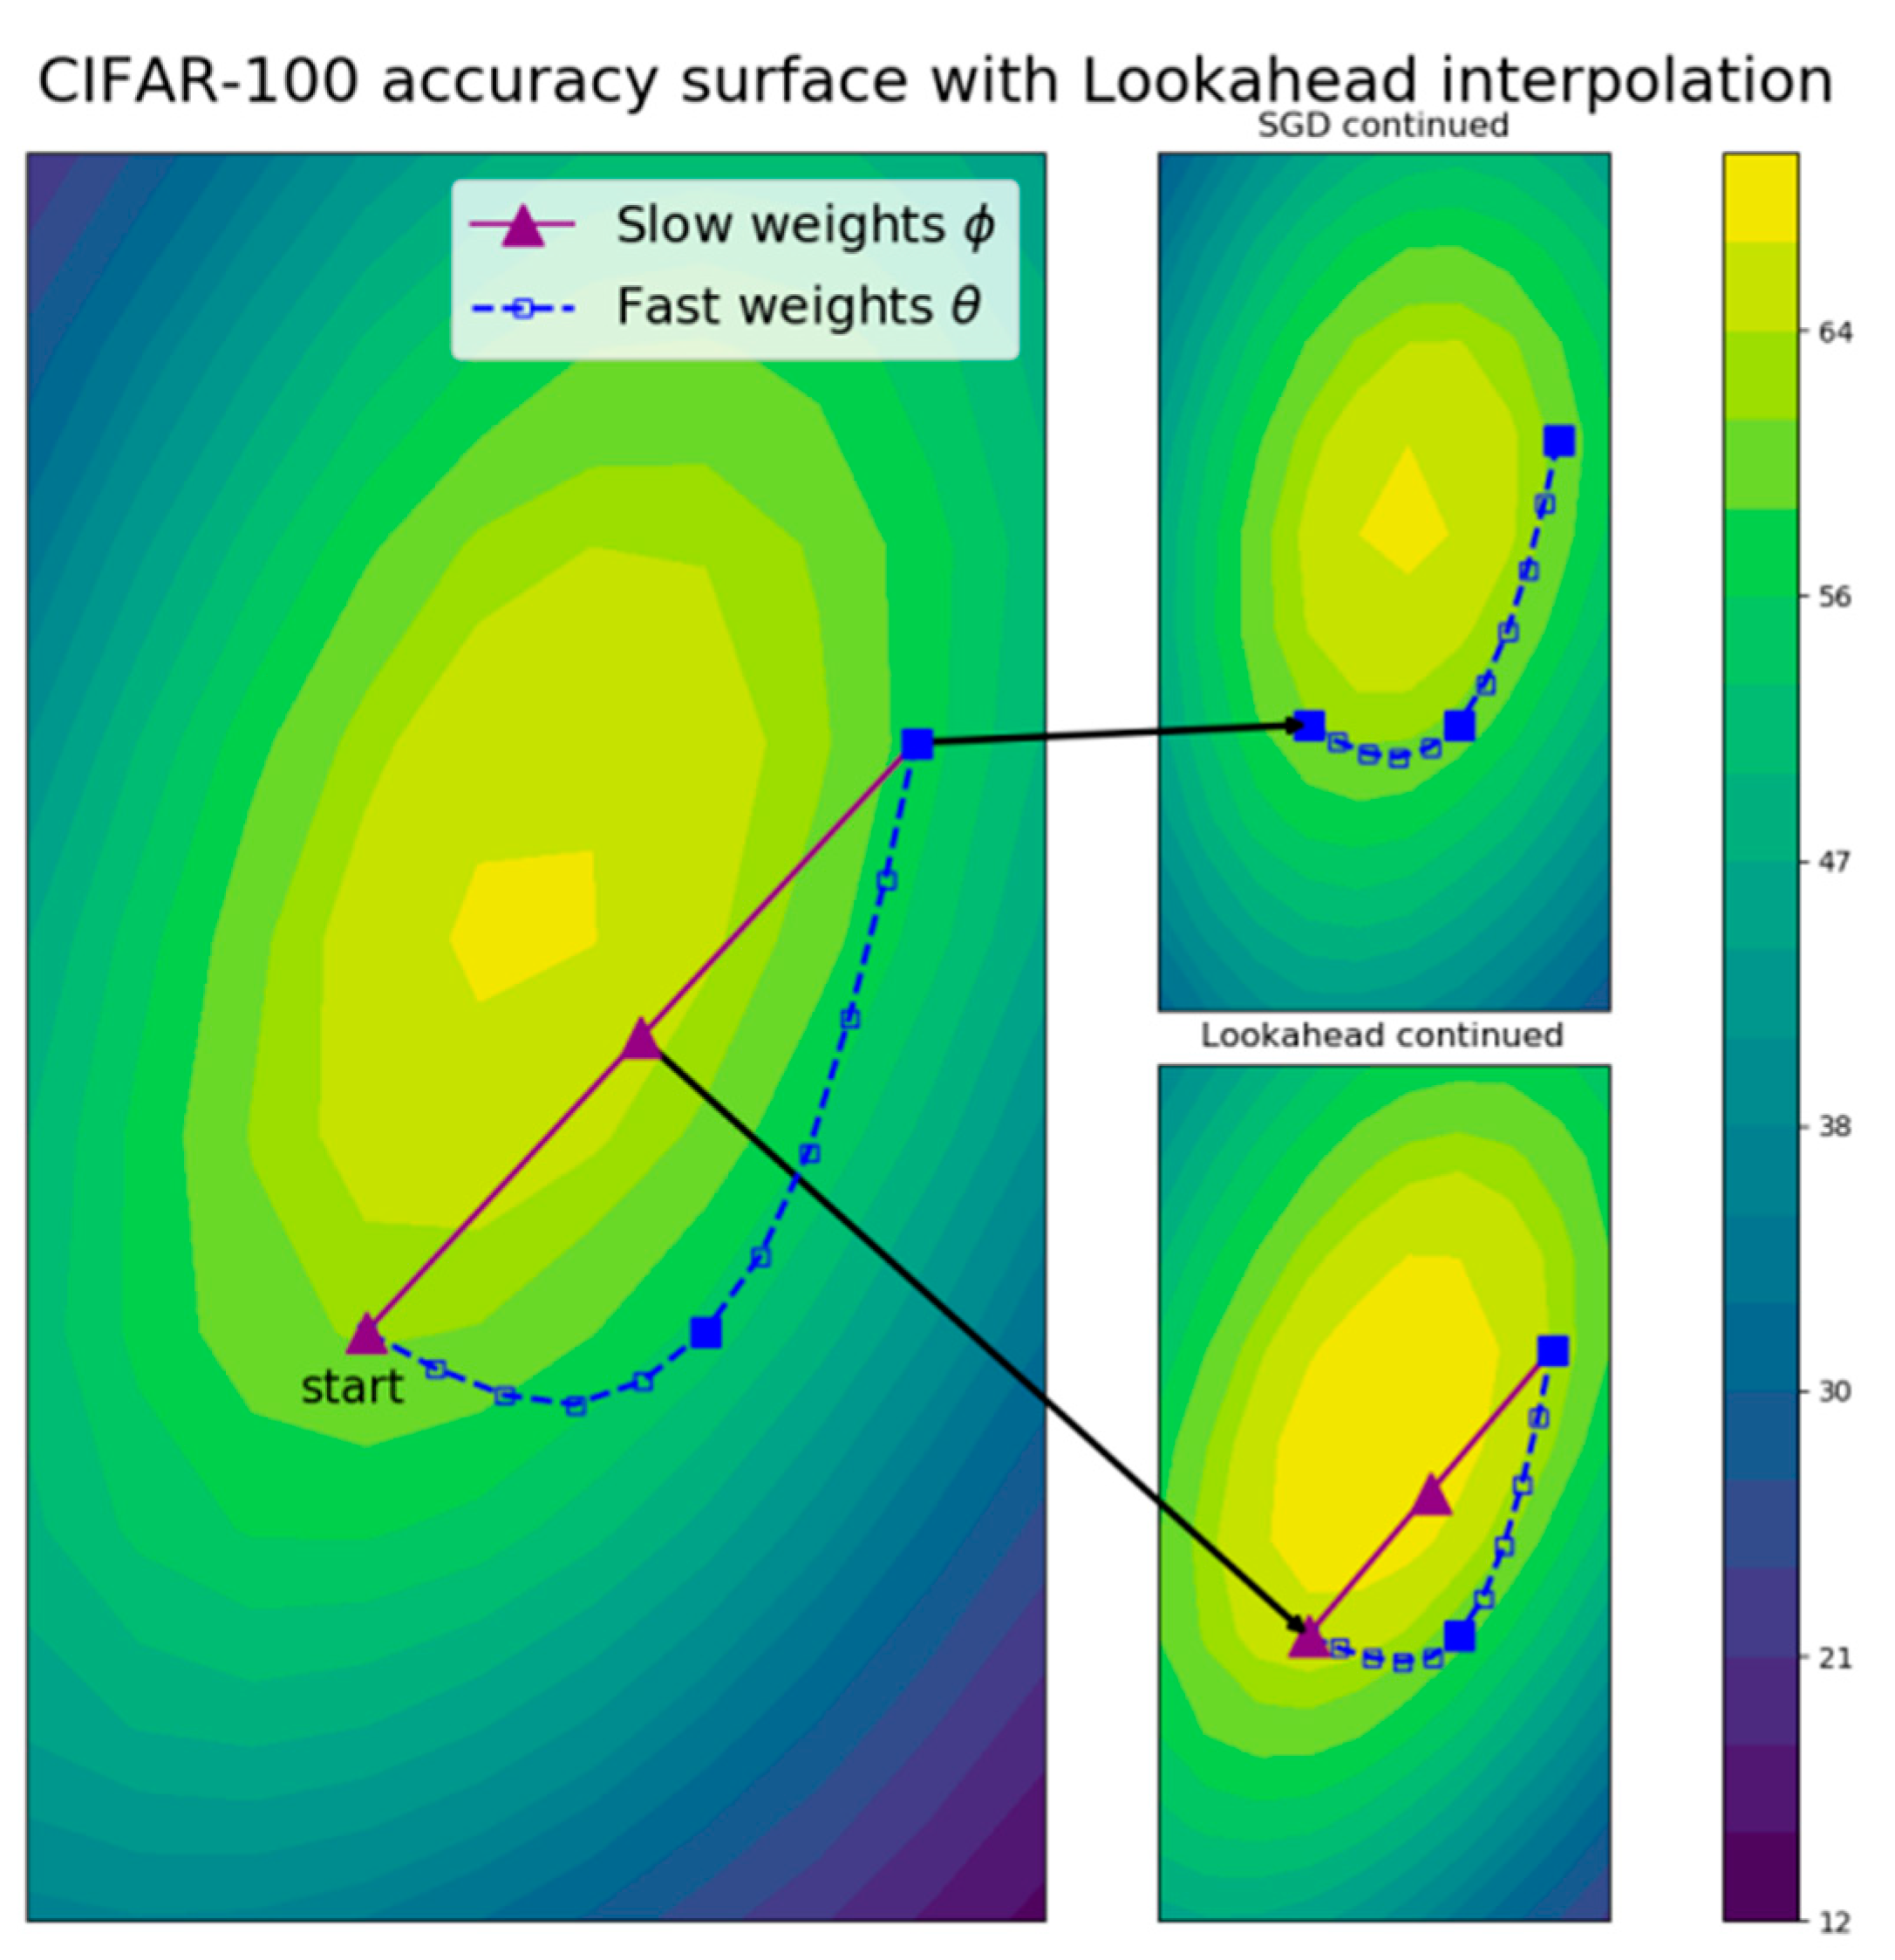
2.4. Lookahead
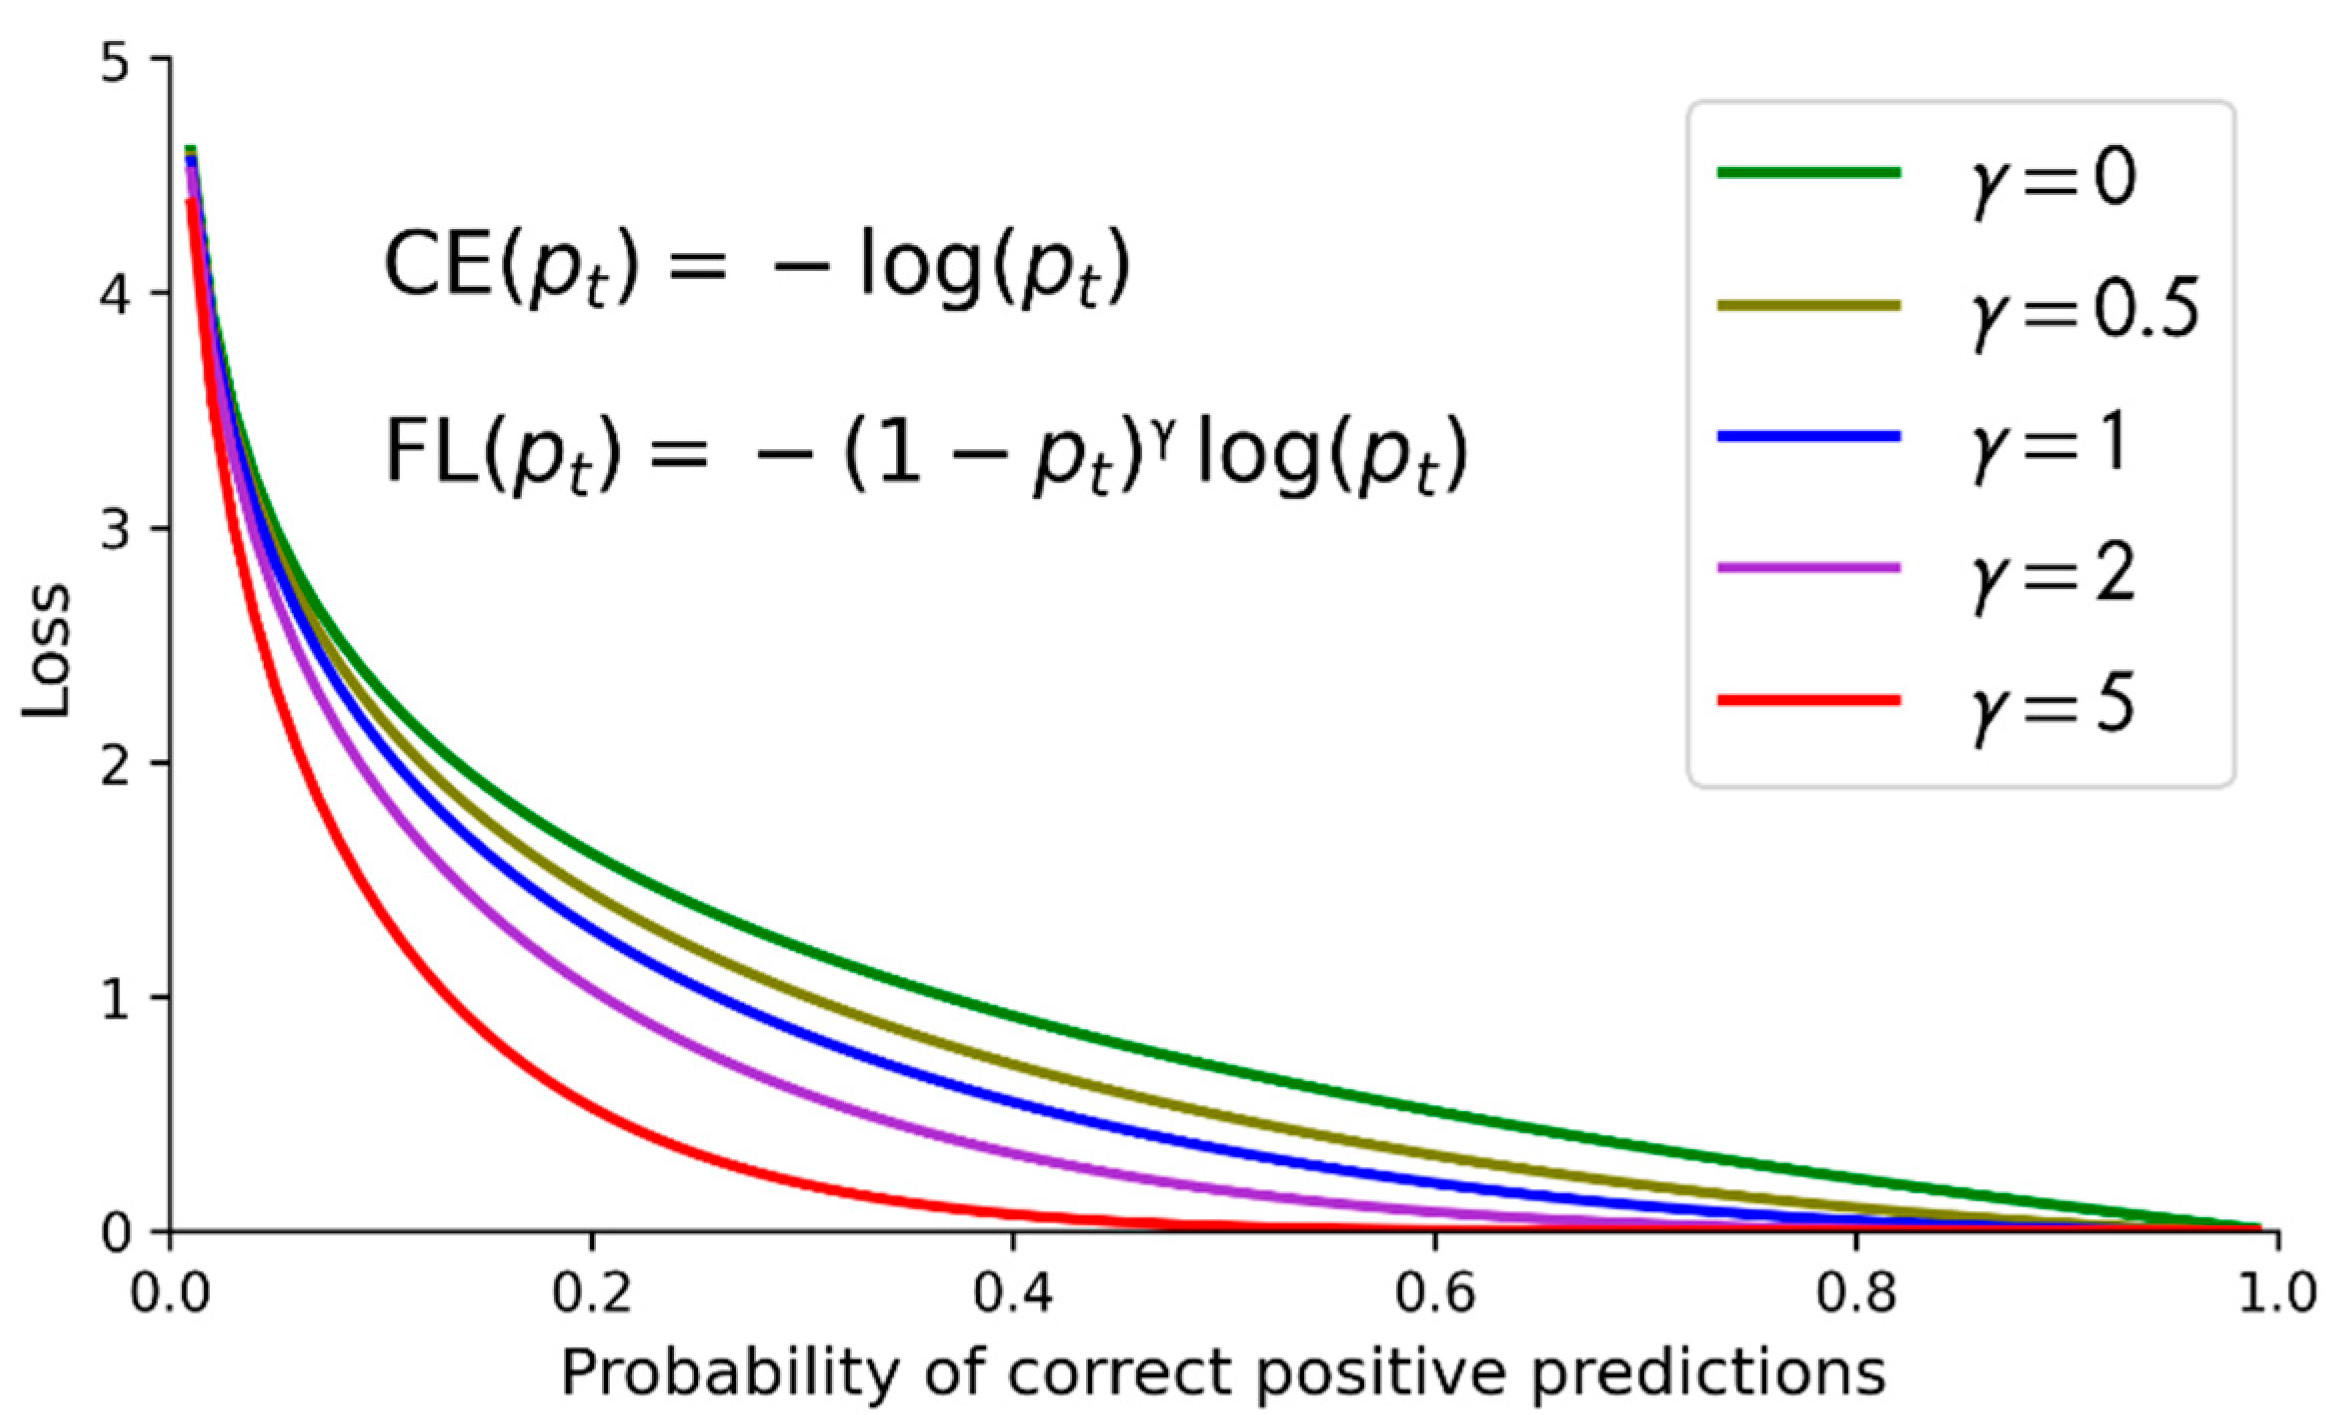
2.5. Focal Loss
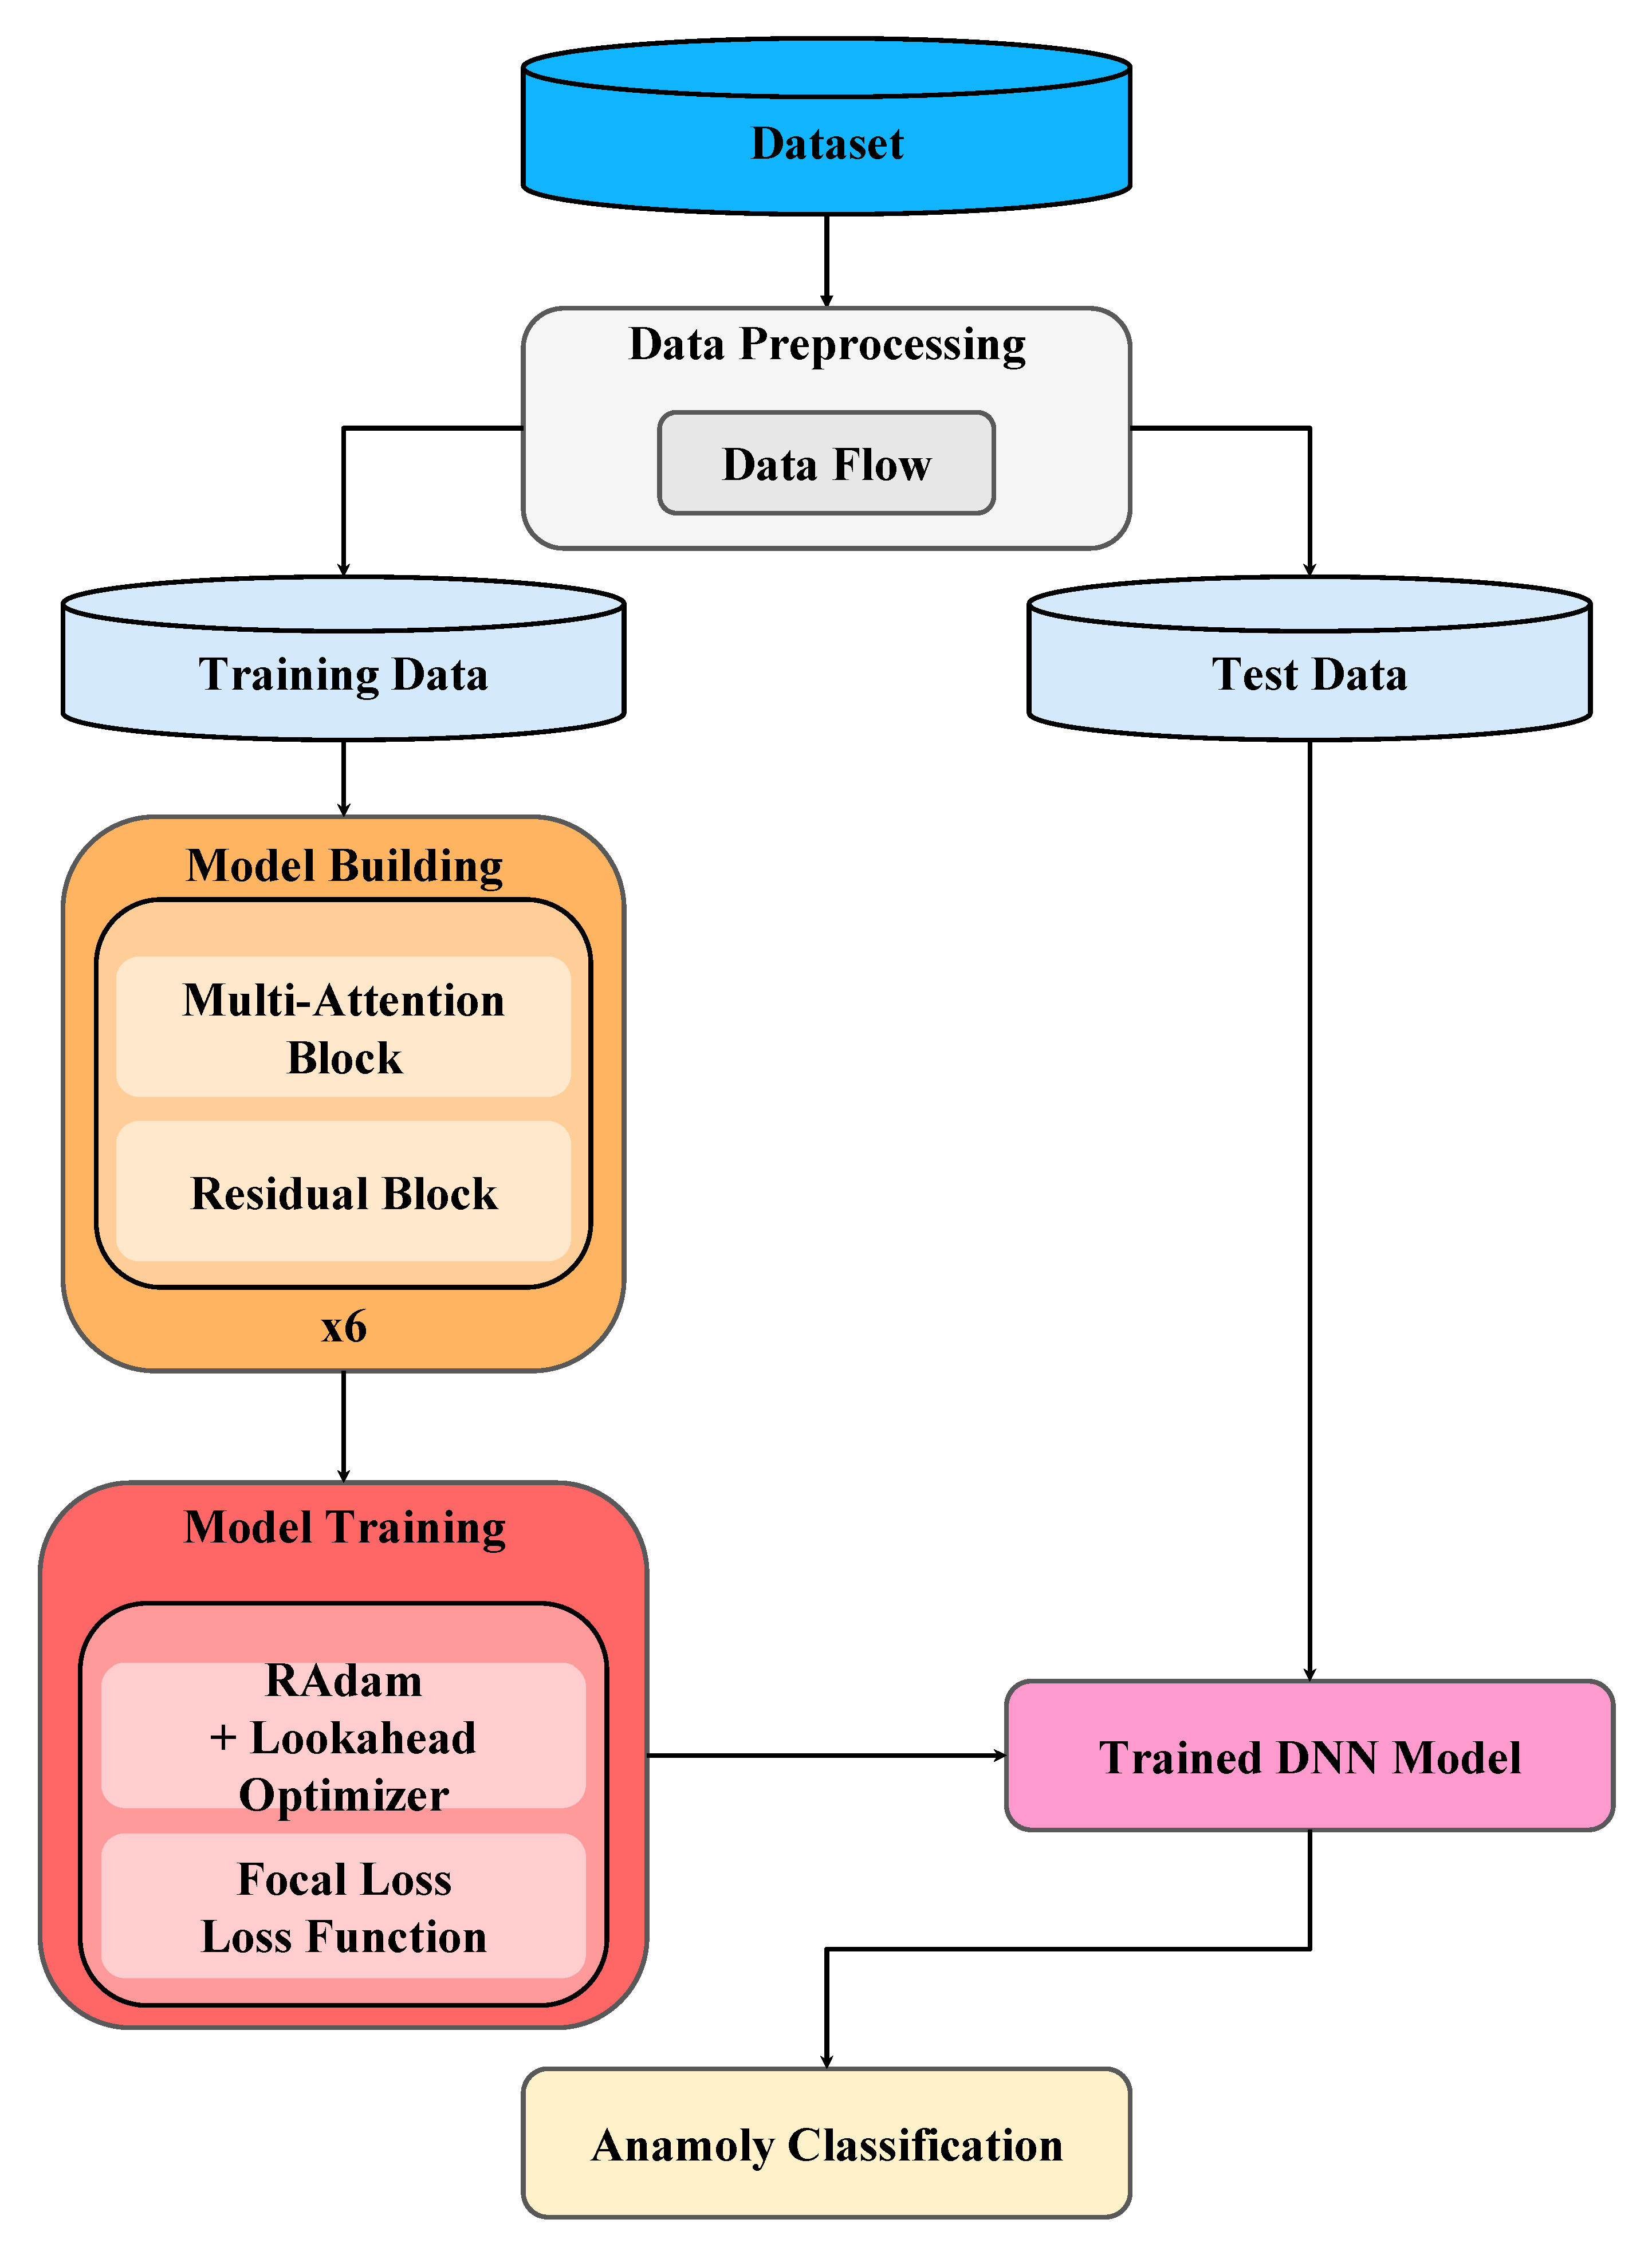
3. Proposed Method
3.1. Data Preprocessing
- Label encoding:
- 2.
- Normalization:
- 3.
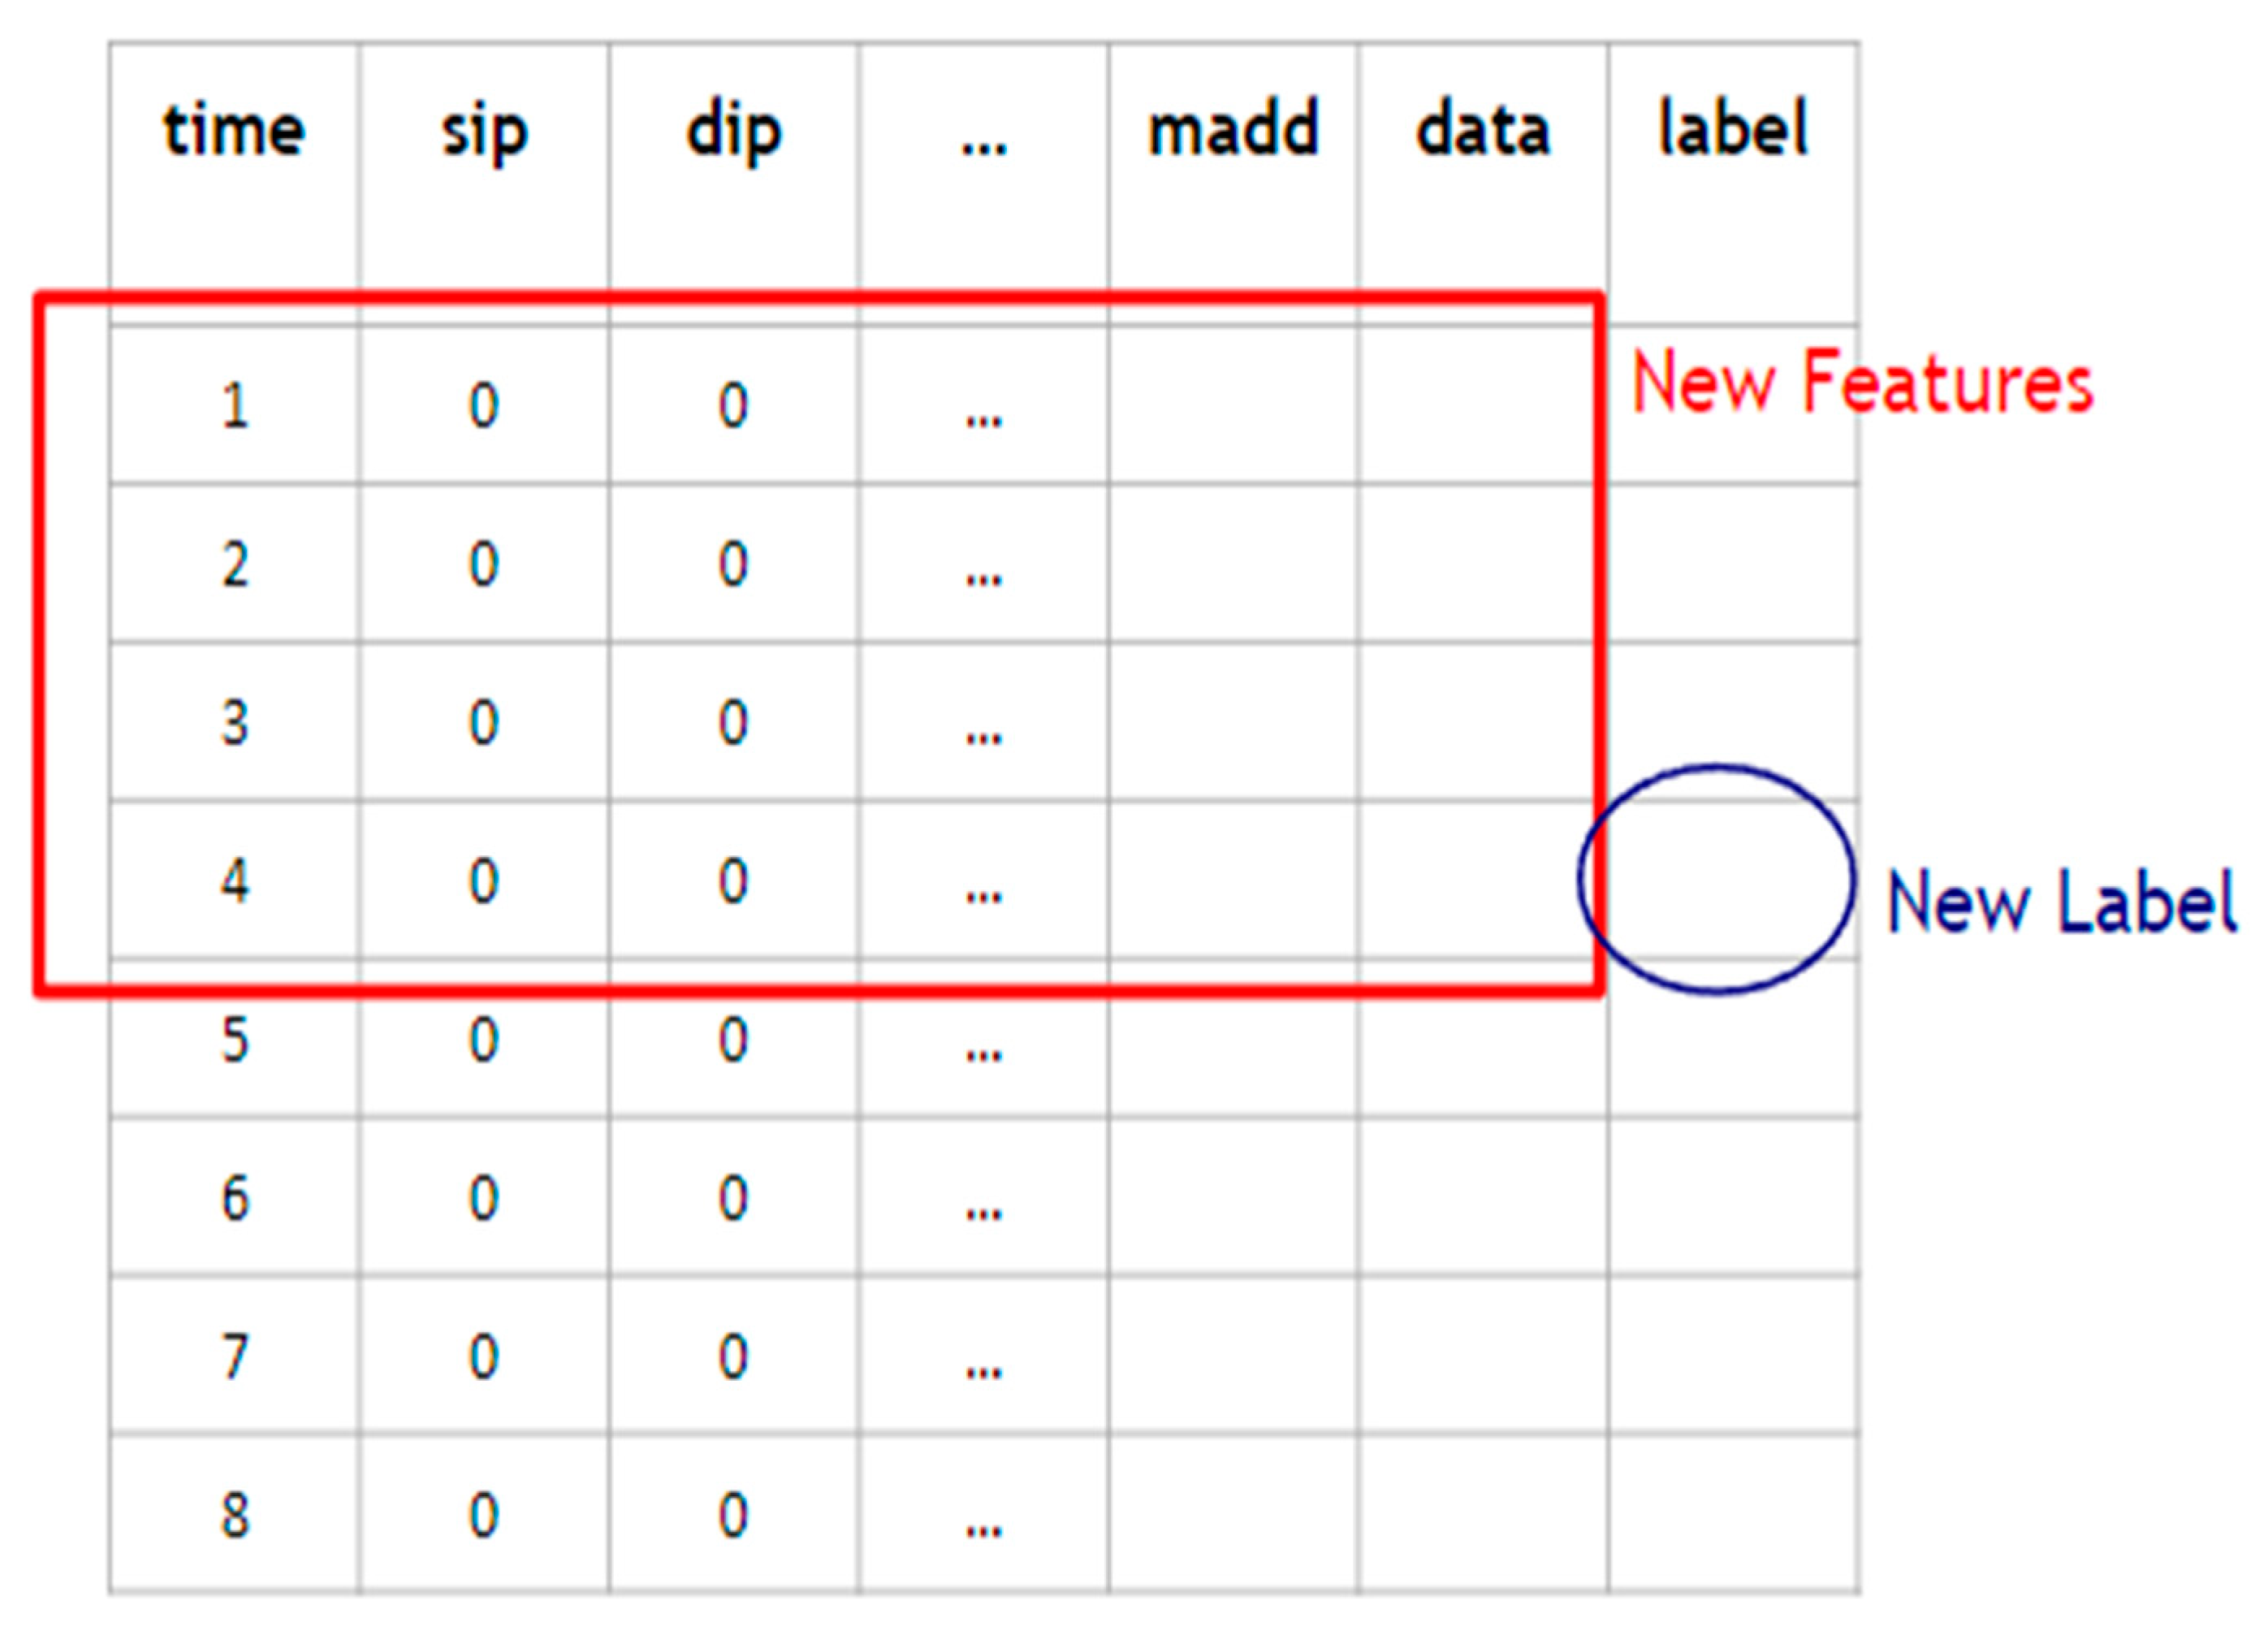
- Data flow processing:
- 4.
- Data splitting:
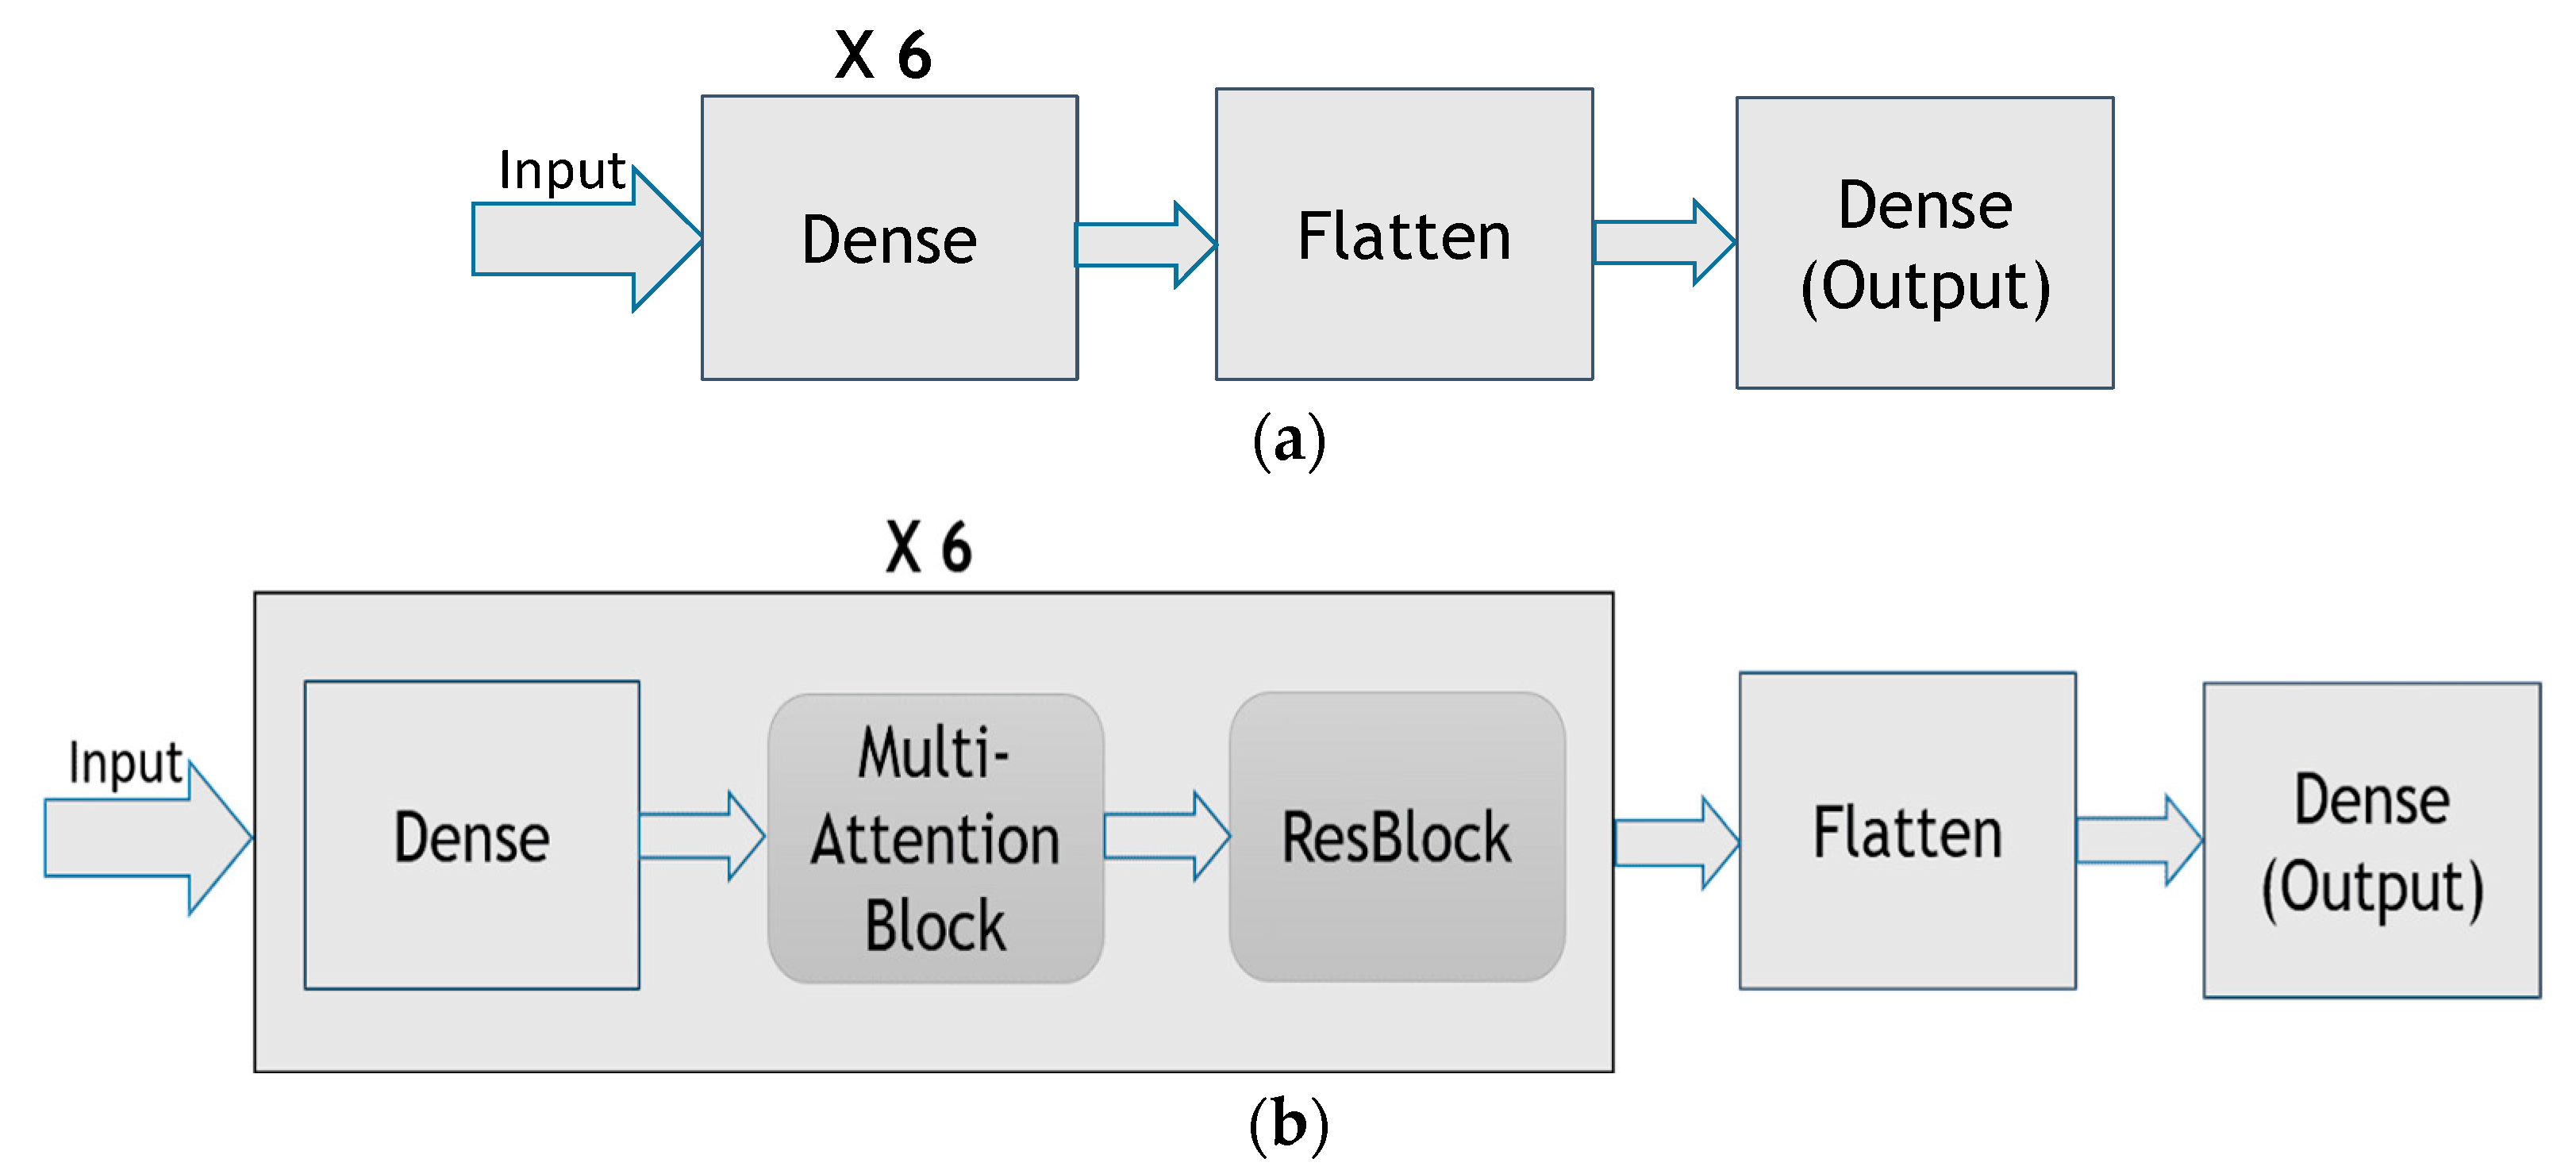
3.2. Model Building
3.3. Model Training
4. Performance Evaluation
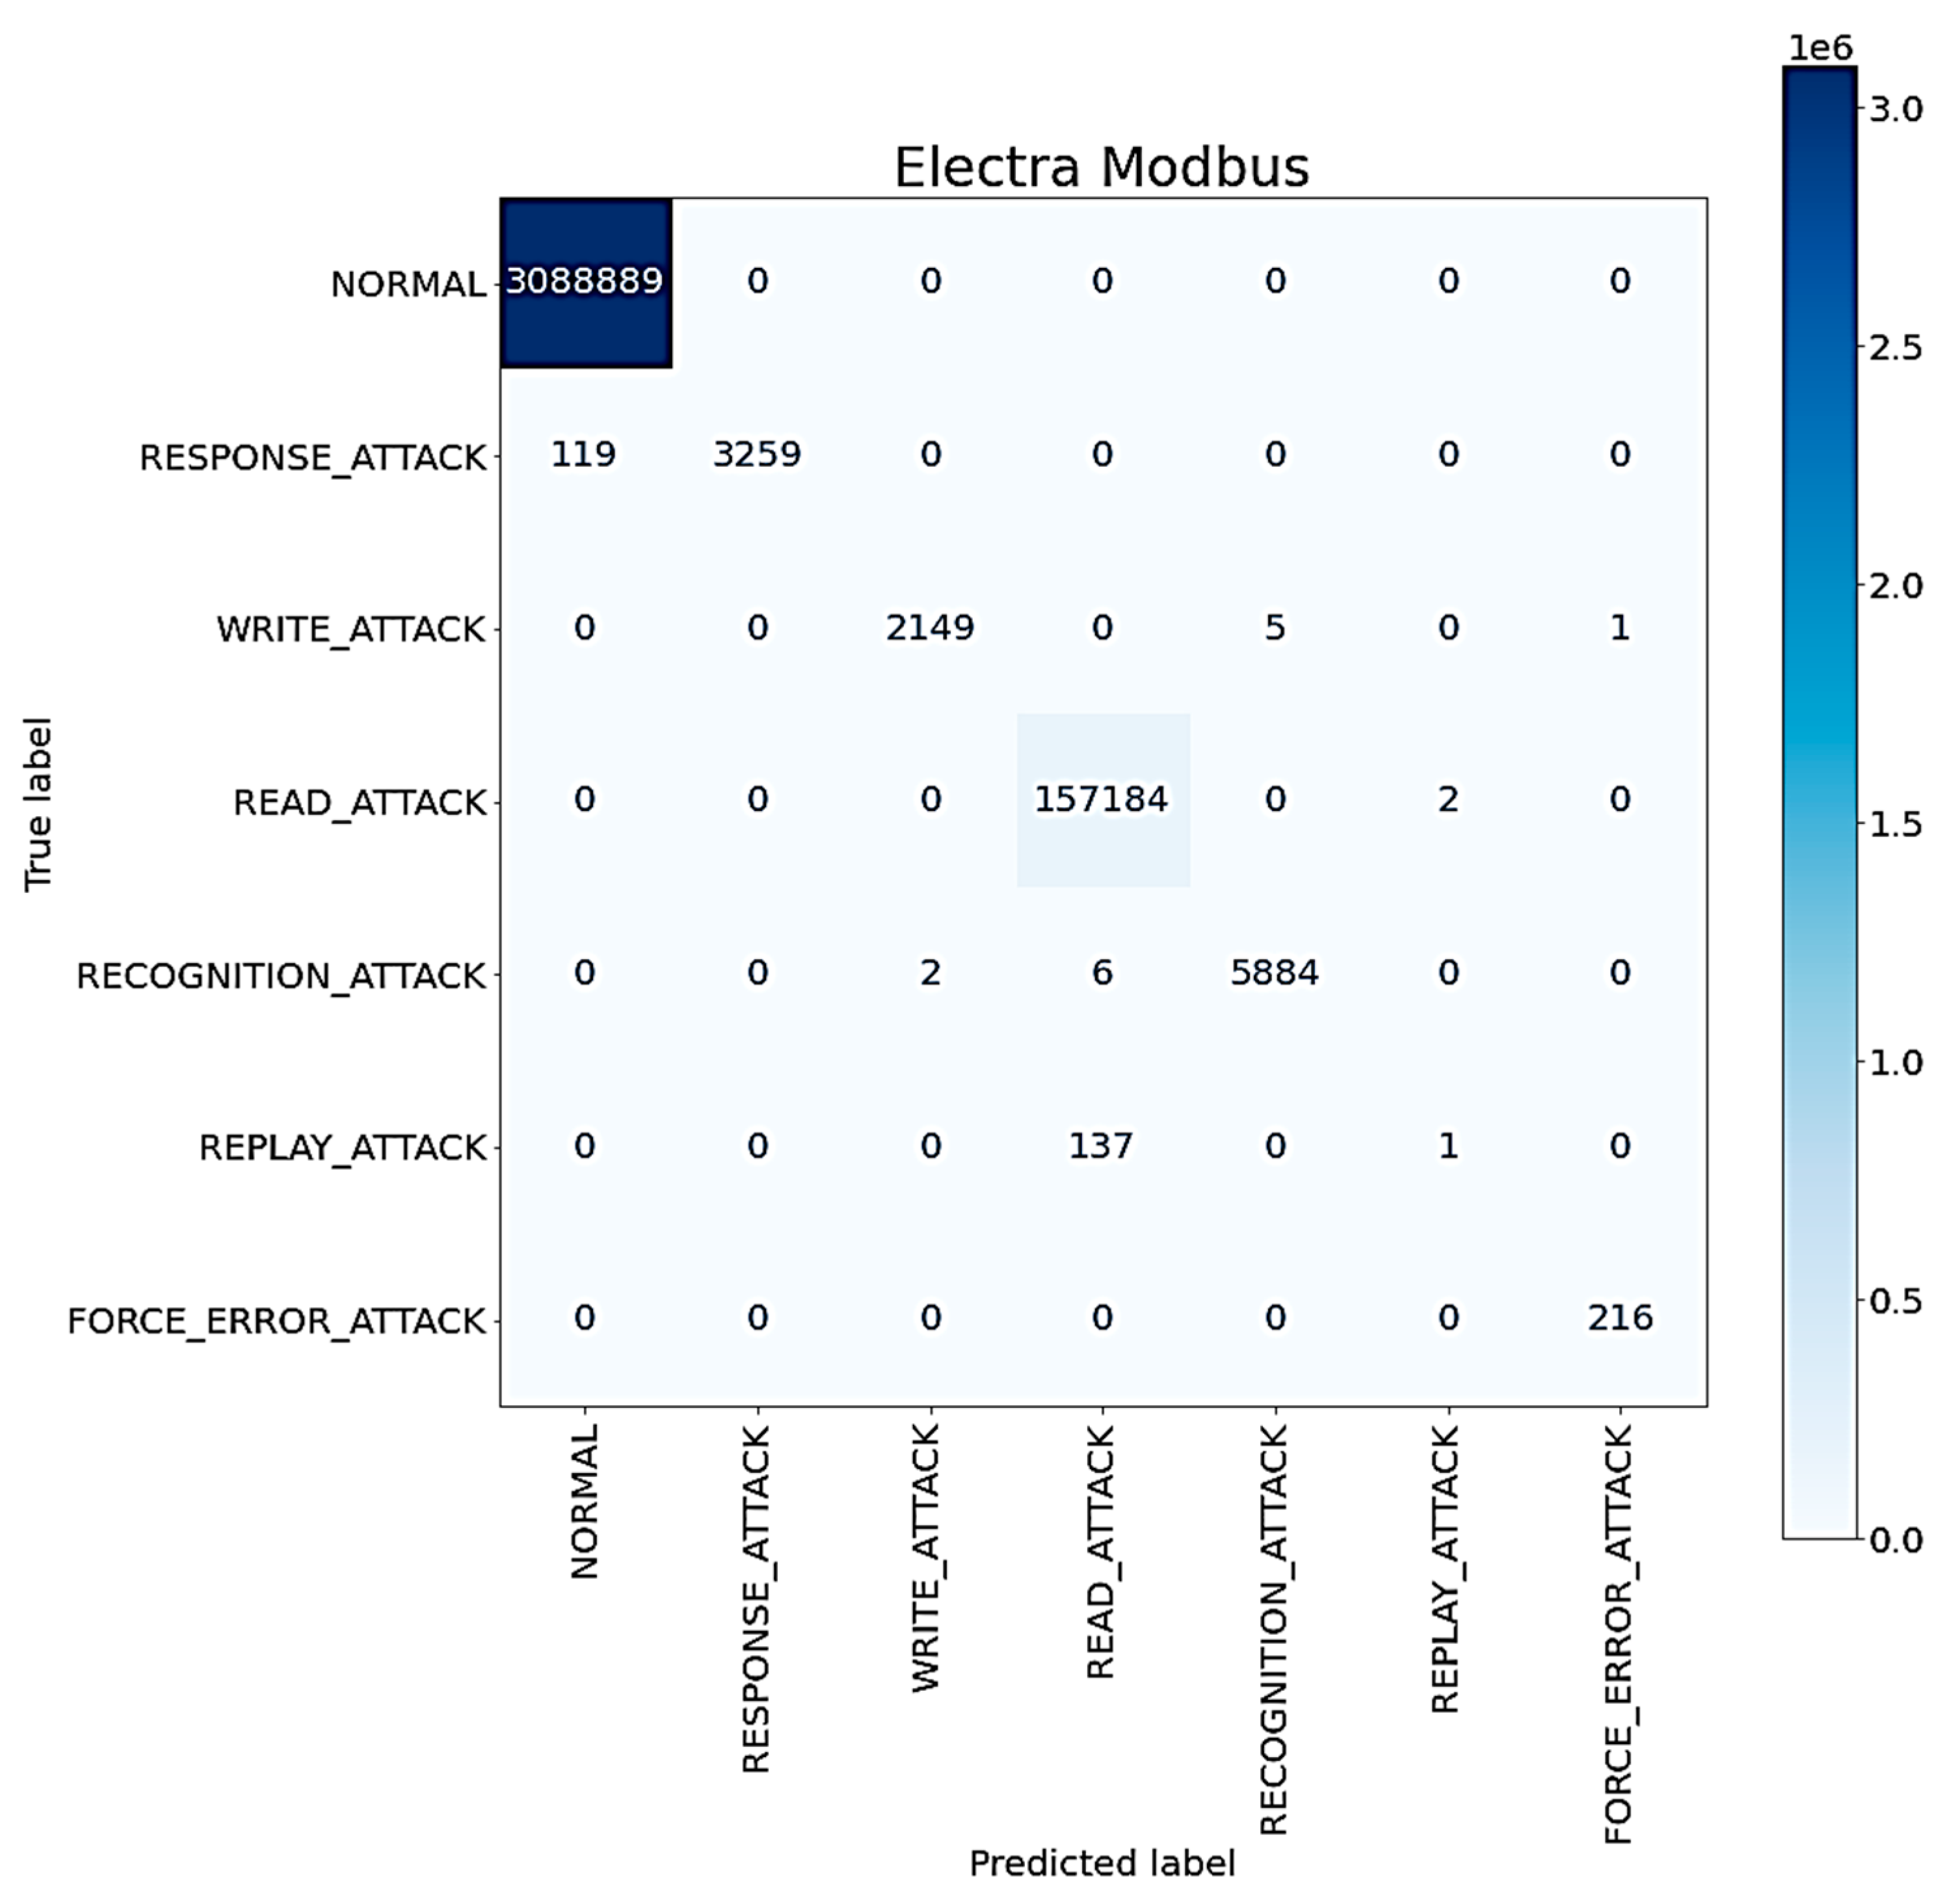
4.1. The Electra Modbus Dataset
4.2. Performance Metrics
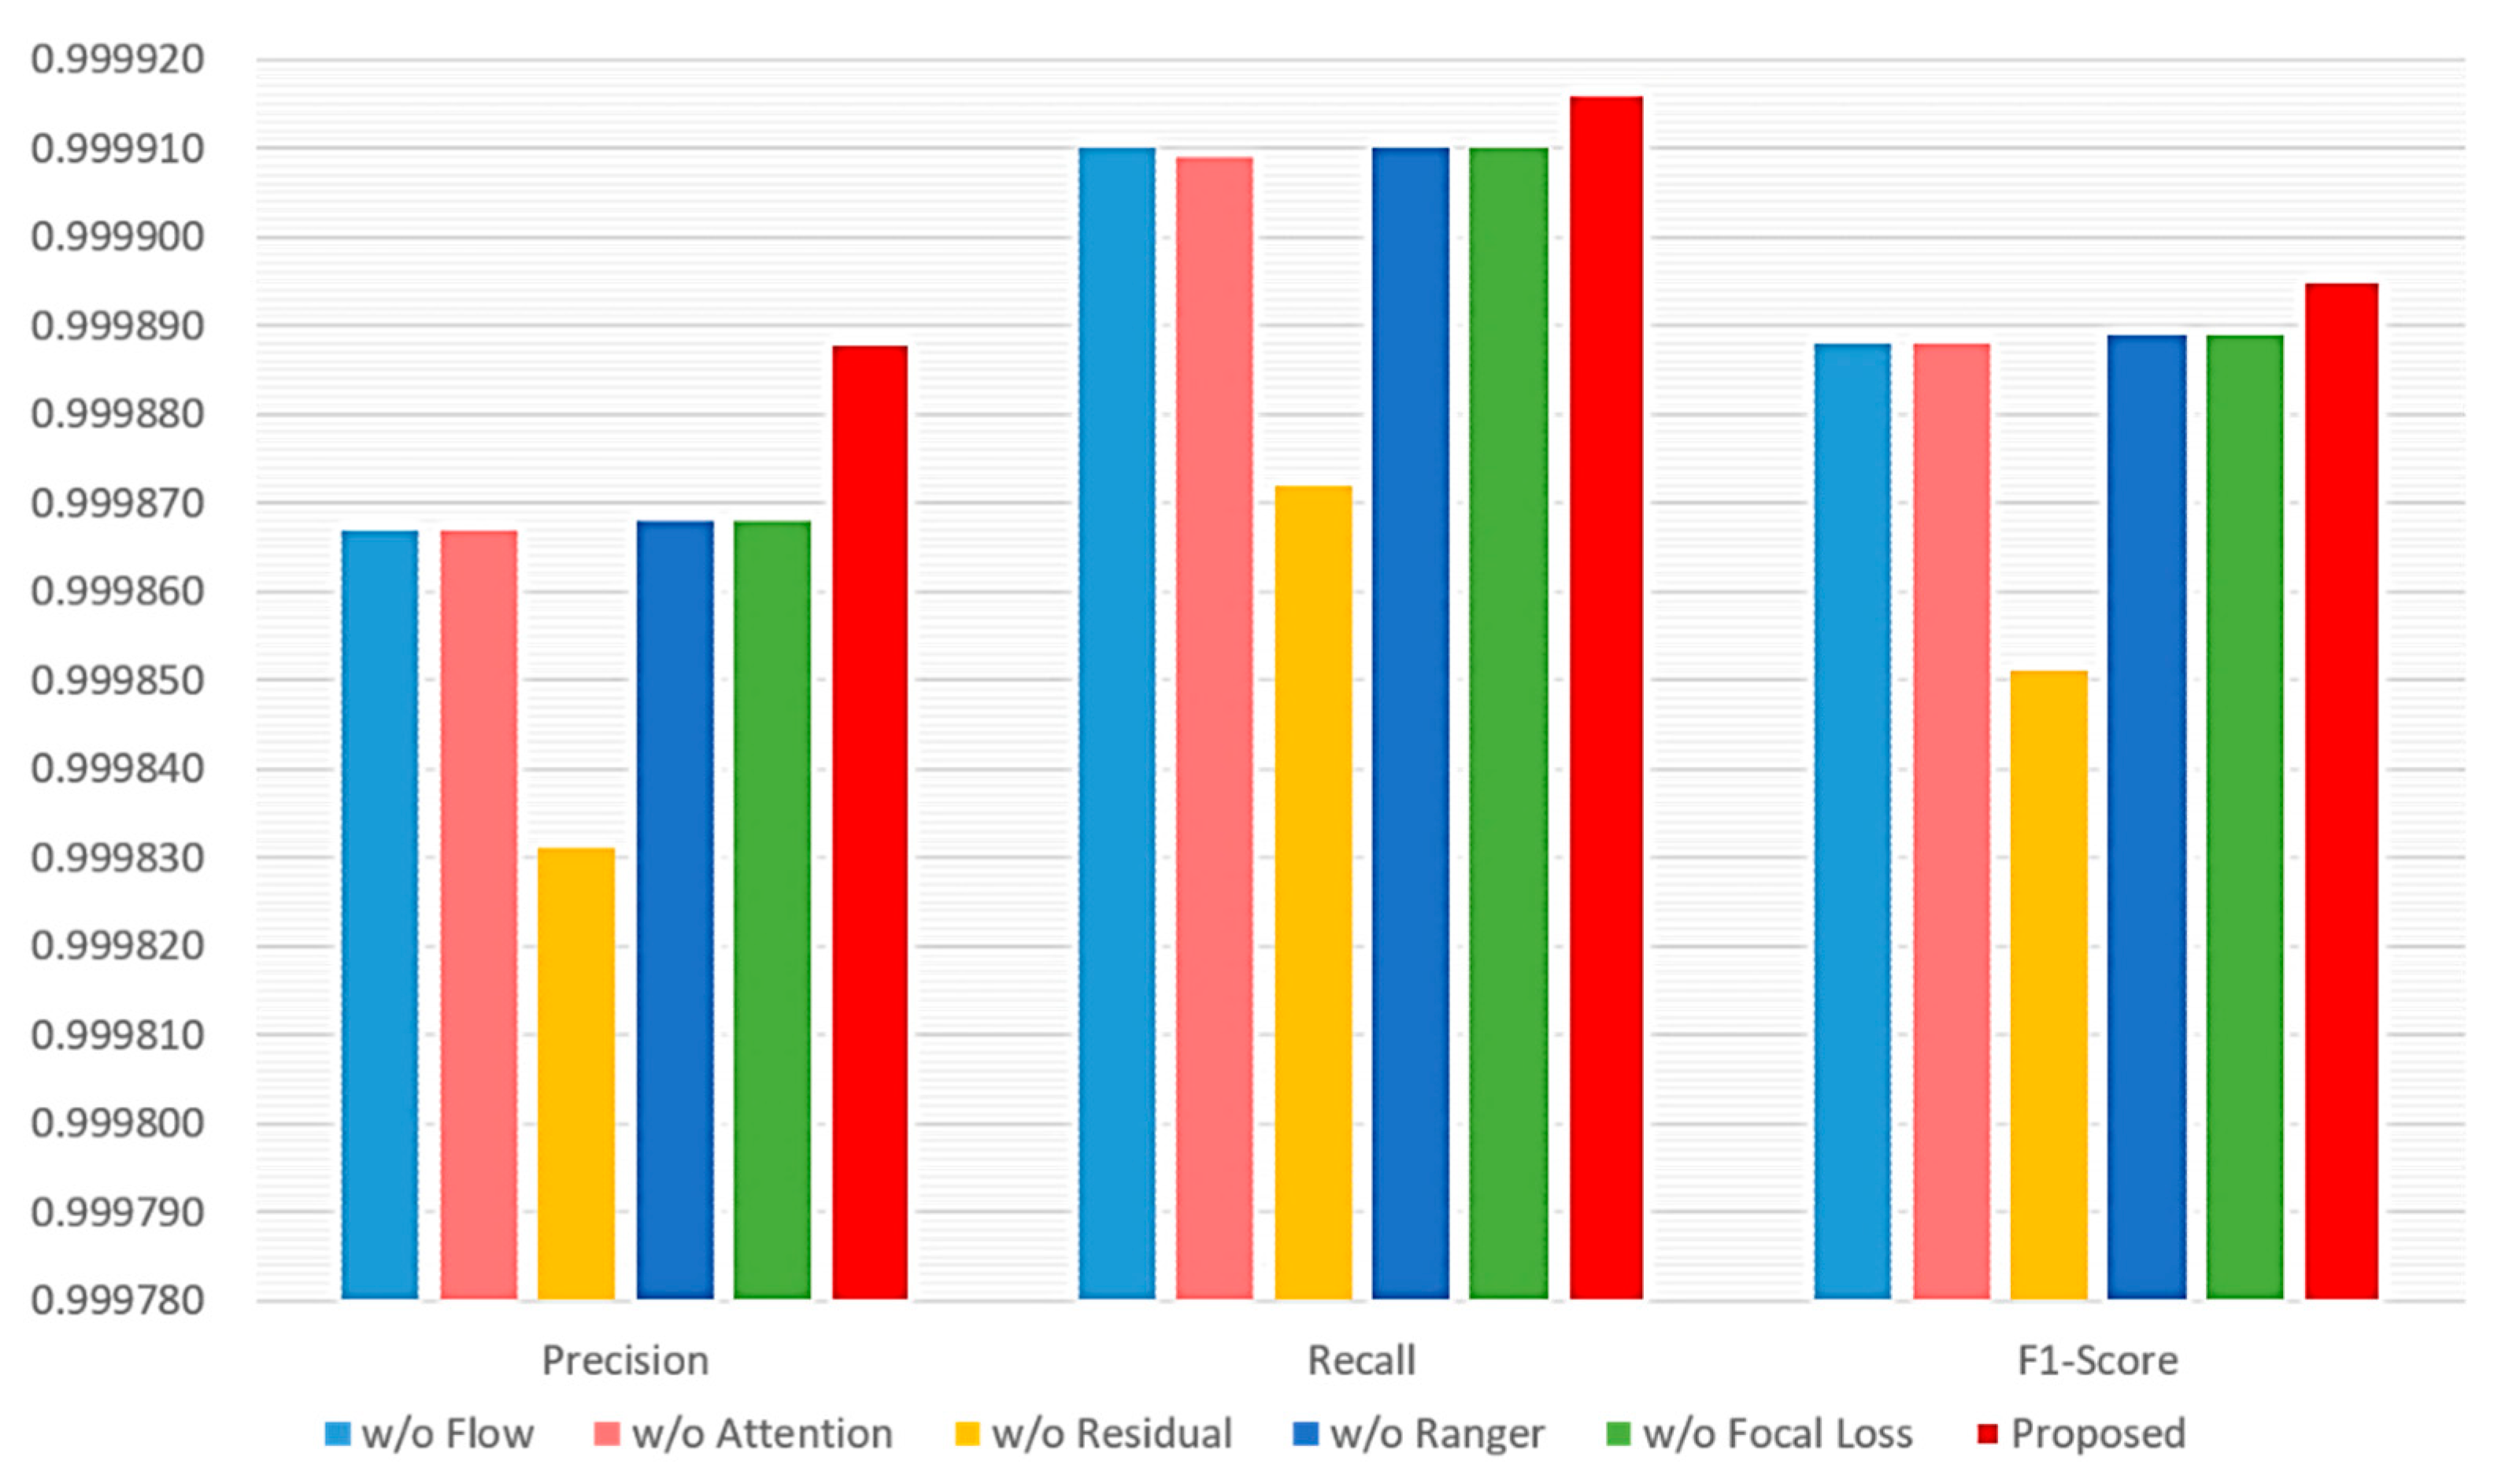
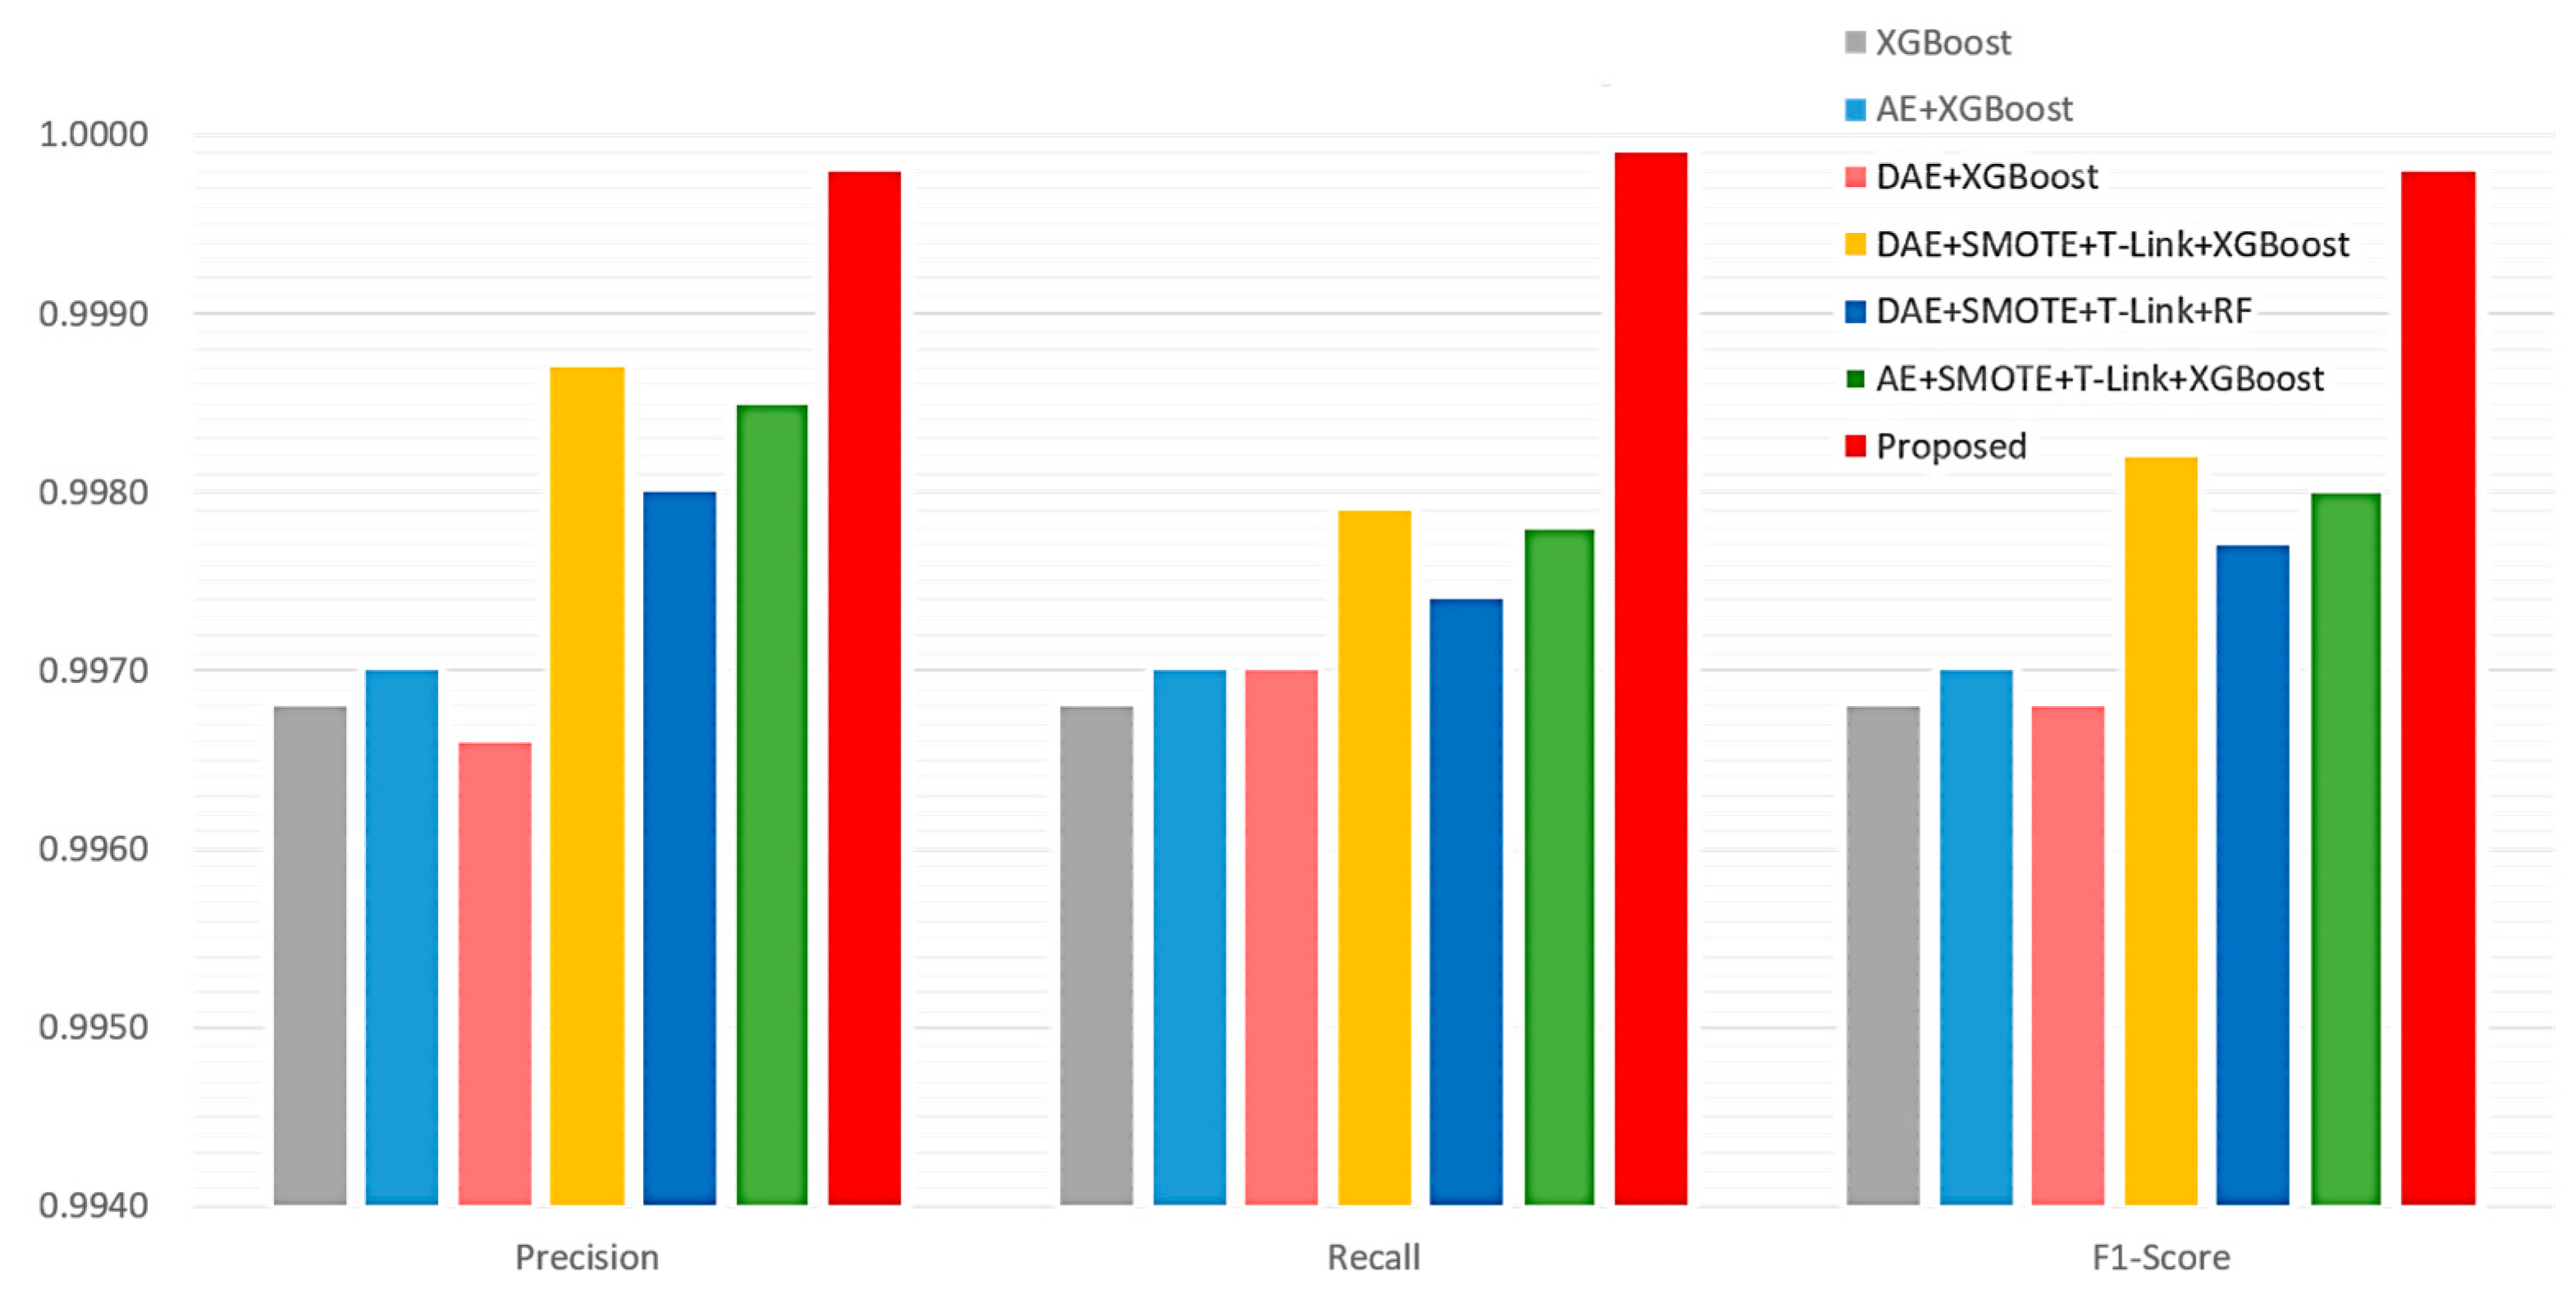
4.3. Performance Evaluation and Comparison
5. Conclusions
Author Contributions
Funding
Institutional Review Board Statement
Informed Consent Statement
Data Availability Statement
Acknowledgments
Conflicts of Interest
References
- Jiang, J.-R.; Chen, Y.-T. Industrial control system anomaly detection and classification based on network traffic. IEEE Access 2022, 10, 41874–41888. [Google Scholar] [CrossRef]
- Zhou, C.; Hu, B.; Shi, Y.; Tian, Y.-C.; Li, X.; Zhao, Y. A unified architectural approach for cyberattack-resilient industrial control systems. Proc. IEEE 2020, 109, 517–541. [Google Scholar] [CrossRef]
- Eaton, C.; Volz, D.U.S. Pipeline Cyberattack Forces Closure. Wall Street J. Available online: https://www.wsj.com/articles/cyberattack-forces-closure-of-largest-u-s-refined-fuel-pipeline-11620479737 (accessed on 15 November 2022).
- Gómez, Á.L.P.; Maimó, L.F.; Celdrán, A.H.; Clemente, F.J.G.; Sarmiento, C.C.; Masa, C.J.D.C.; Nistal, R.M. On the generation of anomaly detection datasets in industrial control systems. IEEE Access 2019, 7, 177460–177473. [Google Scholar] [CrossRef]
- Ning, B.; Qiu, S.; Zhao, T.; Li, Y. Power IoT attack samples generation and detection using generative adversarial networks. In Proceedings of the 2020 IEEE 4th Conference on Energy Internet and Energy System Integration (EI2), Wuhan, China, 30 October –1 November 2020; pp. 3721–3724. [Google Scholar]
- Goodfellow, I.; Pouget-Abadie, J.; Mirza, M.; Xu, B.; Warde-Farley, D.; Ozair, S.; Courville, A.; Bengio, Y. Generative adversarial networks. Commun. ACM 2020, 63, 139–144. [Google Scholar] [CrossRef]
- Vincent, P.; Larochelle, H.; Bengio, Y.; Manzagol, P.-A. Extracting and composing robust features with denoising autoencoders. In Proceedings of the 25th International Conference on Machine Learning, Helsinki, Finland, 5–9 July 2008; pp. 1096–1103. [Google Scholar]
- Chawla, N.V.; Bowyer, K.W.; Hall, L.O.; Kegelmeyer, W.P. SMOTE: Synthetic minority over-sampling technique. J. Artif. Intell. Res. 2002, 16, 321–357. [Google Scholar] [CrossRef]
- Tomek, I. Two modifications of CNN. IEEE Trans. Syst. Man Cybern. 1976, 6, 769–772. [Google Scholar]
- Chen, T.; Guestrin, C. XGBoost: A scalable tree boosting system. In Proceedings of the 22nd Acm Sigkdd International Conference on Knowledge Discovery and Data Mining, San Francisco, CA, USA, 13–17 August 2016; pp. 785–794. [Google Scholar]
- Vaswani, A.; Shazeer, N.; Parmar, N.; Uszkoreit, J.; Jones, L.; Gomez, A.N.; Kaiser, L.; Polosukhin, I. Attention is all you need. Adv. Neural Inf. Process. Syst. 2017, 30, 5998–6008. [Google Scholar]
- He, K.; Zhang, X.; Ren, S.; Sun, J. Deep residual learning for image recognition. In Proceedings of the IEEE Conference on Computer Vision and Pattern Recognition, Las Vegas, NV, USA, 27–30 June 2016; pp. 770–778. [Google Scholar]
- Wright, L. New Deep Learning Optimizer, Ranger: Synergistic Combination of RAdam + LookAhead for the Best of Both. Available online: https://lessw.medium.com/new-deep-learning-optimizer-ranger-synergistic-combination-of-radam-lookahead-for-the-best-of-2dc83f79a48d (accessed on 15 November 2022).
- Liu, L.; Jiang, H.; He, P.; Chen, W.; Liu, X.; Gao, J.; Han, J. On the variance of the adaptive learning rate and beyond. arXiv 2017, arXiv:1908.03265. [Google Scholar]
- Zhang, M.; Lucas, J.; Ba, J.; Hinton, G.E. Lookahead optimizer: K steps forward, 1 step back. In Proceedings of the 33rd Conference on Neural Information Processing Systems (NeurIPS 2019), Vancouver, BC, Canada, 8–14 December 2019. [Google Scholar]
- Lin, T.Y.; Goyal, P.; Girshick, R.; He, K.; Dollár, P. Focal loss for dense object detection. In Proceedings of the IEEE International Conference on Computer Vision, Venice, Italy, 22–29 October 2017; pp. 2980–2988. [Google Scholar]
- Dataset for Cybersecurity Research in Industrial Control Systems. Available online: http://perception.inf.um.es/ICS-datasets/ (accessed on 15 November 2022).
- Kingma, D.P.; Ba, J. Adam: A method for stochastic optimization. arXiv 2014, arXiv:1412.6980. [Google Scholar]
- Krizhevsky, A. Learning Multiple Layers of Features from Tiny Images; Technical Report; University of Toronto: Toronto, ON, Canada, 2009. [Google Scholar]
- Ramachandran, P.; Zoph, B.; Le, Q.V. Searching for activation functions. arXiv 2017, arXiv:1710.05941. [Google Scholar]
- He, K.; Zhang, X.; Ren, S.; Sun, J. Delving deep into rectifiers: Surpassing human-level performance on imagenet classification. In Proceedings of the IEEE International Conference on Computer Vision, Santiago, Chile, 7–13 December 2015; pp. 1026–1034. [Google Scholar]


| Feature | Description | Data Type |
|---|---|---|
| time | Timestamp | String |
| smac | Source MAC address | String |
| dmac | Destination MAC address | String |
| sip | Source IP address | String |
| dip | Destination IP address | String |
| request | Indicates whether the packet is a request (packet from master to slave) | Boolean |
| fc | Function code | Integer |
| error | Indicates whether there has been an error in reading/writing operation | Boolean |
| madd | Memory address to perform read/write operation | Integer |
| data | In the case of a read operation, it indicates the data that the slave sends to the master. In the case of a write operation, it indicates the data that the master sends back to the slave | Integer |
| label | Label for attacks and normal samples | String |
| Classes | Percentage of Samples |
|---|---|
| Normal | 94.8% |
| Function code recognition attack | 0.19% |
| Response modification attack | 0.1% |
| Force error in response attack | 0.007% |
| Read attack | 4.83% |
| Write attack | 0.06% |
| Replay attack | 0.006% |
| Method | Precision | Recall | F1-Score |
|---|---|---|---|
| JC-AC [1] | 0.9985 | 0.9978 | 0.9980 |
| Proposed Method | 0.9998 | 0.9999 | 0.9998 |
| Method | Precision | Recall | F1-Score |
|---|---|---|---|
| JC-AD [1] | 1.0000 | 1.0000 | 1.0000 |
| SVM [4] | 0.9756 | 1.0000 | 0.9876 |
| OCSVM [4] | 0.9862 | 0.9856 | 0.9859 |
| RF [4] | 0.9877 | 0.9871 | 0.9874 |
| IF [4] | 0.8739 | 1.0000 | 0.9327 |
| DNN [4] | 0.9692 | 1.0000 | 0.9843 |
| GAN + DNN [5] | - | 0.98 | - |
| Proposed Method | 0.9999 | 0.9999 | 0.9999 |
Publisher’s Note: MDPI stays neutral with regard to jurisdictional claims in published maps and institutional affiliations. |
© 2022 by the authors. Licensee MDPI, Basel, Switzerland. This article is an open access article distributed under the terms and conditions of the Creative Commons Attribution (CC BY) license (https://creativecommons.org/licenses/by/4.0/).
Share and Cite
Jiang, J.-R.; Lin, Y.-T. Deep Learning Anomaly Classification Using Multi-Attention Residual Blocks for Industrial Control Systems. Sensors 2022, 22, 9084. https://doi.org/10.3390/s22239084
Jiang J-R, Lin Y-T. Deep Learning Anomaly Classification Using Multi-Attention Residual Blocks for Industrial Control Systems. Sensors. 2022; 22(23):9084. https://doi.org/10.3390/s22239084
Chicago/Turabian StyleJiang, Jehn-Ruey, and Yan-Ting Lin. 2022. "Deep Learning Anomaly Classification Using Multi-Attention Residual Blocks for Industrial Control Systems" Sensors 22, no. 23: 9084. https://doi.org/10.3390/s22239084
APA StyleJiang, J.-R., & Lin, Y.-T. (2022). Deep Learning Anomaly Classification Using Multi-Attention Residual Blocks for Industrial Control Systems. Sensors, 22(23), 9084. https://doi.org/10.3390/s22239084