


Comparison of Structural Integrated Piezoceramics, Piezoelectric Patches and Strain Gauges for Condition Monitoring

 , ,
, ,
Abstract
1. Introduction
- Increase in process safety
- Early detection of system deviations
- Easier identification of error causes
- Faster reactions in case of possible machine downtime
- Reduction in energy costs, maintenance and repair costs
- Prognosis of remaining machine service life and wear of parts
- Improved occupational safety for employees
- Optimization of the quality of the process sequences and products
2. Materials and Methods
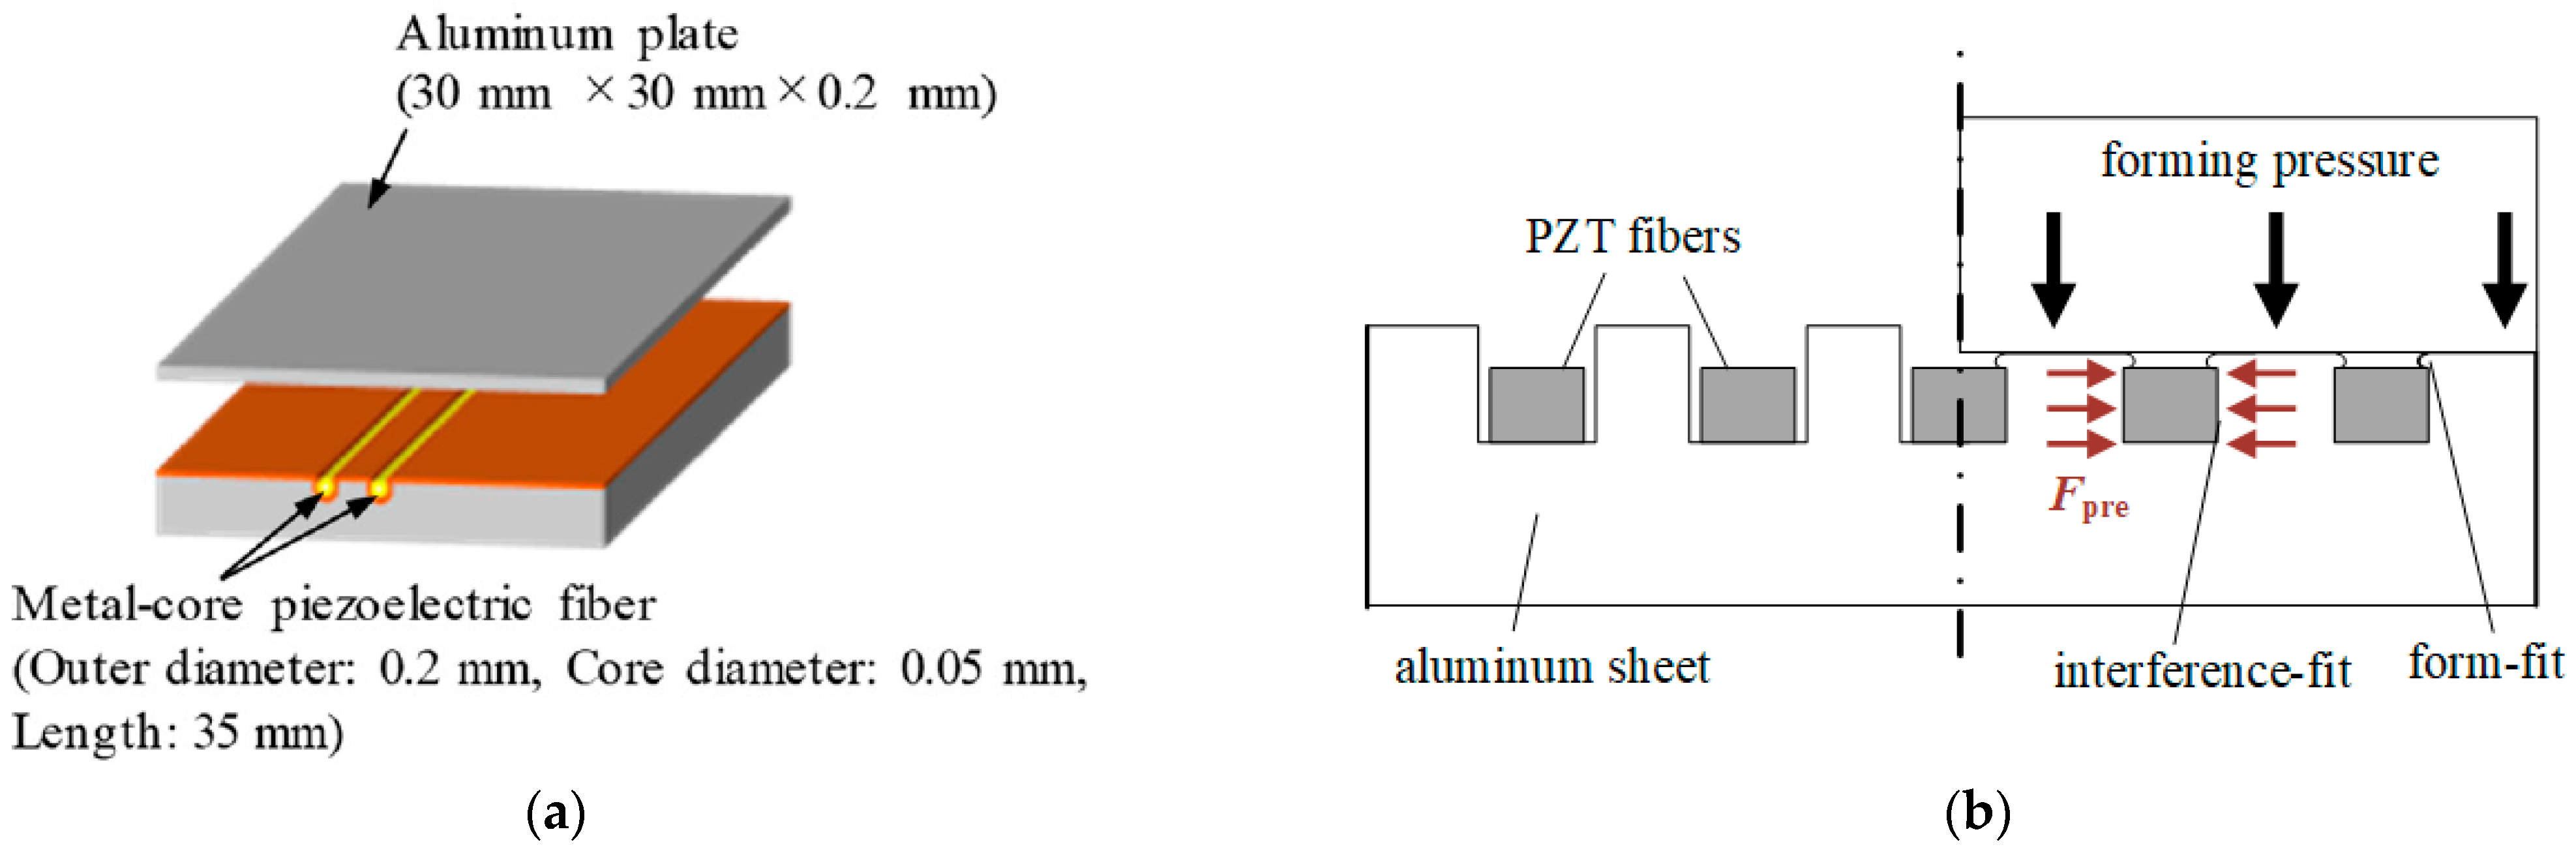
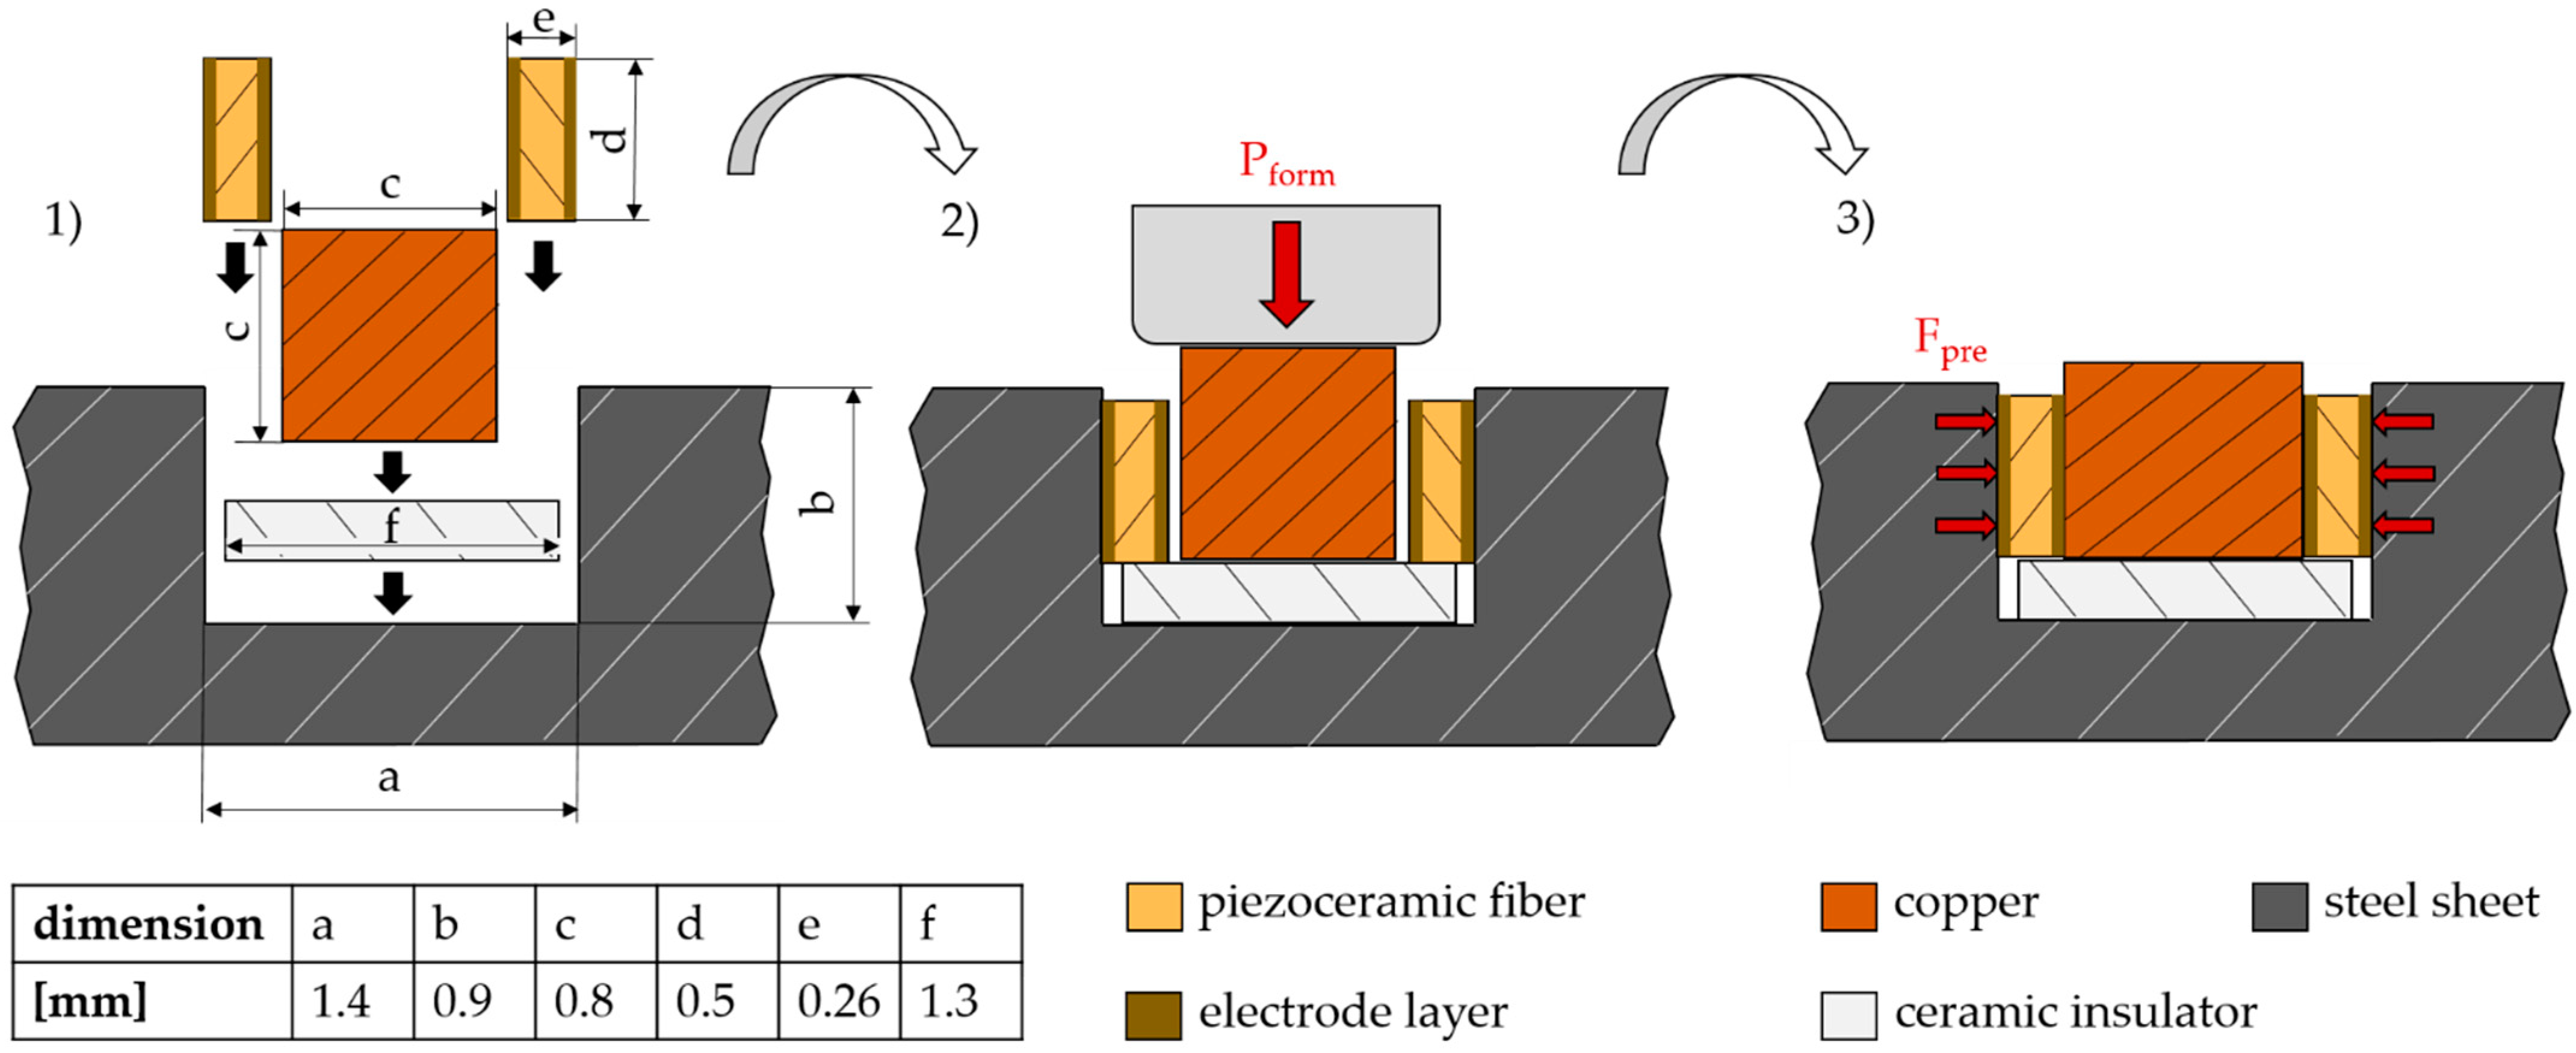
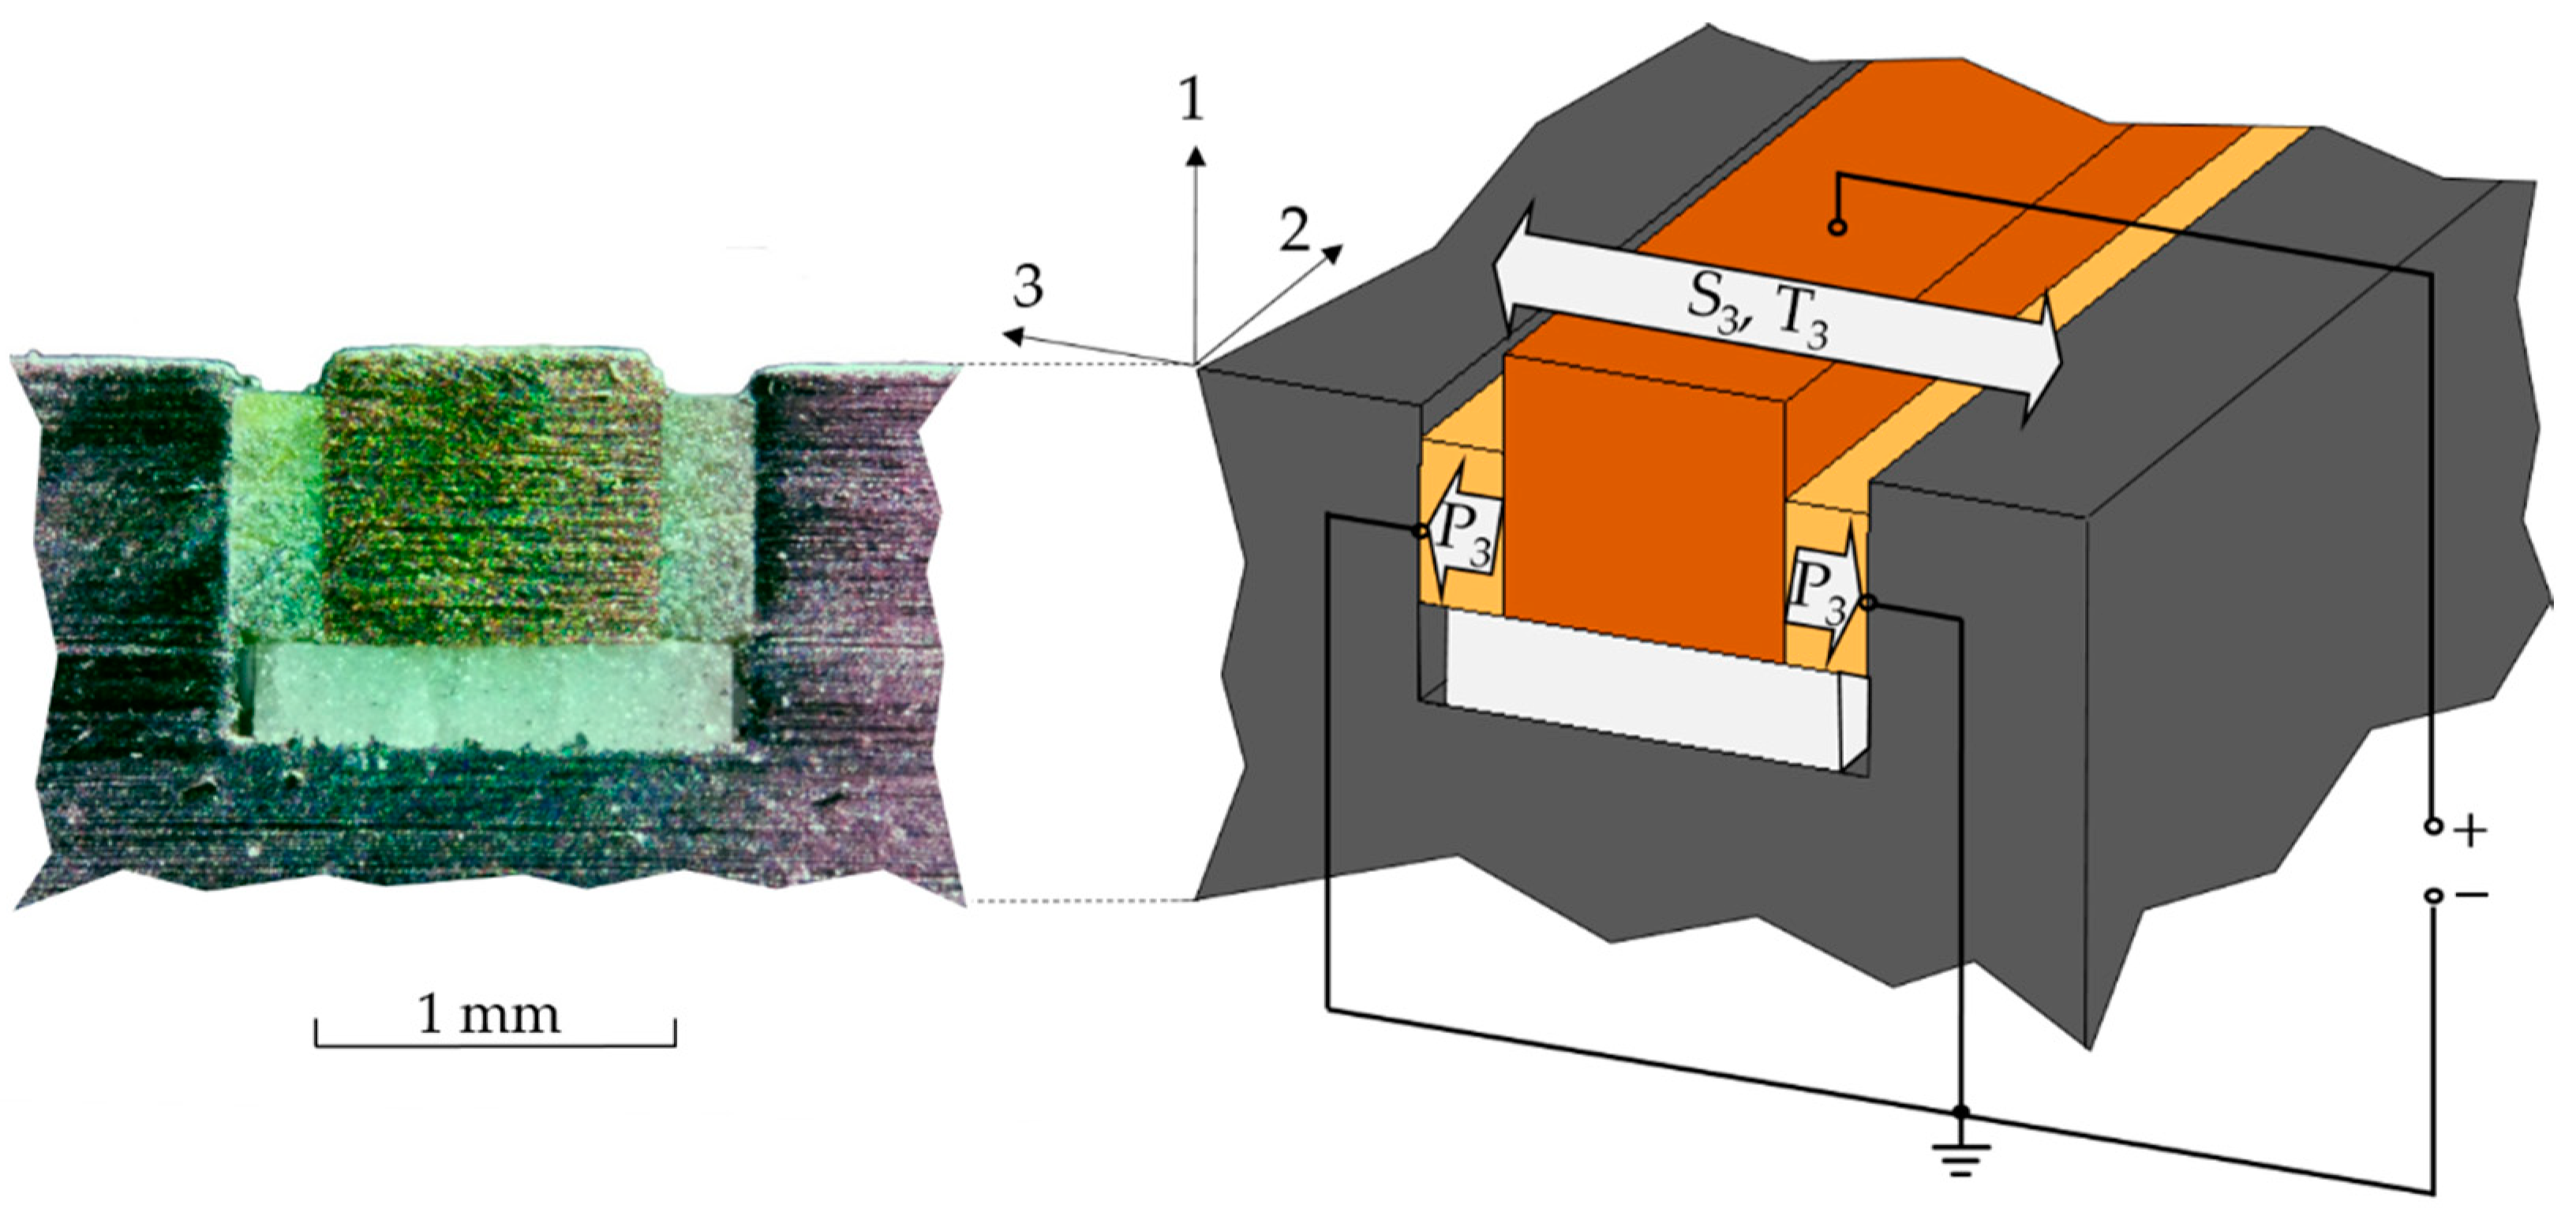
2.1. Structural Integrated Piezoceramics (SIP)
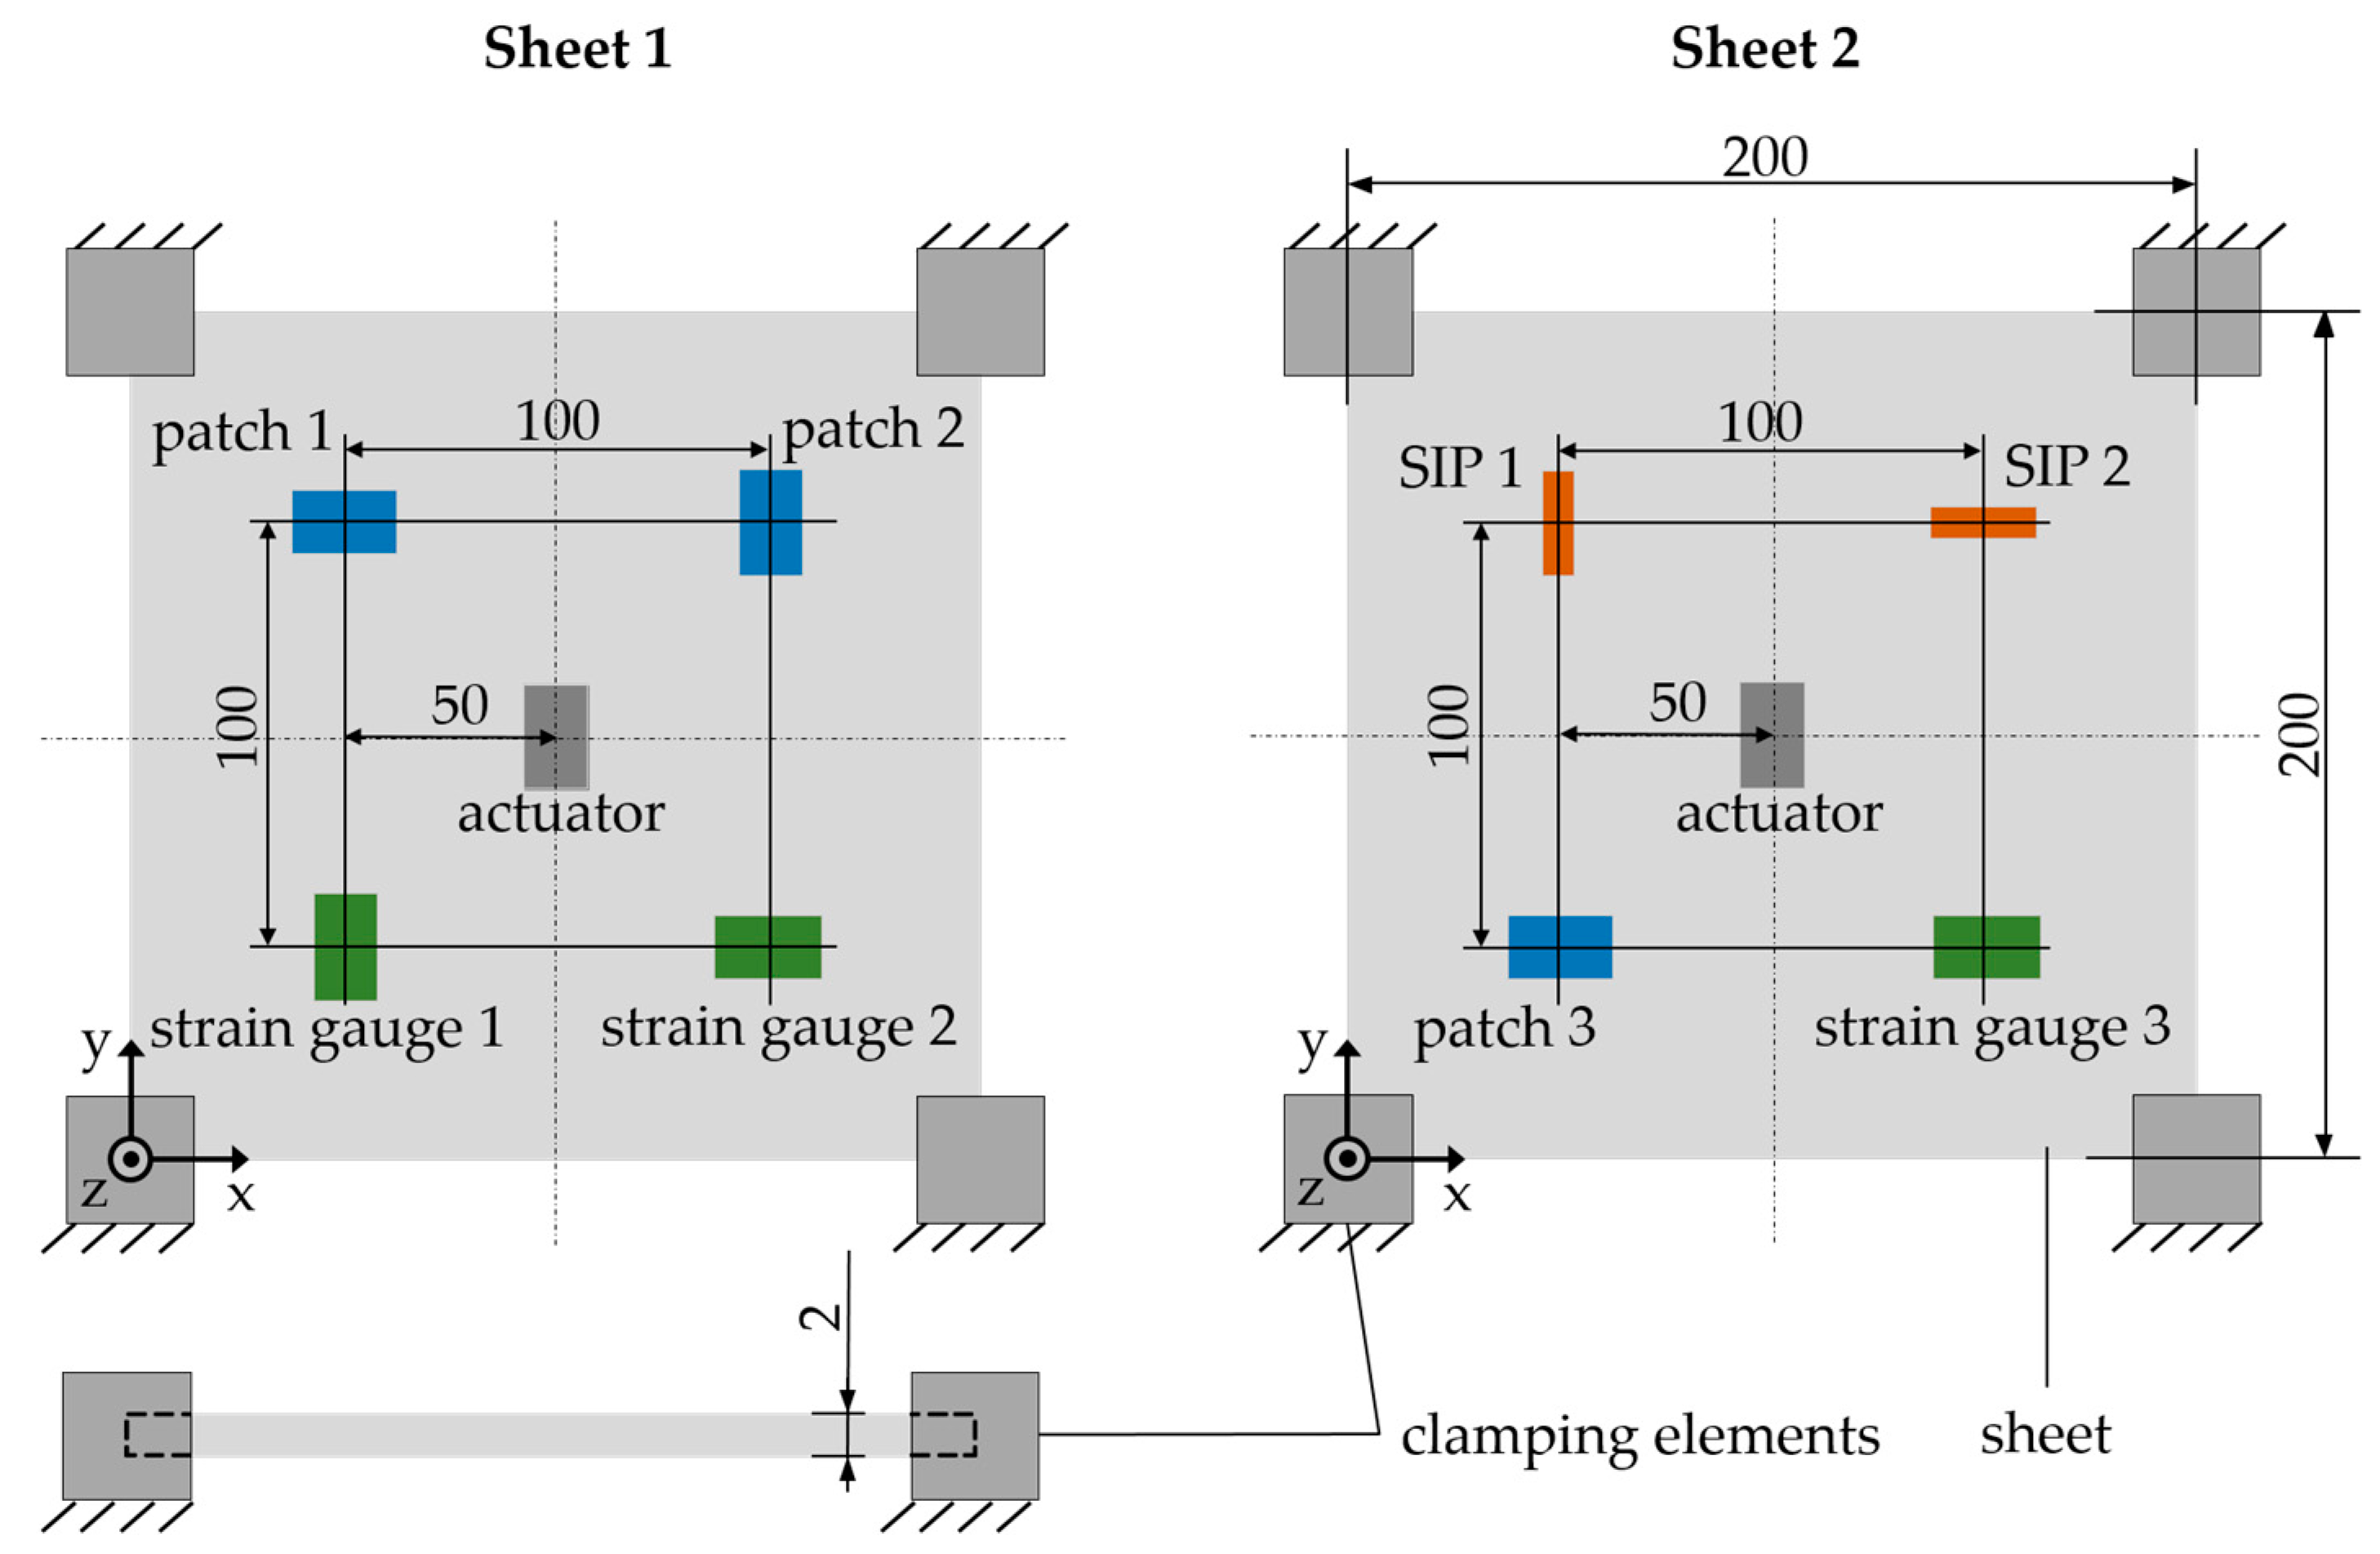
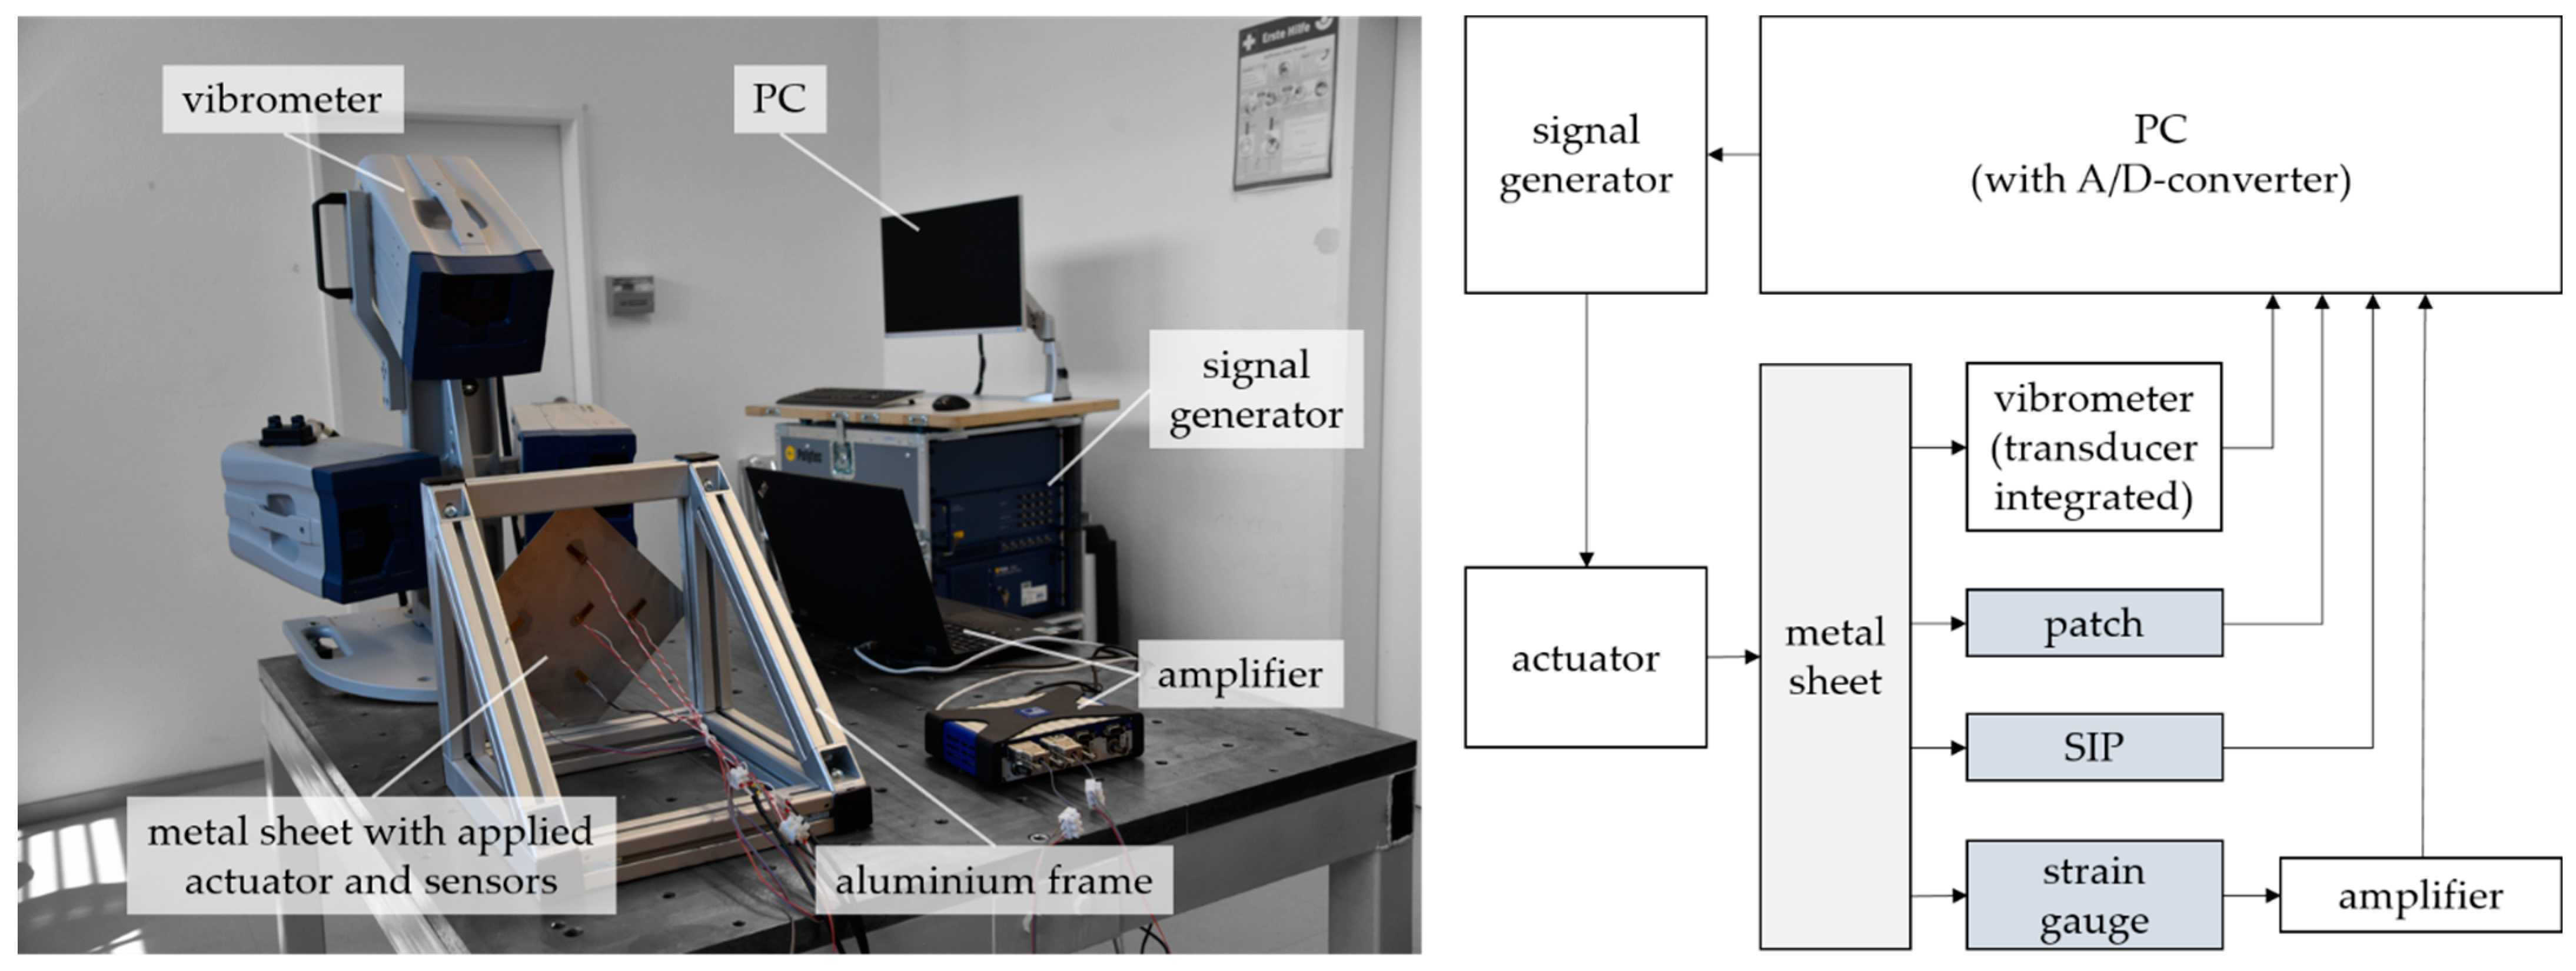
2.2. Experimental Setup
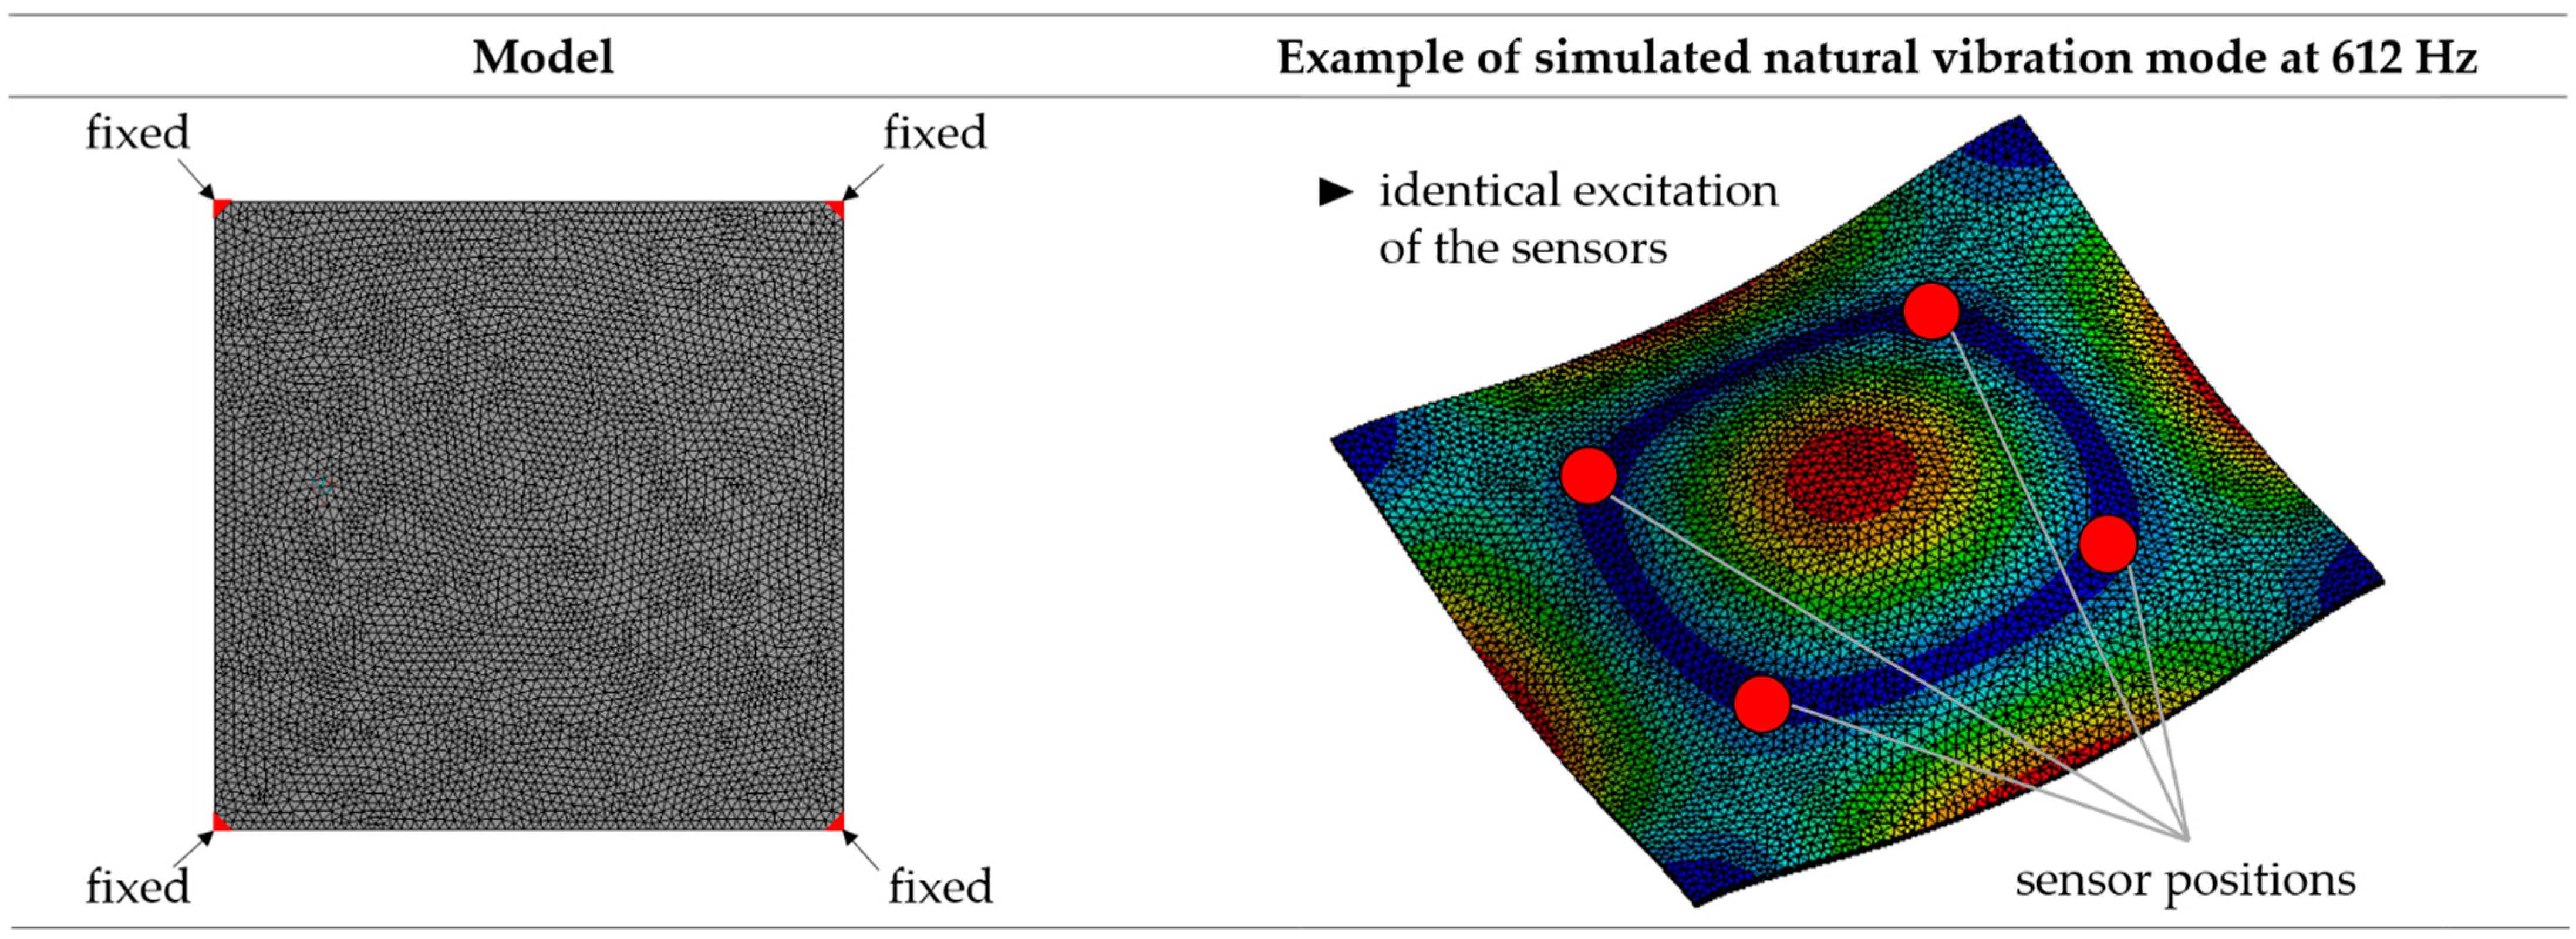
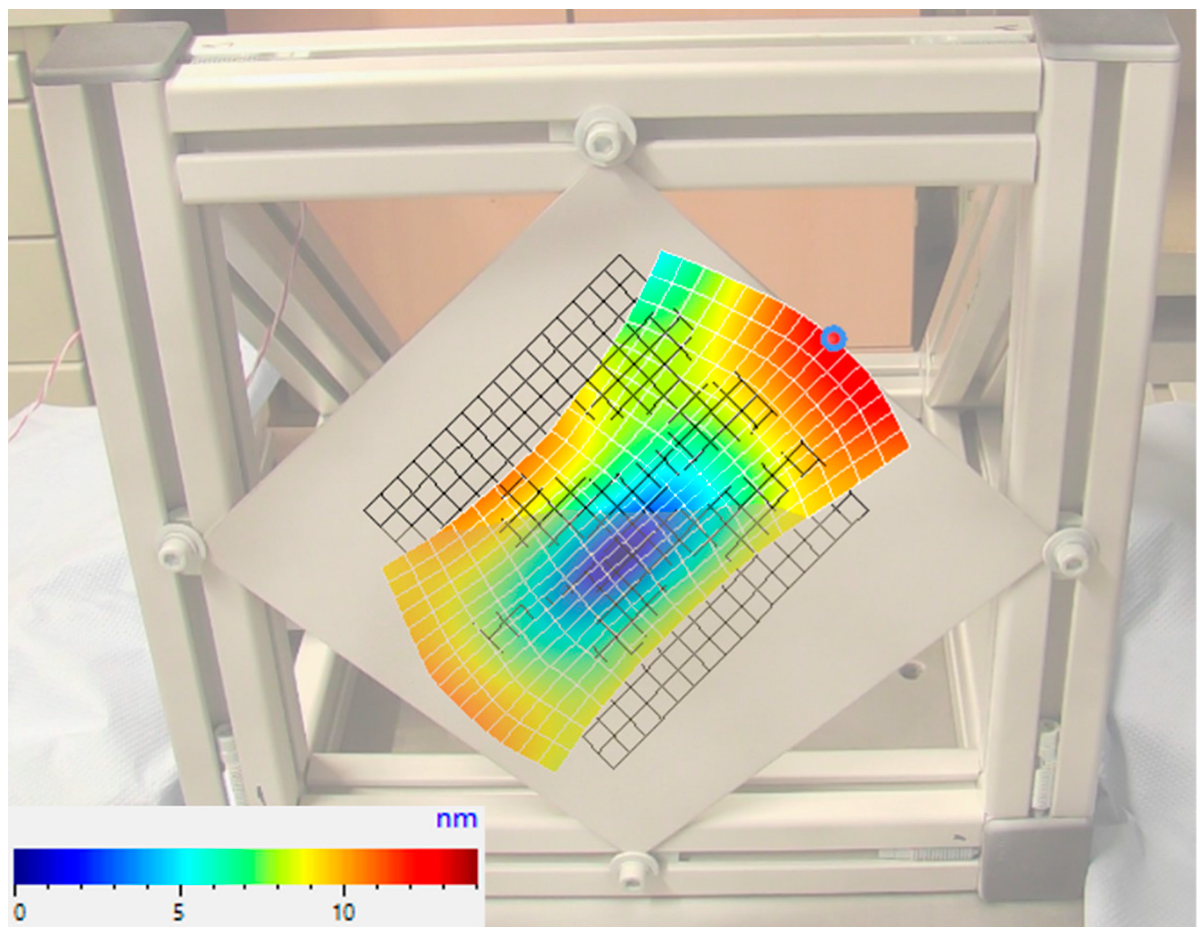
2.3. Preliminary Investigations
2.4. Experimental Plan
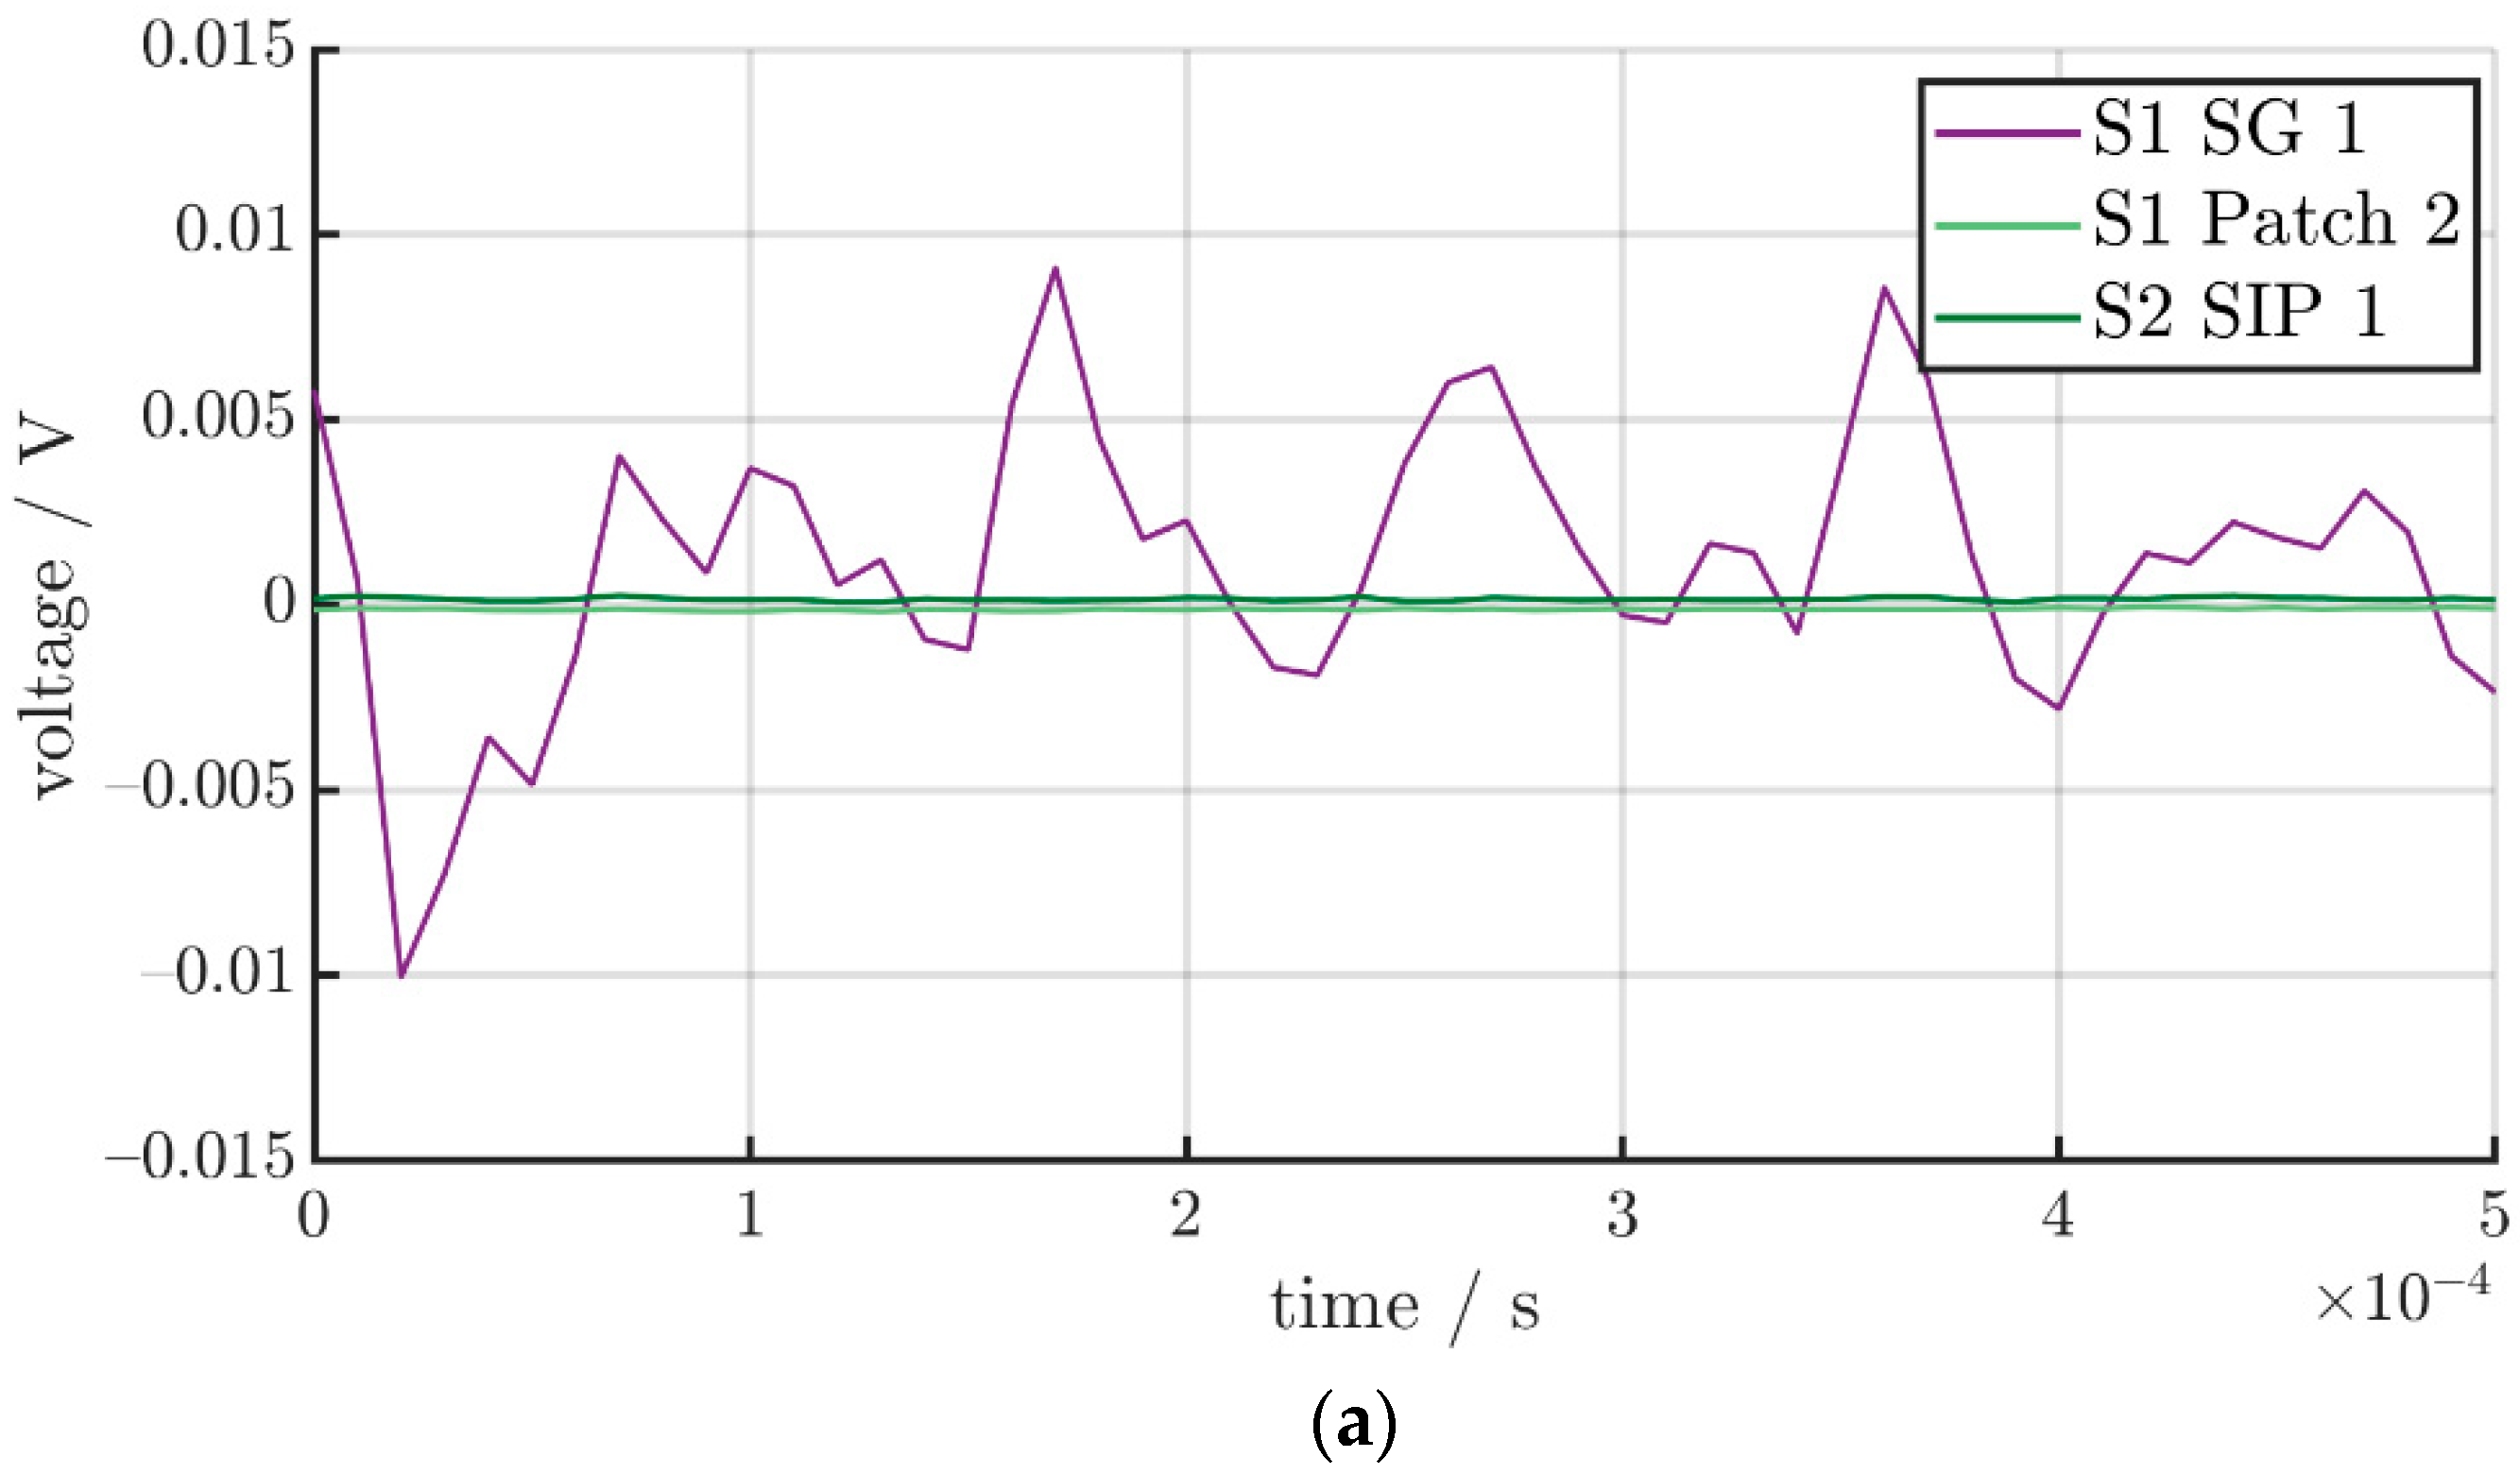
3. Results and Discussion
4. Conclusions
Author Contributions
Funding
Institutional Review Board Statement
Informed Consent Statement
Data Availability Statement
Conflicts of Interest
References
- Sakib, N.; Wuest, T. Challenges and Opportunities of Condition-based Predictive Maintenance: A Review. Procedia CIRP 2018, 78, 267–272. [Google Scholar] [CrossRef]
- Rizal, M.; Ghani, J.A.; Nuawi, M.Z.; Che Haron, C.H. A Review of Sensor System and Application in Milling Process for Tool Condition Monitoring. Res. J. Appl. Sci. Eng. Technol. 2013, 7, 2083–2097. [Google Scholar] [CrossRef]
- Bogue, R. Sensors for condition monitoring: A review of technologies and applications. Sens. Rev. 2013, 33, 295–299. [Google Scholar] [CrossRef]
- Efthymioua, K.; Papakostasa, N.; Mourtzisa, D.; Chryssolourisa, G. On a Predictive Maintenance Platform for Production Systems. Procedia CIRP 2012, 3, 221–226. [Google Scholar] [CrossRef]
- Khan, M.M.; Iqbal, M.T.; Khan, F. Reliability and condition monitoring of a wind turbine. In Proceedings of the Canadian Conference on Electrical and Computer Engineering, Saskatoon, SK, Canada, 1–4 May 2005; pp. 1981–1987. [Google Scholar] [CrossRef]
- Zhou, Y.; Xue, W. Review of tool condition monitoring methods in milling processes. Int. J. Adv. Manuf. Technol. 2018, 96, 2509–2523. [Google Scholar] [CrossRef]
- Bansal, D. Potential of Piezoelectric Sensors in Bio-signal Acquisition. Sens. Transducers 2012, 36, 147–157. Available online: https://www.sensorsportal.com/HTML/DIGEST/P_916.htm (accessed on 3 June 2022).
- Tianze, L.; Xia, Z.; Chuan, J.; Luan, H. Analysis of the characteristics of piezoelectric sensor and research of its application. In Proceedings of the 2009 18th IEEE International Symposium on the Applications of Ferroelectrics, Xian, China, 23–27 August 2009; pp. 1–4. [Google Scholar] [CrossRef]
- Michaels, J.E.; Michaels, T.E. Guided wave signal processing and image fusion for in situ damage localization in plates. Wave Motion 2007, 44, 482–492. [Google Scholar] [CrossRef]
- Kudela, P.; Radzienski, M.; Ostachowicz, W.; Yang, Z. Structural Health Monitoring system based on a concept of Lamb wave focusing by the piezoelectric array. Mech. Syst. Signal Process. 2018, 108, 21–32. [Google Scholar] [CrossRef]
- Qiu, L.; Yuan, S.; Chang, F.-K.; Bao, Q.; Mei, H. On-line updating Gaussian mixture model for aircraft wing spar damage evaluation under time-varying boundary condition. Smart Mater. Struct. 2014, 23, 1–14. [Google Scholar] [CrossRef]
- Qiu, L.; Yuan, S.; Boller, C. An adaptive guided wave-Gaussian mixture model for damage monitoring under time-varying conditions: Validation in a full-scale aircraft fatigue Test. Struct. Health Monit. 2017, 16, 501–517. [Google Scholar] [CrossRef]
- Duraact Patch Transducer. Available online: https://www.physikinstrumente.com/en/expertise/technology/piezo-technology/duraact-patch-transducer-technology/ (accessed on 3 June 2022).
- Kovalocs, A.; Barkanov, E.; Gluhihs, S. Active control of structures using macro-fiber composite. J. Phys. Conf. Ser. 2007, 93, 1–7. [Google Scholar] [CrossRef]
- Smart Layer Sensors. Available online: https://www.acellent.com/products/smart-layer-sensors (accessed on 11 November 2022).
- Sodano, H.A.; Parl, G.; Inman, D.J. An investigation into the performance of macro-fiber composites for sensing and structural vibration applications. Mech. Syst. Signal Process. 2004, 18, 683–697. [Google Scholar] [CrossRef]
- Zeng, X.; Liu, X.; Sun, H.; Qing, X. Prognosis of fatigue cracks in an aircraft wing using an adaptive tunable network and guided wave based structural health monitoring. Smart Mater. Struct. 2021, 30, 1–12. [Google Scholar] [CrossRef]
- Data Sheet Dura Act Patch Transducer. Available online: https://static.piceramic.com/fileadmin/user_upload/physik_instrumente/files/datasheets/P-878-Datasheet.pdf (accessed on 3 May 2022).
- Curie Temperature. Available online: https://www.piceramic.com/en/expertise/piezo-technology/properties-piezo-actuators/temperature-dependence/ (accessed on 3 June 2022).
- Kahn, A.; Kim, H.S. Active Vibration Control of a Piezo-Bonded Laminated Composite in the Presence of Sensor Partial Debonding and Structural Delaminations. MDPI Sens. 2019, 19, 540. [Google Scholar] [CrossRef]
- Moharana, S.; Bhalla, S. Influence of adhesive bond layer on power and energy transduction efficiency of piezo-impedance transducer. J. Intell. Mater. Syst. Struct. 2015, 26, 247–259. [Google Scholar] [CrossRef]
- Sheau, W.-J.; Huang, R.-T.; Wang, C.-C. Influence of bonding glues on the vibration of piezoelectric fans. Sens. Actuators A Phys. 2008, 148, 115–121. [Google Scholar] [CrossRef]
- Gschoßmann, S.; Humer, C.; Schagerl, M. Lamb wave excitation and detection with piezoelectric elements Essential aspects for a reliable numerical simulation. In Proceedings of the 8th European Workshop on Structural Health Monitoring (EWSHM 2016), Spain, Bilbao, 5–8 July 2016. [Google Scholar]
- Kirillova, E.V.; Seemann, W.; Shevtsova, M.S. The influence of an adhesive layer on the Interaction between a Piezo-Actuator and an elastic 3D-Layer and on the exited Wave Fields. Mater. Phys. Mech. 2019, 42, 40–53. [Google Scholar] [CrossRef]
- Yu, L.; Bottai-Santoni, G.; Giurgiutiu, V. Shear lag solution for tuning ultrasonic piezoelectric wafer active sensors with applications to Lamb wave array imaging. Int. J. Eng. Sci. 2010, 48, 848–861. [Google Scholar] [CrossRef]
- Shin, S.; Zamorano, B.; Elvin, N. Comparison of the electromechanical properties of embedded and surface mounted piezoelectric transducers. J. Intell. Mater. Syst. Struct. 2016, 27, 2837–2850. [Google Scholar] [CrossRef]
- Yanaseko, T.; Sato, S.; Kuboki, I.; Mossi, K.; Asanuma, H. Vibration Viscosity Sensor for Engine Oil Monitoring Using Metal Matrix Piezoelectric Composite. MDPI Mater. 2019, 12, 3415. [Google Scholar] [CrossRef]
- Müller, M.; Müller, B.; Hensel, S.; Nestler, M.; Jahn, S.F.; Müller, R.; Schubert, A.; Drossel, W.G. Structural integration of PZT fibers in deep drawn sheet metal for material-integrated health monitoring. Mechatronics 2016, 34, 100–110. [Google Scholar] [CrossRef]
- Schubert, A.; Koriath, H.-J.; Wittstock, V.; Müller, B.; Pierer, A.; Schmidt, M. Advanced Micro Structuring and Joining Technologies for Direct Integration of Piezo Fibers into Metallic Materials. Adv. Eng. Mater. 2018, 20, 1–8. [Google Scholar] [CrossRef]
- Drossel, W.-G.; Hensel, S.; Nestler, M.; Lachmann, L.; Schubert, A.; Müller, M.; Müller, B. Experimental and numerical study on shaping of aluminum sheets with integrated piezoceramic fibers. J. Mater. Process. Technol. 2014, 214, 217–228. [Google Scholar] [CrossRef]
- Reis, J.; Costa, C.O.; Costa, J.S. Strain gauges debonding fault detection for structural health monitoring. Struct. Control. Health Monit. 2018, 25, 1–14. [Google Scholar] [CrossRef]
- Bernal, E.; Spiryagin, M.; Cole, C. Onboard Condition Monitoring Sensors, Systems and Techniques for Freight Railway Vehicles: A Review. IEEE Sens. J. 2019, 19, 4–24. [Google Scholar] [CrossRef]
- Kimme, S.; Hafez, N.; Titsch, C.; Werner, J.M.; Nestler, A.; Drossel, W.-G. Close-to-process strain measurement in ultrasonic vibration-assisted machining. J. Sens. Sens. Syst. 2019, 8, 285–292. [Google Scholar] [CrossRef]
- Strain Gauges. Available online: https://www.hbm.com/en/4561/ly-linear-strain-gauges-with-1-measurement-grid/?product_type_no=LY%20Linear%20Strain%20Gauges%20with%201%20Measuring%20Grid (accessed on 4 May 2022).
- Johnson Matthey Piezoceramic Masses. Available online: https://www.piezoproducts.com/wp-content/uploads/2020/03/JM_Piezo_Products-Data-Sheet-Piezoceramic-Masses-v2.00.0004.pdf (accessed on 4 May 2022).
- X5CrNi18-10 Applications. Available online: https://www.theworldmaterial.com/din-en-1-4301-material-x5crni18-10-stainless-steel/ (accessed on 8 November 2022).
- DIN EN 10088-2:2014; Stainless Steels—Part 2: Technical Delivery Conditions for Sheet/Plate and Strip of Corrosion Resisting Steels for General Purposes. Beuth Verlag: Berlin, Germany, 2014. [CrossRef]
- DIN EN 485-2:2016+A1:2018; Aluminium and Aluminium Alloys—Sheet, Strip and Plate—Part 2: Mechanical Properties. Beuth Verlag: Berlin, Germany, 2018. [CrossRef]
- Neugebauer, R.; Koriath, H.J.; Müller, M. Assembly of smart adaptronic piezo-metal composites by use of prefabricated batches of piezoceramic micro parts. Proc. SPIE 2013, 8692, 869224-1–869224-9. [Google Scholar] [CrossRef]
- DIN EN 10088-1:2014; Stainless Steels—Part 1: List of Stainless Steels; German Version EN 10088-1:2014. Beuth Verlag: Berlin, Germany, 2014. [CrossRef]


| Strain Gauge [34] | Piezoelectric Patch [18] | Structural Integrated Piezoceramics (SIP) | |
|---|---|---|---|
| Name | Type: LY4-7-09-350-3-2 | P-878 DuraAct Power Patch Transducer | SIP |
| Manufacturer | Hottinger Baldwin Messtechnik GmbH (HBM), Darmstadt, Germany | PI Ceramic GmbH, Lederhose, Germany | Raw Material from Johnson Matthey, London, UK [35] |
| Sensor effect | Electrical resistance | Piezoelectric d33-effect | Piezoelectric d33-effect |
| Size of active element | 10 mm × 5 mm × 0.081 mm | 15 mm × 5.4 mm × 0.6 mm | 5 mm × 1.4 mm × 0.26 mm |
| Piezoelectric charge coefficient [10–12 C/N] | / | 640 | 400 |
| Transversal contraction | −0.2 | ~−0.3 | ~−0.3 |
| Sensor | Noise | Offset | Alignment |
|---|---|---|---|
| Sheet 1 Patch 1 | ±0.5 mV | −70 mV | perpendicular |
| Sheet 1 Patch 2 | ±0.5 mV | −19 mV | parallel |
| Sheet 1 SG 1 | ±8 mV | +12 mV | parallel |
| Sheet 1 SG 2 | ±8 mV | +11 mV | perpendicular |
| Sheet 2 SIP 1 | ±0.5 mV | −70 mV | parallel |
| Sheet 2 SIP 2 | ±0.5 mV | −20 mV | perpendicular |
| Sheet 2 Patch 3 | ±0.5 mV | −17 mV | perpendicular |
| Sheet 2 SG 3 | ±11 mV | −32 mV | perpendicular |
| Frequency Range | Frequency Step Size |
|---|---|
| 500–1000 Hz | 250 Hz |
| 1000–5000 Hz | 500 Hz |
| 5000–10,000 Hz | 1000 Hz |
| 10,000–30,000 Hz | 2000 Hz |
| 30,000–50,000 Hz | 5000 Hz |
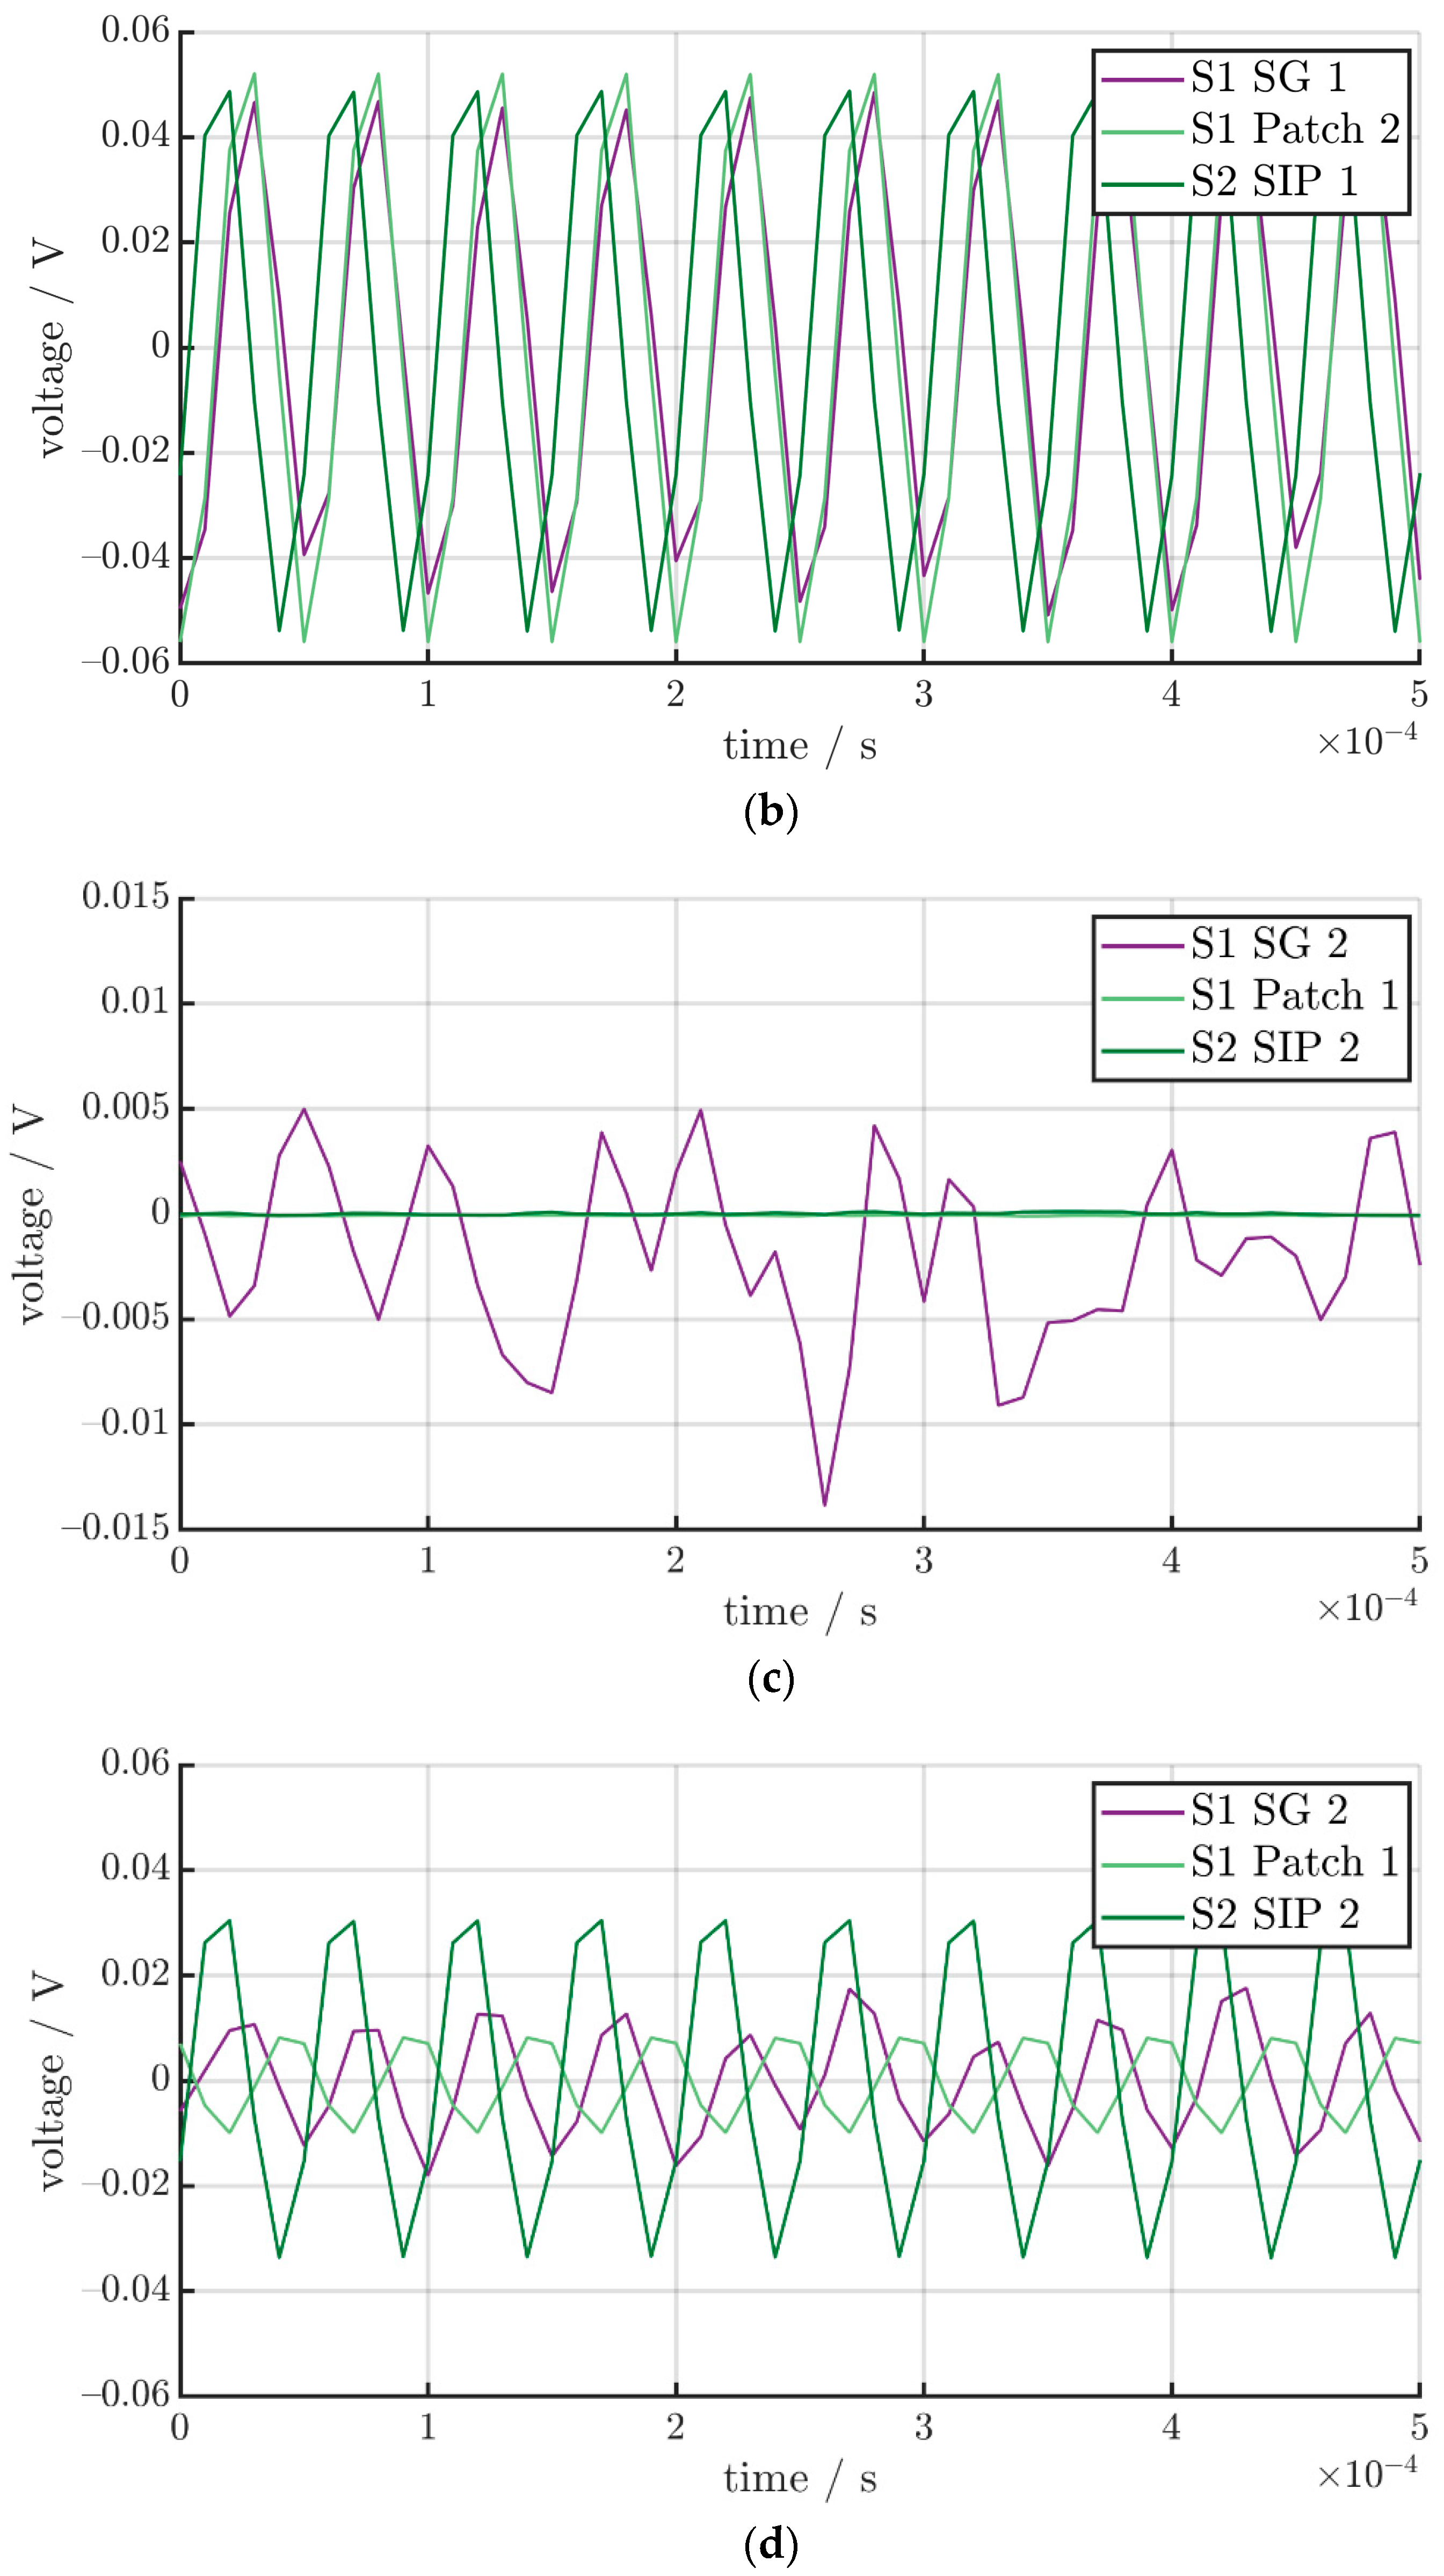
| Sensor | Alignment | Noise | Signal 5000 Hz | Signal 10,000 Hz | Signal 20,000 Hz | Signal 40,000 Hz |
|---|---|---|---|---|---|---|
| Sheet 1 Patch 1 | perpendicular | 0.5 mV | 60 mV | 54 mV | 8 mV | 10 mV |
| Sheet 1 SG 2 | perpendicular | 8 mV | only noise | only noise | 12 mV | only noise |
| Sheet 2 SIP 2 | perpendicular | 0.5 mV | 31 mV | 49 mV | 30 mV | 33 mV |
| Sheet 1 Patch 2 | parallel | 0.5 mV | 55 mV | 72 mV | 52 mV | 10 mV |
| Sheet 1 SG 1 | parallel | 8 mV | 17 mV | 37 mV | 50 mV | only noise |
| Sheet 2 SIP 1 | parallel | 0.5 mV | 26 mV | 48 mV | 48 mV | 21 mV |
| Sensor | Alignment | Noise | Signal-to-Noise Ratio | |||
|---|---|---|---|---|---|---|
| 5000 Hz | 10,000 Hz | 20,000 Hz | 40,000 Hz | |||
| Sheet 1 Patch 1 | perpendicular | 0.5 mV | 120 | 108 | 16 | 20 |
| Sheet 1 SG 2 | perpendicular | 8 mV | only noise | only noise | 1.5 | only noise |
| Sheet 2 SIP 2 | perpendicular | 0.5 mV | 62 | 98 | 60 | 66 |
| Sheet 1 Patch 2 | parallel | 0.5 mV | 110 | 144 | 104 | 20 |
| Sheet 1 SG 1 | parallel | 8 mV | 2.13 | 4.63 | 6.25 | only noise |
| Sheet 2 SIP 1 | parallel | 0.5 mV | 52 | 96 | 96 | 42 |
Publisher’s Note: MDPI stays neutral with regard to jurisdictional claims in published maps and institutional affiliations. |
© 2022 by the authors. Licensee MDPI, Basel, Switzerland. This article is an open access article distributed under the terms and conditions of the Creative Commons Attribution (CC BY) license (https://creativecommons.org/licenses/by/4.0/).
Share and Cite
Werner, J.M.; Engelmann, M.; Schmidt, M.; Titsch, C.; Dix, M.; Drossel, W.-G. Comparison of Structural Integrated Piezoceramics, Piezoelectric Patches and Strain Gauges for Condition Monitoring. Sensors 2022, 22, 8847. https://doi.org/10.3390/s22228847
Werner JM, Engelmann M, Schmidt M, Titsch C, Dix M, Drossel W-G. Comparison of Structural Integrated Piezoceramics, Piezoelectric Patches and Strain Gauges for Condition Monitoring. Sensors. 2022; 22(22):8847. https://doi.org/10.3390/s22228847
Chicago/Turabian StyleWerner, Jonas Maximilian, Max Engelmann, Marek Schmidt, Christian Titsch, Martin Dix, and Welf-Guntram Drossel. 2022. "Comparison of Structural Integrated Piezoceramics, Piezoelectric Patches and Strain Gauges for Condition Monitoring" Sensors 22, no. 22: 8847. https://doi.org/10.3390/s22228847
APA StyleWerner, J. M., Engelmann, M., Schmidt, M., Titsch, C., Dix, M., & Drossel, W.-G. (2022). Comparison of Structural Integrated Piezoceramics, Piezoelectric Patches and Strain Gauges for Condition Monitoring. Sensors, 22(22), 8847. https://doi.org/10.3390/s22228847