
Seizure Detection: A Low Computational Effective Approach without Classification Methods
 , ,
, , 
Abstract
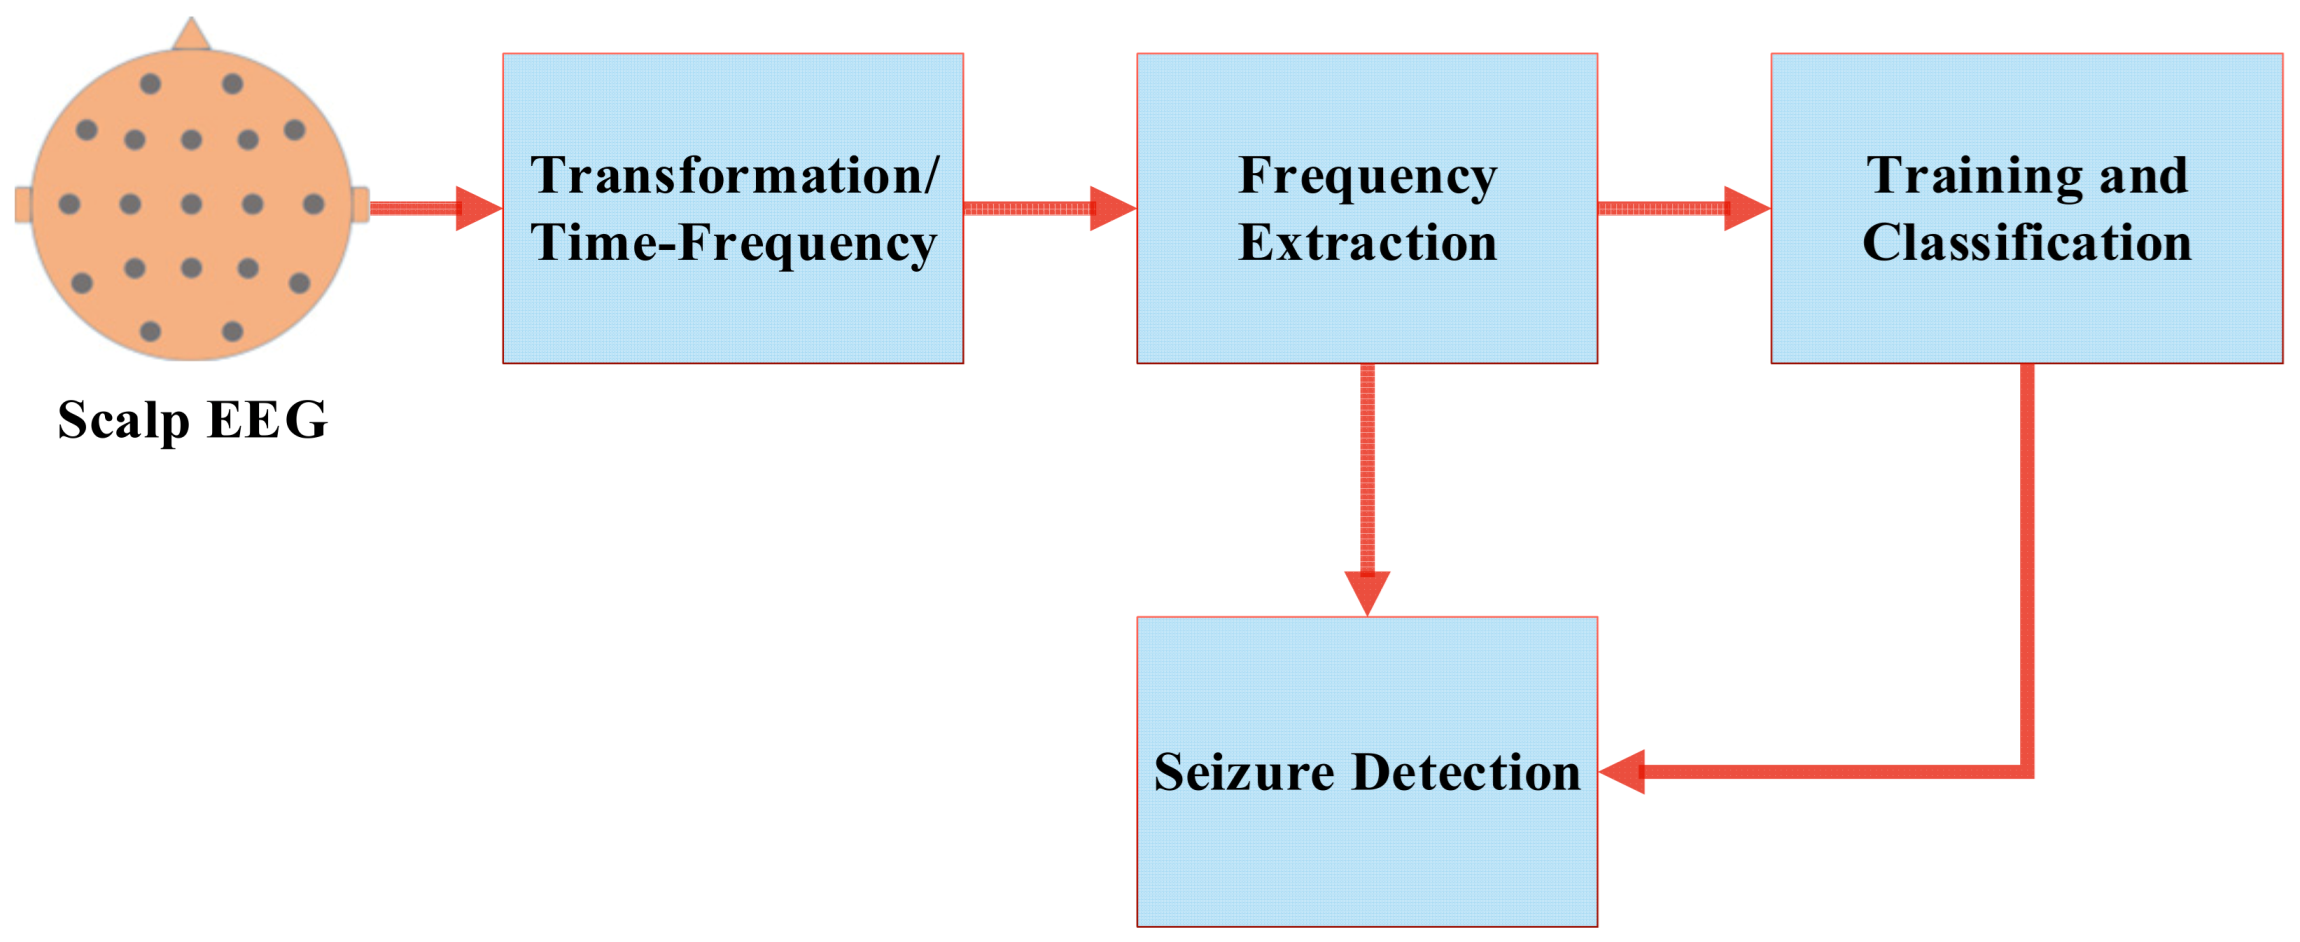
1. Introduction
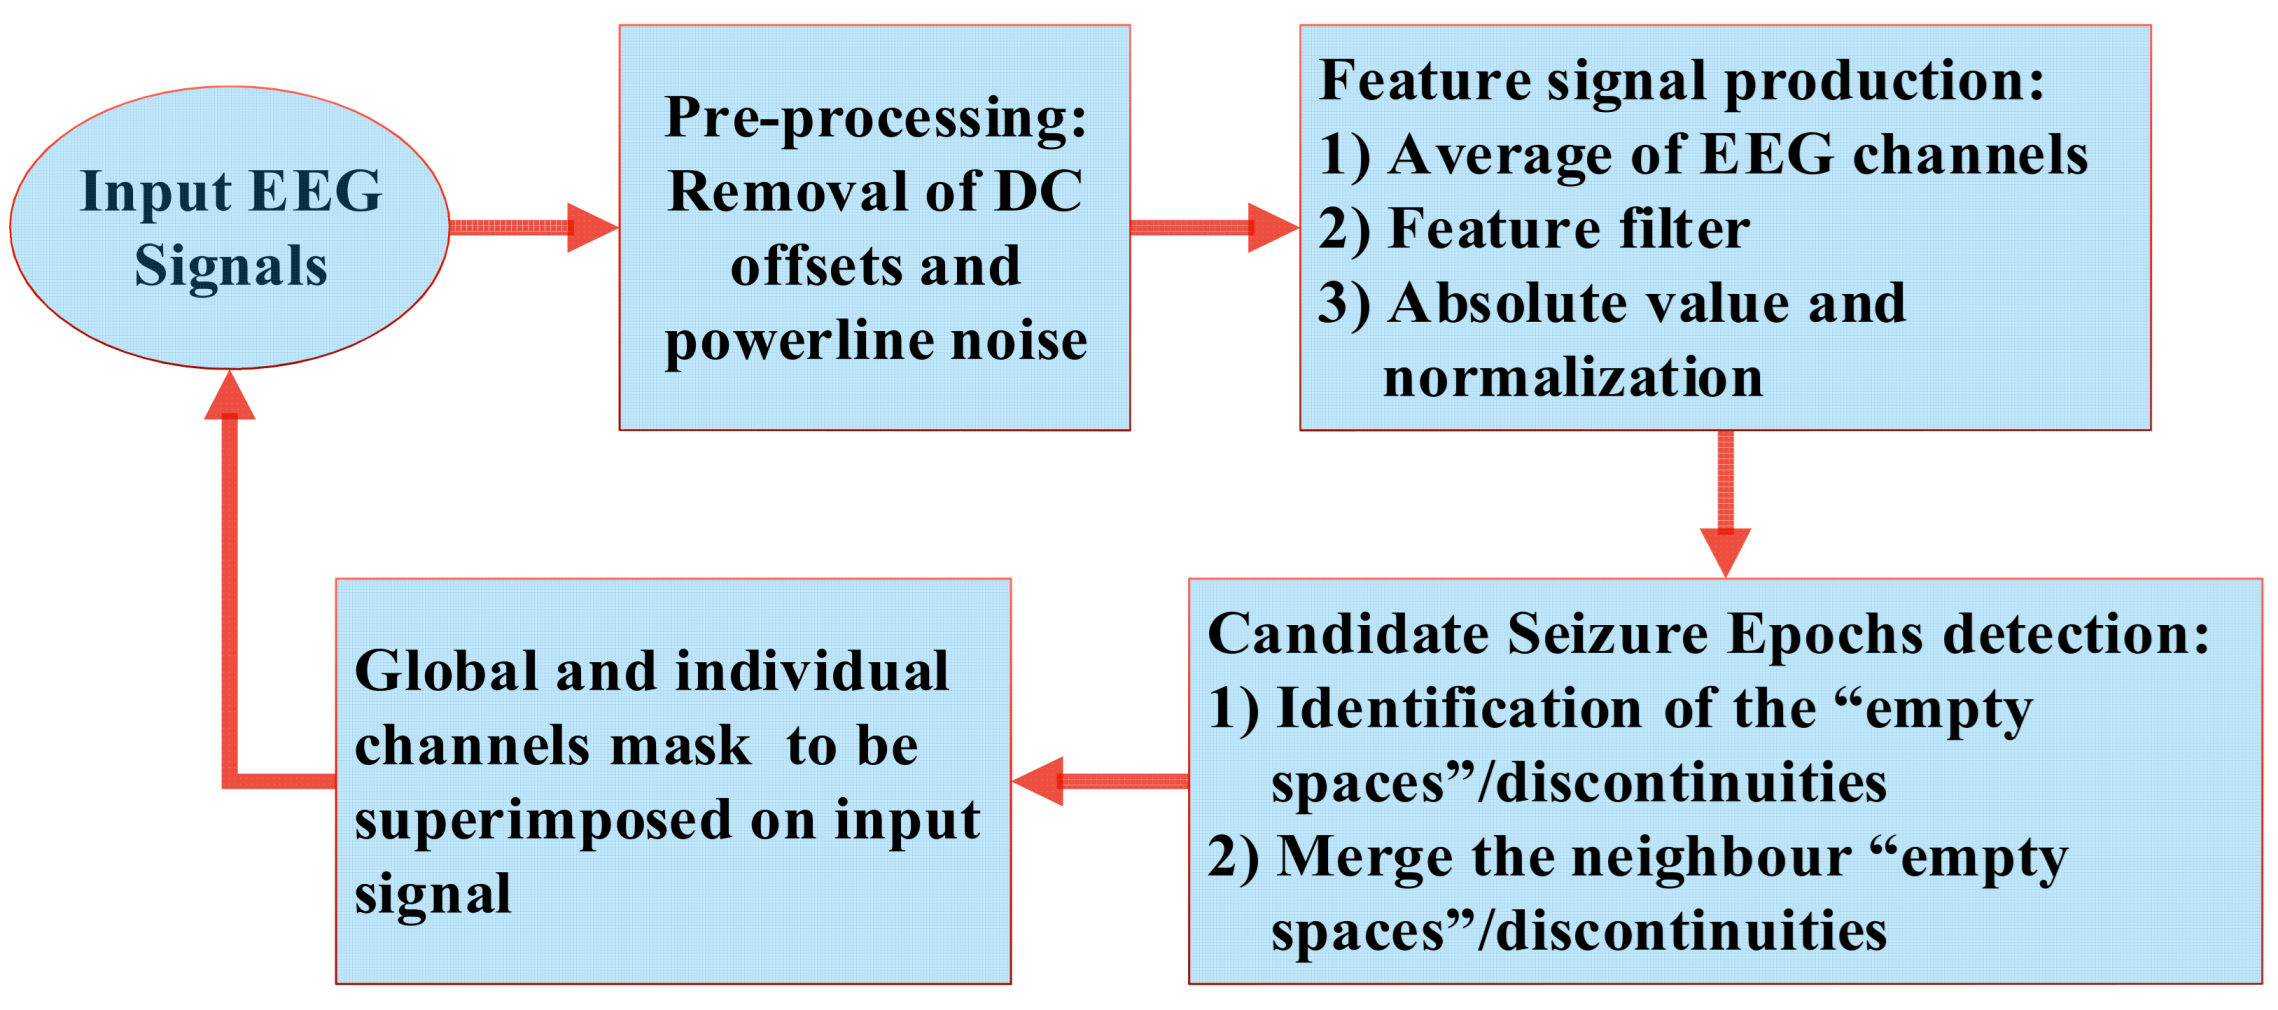
2. Low-Computational Seizure-Detection Method
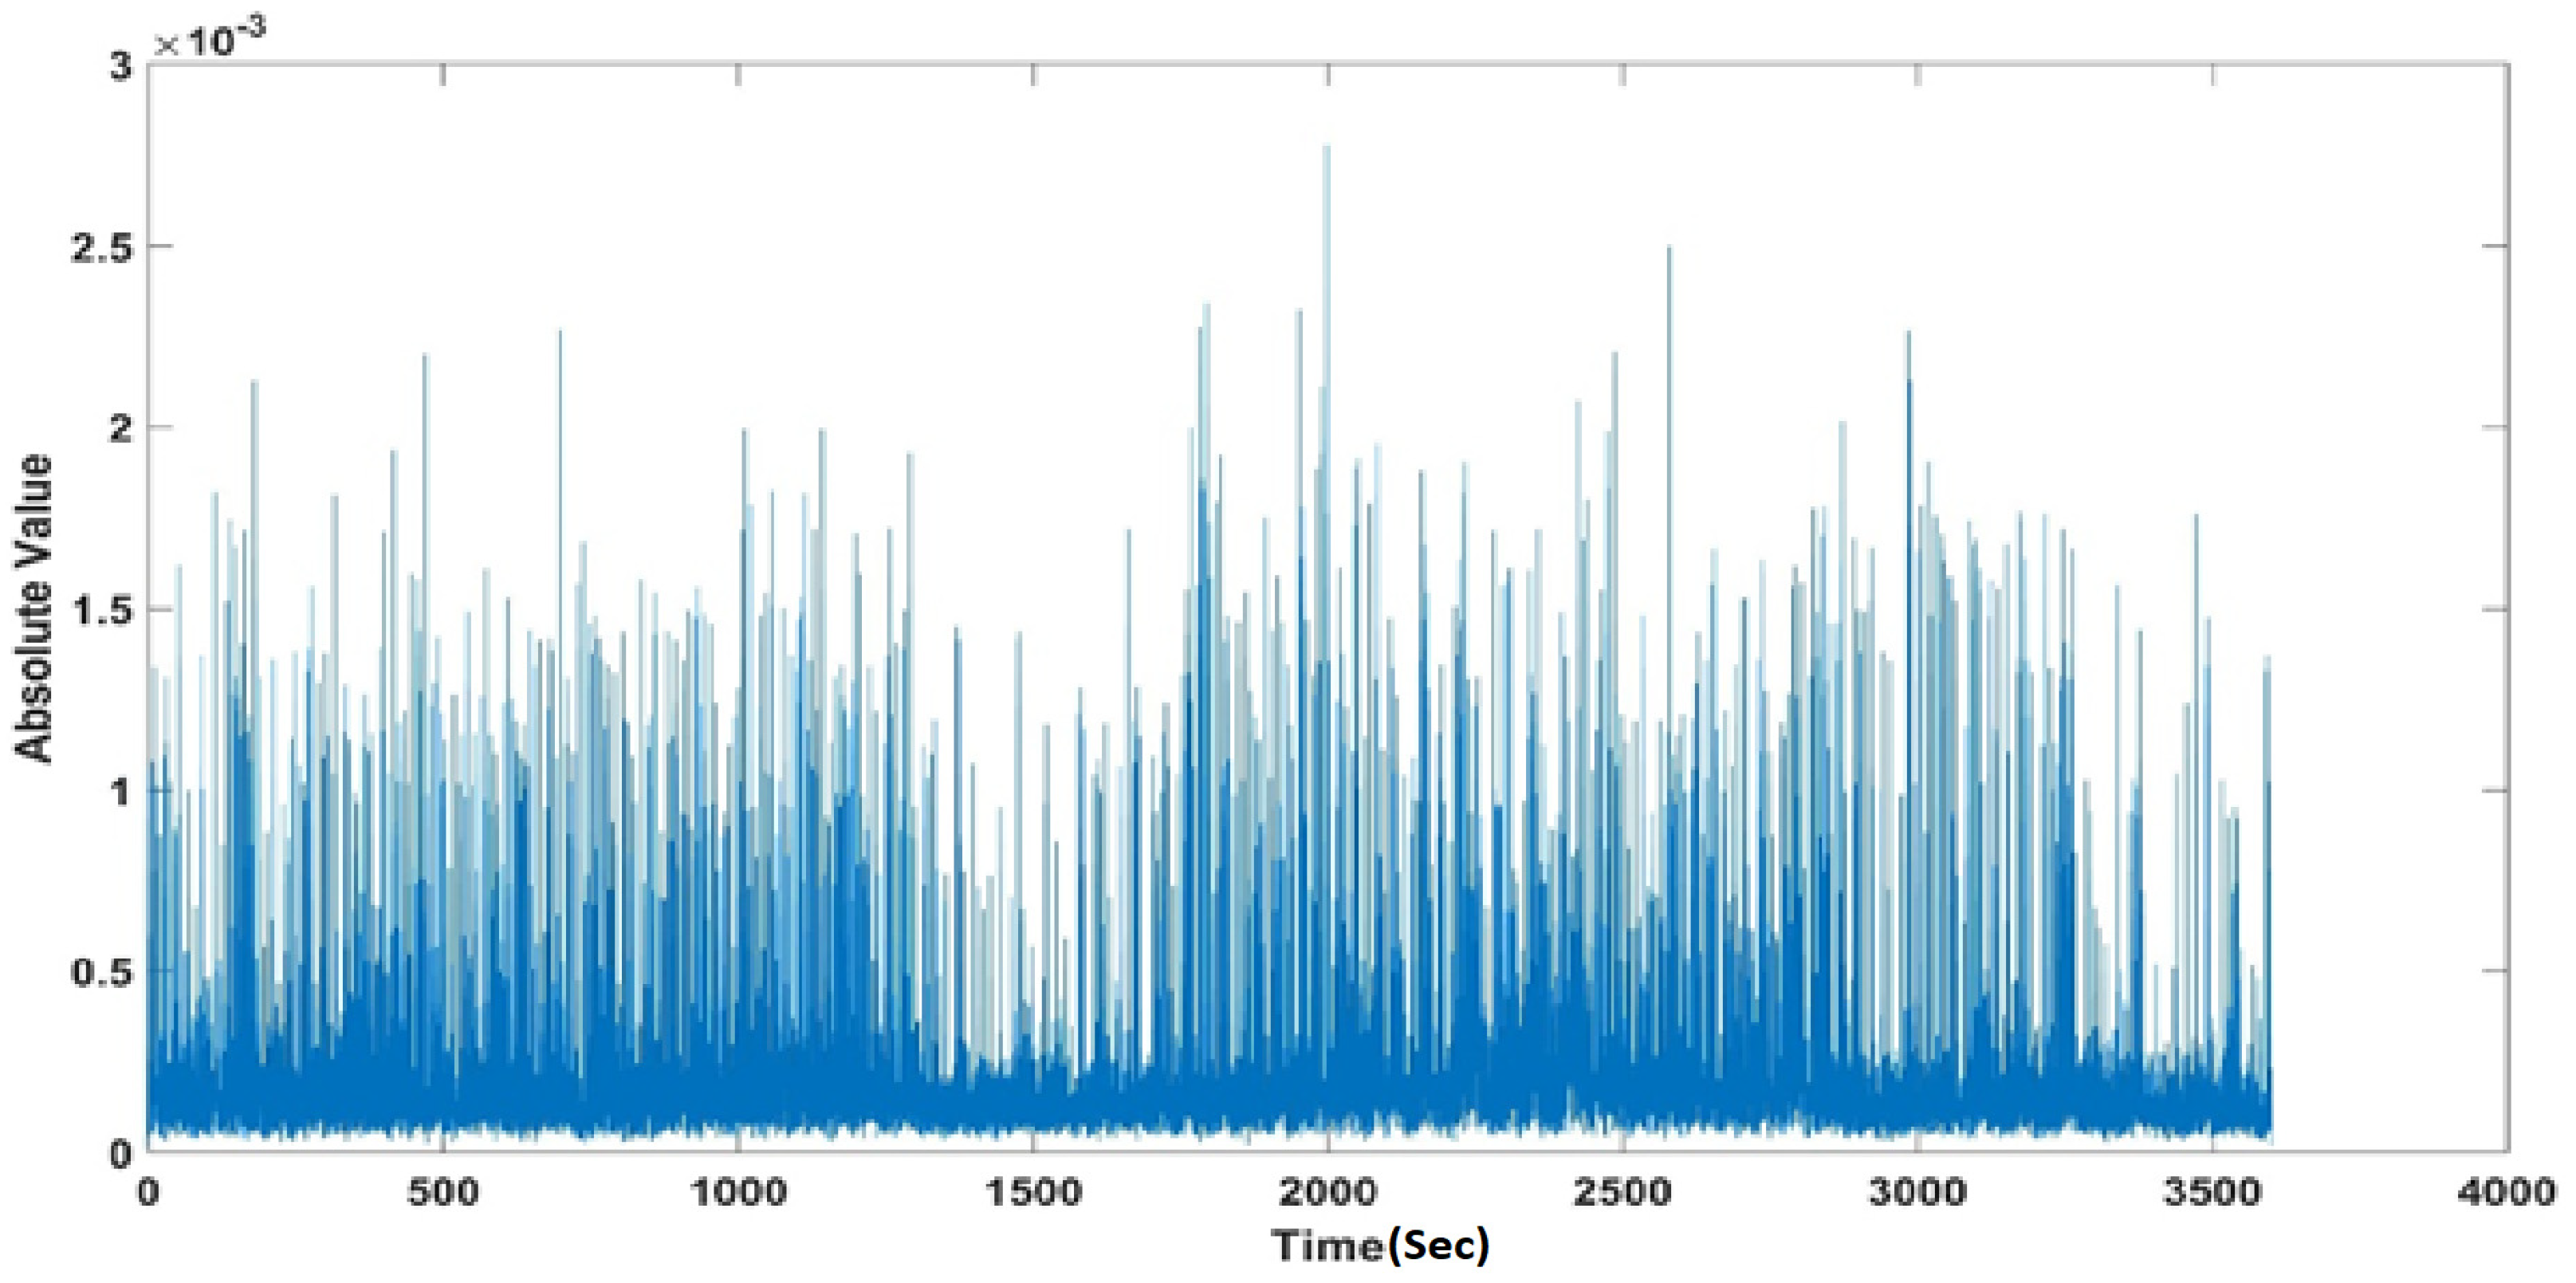
2.1. Production of the “Feature Signal”
2.2. Dataset Details
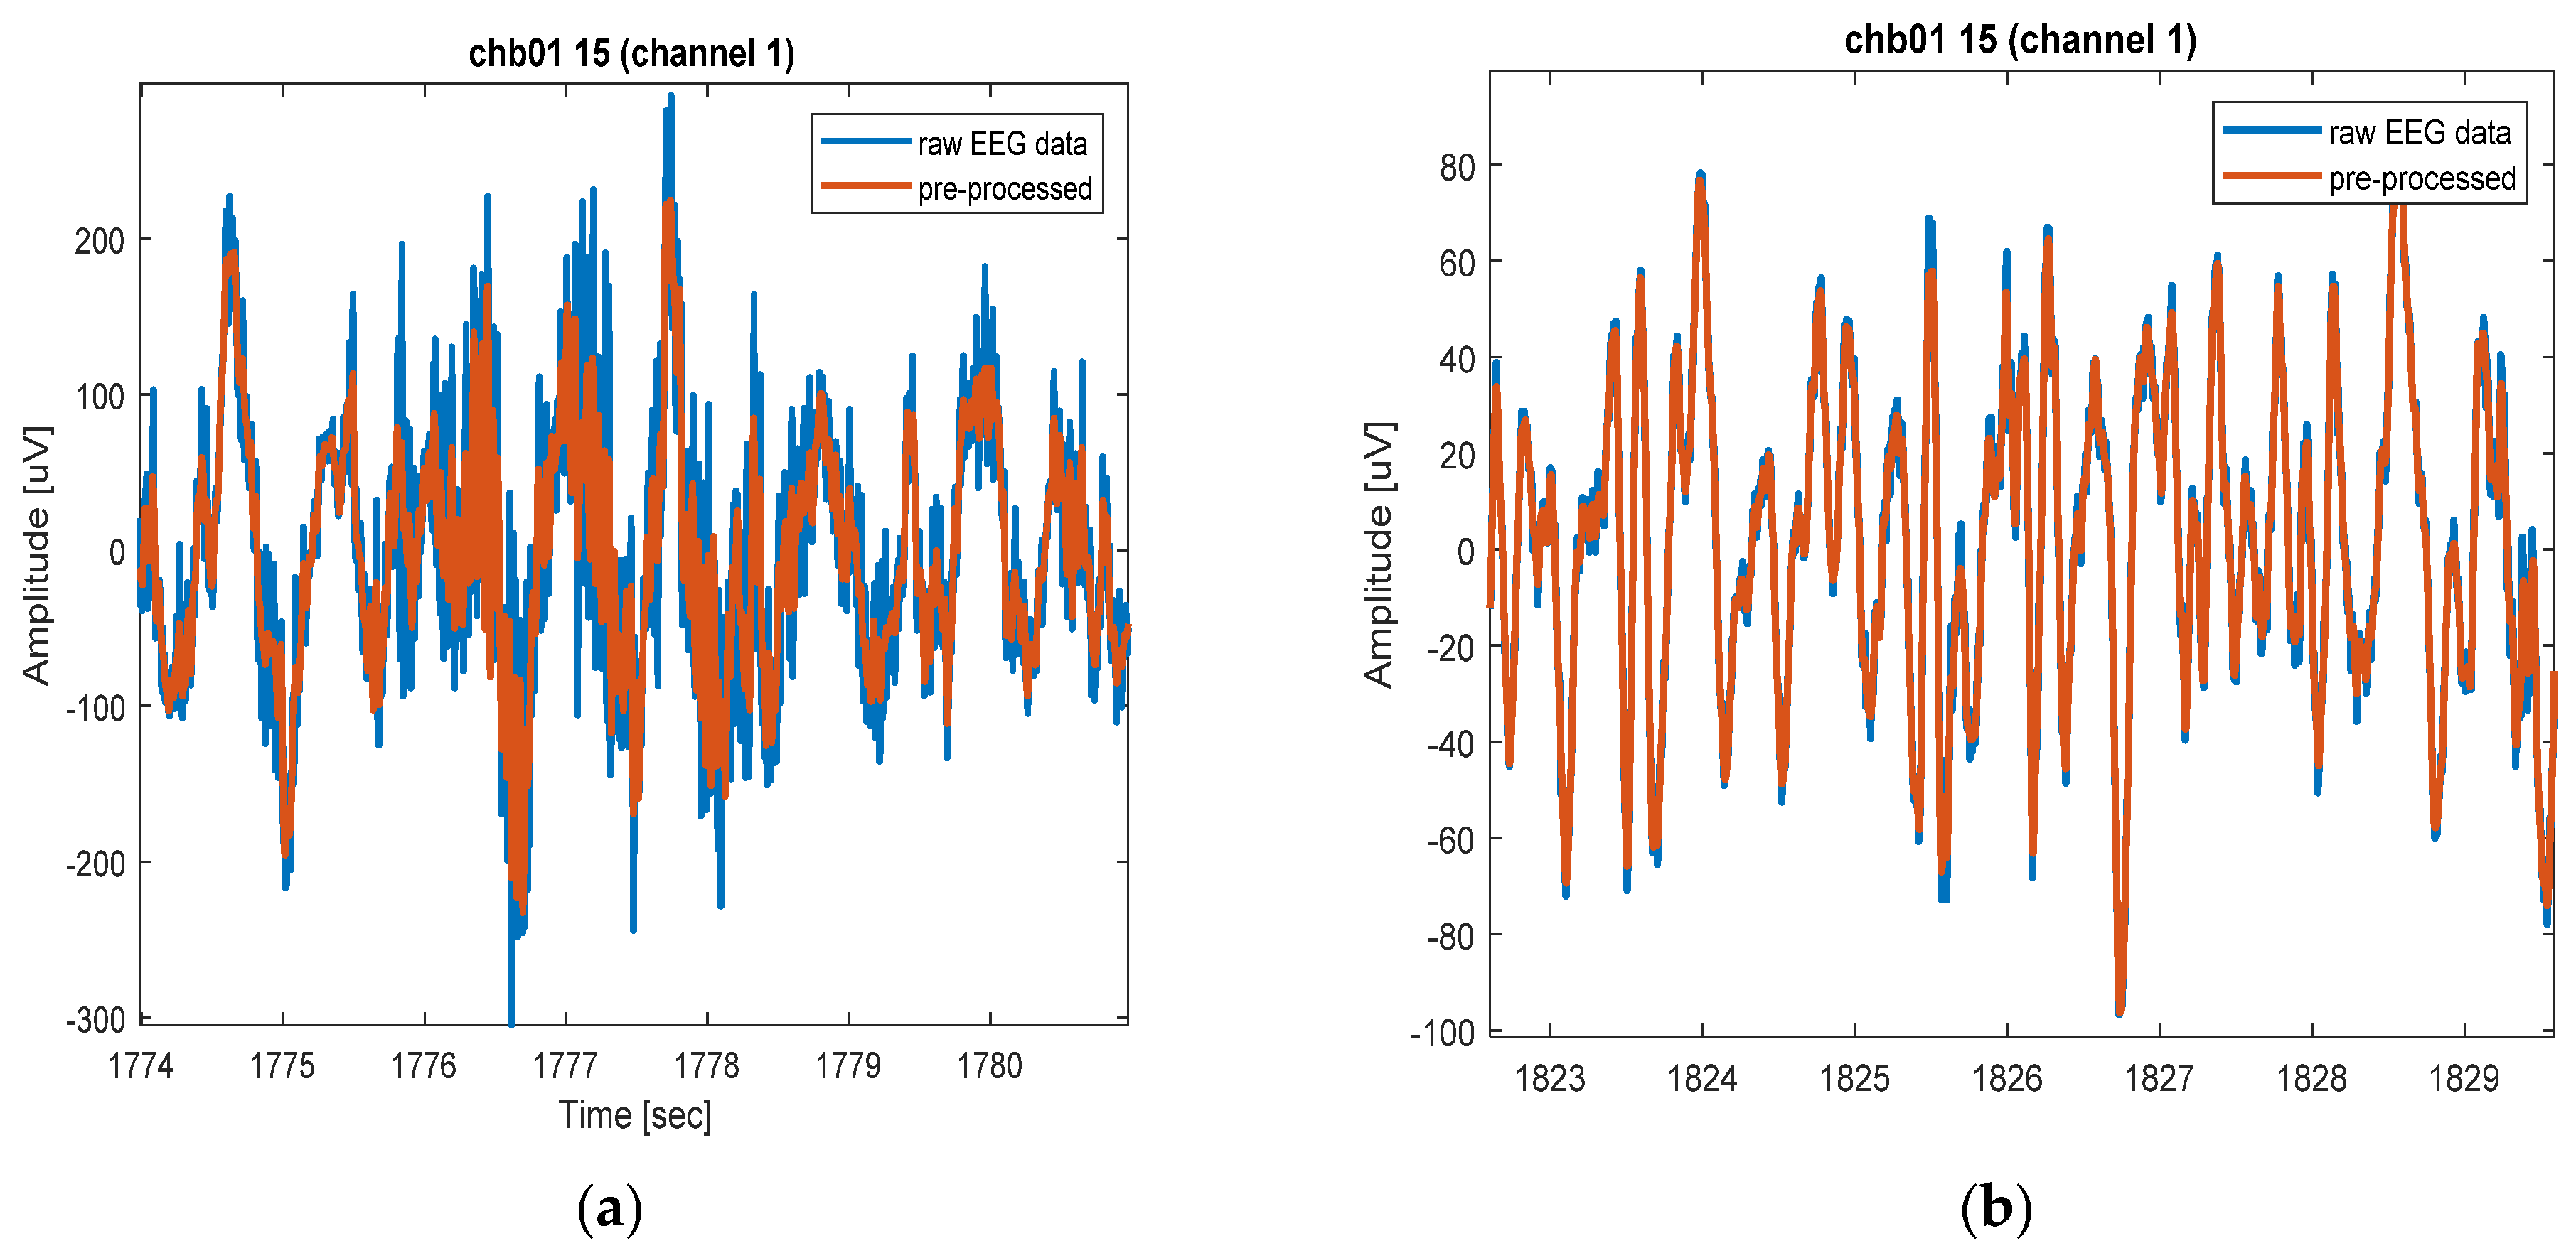
2.3. Preprocessing
2.4. The Feature Filter
2.5. Candidate Seizure Epochs Detection
2.6. Signal Masking
2.7. Process of Assisted Manual-Aided Seizure Annotation
3. Results and Discussion
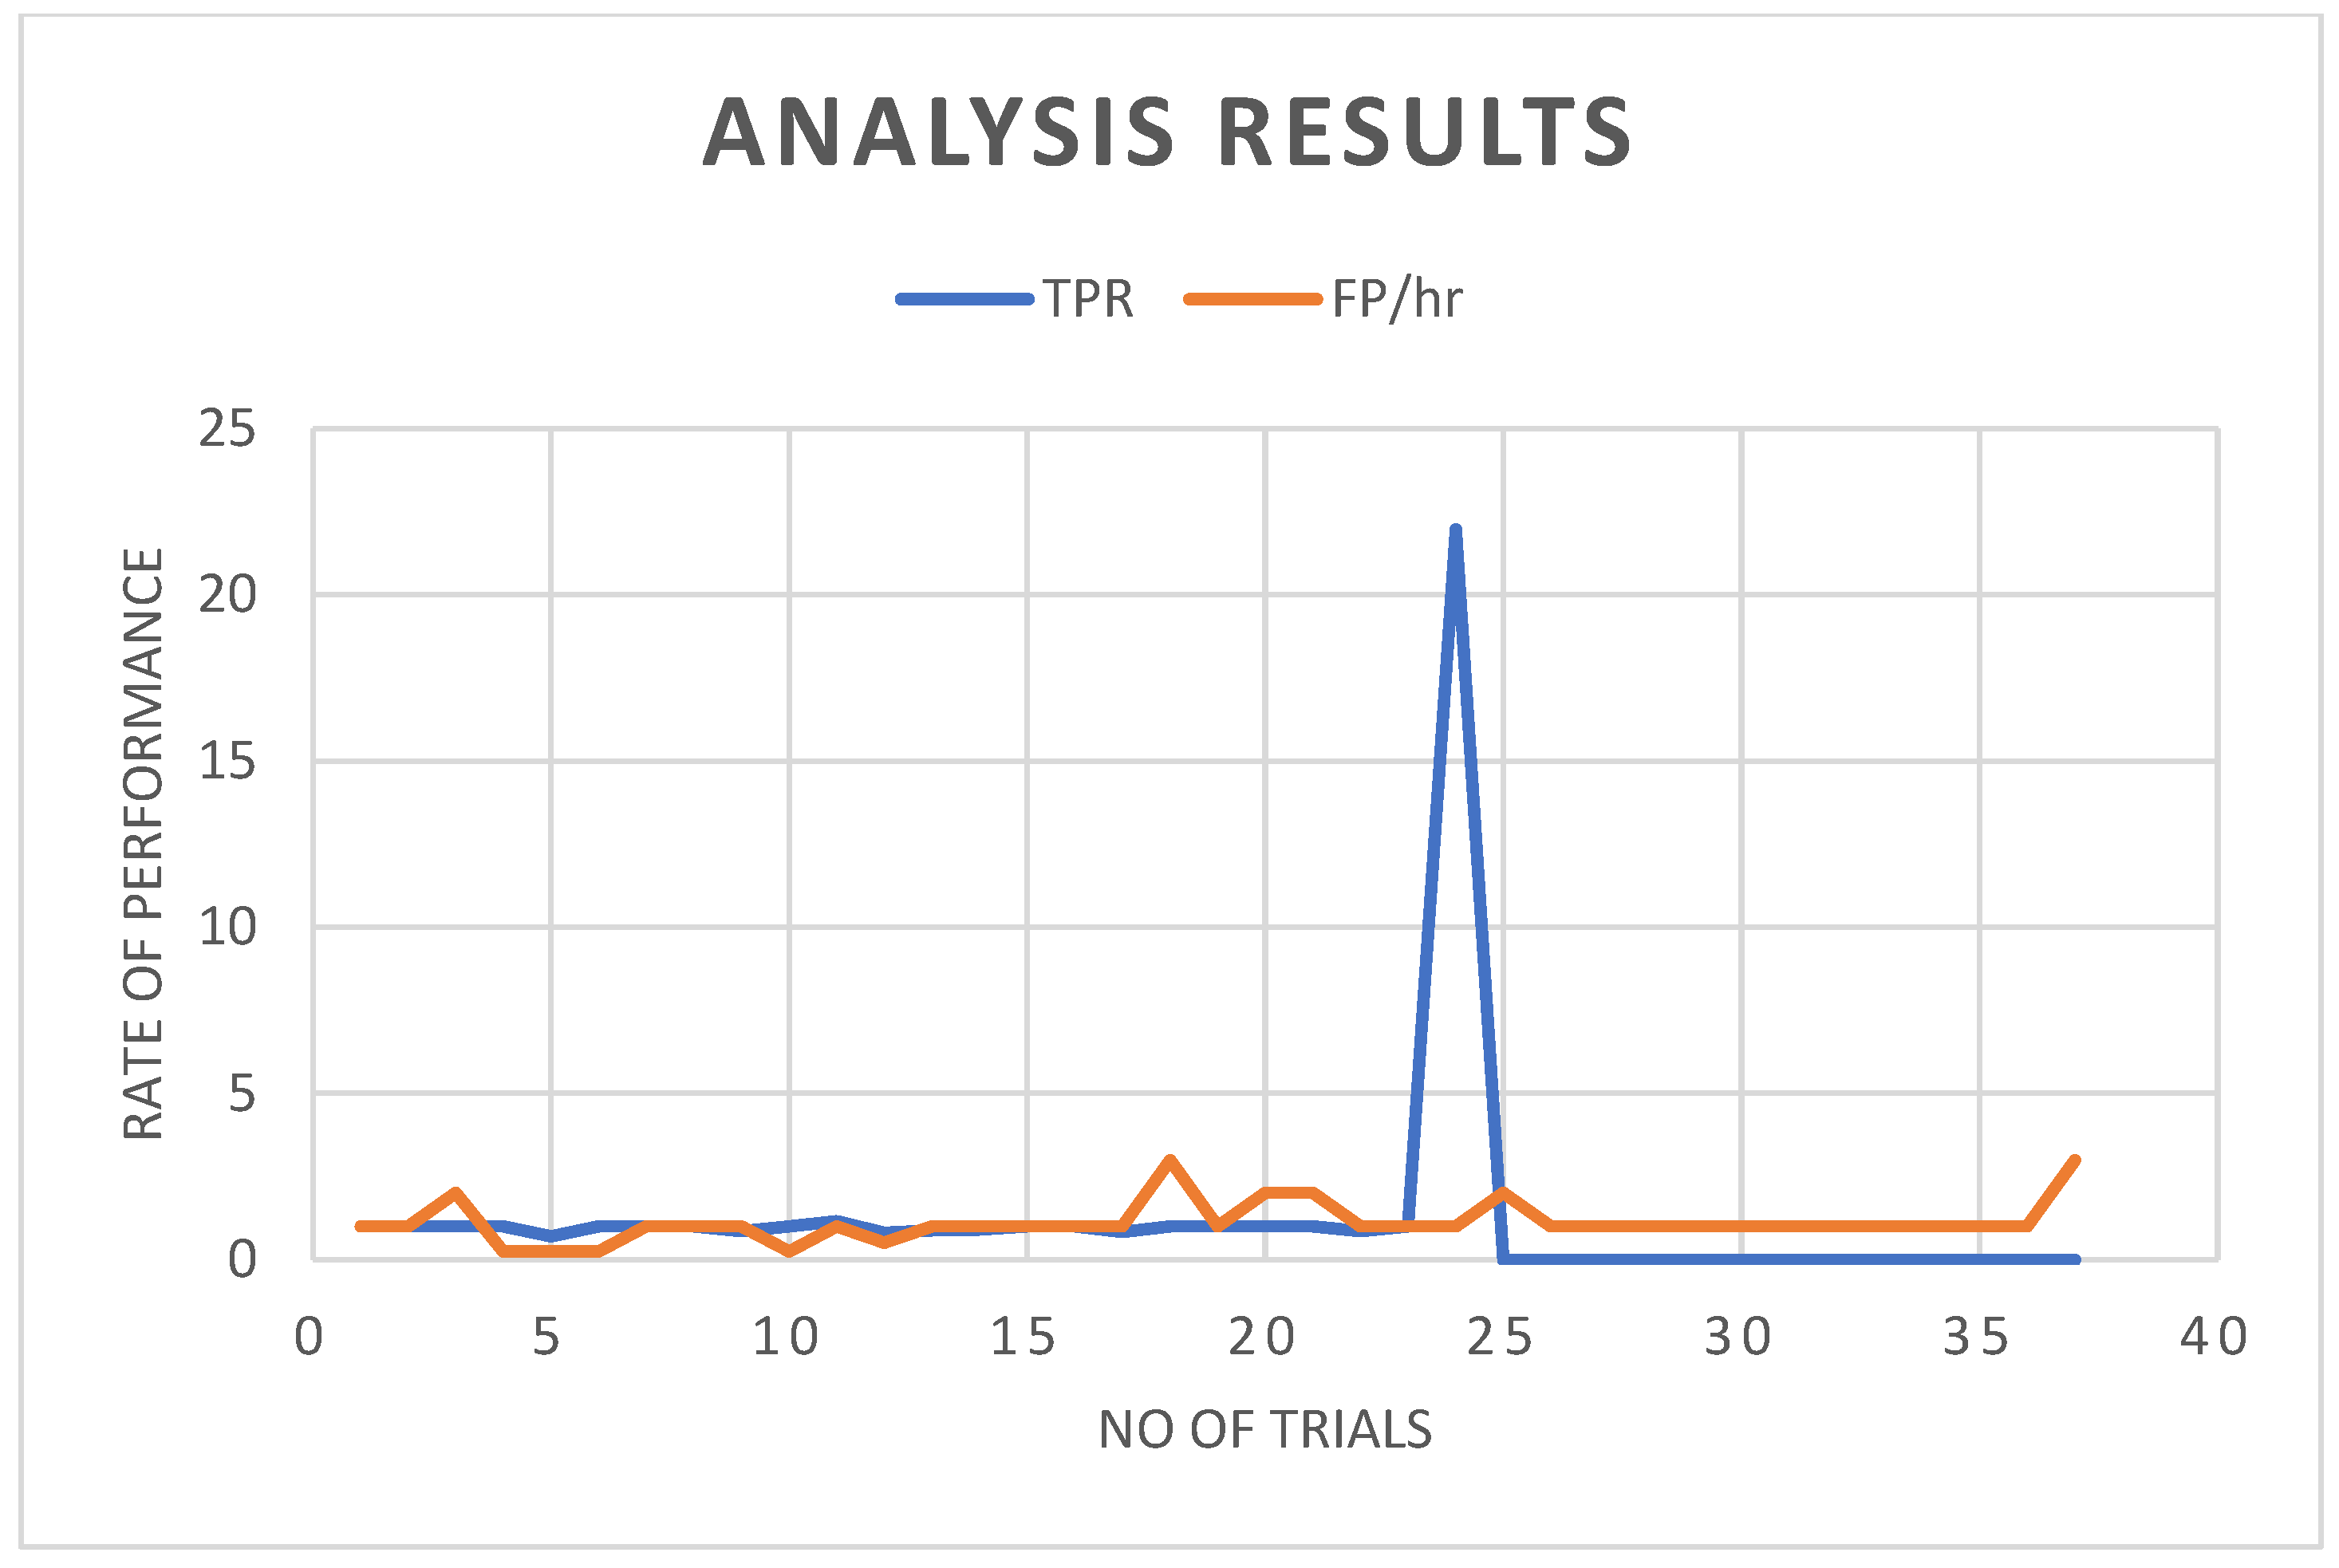
Performance Comparison: How It Differs from Existing Methods

| Author | Classifier | Sensitivity Percentage | False-Detection Rate |
|---|---|---|---|
| Shoeb [55] | SVM | 96% | 0.08/h |
| Samiee et al. [58] | SGD–SVM | 70.19% | - |
| Khan et al. [56] | LDA | 83.6% | - |
| Mansouri et al. [46] | PBI, DN, CN | 83% | 2.82/h |
| Zabihi et al. [59] | LDA | 88.27% | 3.04/h |
| Hunyadi et al. [62] | NNL | 81% | 0.11/h |
| Yuan et al. [57] | NNL | 93.85%, 91.72% | 0.35/h |
| Nasehi and Pourghassem [60] | ANN | 98% | 0.125/h |
| Supratak et al. [61] | SAE | 100% | - |
| Proposed Method (Manual/Automatic) | - | 93/88% | 0.04/h |
4. Conclusions
Supplementary Materials
Author Contributions
Funding
Institutional Review Board Statement
Informed Consent Statement
Data Availability Statement
Conflicts of Interest
References
- Engel, J., Jr.; Engel, J. Basic Mechanisms of Seizures and Epilepsy. In Seizures Epilepsy; Oxford University Press: Oxford, UK, 2013; pp. 99–156. [Google Scholar] [CrossRef]
- Post, R.M. Neurobiology of Seizures and Behavioral Abnormalities. Epilepsia 2004, 45, 5–14. [Google Scholar] [CrossRef] [PubMed]
- Hauser, W.A. Seizure Disorders: The Changes with Age. Epilepsia 1992, 33, 6–14. [Google Scholar] [CrossRef] [PubMed]
- Stafstrom, C.E.; Carmant, L. Carmant Seizures and epilepsy: An overview for neuroscientists. Cold Spring Harb. Perspect. Med. 2015, 5, a022426. [Google Scholar] [CrossRef] [PubMed]
- Zhou, M.; Tian, C.; Cao, R.; Wang, B.; Niu, Y.; Hu, T.; Guo, H.; Xiang, J. Epileptic Seizure Detection Based on EEG Signals and CNN. Front. Neuroinform. 2018, 12, 95. [Google Scholar] [CrossRef]
- Aldana, Y.R.; Hunyadi, B.; Reyes, E.J.M.; Rodríguez, V.R.; Van Huffel, S. Nonconvulsive Epileptic Seizure Detection in Scalp EEG Using Multiway Data Analysis. IEEE J. Biomed. Health Inform. 2019, 23, 660–671. [Google Scholar] [CrossRef]
- World Health Organisation. Epilepsy; World Health Organisation: Geneve, Switzerland, 2019. [Google Scholar]
- Epilepsy Action Australia. Facts and Statistics. Available online: https://www.epilepsy.org.au/about-epilepsy/facts-and-statistics/ (accessed on 10 January 2019).
- Mayo Clinic Staff. Epilepsy—Symptoms and Causes. Mayo Clinic. Available online: https://www.mayoclinic.org/diseases-conditions/epilepsy/symptoms-causes/syc-20350093 (accessed on 10 January 2019).
- Flannery, R.B.; Lomke, E. SUDEP and Grief: Overview and Current Issues. Psychiatr. Q. 2019, 90, 129–136. [Google Scholar] [CrossRef]
- Sharmila, A. Epilepsy detection from EEG signals: A review. J. Med. Eng. Technol. 2018, 42, 368–380. [Google Scholar] [CrossRef]
- Elger, C.E.; Hoppe, C. Diagnostic challenges in epilepsy: Seizure under-reporting and seizure detection. Lancet Neurol. 2018, 17, 279–288. [Google Scholar] [CrossRef]
- Paul, Y. Various epileptic seizure detection techniques using biomedical signals: A review. Brain Inform. 2018, 5, 6. [Google Scholar] [CrossRef]
- Yao, X.; Cheng, Q.; Zhang, G.-Q. Automated Classification of Seizures against Nonseizures: A Deep Learning Approach. arXiv 2019, arXiv:1906.02745. [Google Scholar]
- Gotman, J. Automatic recognition of epileptic seizures in the EEG. Electroencephalogr. Clin. Neurophysiol. 1982, 54, 530–540. [Google Scholar] [CrossRef]
- Li, M.; Sun, X.; Chen, W.; Jiang, Y.; Zhang, T. Classification epileptic seizures in EEG using time-frequency image and block texture features. IEEE Access 2020, 8, 9770–9781. [Google Scholar] [CrossRef]
- Sun, L.; Jin, B.; Yang, H.; Tong, J.; Liu, C.; Xiong, H. Unsupervised EEG feature extraction based on echo state network. Inf. Sci. 2019, 475, 1–17. [Google Scholar] [CrossRef]
- Srivastava, V.; Purwar, R.K. A Five-Level Wavelet Decomposition and Dimensional Reduction Approach for Feature Extraction and Classification of MR and CT Scan Images. Appl. Comput. Intell. Soft Comput. 2017, 2017, 9571262. [Google Scholar] [CrossRef]
- Vidyaratne, L.S.; Iftekharuddin, K.M. Real-Time Epileptic Seizure Detection Using EEG. IEEE Trans. Neural Syst. Rehabil. Eng. 2017, 25, 2146–2156. [Google Scholar] [CrossRef]
- Gu, Z.; Yan, G.; Zhang, J.; Li, Y.; Yu, Z.L. Automatic Epilepsy Detection Based on Wavelets Constructed from Data. IEEE Access 2018, 6, 53133–53140. [Google Scholar] [CrossRef]
- Yuan, Q.; Zhou, W.; Zhang, L.; Zhang, F.; Xu, F.; Leng, Y.; Wei, D.; Chen, M. Epileptic seizure detection based on imbalanced classification and wavelet packet transform. Seizure 2017, 50, 99–108. [Google Scholar] [CrossRef]
- Bhattacharyya, A.; Pachori, R.B. A Multivariate Approach for Patient-Specific EEG Seizure Detection Using Empirical Wavelet Transform. IEEE Trans. Biomed. Eng. 2017, 64, 2003–2015. [Google Scholar] [CrossRef]
- Quintero-Rincón, A.; Flugelman, M.; Prendes, J.; D’giano, C. Study on epileptic seizure detection in EEG signals using largest Lyapunov exponents and logistic regression. Rev. Argent. Bioingeniería 2019, 23, 2019. [Google Scholar]
- Mohammadpoory, Z.; Nasrolahzadeh, M.; Haddadnia, J. Epileptic seizure detection in EEGs signals based on the weighted visibility graph entropy. Seizure 2017, 50, 202–208. [Google Scholar] [CrossRef]
- Al-qazzaz, N.K.; Hamid, S.; Ali, B.; Ahmad, S.A.; Chellappan, K.; Islam, S.; Escudero, J. Role of EEG as biomarker in the early detection and classification of dementia.—PubMed—NCBI. Sci. World J. 2014, 2014, 906038. [Google Scholar] [CrossRef] [PubMed]
- Wang, D.; Ren, D.; Li, K.; Feng, Y.; Ma, D.; Yan, X.; Wang, G. Epileptic seizure detection in long-term EEG recordings by using wavelet-based directed transfer function. IEEE Trans. Biomed. Eng. 2018, 65, 2591–2599. [Google Scholar] [CrossRef] [PubMed]
- Wu, M.; Wan, T.; Ding, M.; Wan, X.; Du, Y.; She, J. A New Unsupervised Detector of High-Frequency Oscillations in Accurate Localization of Epileptic Seizure Onset Zones. IEEE Trans. Neural Syst. Rehabil. Eng. 2018, 26, 2280–2289. [Google Scholar] [CrossRef] [PubMed]
- Kumar, N.; Alam, K.; Hasan Siddiqi, A. Wavelet Transform for Classification of EEG Signal using SVM and ANN. Biomed. Pharmacol. J. 2017, 10, 2061–2069. [Google Scholar] [CrossRef]
- Hussain, W.; Iqbal, M.S.; Xiang, J.; Wang, B.; Niu, Y.; Gao, Y.; Wang, X.; Sun, J.; Zhan, Q.; Cao, R.; et al. Epileptic Seizure Detection with Permutation Fuzzy Entropy Using Robust Machine Learning Techniques. IEEE Access 2019, 7, 182238–182258. [Google Scholar] [CrossRef]
- Fraiwan, L.; Alkhodari, M. Classification of Focal and Non-Focal Epileptic Patients Using Single Channel EEG and Long Short-Term Memory Learning System. IEEE Access 2020, 8, 77255–77262. [Google Scholar] [CrossRef]
- Karoly, P.J.; Freestone, D.R.; Boston, R.; Grayden, D.B.; Himes, D.; Leyde, K.; Seneviratne, U.; Berkovic, S.; O’Brien, T.; Cook, M.J. Interictal spikes and epileptic seizures: Their relationship and underlying rhythmicity. Brain 2016, 139, 1066–1078. [Google Scholar] [CrossRef] [PubMed]
- Siddiqui, M.K.; Morales-Menendez, R.; Huang, X.; Hussain, N. A review of epileptic seizure detection using machine learning classifiers. Brain Inform. 2020, 7, 5. [Google Scholar] [CrossRef]
- Ulate-Campos, A.; Coughlin, F.; Gaínza-Lein, M.; Fernández, I.S.; Pearl, P.L.; Loddenkemper, T. Automated seizure detection systems and their effectiveness for each type of seizure. Seizure 2016, 40, 88–101. [Google Scholar] [CrossRef]
- Abd El-Samie, F.E.; Alotaiby, T.N.; Khalid, M.I.; Alshebeili, S.A.; Aldosari, S.A. A Review of EEG and MEG Epileptic Spike Detection Algorithms. IEEE Access 2018, 6, 60673–60688. [Google Scholar] [CrossRef]
- Rasheed, K.; Qayyum, A.; Qadir, J.; Sivathamboo, S.; Kwan, P.; Kuhlmann, L.; O’Brien, T.; Razi, A. Machine learning for predicting epileptic seizures using EEG signals: A review. arXiv 2020, 14, 139–155. [Google Scholar] [CrossRef] [PubMed]
- Pan, J.; Tompkins, W.J. A Real-Time QRS Detection Algorithm. IEEE Trans. Biomed. Eng. 1985, BME-32, 230–236. [Google Scholar] [CrossRef] [PubMed]
- Bruns, N.; Blumenthal, S.; Meyer, I.; Klose-Verschuur, S.; Felderhoff-Müser, U.; Müller, H. Application of an amplitude-integrated EEG monitor (cerebral function monitor) to neonates. J. Vis. Exp. 2017, 2017, 1–9. [Google Scholar] [CrossRef] [PubMed]
- Mardini, W.; Bani Yassein, M.M.; Al-Rawashdeh, R.; Aljawarneh, S.; Khamayseh, Y.; Meqdadi, O. Enhanced detection of epileptic seizure using EEG signals in combination with machine learning classifiers. IEEE Access 2020, 8, 24046–24055. [Google Scholar] [CrossRef]
- Zhao, X.; Zhang, R.; Mei, Z.; Chen, C.; Chen, W. Identification of epileptic seizures by characterizing instantaneous energy behavior of EEG. IEEE Access 2019, 7, 70059–70076. [Google Scholar] [CrossRef]
- Shoeibi, A.; Khodatars, M.; Ghassemi, N.; Jafari, M.; Moridian, P.; Alizadehsani, R.; Panahiazar, M.; Khozeimeh, F.; Zare, A.; Hosseini-Nejad, H.; et al. Epileptic seizures detection using deep learning techniques: A review. Int. J. Environ. Res. Public Health 2021, 18, 5780. [Google Scholar] [CrossRef]
- Goldberger, A.L.; Amaral, L.A.N.; Glass, L.; Hausdorff, J.M.; Ivanov, P.C.; Mark, R.G.; Mietus, J.E.; Moody, G.B.; Peng, C.-K.; Stanley, H.E. PhysioBank, PhysioToolkit, and PhysioNet: Components of a New Research Resource for Complex Physiologic Signals. Circulation 2000, 101, e215–e220. [Google Scholar] [CrossRef]
- Song, J.L.; Zhang, R. Application of extreme learning machine to epileptic seizure detection based on lagged Poincaŕe plots. Multidimens. Syst. Signal Process. 2017, 28, 945–959. [Google Scholar] [CrossRef]
- Sumsky, S.L.; Santaniello, S. Decision Support System for Seizure Onset Zone Localization Based on Channel Ranking and High-Frequency EEG Activity. IEEE J. Biomed. Health Inform. 2019, 23, 1535–1545. [Google Scholar] [CrossRef]
- Charupanit, K.; Lopour, B.A. A Simple Statistical Method for the Automatic Detection of Ripples in Human Intracranial EEG. Brain Topogr. 2017, 30, 724–738. [Google Scholar] [CrossRef]
- Ullah, I.; Hussain, M.; Qazi, E.; Aboalsamh, H. An Automated System for Epilepsy Detection using EEG Brain Signals based on Deep Learning Approach Insight Centre for Data Analytics, National University of Ireland, Galway, Ireland Visual Computing Lab, Department of Computer Science, College of Com. Expert Syst. Appl. 2018, 107, 61–71. [Google Scholar] [CrossRef]
- Mansouri, A.; Singh, S.P.; Sayood, K. Online EEG seizure detection and localization. Algorithms 2019, 12, 176. [Google Scholar] [CrossRef]
- Angus Wilfong Seizures and Epilepsy in Children: Classification, Etiology, and Clinical Features—UpToDate. Available online: https://www.uptodate.com/contents/seizures-and-epilepsy-in-children-classification-etiology-and-clinical-features (accessed on 10 January 2019).
- Van Esbroeck, A.; Smith, L.; Syed, Z.; Singh, S.; Karam, Z. Multi-task seizure detection: Addressing intra-patient variation in seizure morphologies. Mach. Learn. 2016, 102, 309–321. [Google Scholar] [CrossRef]
- Romney, A.; Manian, V. Comparison of frontal-temporal channels in epilepsy seizure prediction based on EEMD-reliefF and DNN. Computers 2020, 9, 78. [Google Scholar] [CrossRef]
- Li, Y.; Wang, X.D.; Luo, M.L.; Li, K.; Yang, X.F.; Guo, Q. Epileptic Seizure Classification of EEGs Using Time-Frequency Analysis Based Multiscale Radial Basis Functions. IEEE J. Biomed. Health Inform. 2018, 22, 386–397. [Google Scholar] [CrossRef]
- Rabcan, J.; Levashenko, V.; Zaitseva, E.; Kvassay, M. Review of Methods for EEG Signal Classification and Development of New Fuzzy Classification-Based Approach. IEEE Access 2020, 8, 189720–189734. [Google Scholar] [CrossRef]
- Radman, M.; Moradi, M.; Chaibakhsh, A.; Kordestani, M.; Saif, M. Multi-Feature Fusion Approach for Epileptic Seizure Detection from EEG Signals. IEEE Sens. J. 2021, 21, 3533–3543. [Google Scholar] [CrossRef]
- Shoeb, A.; Edwards, H.; Connolly, J.; Bourgeois, B.; Ted Treves, S.; Guttag, J. Patient-specific seizure onset detection. Epilepsy Behav. 2004, 5, 483–498. [Google Scholar] [CrossRef]
- Cashero, Z. Comparison of EEG Preprocessing Methods to Improve Classification of P300 Trials. Master’s Thesis, Colorado State University, Fort Collins, CO, USA, 2011. [Google Scholar]
- Shoeb, A. Application of Machine Learning to Epileptic Seizure Onset Detection and Treatment. Ph.D. Thesis, Massachusetts Institute of Technology, Cambridge, MA, USA, 2009. [Google Scholar]
- Khan, Y.U.; Rafiuddin, N.; Farooq, O. Automated seizure detection in scalp EEG using multiple wavelet scales. In Proceedings of the 2012 IEEE International Conference on Signal Processing, Computing and Control, Solan, India, 15–17 March 2012; pp. 1–5. [Google Scholar] [CrossRef]
- Yuan, Q.; Zhou, W.; Liu, Y.; Wang, J. Epileptic seizure detection with linear and nonlinear features. Epilepsy Behav. 2012, 24, 415–421. [Google Scholar] [CrossRef]
- Samiee, K.; Kiranyaz, S.; Gabbouj, M.; Saramäki, T. Long-term epileptic EEG classification via 2D mapping and textural features. Expert Syst. Appl. 2015, 42, 7175–7185. [Google Scholar] [CrossRef]
- Zabihi, M.; Kiranyaz, S.; Rad, A.B.; Katsaggelos, A.K.; Gabbouj, M.; Ince, T. Analysis of High-Dimensional Phase Space via Poincaré Section for Patient-Specific Seizure Detection. IEEE Trans. Neural Syst. Rehabil. Eng. 2016, 24, 386–398. [Google Scholar] [CrossRef] [PubMed]
- Nasehi, S.; Pourghassem, H. Patient-specific epileptic seizure onset detection algorithm based on spectral features and IPSONN classifier. In Proceedings of the 2013 International Conference on Communication Systems and Network Technologies, Gwalior, India, 6–8 April 2013; pp. 186–190. [Google Scholar] [CrossRef]
- Supratak, A.; Li, L.; Guo, Y. Feature extraction with stacked autoencoders for epileptic seizure detection. In Proceedings of the 2014 36th Annual International Conference of the IEEE Engineering in Medicine and Biology Society, Chicago, IL, USA, 26–30 August 2014; pp. 4184–4187. [Google Scholar] [CrossRef]
- Hunyadi, B.; Signoretto, M.; Van Paesschen, W.; Suykens, J.A.K.; Van Huffel, S.; De Vos, M. Incorporating structural information from the multichannel EEG improves patient-specific seizure detection. Clin. Neurophysiol. 2012, 123, 2352–2361. [Google Scholar] [CrossRef] [PubMed]


| Patient | Age/Gender | No. of EEG Tests | No. of Seizures Annotated |
|---|---|---|---|
| chb01 | 11/F | 42 | 7 |
| chb02 | 11/M | 36 | 3 |
| chb03 | 14/F | 38 | 7 |
| chb04 | 22/M | 42 | 4 |
| chb05 | 7/F | 39 | 5 |
| chb06 | 1.5/F | 18 | 10 |
| chb07 | 15/F | 19 | 3 |
| chb08 | 3.5/M | 20 | 5 |
| chb09 | 10/F | 19 | 4 |
| chb10 | 3/M | 25 | 7 |
| chb11 | 12/F | 35 | 3 |
| chb12 | 2/F | 24 | 40 |
| chb13 | 3/F | 33 | 12 |
| chb14 | 9/F | 26 | 8 |
| chb15 | 16/M | 40 | 20 |
| chb16 | 7/F | 19 | 10 |
| chb17 | 12/F | 21 | 3 |
| chb18 | 18/F | 36 | 6 |
| chb19 | 19/F | 30 | 3 |
| chb20 | 6/F | 28 | 8 |
| chb21 | 13/F | 33 | 4 |
| chb22 | 9/F | 30 | 3 |
| chb23 | 6/F | 9 | 7 |
| chb24 | NA | 22 | 16 |
| Patient | Age | Gender | No. of Seizures Annotated | Seizures Annotated | Seizures Detected | Result | Duration of Seizure |
|---|---|---|---|---|---|---|---|
| 1 | 11 | F | 7 | chb01_03.edf | chb01_03.edf | TP | 3000–3040 |
| chb01_04.edf | chb01_04.edf | TP | 1467–1510 | ||||
| chb01_15.edf | chb01_15.edf | TP | 1730–1772 | ||||
| chb01_16.edf | chb01_16.edf | TP | 1015–1071 | ||||
| chb01_18.edf | chb01_18.edf | TP | 1720–1812 | ||||
| chb01_21.edf | chb01_21.edf | TP | 326–421 | ||||
| chb01_26.edf | chb01_26.edf | TP | 1862–1970 |
| Patient Age/Gender | No. of Trials | No. of Correct Seizure Detections (TPs) | No. of False Positives (FPs) | No. of False Negatives (FNs) | No. of Correct Non-Seizure Detections (TNs) | Sensitivity = TP/(TP + FN) | Specificity = TN/(TN + FP) | Precision = TP/(TP + FP) | Accuracy = (TP+TN)/(TP + TN + FP + FN) | F_M = (2 × Precision × Sensitivity)/(Precision + Sensitivity) | G_M = √(Sensitivity × Specificity) | |
|---|---|---|---|---|---|---|---|---|---|---|---|---|
| 1 | 11/F | 42 | 7 | 0 | 0 | 49 | 100.00 | 100.00 | 100.00 | 100.00 | 100.00 | 100.00 |
| 2 | 11/M | 36 | 3 | 2 | 0 | 41 | 100.00 | 95.35 | 60.00 | 95.65 | 75.00 | 97.65 |
| 3 | 14/F | 38 | 7 | 2 | 0 | 47 | 100.00 | 95.92 | 77.78 | 96.43 | 87.50 | 97.94 |
| 4 | 22/M | 42 | 4 | 3 | 0 | 49 | 100.00 | 94.23 | 57.14 | 94.64 | 72.73 | 97.07 |
| 5 | 7/F | 39 | 5 | 3 | 0 | 47 | 100.00 | 94.00 | 62.50 | 94.55 | 76.92 | 96.95 |
| 6 | 1.5/F | 18 | 7 | 1 | 3 | 26 | 70.00 | 96.30 | 87.50 | 89.19 | 77.78 | 82.10 |
| 7 | 15/F | 19 | 3 | 3 | 0 | 14 | 100.00 | 82.35 | 50.00 | 85.00 | 66.67 | 90.75 |
| 8 | 3.5/M | 20 | 5 | 0 | 0 | 15 | 100.00 | 100.00 | 100.00 | 100.00 | 100.00 | 100.00 |
| 9 | 10/F | 19 | 4 | 0 | 0 | 23 | 100.00 | 100.00 | 100.00 | 100.00 | 100.00 | 100.00 |
| 10 | 3/M | 25 | 6 | 0 | 1 | 31 | 85.71 | 100.00 | 100.00 | 97.37 | 92.31 | 92.58 |
| 11 | 12/F | 35 | 3 | 2 | 0 | 40 | 100.00 | 95.24 | 60.00 | 95.56 | 75.00 | 97.59 |
| 12 | 2/F | 24 | 31 | 6 | 9 | 61 | 77.50 | 91.04 | 83.78 | 85.98 | 80.52 | 84.00 |
| 13 | 3/F | 33 | 8 | 8 | 4 | 48 | 66.67 | 85.71 | 50.00 | 82.35 | 57.14 | 75.59 |
| 14 | 9/F | 26 | 7 | 2 | 1 | 35 | 87.50 | 94.59 | 77.78 | 93.33 | 82.35 | 90.98 |
| 15 | 16/M | 36 | 18 | 6 | 1 | 64 | 94.74 | 91.43 | 75.00 | 92.13 | 83.72 | 93.07 |
| 16 | 7/F | 20 | 8 | 1 | 2 | 28 | 80.00 | 96.55 | 88.89 | 92.31 | 84.21 | 87.89 |
| 17 | 12/F | 23 | 3 | 0 | 0 | 24 | 100.00 | 100.00 | 100.00 | 100.00 | 100.00 | 100.00 |
| 18 | 18/F | 36 | 5 | 2 | 1 | 44 | 83.33 | 95.65 | 71.43 | 94.23 | 76.92 | 89.28 |
| 19 | 19/F | 30 | 3 | 0 | 0 | 33 | 100.00 | 100.00 | 100.00 | 100.00 | 100.00 | 100.00 |
| 20 | 6/F | 28 | 8 | 0 | 0 | 38 | 100.00 | 100.00 | 100.00 | 100.00 | 100.00 | 100.00 |
| 21 | 13/F | 33 | 4 | 1 | 0 | 38 | 100.00 | 97.44 | 80.00 | 97.67 | 88.89 | 98.71 |
| 22 | 9/F | 30 | 3 | 0 | 0 | 33 | 100.00 | 100.00 | 100.00 | 100.00 | 100.00 | 100.00 |
| 23 | 6/F | 9 | 6 | 0 | 1 | 16 | 85.71 | 100.00 | 100.00 | 95.65 | 92.31 | 92.58 |
| 24 | - | 22 | 16 | 4 | 0 | 42 | 100.00 | 91.30 | 80.00 | 93.55 | 88.89 | 95.55 |
| Patient | Seizure Location |
|---|---|
| chb01 | Frontal |
| chb02 | Temporal |
| chb03 | Frontal |
| chb04 | Temporal |
| chb05 | Frontal |
| chb06 | T/Occi |
| chb07 | Temporal |
| chb08 | Frontal |
| chb09 | T/Occi |
| chb10 | Temporal |
| chb11 | Temporal |
| chb12 | Temporal |
| chb13 | T/Occi |
| chb14 | Frontal |
| chb15 | Temporal |
| chb16 | Temporal |
| chb17 | Temporal |
| chb18 | Frontal |
| chb19 | Frontal |
| chb20 | Temporal |
| chb21 | Temporal |
| chb22 | Temporal |
| chb23 | Temporal |
| chb24 | Temporal |
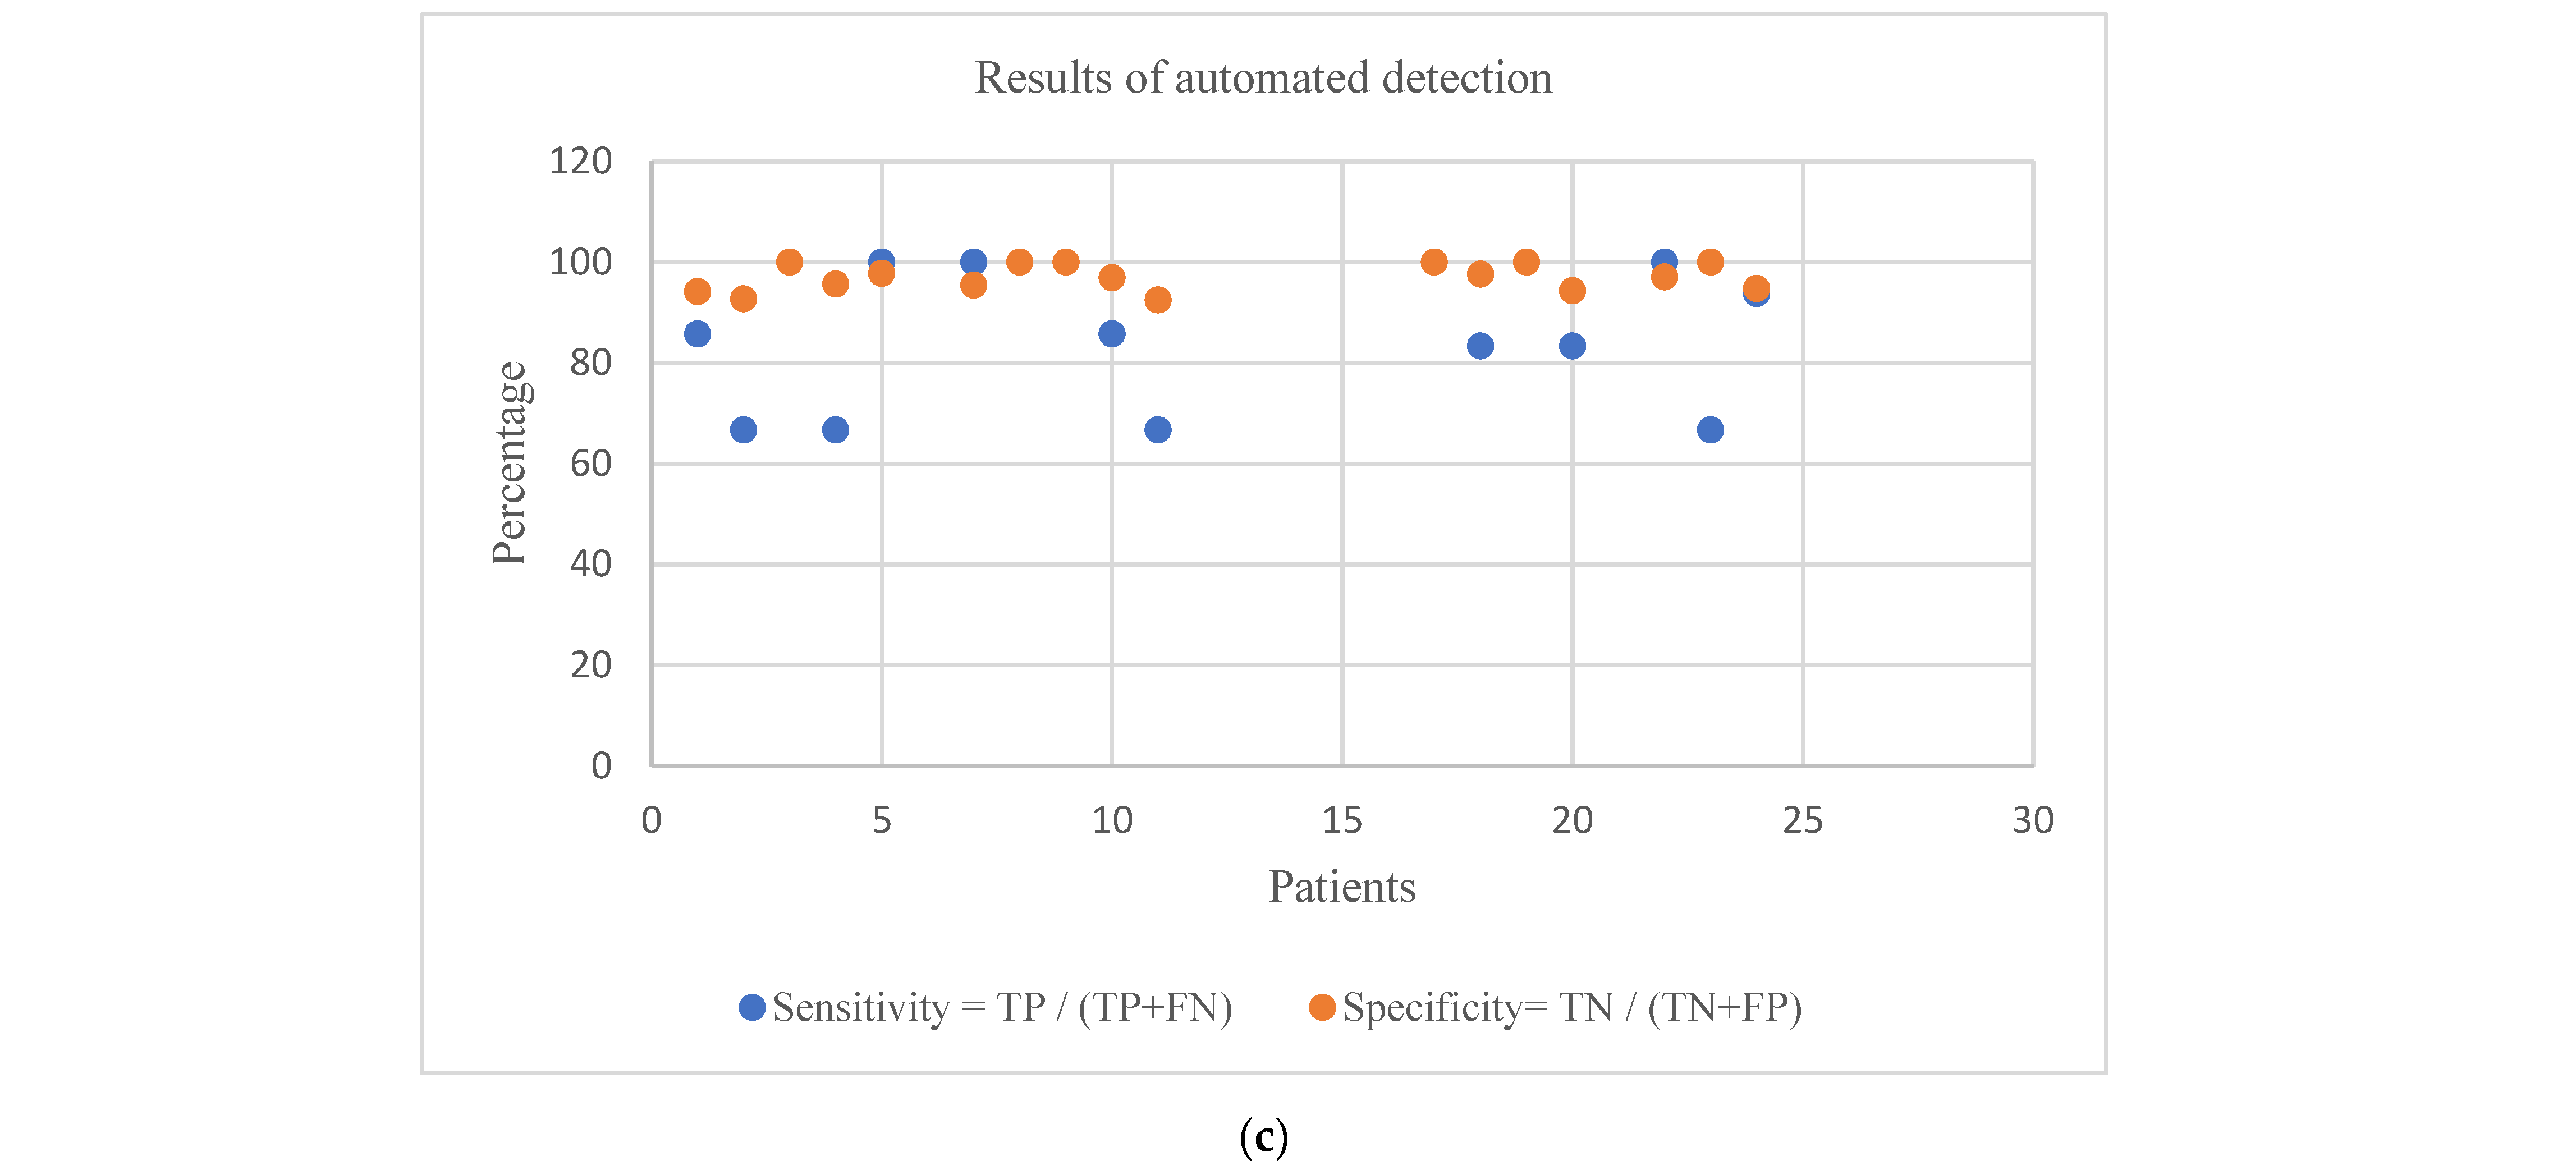
| Patient Age/Gender | No. of Trials | No. of Correct Seizure Detections (TPs) | No. of Correct Non-Seizure Detections (TNs) | No. of False Positives (FPs) | No. of False Negative (FNs) | Sensitivity = TP/(TP+FN) | Specificity = TN/(TN+FP) | |
|---|---|---|---|---|---|---|---|---|
| 1 | 11/F | 42 | 6 | 48 | 3 | 1 | 85.71 | 94.12 |
| 2 | 11/M | 36 | 2 | 38 | 3 | 1 | 66.67 | 92.68 |
| 3 | 14/F | 38 | 7 | 45 | 0 | 0 | 100.00 | 100.00 |
| 4 | 22/M | 42 | 2 | 44 | 2 | 1 | 66.67 | 95.65 |
| 5 | 7/F | 39 | 5 | 44 | 1 | 0 | 100.00 | 97.78 |
| 7 | 15/F | 19 | 3 | 21 | 1 | 0 | 100.00 | 95.45 |
| 8 | 3.5/M | 20 | 5 | 25 | 0 | 0 | 100.00 | 100.00 |
| 9 | 10/F | 19 | 3 | 22 | 0 | 0 | 100.00 | 100.00 |
| 10 | 3/M | 25 | 6 | 31 | 1 | 1 | 85.71 | 96.88 |
| 11 | 12/F | 35 | 2 | 37 | 3 | 1 | 66.67 | 92.50 |
| 17 | 12/F | 23 | 3 | 26 | 0 | 0 | 100.00 | 100.00 |
| 18 | 18/F | 36 | 5 | 41 | 1 | 1 | 83.33 | 97.62 |
| 19 | 19/F | 30 | 3 | 33 | 0 | 0 | 100.00 | 100.00 |
| 20 | 6/F | 28 | 5 | 33 | 2 | 1 | 83.33 | 94.29 |
| 22 | 9/F | 30 | 3 | 33 | 1 | 0 | 100.00 | 97.06 |
| 23 | 6/F | 9 | 2 | 11 | 0 | 1 | 66.67 | 100.00 |
| 24 | NA | 22 | 15 | 36 | 2 | 1 | 93.75 | 94.74 |
Publisher’s Note: MDPI stays neutral with regard to jurisdictional claims in published maps and institutional affiliations. |
© 2022 by the authors. Licensee MDPI, Basel, Switzerland. This article is an open access article distributed under the terms and conditions of the Creative Commons Attribution (CC BY) license (https://creativecommons.org/licenses/by/4.0/).
Share and Cite
Sreenivasan, N.; Gargiulo, G.D.; Gunawardana, U.; Naik, G.; Nikpour, A. Seizure Detection: A Low Computational Effective Approach without Classification Methods. Sensors 2022, 22, 8444. https://doi.org/10.3390/s22218444
Sreenivasan N, Gargiulo GD, Gunawardana U, Naik G, Nikpour A. Seizure Detection: A Low Computational Effective Approach without Classification Methods. Sensors. 2022; 22(21):8444. https://doi.org/10.3390/s22218444
Chicago/Turabian StyleSreenivasan, Neethu, Gaetano D. Gargiulo, Upul Gunawardana, Ganesh Naik, and Armin Nikpour. 2022. "Seizure Detection: A Low Computational Effective Approach without Classification Methods" Sensors 22, no. 21: 8444. https://doi.org/10.3390/s22218444
APA StyleSreenivasan, N., Gargiulo, G. D., Gunawardana, U., Naik, G., & Nikpour, A. (2022). Seizure Detection: A Low Computational Effective Approach without Classification Methods. Sensors, 22(21), 8444. https://doi.org/10.3390/s22218444