
Stress-Adaptive Training: An Adaptive Psychomotor Training According to Stress Measured by Grip Force


Abstract
1. Introduction
“Natural Selection acts by the simple preservation of those individuals which are best adapted to the complex contingencies to which all are related.”Charles Darwin [1].
2. Materials and Methods
2.1. Participants
2.2. Ethical Committee
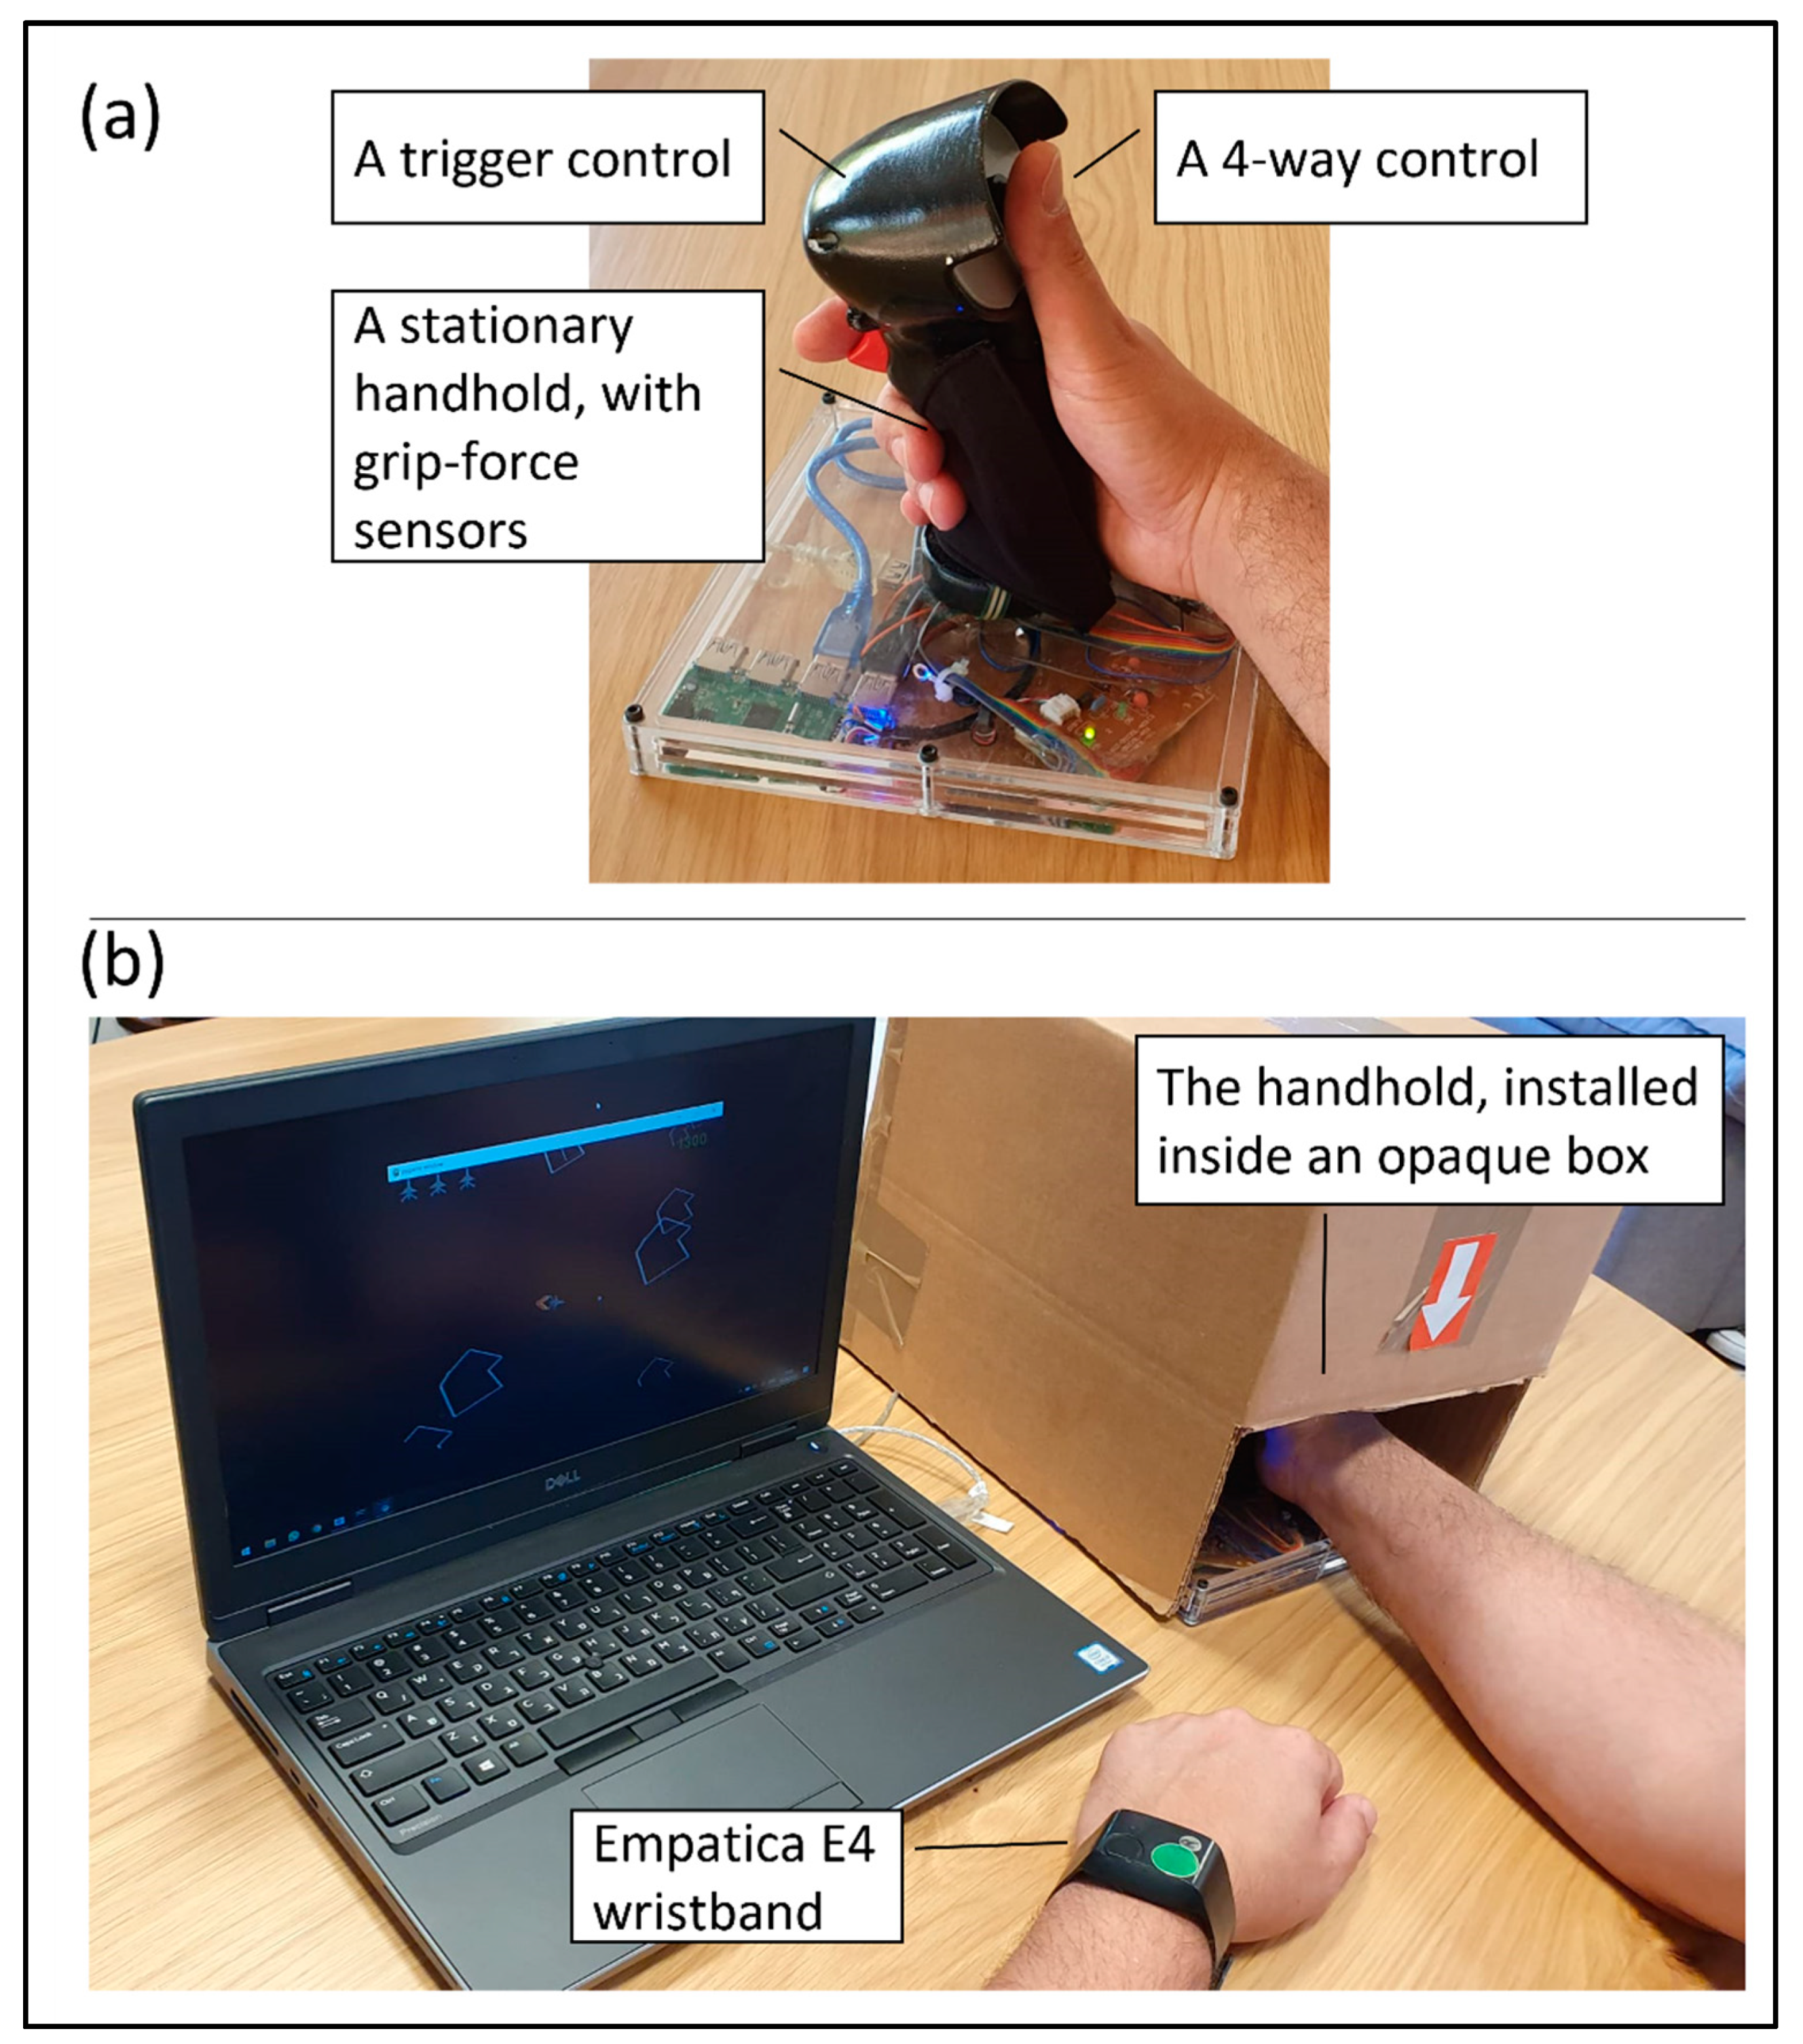
2.3. Device
2.3.1. Sensors
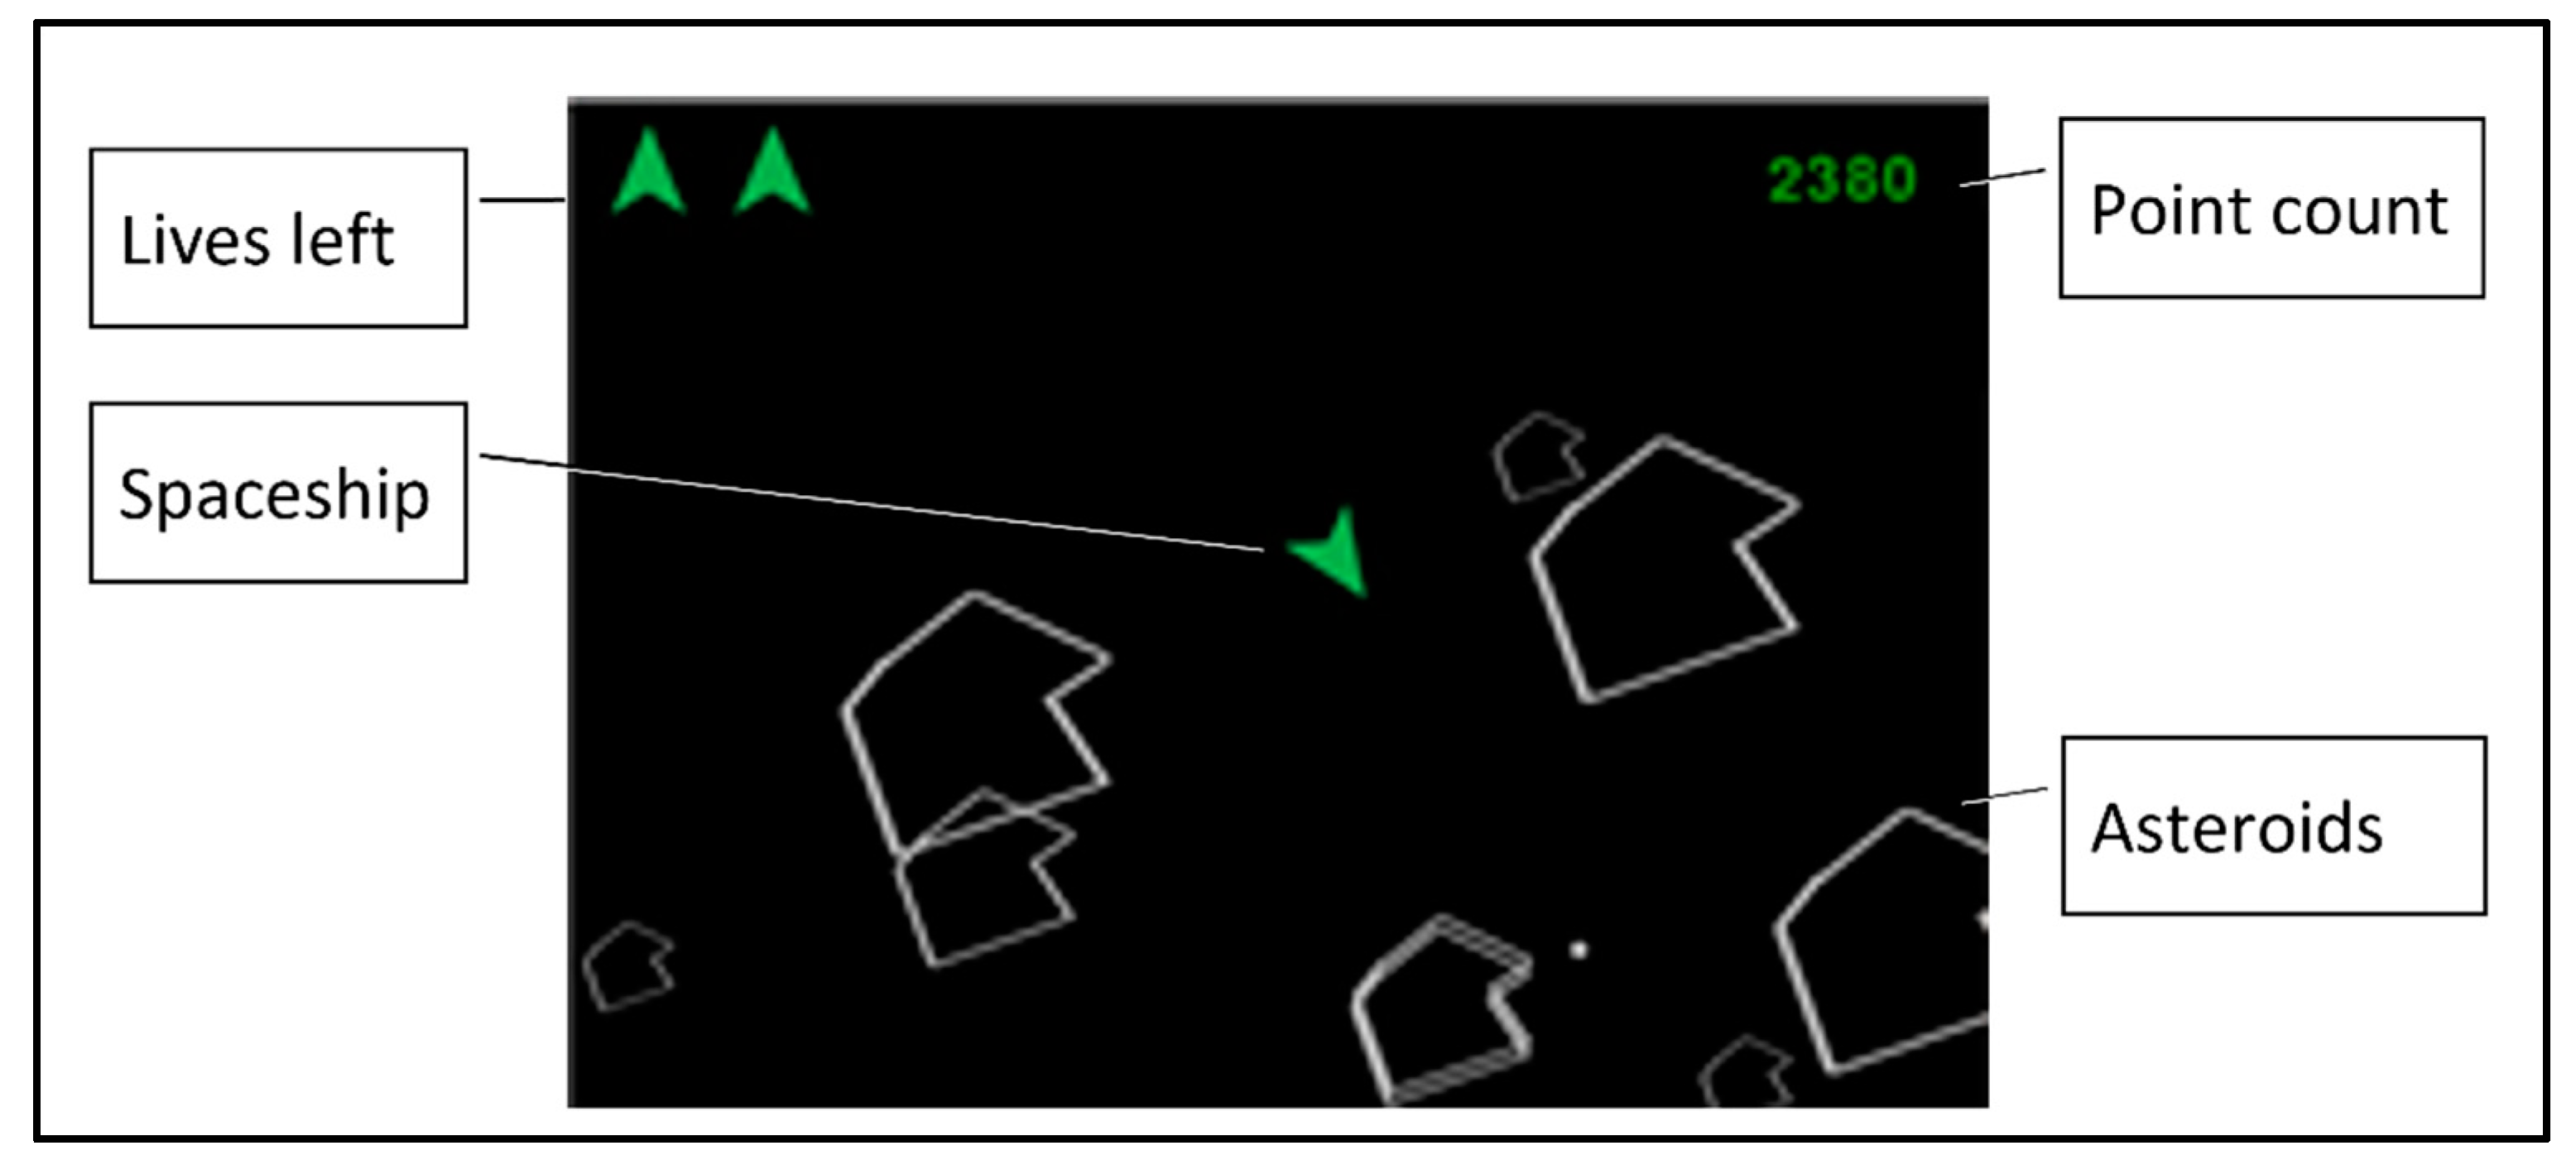
2.3.2. Psychomotor Task
2.4. Procedure
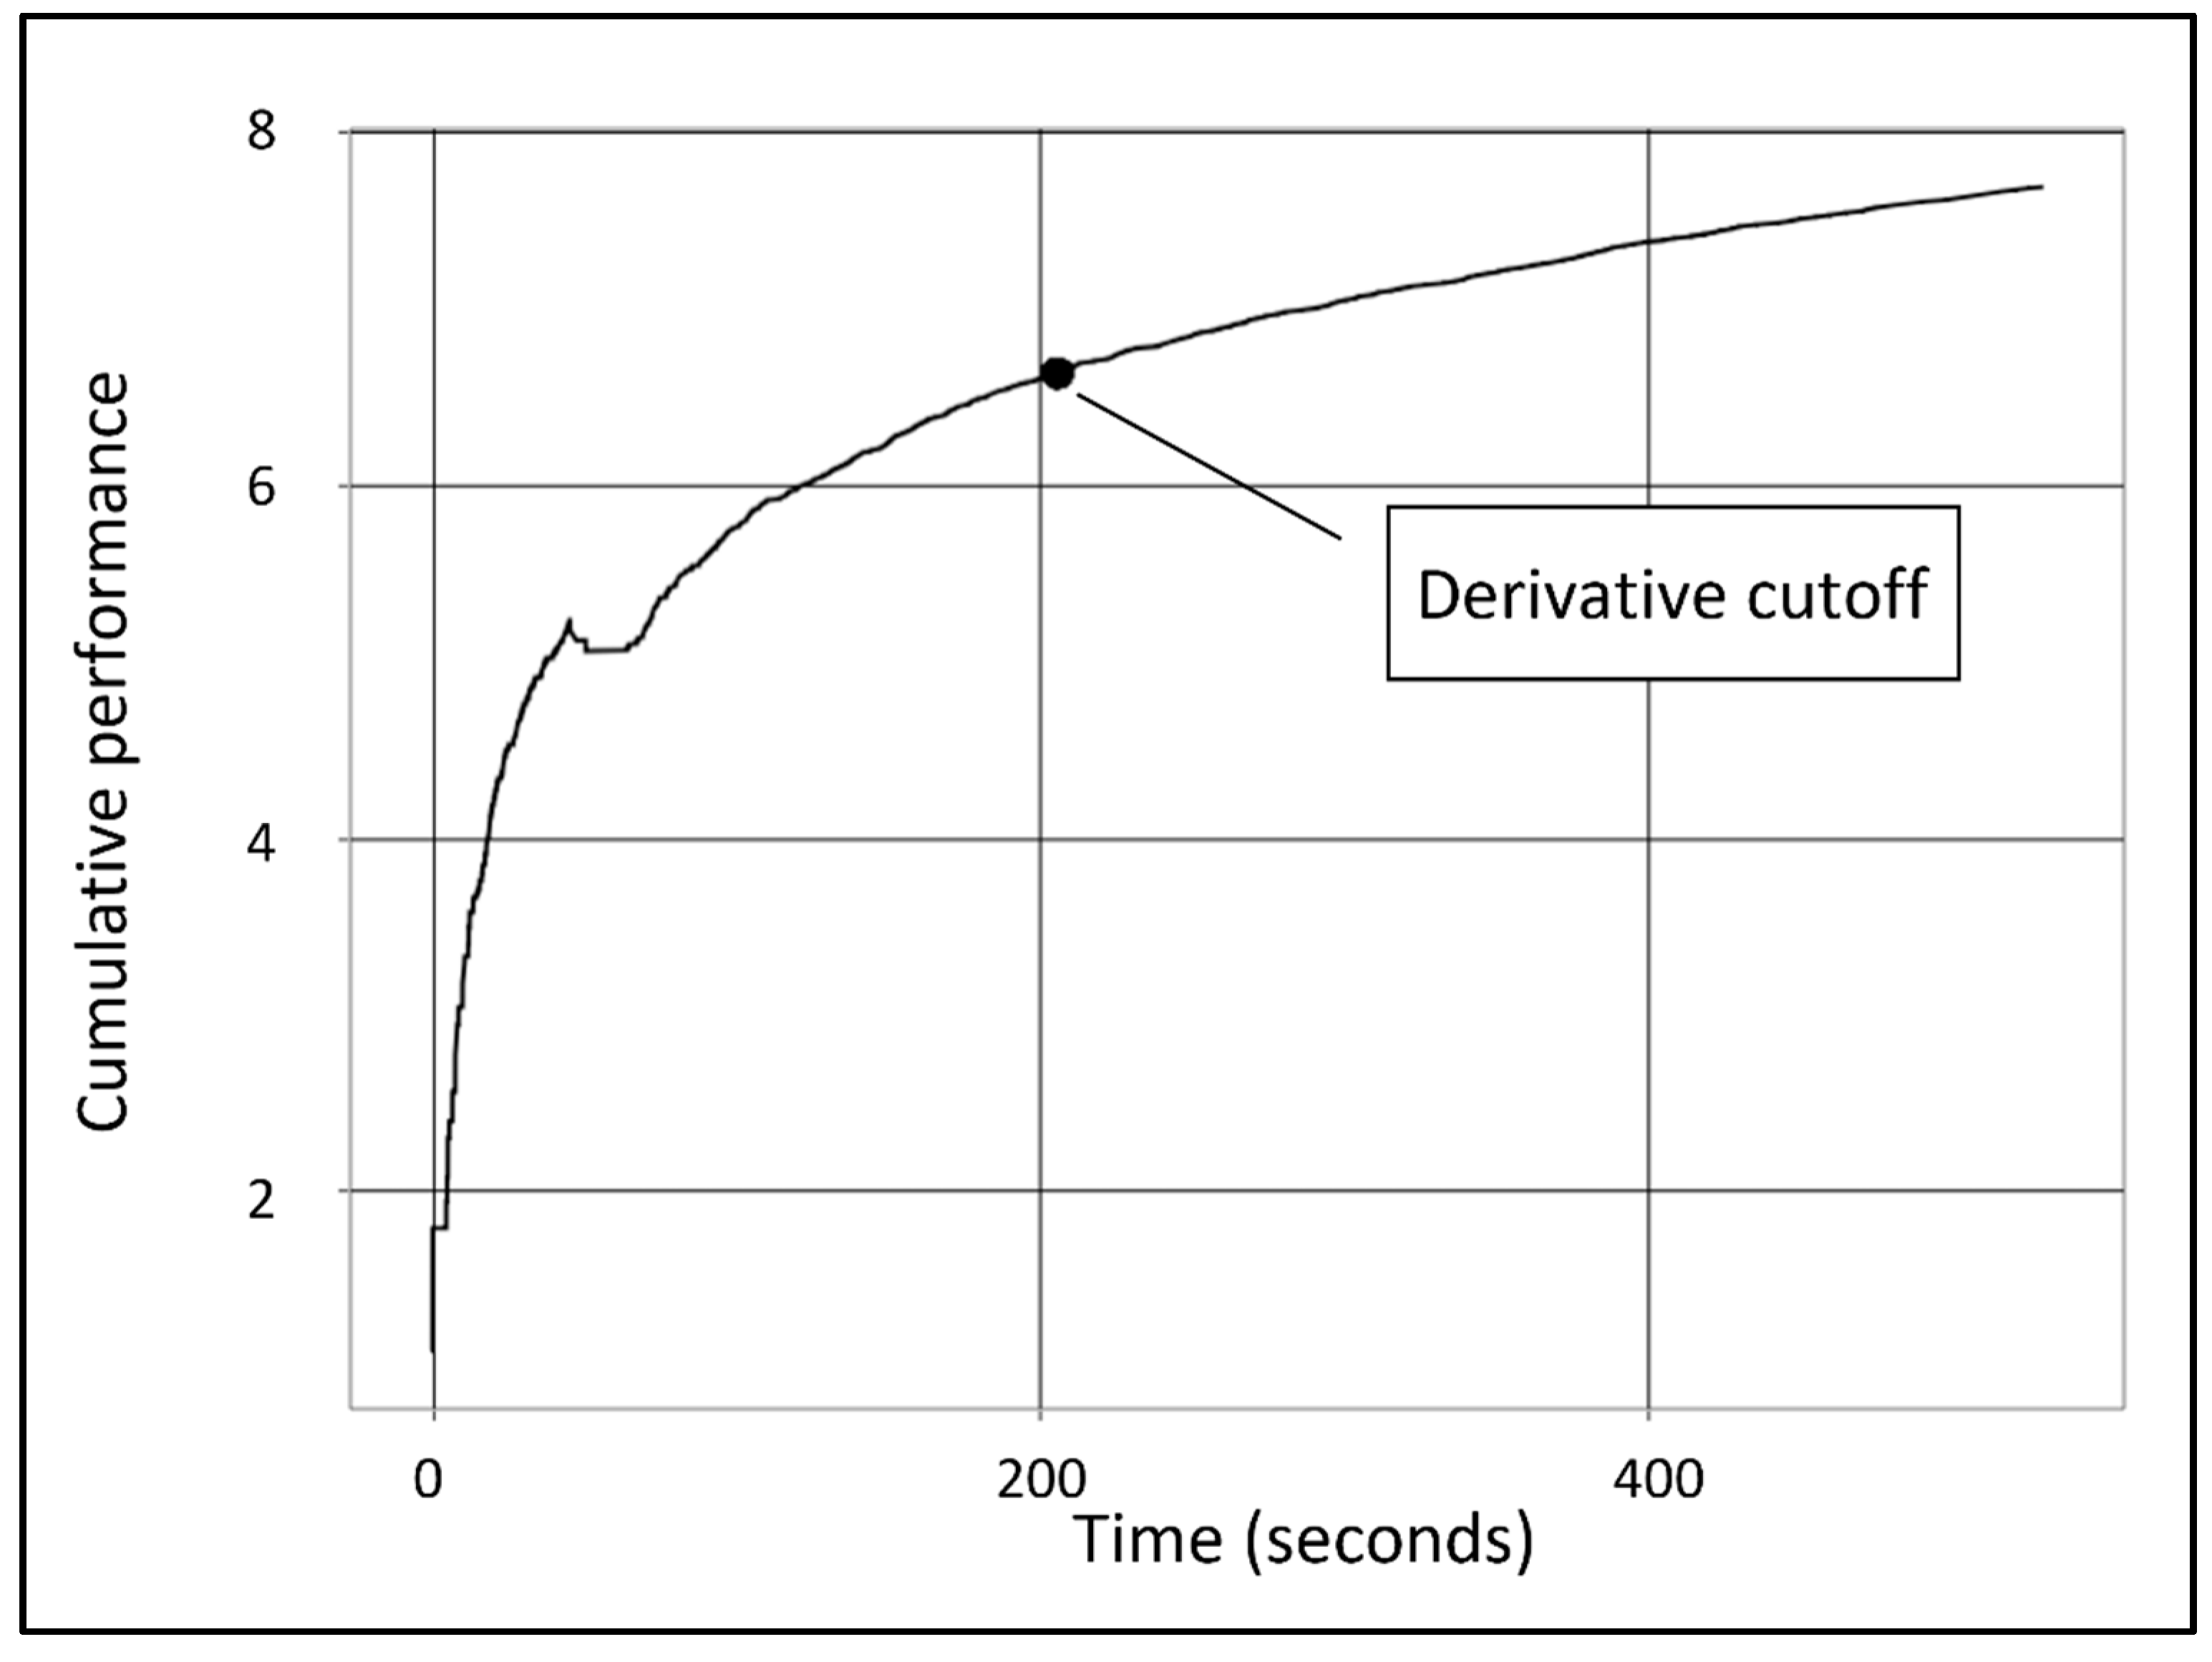
2.5. Analysis
2.5.1. Required Sample Size
2.5.2. Analysis Methods
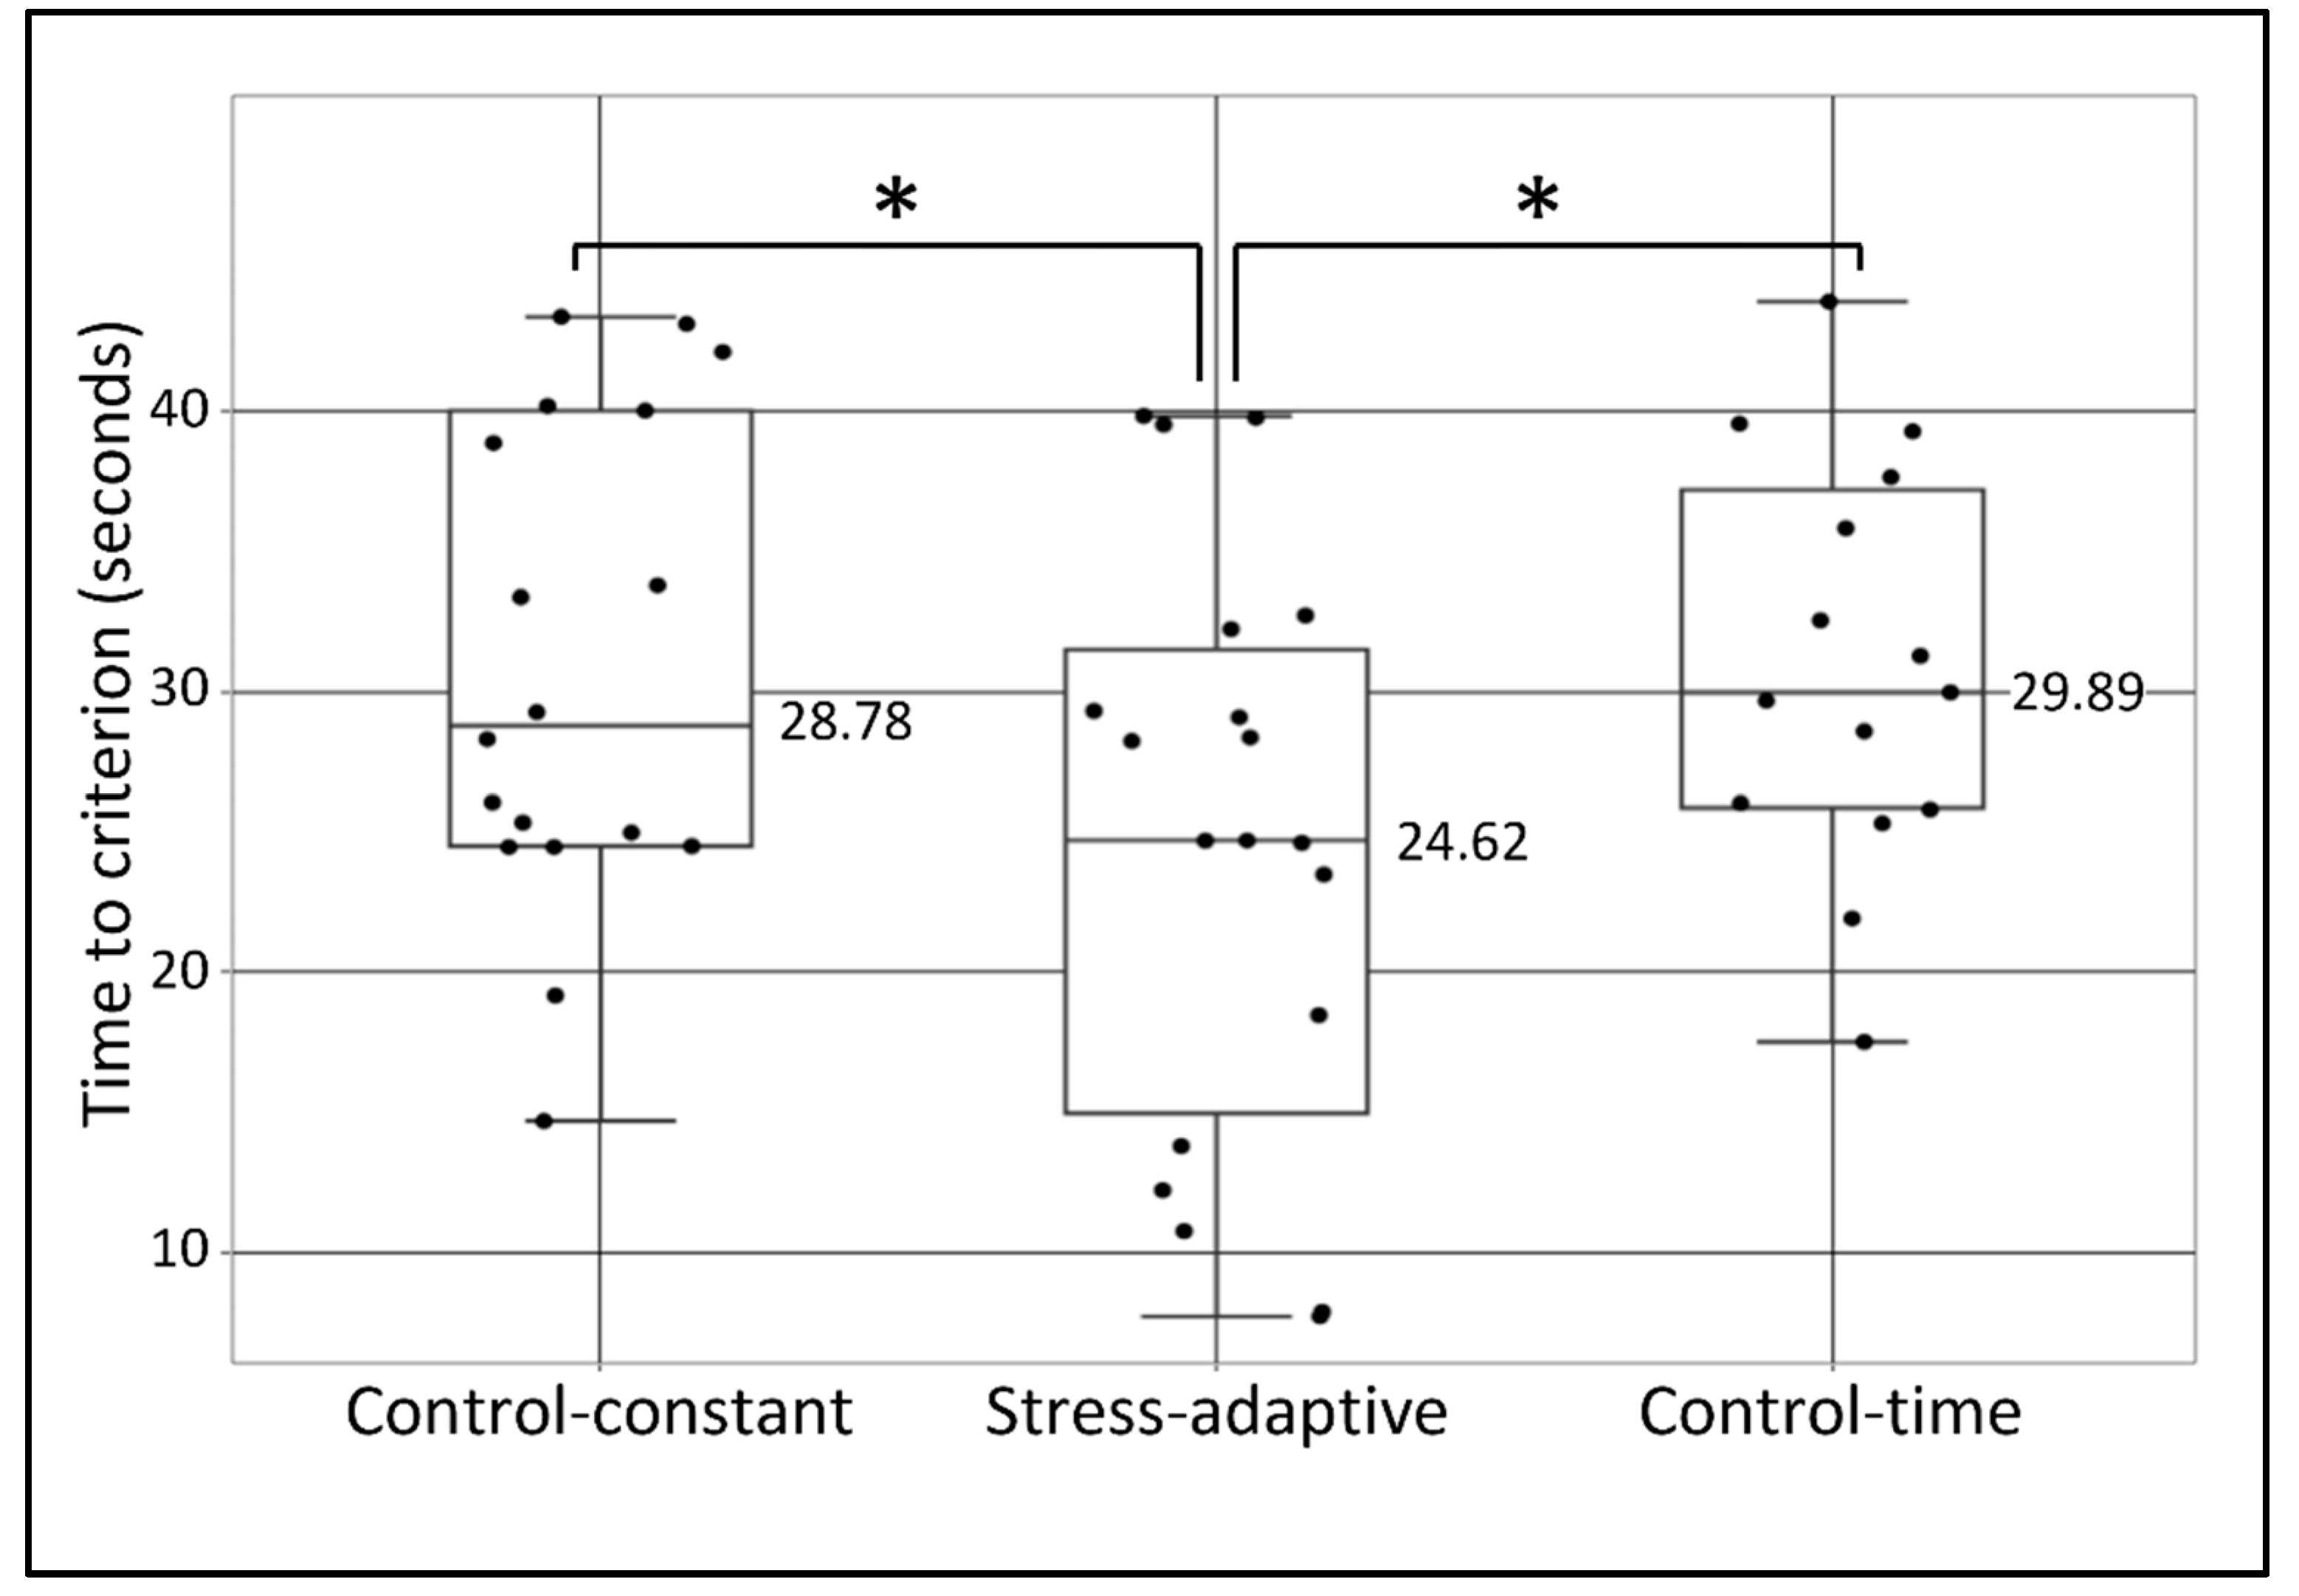
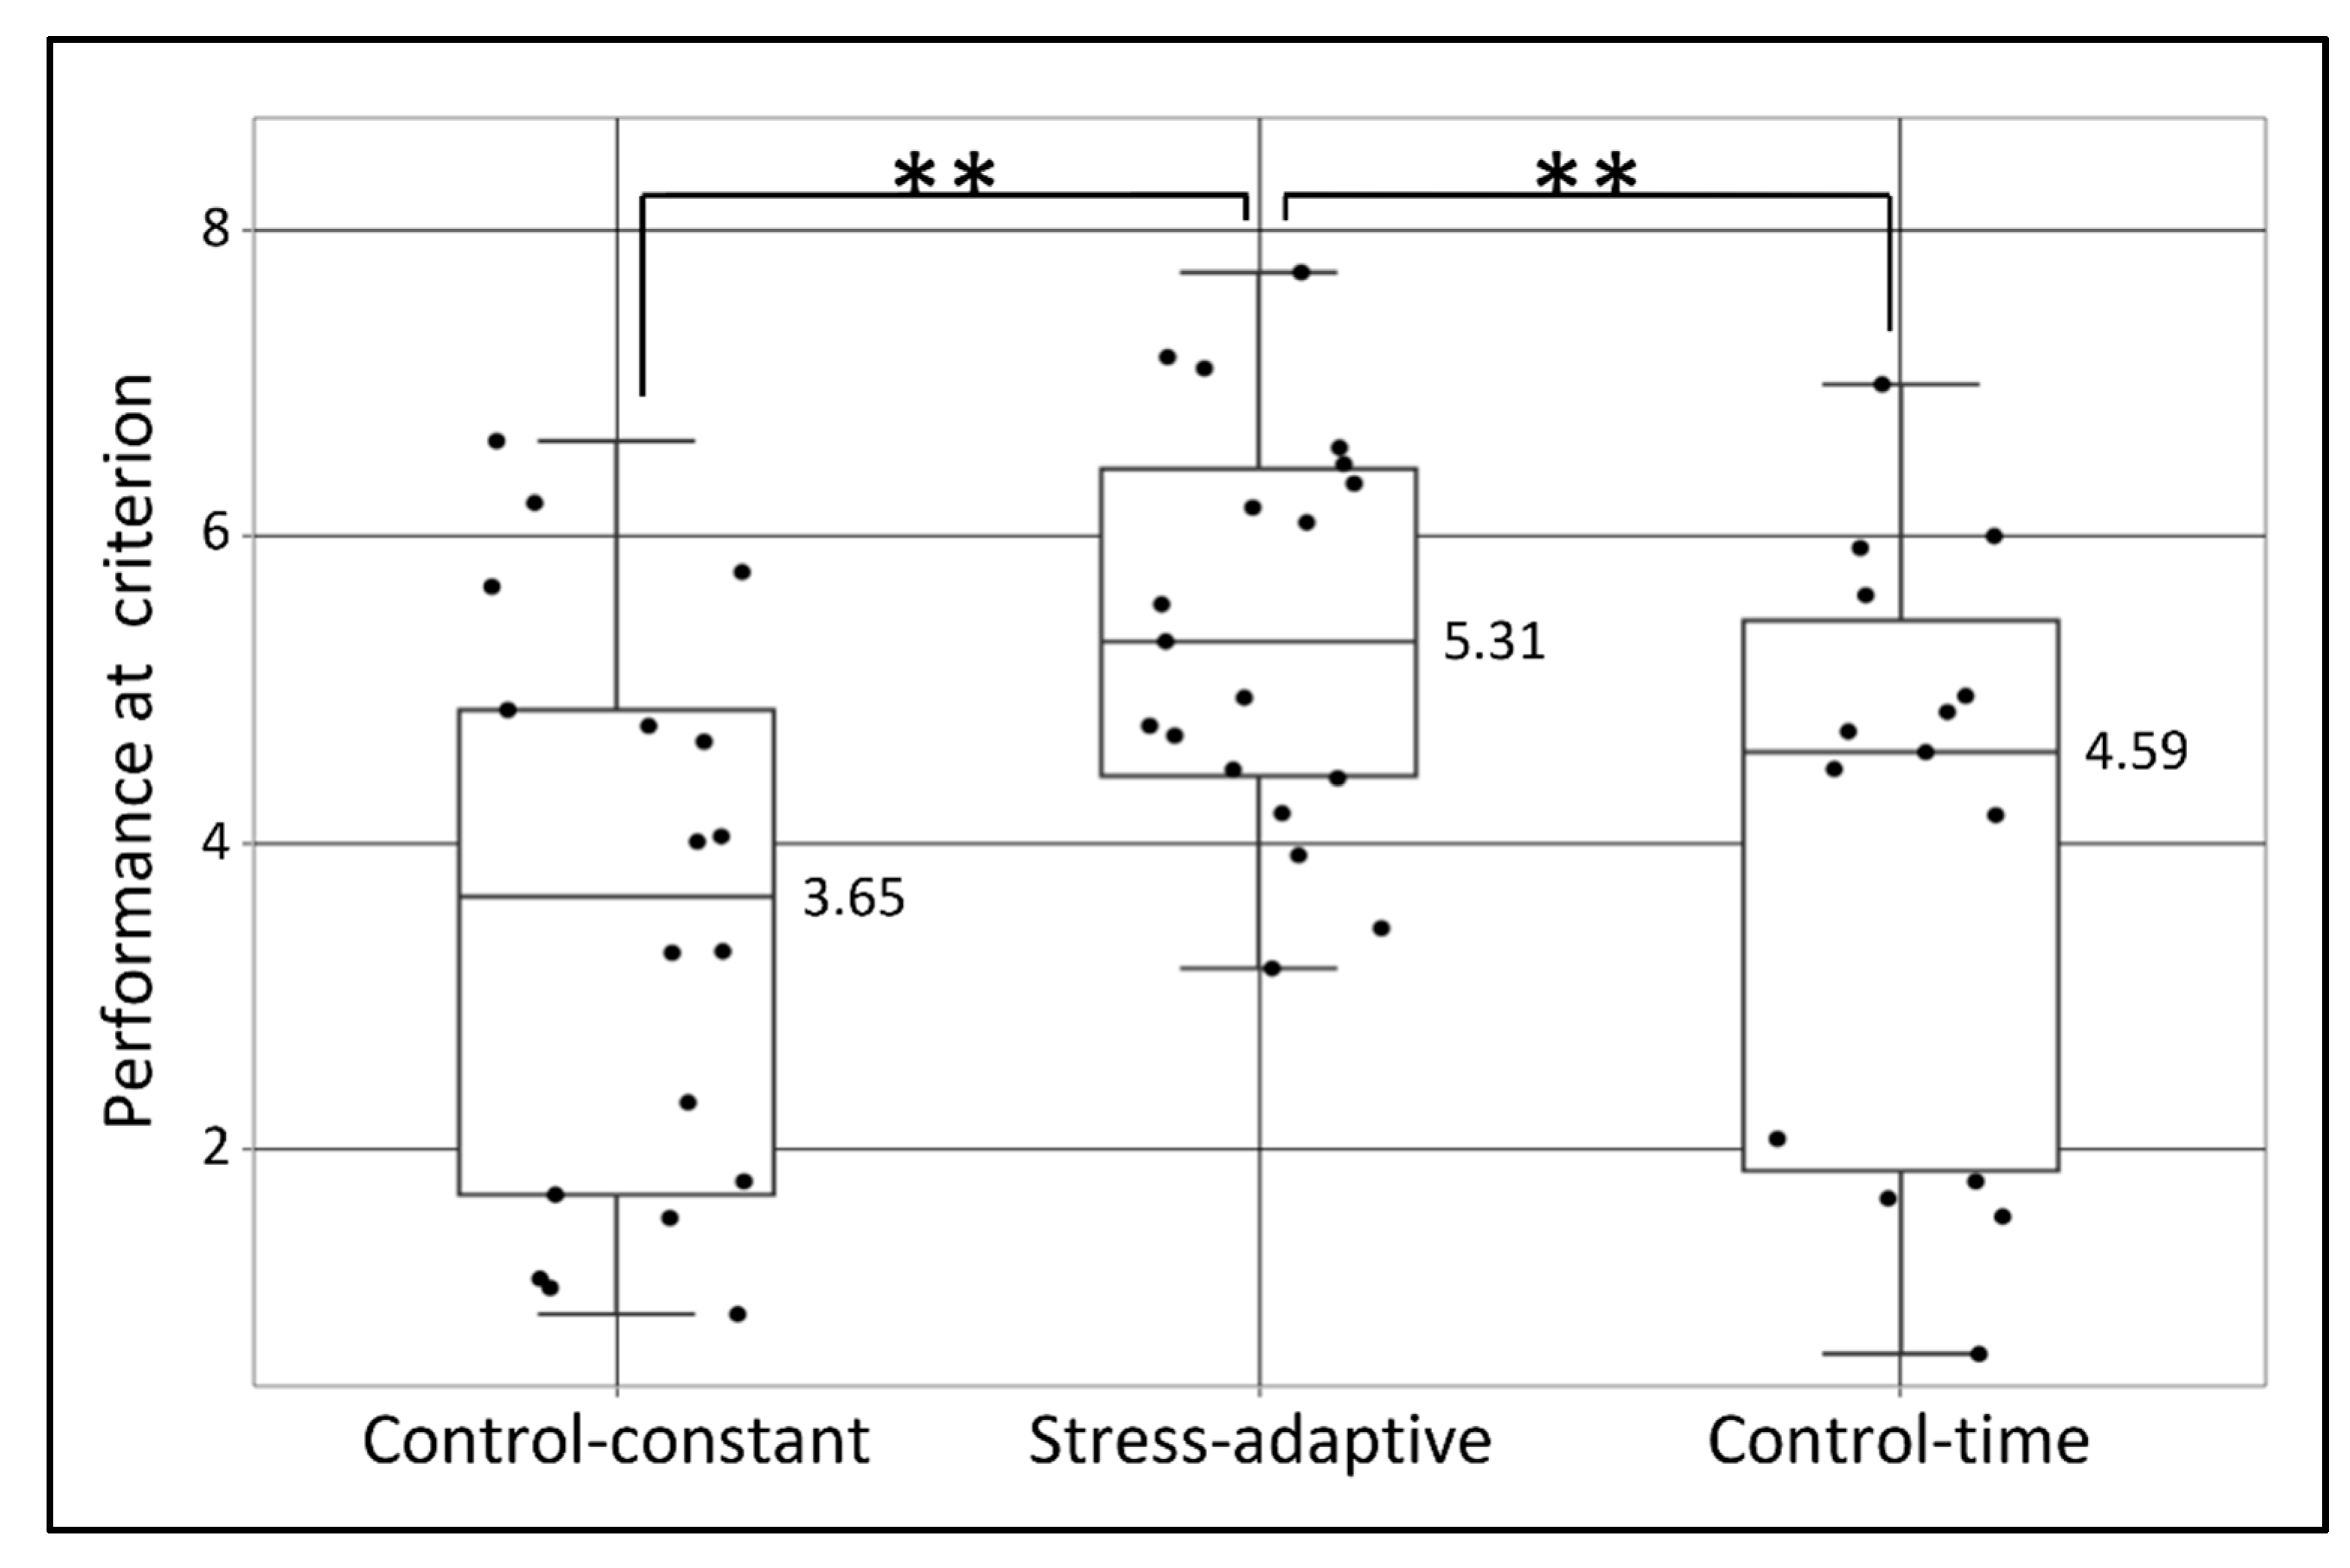
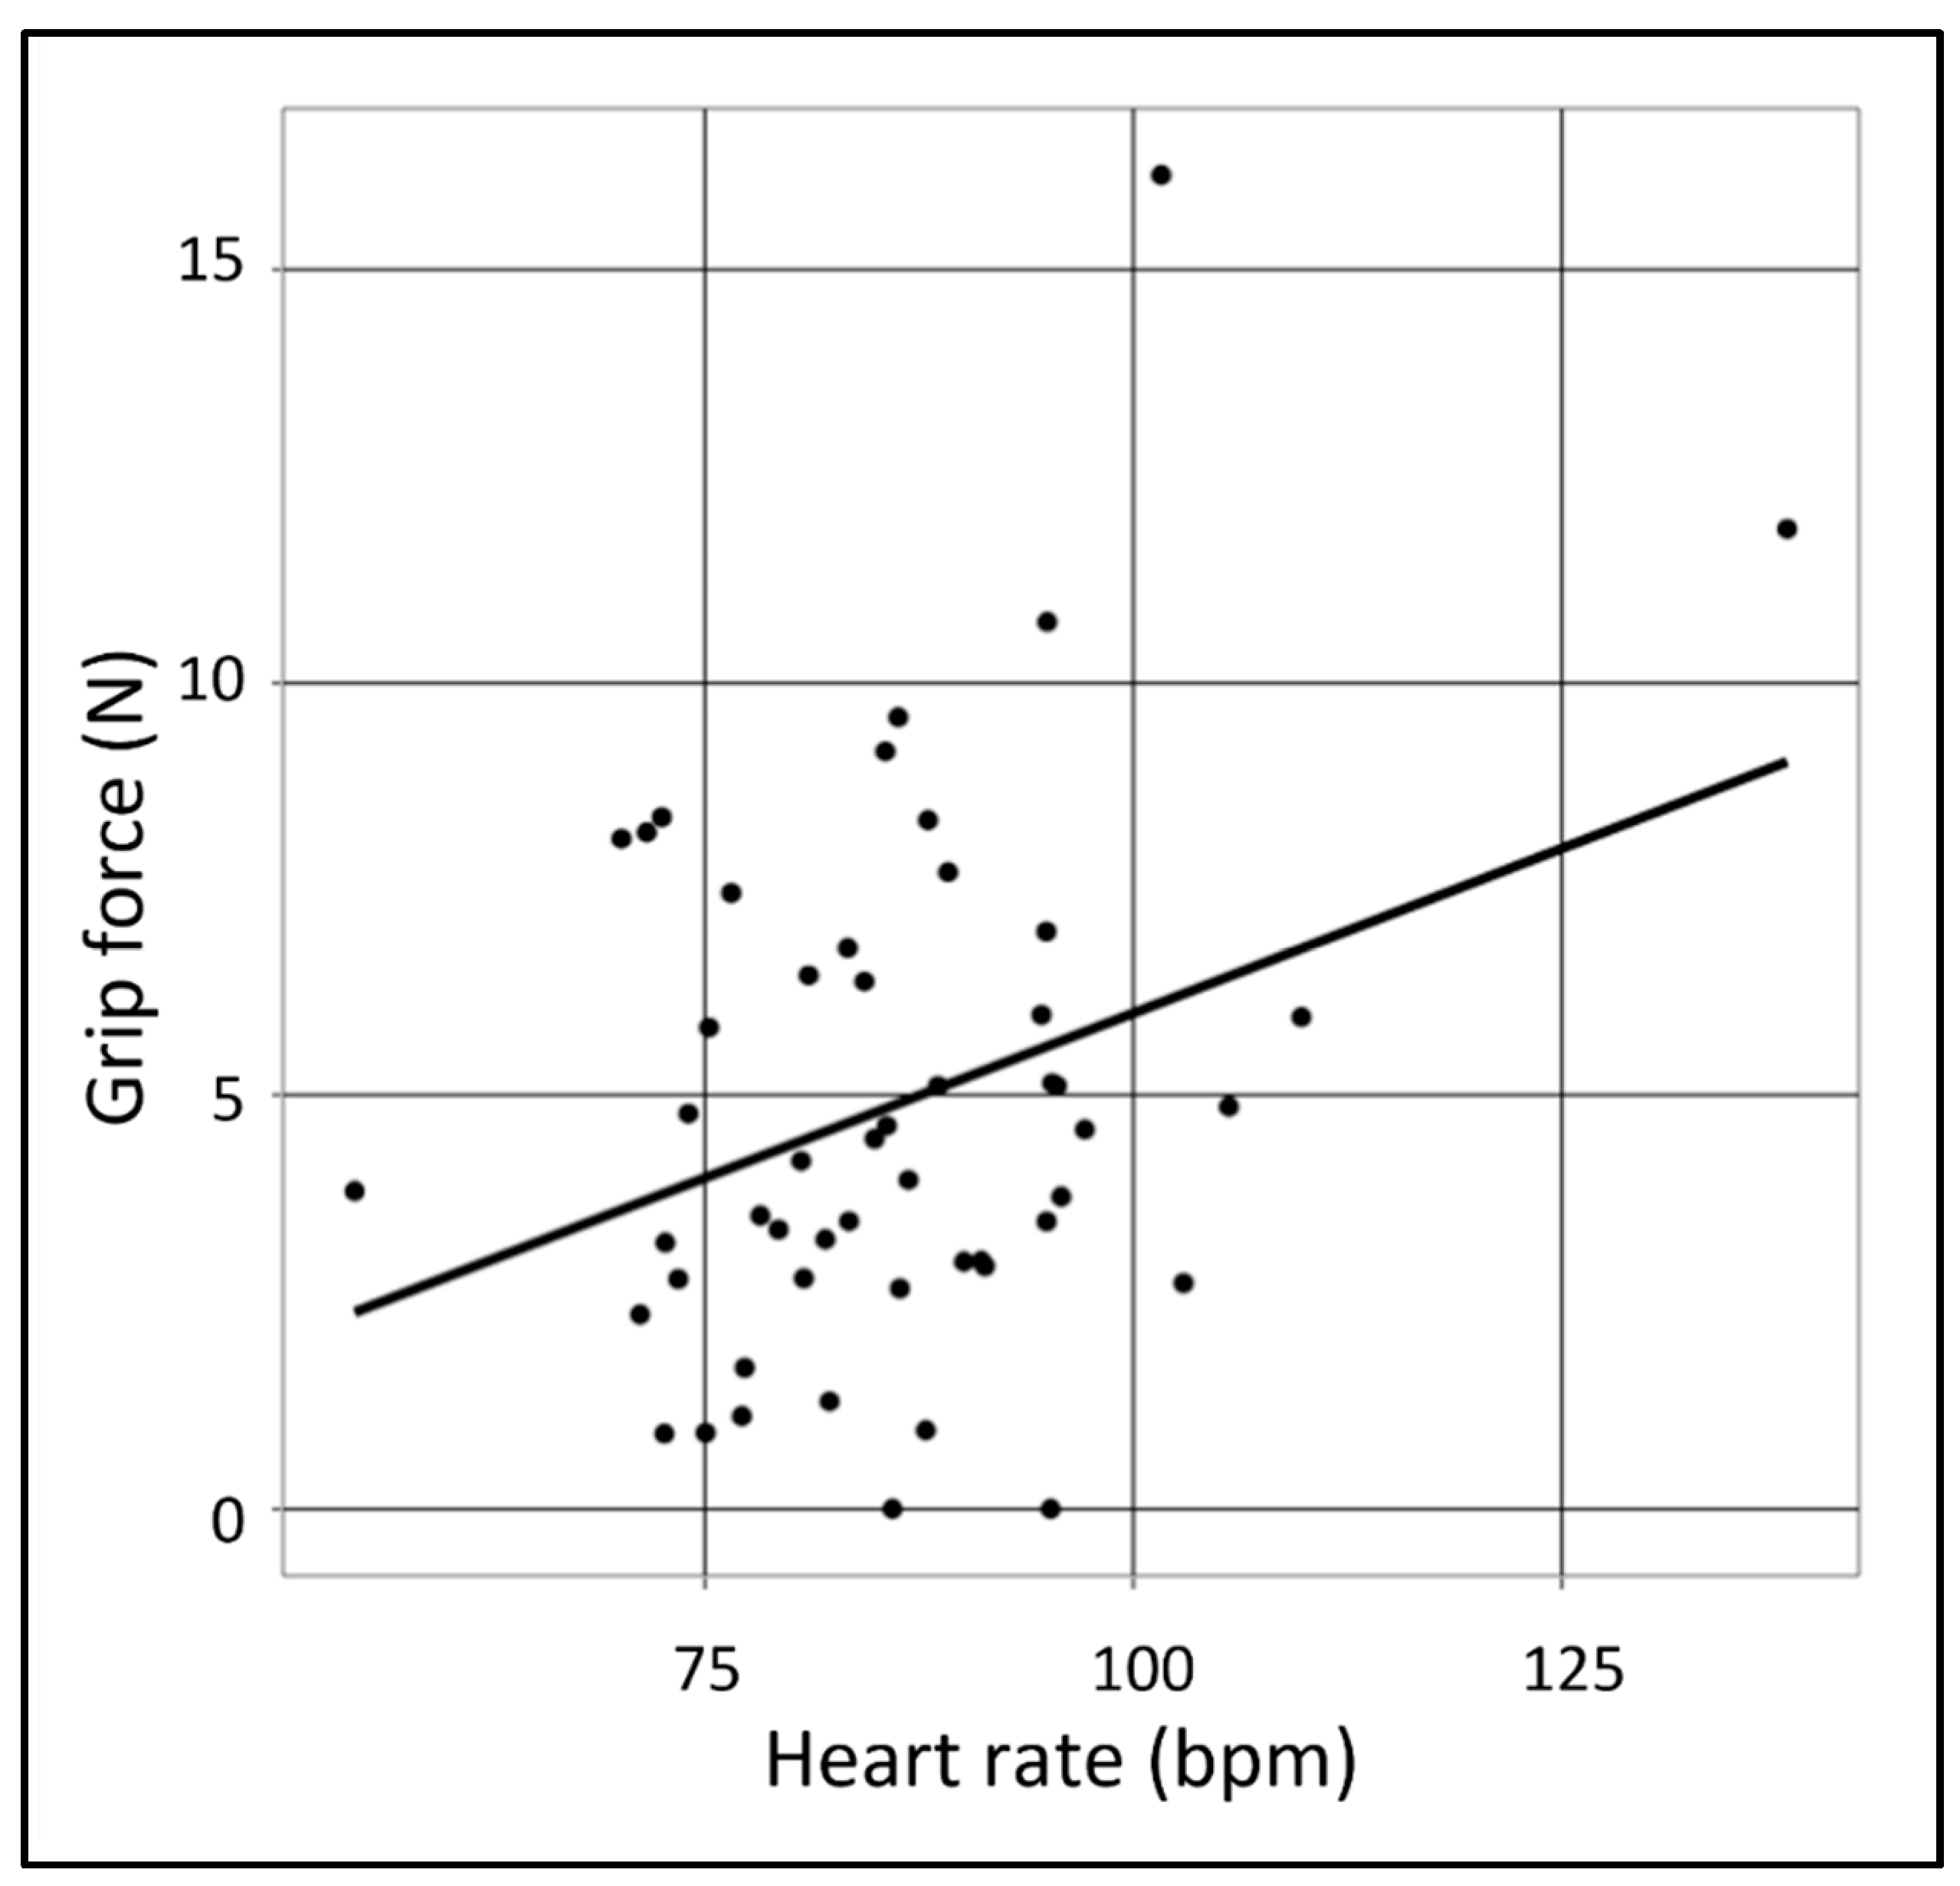
3. Results
4. Discussion
5. Conclusions
Author Contributions
Funding
Institutional Review Board Statement
Informed Consent Statement
Data Availability Statement
Acknowledgments
Conflicts of Interest
Appendix A

References
- Darwin, C. Charles Darwin’s Natural Selection: Being the Second Part of His Big Species Book Written from 1856 to 1858; Cambridge University Press: Cambridge, UK, 1987; p. 270. [Google Scholar]
- Georgopoulos, A.P. Neural aspects of cognitive motor control. Curr. Opin. Neurobiol. 2000, 10, 238–241. [Google Scholar] [CrossRef]
- Bruzzone, A.G.; Massei, M. Simulation-based military training. In Guide to Simulation-Based Disciplines; Springer: Cham, Switzerland, 2017; pp. 315–361. [Google Scholar]
- Papagiannakis, G.; Trahanias, P.; Kenanidis, E.; Tsiridis, E. Psychomotor surgical training in virtual reality. In The Adult Hip-Master Case Series and Techniques; Springer: Cham, Switzerland, 2018; pp. 827–830. [Google Scholar]
- Knoke, B.; Gorldt, C.; Thoben, K.D. Literature Review on Training Simulators. In Manufacturing Processes; Springer: Berlin, Germany, 2019. [Google Scholar]
- Jentsch, F.; Curtis, M. Simulation in Aviation Training; Routledge: London, UK, 2017. [Google Scholar]
- Bradley, P. The history of simulation in medical education and possible future directions. Med. Educ. 2006, 40, 254–262. [Google Scholar] [CrossRef] [PubMed]
- Landsberg, C.R.; Van Buskirk, W.L.; Astwood, R.S., Jr.; Mercado, A.D.; Aakre, A.J. Adaptive Training Considerations for Use in Simulation-Based Systems; (No. NAWCTSD-SR-2010-001); Naval Air Warfare Center Training Systems Div: Orlando, FL, USA, 2010; Available online: https://apps.dtic.mil/sti/pdfs/ADA535421.pdf (accessed on 1 September 2022).
- Redei, A. Applications and Evaluation of a Motion Flight Simulator. Ph.D. Dissertation, University of Nevada, Reno, NV, USA, 2019. [Google Scholar]
- Yoon, S.; Park, T.; Lee, J.H.; Kim, J.A. Study on Transfer Effectiveness and Appropriate Training Hours in Airplanes Simulators. In Proceedings of the ITEC, Novi, MI, USA, 19–21 June 2019. [Google Scholar]
- Dębska, M.; Polechoński, J.; Mynarski, A.; Polechoński, P. Enjoyment and Intensity of Physical Activity in Immersive Virtual Reality Performed on Innovative Training Devices in Compliance with Recommendations for Health. Int. J. Environ. Res. Public Health 2019, 16, 3673. [Google Scholar] [CrossRef] [PubMed]
- Schaffernak, H.; Moesl, B.; Vorraber, W.; Koglbauer, I.V. Potential Augmented Reality Application Areas for Pilot Education: An Exploratory Study. Educ. Sci. 2020, 10, 86. [Google Scholar] [CrossRef]
- Stadnicka, D.; Litwin, P.; Antonelli, D. Human factor in intelligent manufacturing systems-knowledge acquisition and motivation. Procedia CIR 2019, 79, 718–723. [Google Scholar] [CrossRef]
- Zahabi, M.; Razak, A.M.A. Adaptive virtual reality-based training: A systematic literature review and framework. Virtual Real 2020, 24, 1–28. [Google Scholar] [CrossRef]
- Plott, B.M.; McDermott, P.L.; Archer, S.; Carolan, T.F.; Hutchins, S.; Fisher, A.; Orvis, K.A. Understanding the Impact of Training on Performance; Alion Science and Technology Corp Boulder CO MA&D Operation: Boulder, CO, USA, 2014; Available online: https://apps.dtic.mil/sti/pdfs/ADA602128.pdf (accessed on 1 September 2022).
- Couvillion, K.F.; Bass, A.D.; Fairbrother, J.T. Increased cognitive load during acquisition of a continuous task eliminates the learning effects of self-controlled knowledge of results. J. Sports Sci. 2020, 38, 94–99. [Google Scholar] [CrossRef]
- McKendrick, R.; Harwood, A. Cognitive Workload and Workload Transitions Elicit Curvilinear Hemodynamics During Spatial Working Memory. Front. Hum. Neurosci. 2019, 13, 405. [Google Scholar] [CrossRef]
- Mark, J.; Thomas, N.; Kraft, A.; Casebeer, W.D.; Ziegler, M.; Ayaz, H. Neurofeedback for Personalized Adaptive Training. In International Conference on Applied Human Factors and Ergonomics; Springer: Cham, Switzerland, 20 July 2017. [Google Scholar]
- Smith, N.D.; Gunnink, E.D.; Schnell, T.; Reuter, C.; Moss, J.D. Workload-Adaptive Training Scenarios for Synthetic Training Environments. In Proceedings of the Sixth Annual GIFT Users Symposium, US Army Research Laboratory, Orlando, FL, USA, 30 May 2018. [Google Scholar]
- Schroeder, B.L.; Fraulini, N.W.; Marraffino, M.D.; Van Buskirk, W.L.; Johnson, C.I. Individual Differences in Adaptive Training: Distress, Workload, and Coping with Changes in Difficulty. In Proceedings of the Human Factors and Ergonomics Society Annual Meeting Sage CA, Los Angeles, CA, USA, 28 October–1 November 2019. [Google Scholar]
- McEwen, B.S. Definitions and concepts of stress. In Encyclopedia of Stress, 3; Elsevier Science Publishing Co Inc.: San Diego, CA, USA, 2000; pp. 508–509. [Google Scholar]
- Staal, M.A. Stress, Cognition, and Human Performance: A Literature Review and Conceptual Framework; TM-2004-212824; NASA: Washington, DC, USA, 2004. [Google Scholar]
- Evans, G.W.; Johnson, D. Stress and open-office noise. J Appl. Psychol. 2000, 85, 779. [Google Scholar] [CrossRef]
- Tichon, J.G.; Wallis, G.M. Stress training and simulator complexity: Why sometimes more is less. Behav. Inf. Technol. 2010, 29, 459–466. [Google Scholar] [CrossRef]
- Cohen, S.; Weinstein, N. Nonauditory effects of noise on behavior and health. JSI 1981, 37, 36–70. [Google Scholar] [CrossRef]
- Theologus, G.C.; Wheaton, G.R.; Fleishman, E.A. Effects of intermittent, moderate intensity noise stress on human performance. J. Appl. Psychol. 1974, 59, 539–547. [Google Scholar] [CrossRef]
- Warm, J.S.; Dember, W.N.; Hancock, P.A. Vigilance and workload in automated systems. In Automation and Human Performance; Parasuraman, R., Mouloua, M., Eds.; Lawrence Erlbaum: Mahwah, NJ, USA, 1996; pp. 183–200. [Google Scholar]
- Yerkes, R.M.; Dodson, J.D. The relation of strength of stimulus to rapidity of habit formation. J. Comp. Neurol. 1908, 18, 459–482. [Google Scholar] [CrossRef]
- Contrada, R.J.; Baum, A. The Handbook of Stress Science: Biology, Psychology, and Health; Springer Publishing Company: New York, NY, USA, 2011. [Google Scholar]
- Kudielka, B.M.; Schommer, N.C.; Hellhammer, D.H.; Kirschbaum, C. Acute HPA axis responses, heart rate, and mood changes to psychosocial stress (TSST) in humans at different times of day. Psychoneuroendocrinology 2004, 29, 983–992. [Google Scholar] [CrossRef]
- Giannakakis, G.; Grigoriadis, D.; Giannakaki, K.; Simantiraki, O.; Roniotis, A.; Tsiknakis, M. Review on psychological stress detection using biosignals. IEEE Trans. Affect. Comput. 2019, 13, 440–460. [Google Scholar] [CrossRef]
- Al-Fudail, M.; Mellar, H. Investigating teacher stress when using technology. Comput. Educ. 2008, 51, 1103–1110. [Google Scholar] [CrossRef]
- Matthews, G.; Reinerman-Jones, L.E.; Barber, D.J.; Abich IV, J. The psychometrics of mental workload: Multiple measures are sensitive but divergent. Hum. Factors 2015, 57, 125–143. [Google Scholar] [CrossRef]
- Yamaguchi, M.; Wakasugi, J.; Sakakima, J. Evaluation of driver stress using biomarker in motor-vehicle driving simulator. In Proceedings of the International Conference of the IEEE Engineering in Medicine and Biology Society, New York, NY, USA, 1 January 2006; pp. 1834–1837. [Google Scholar]
- Healey, J.; Picard, R.W. Detecting stress during real-world driving tasks using physiological sensors. IEEE Trans. Intell. Transp. Syst. 2005, 6, 156–166. [Google Scholar] [CrossRef]
- Dinges, D.F.; Rider, R.L.; Dorrian, J.; McGlinchey, E.L.; Rogers, N.L.; Cizman, Z.; Metaxas, D.N. Optical computer recognition of facial expressions associated with stress induced by performance demands. ASEM 2005, 76, B172–B182. [Google Scholar]
- Bruun, A. It’s not complicated: A study of non-specialists analyzing GSR sensor data to detect UX related events. In Proceedings of the 10th Nordic Conference on Human-Computer Interaction, Oslo Norway, 1–3 October 2018. [Google Scholar]
- Kirschbaum, C.; Hellhammer, D.H. Salivary cortisol in psychoneuroendocrine research: Recent developments and applications. Psychoneuroendocrinology 1994, 19, 313–333. [Google Scholar] [CrossRef]
- Kucera, P.; Goldenberg, Z.; Kurca, E. Sympathetic skin response: Review of the method and its clinical use. Bratisl Lek Listy. 2004, 105, 108–116. [Google Scholar] [PubMed]
- Nickel, P.; Nachreiner, F. Sensitivity and diagnosticity of the 0.1-Hz component of heart rate variability as an indicator of mental workload. Int. J. Hum. Factors Ergon. 2003, 45, 575–590. [Google Scholar] [CrossRef] [PubMed]
- Wagner, M.; Sahar, Y.; Elbaum, T.; Botzer, A.; Berliner, E. Grip Force as a Measure of Stress in Aviation. Int. J. Aviat. Psychol. 2015, 25, 157–170. [Google Scholar] [CrossRef]
- Botzer, A.; Sahar, Y.; Wagner, M.; Elbaum, T. Analyzing individuals’ grip force over short intervals in a joystick-controlled task with and without a stress manipulation. Behav. Inf. Technol. 2021, 40, 476–482. [Google Scholar] [CrossRef]
- Sahar, Y.; Elbaum, T.; Wagner, M.; Musicant, O.; Hirsh, T.; Shoval, S. Grip Force on Steering Wheel as a Measure of Stress. Front. Psychol. 2021, 12, 1036. [Google Scholar] [CrossRef] [PubMed]
- Ollander, S.; Godin, C.; Campagne, A.; Charbonnier, S. A comparison of wearable and stationary sensors for stress detection. In Proceedings of the 2016 IEEE International Conference on systems, man, and Cybernetics (SMC), Budapest, Hungary, 9–12 October 2016. [Google Scholar]
- Champely, S.; Ekstrom, C.; Dalgaard, P.; Gill, J.; Weibelzahl, S.; Anandkumar, A.; Ford, C.; Volcic, R.; De Rosario, H. pwr: Basic Functions for Power Analysis. 2020. Available online: https://cran.r-project.org/web/packages/pwr/ (accessed on 23 May 2022).
- Cohen, J. Statistical Power Analysis for the Behavioral Sciences; Routledge: Hillsdale, NI, USA, 1988. [Google Scholar]
- Martinelli, A.; Grüll, J.; Baum, C. Attention and interpretation cognitive bias change: A systematic review and meta-analysis of bias modification paradigms. Behav. Res. Ther. 2022, 157, 104180. [Google Scholar] [CrossRef]
- Fritz, M.S.; MacKinnon, D.P. Required sample size to detect the mediated effect. Psychol. Sci. 2007, 18, 233–239. [Google Scholar] [CrossRef]
- Peat, J.; Barton, B. Medical Statistics: A Guide to SPSS, Data Analysis and Critical Appraisal; John Wiley & Sons: Hoboken, NJ, USA, 2014. [Google Scholar]
- Leite, D.; Martins, A.; Rativa, D.; De Oliveira, J.F.; Maciel, A. An Automated Machine Learning Approach for Real-Time Fault Detection and Diagnosis. Sensors 2022, 22, 6138. [Google Scholar] [CrossRef]
- van Weelden, E.; Alimardani, M.; Wiltshire, T.J.; Louwerse, M.M. Aviation and neurophysiology: A systematic review. Appl. Ergon. 2022, 105, p103838. [Google Scholar] [CrossRef]
- Nagyné Elek, R.; Haidegger, T. Non-technical skill assessment and mental load evaluation in robot-assisted minimally invasive surgery. Sensors 2021, 21, 2666. [Google Scholar] [CrossRef]
- Anderson, C.R. Coping behaviors as intervening mechanisms in the inverted-U stress-performance relationship. J. Appl. Psychol. 1976, 61, 30–34. [Google Scholar] [CrossRef] [PubMed]
- Hancock, P.A.; Warn, J.S. A dynamic model of stress and sustained attention. Hum. Factors 1989, 31, 519–537. [Google Scholar] [CrossRef] [PubMed]


Publisher’s Note: MDPI stays neutral with regard to jurisdictional claims in published maps and institutional affiliations. |
© 2022 by the authors. Licensee MDPI, Basel, Switzerland. This article is an open access article distributed under the terms and conditions of the Creative Commons Attribution (CC BY) license (https://creativecommons.org/licenses/by/4.0/).
Share and Cite
Sahar, Y.; Wagner, M.; Barel, A.; Shoval, S. Stress-Adaptive Training: An Adaptive Psychomotor Training According to Stress Measured by Grip Force. Sensors 2022, 22, 8368. https://doi.org/10.3390/s22218368
Sahar Y, Wagner M, Barel A, Shoval S. Stress-Adaptive Training: An Adaptive Psychomotor Training According to Stress Measured by Grip Force. Sensors. 2022; 22(21):8368. https://doi.org/10.3390/s22218368
Chicago/Turabian StyleSahar, Yotam, Michael Wagner, Ariel Barel, and Shraga Shoval. 2022. "Stress-Adaptive Training: An Adaptive Psychomotor Training According to Stress Measured by Grip Force" Sensors 22, no. 21: 8368. https://doi.org/10.3390/s22218368
APA StyleSahar, Y., Wagner, M., Barel, A., & Shoval, S. (2022). Stress-Adaptive Training: An Adaptive Psychomotor Training According to Stress Measured by Grip Force. Sensors, 22(21), 8368. https://doi.org/10.3390/s22218368