Abstract
The sensitivity of luminescence thermometry is enhanced at high temperatures when using a three-level luminescence intensity ratio approach with Dy3+- activated yttrium aluminum perovskite. This material was synthesized via the Pechini method, and the structure was verified using X-ray diffraction analysis. The average crystallite size was calculated to be around 46 nm. The morphology was examined using scanning electron microscopy, which showed agglomerates composed of densely packed, elongated spherical particles, the majority of which were 80–100 nm in size. The temperature-dependent photoluminescence emission spectra (ex = 353 nm, 300–850 K) included Dy3+ emissions in blue (458 nm), blue (483 nm), and violet (430 nm, T 600 K). Luminescence intensity ratio, the most utilized temperature readout method in luminescent thermometry, was used as the testing method: a) using the intensity ratio of Dy3+ ions and 4I15/2→6H15/2/4F9/2→6H15/2 transitions; and b) employing the third, higher energy 4G11/2 thermalized level, i.e., using the intensity ratio of 4G11/2→6H15/2/4F9/2→6H15/2 transitions, thereby showing the relative sensitivities of 0.41% K−1 and 0.86% K−1 at 600 K, respectively. This more than doubles the increase in sensitivity and therefore demonstrates the method’s usability at high temperatures, although the major limitation of the method is the chemical stability of the host material and the temperature at which the temperature quenching commences. Lastly, it must be noted that at 850 K, the emission intensities from the energetically higher levels were still increasing in YAP: Dy3+.
1. Introduction
Temperature measurements that are based on changes in material luminescence have received a lot of attention in recent years [1,2,3,4,5]. This semi-invasive method offers reliable, precise, fast, and single-point or 2D thermal imaging in a wide temperature range, which can range from cryogenic temperatures to approximately 1700 °C [6]. It can be applied to macroscopic and microscopic systems, large surfaces, in vivo [7,8], fiber-optic probes [9,10,11], corrosive, radioactive environments [12], or high electromagnetic fields.
The luminescence intensity ratio (LIR) of the emission from lanthanide-activated phosphors is the most frequently utilized method in luminescence thermometry. It offers many benefits, such as accuracy and the simplicity of measurements, high reproducibility, and self-referencing. When emissions from adjacent thermalized excited levels are utilized (known as Boltzmann thermometers), the LIR can be explained by a Boltzmann distribution [13]:
where I represents the integrated intensities from higher (H) and lower (L) energy levels; ΔE = EH − EL is the energy difference between the excited levels; B is the temperature invariant constant (dependent on the properties of the host material); and k = 0.695 cm−1 K−1 is the Boltzmann constant. The performances of temperature-sensitive materials can be assessed by comparing their relative sensitivity, which is a figure of merit that represents the amount of change in the indication with the temperature. The relative sensitivity (SR) is presented by [14,15]:
It can be seen from Equation (2) that SR at a specific temperature depends linearly on the energy difference between the thermalized levels. As a rule of thumb, one can consider the energy of 2000 cm−1 as the limit above which the thermal energy (at room temperature) is not sufficient for the population of the H level [16]. In the case of Dy3+ ions, the energy difference between the first two excited levels, 4F9/2 and 4I15/2 (approximately 900 cm−1), limits the relative sensitivity at room temperature to 1.5% K−1. In fact, Boltzmann thermometers show a maximal 2.93% K−1 value of relative sensitivity at room temperature in Eu3+- activated phosphors with the largest energy difference between the first two excited levels (approximately 1750 cm−1) [17]. Yet, to achieve better accuracy of the Boltzmann-type luminescence thermometers, higher values of relative sensitivity are needed since the uncertainty in the measured temperature is inversely proportional to the relative sensitivity. Low sensitivity becomes an even larger problem in measurements at high temperatures due to the relative sensitivity, which is proportional to the square of the inverse temperature (see Equation (1)), i.e., it rapidly decreases with an increase in temperature.
To overcome the above-mentioned limitations of the Boltzmann thermometer and to obtain larger values of relative sensitivity at high temperatures, emissions from higher-energy excited levels can be used in the LIR approach. The thermal energy needed to populate the energetically higher levels is proportional to the temperature, expanding this energy gap limit for the Boltzmann distribution at elevated temperatures. To the best of the authors’ knowledge, there are not many reports on the inclusion of the third thermalized level for the realization of Boltzmann thermometers with emissions from higher energy excited levels, such as: Dy3+ activated CaWO4 [18] and Lu1.5Y1·5Al5O12 [19]; Nd3+ activated NaYF4 [20]; Er3+ activated YF3 [21] and Pr3+; and Gd3+ activated YAl3(BO3)4 [22].
This study aims to investigate the potential of Dy3+-activated yttrium aluminum perovskite (YAlO3, YAP) for luminescence thermometry at high temperatures using the third thermalized excitation level of Dy3+. The Dy3+- activated YAP is chosen as a demonstrating system for two reasons: 1) the Dy ion is selected due to the ladder-like structure of energy levels necessary for this approach, and 2) the YAP host is chosen due to its good thermal, mechanical, and optical properties [23,24]. The 2 mol% content of Dy3+ was selected according to the study in reference [25]. The Dy3+- activated sample was obtained using the modified Pechini method [26], and its usability as a temperature-sensitive material was confirmed by two LIR methods: (a) the traditional method using the intensity ratio of Dy3+ ions 4I15/2→6H15/2/4F9/2→6H15/2 transitions (LIR1), and (b) LIR employing the third, higher-energy 4G11/2 thermalized level, 4G11/2→6H15/2/4F9/2→6H15/2 (LIR2). The comparison with the previously conducted research that employs LIR via energetically higher levels for luminescence thermometry, mentioned above, will be presented at the end of the results section.
2. Material and Methods
Metal nitrates (yttrium(III) nitrate hexahydrate, Y(NO3)3×6H2O; dysprosium (III) nitrate pentahydrate, Dy(NO3)3×5H2O; aluminum (III) nitrate nonahydrate, Al(NO3)3×9H2O; Alfa Aesar, purity 99.9%, 99.9%, and 98+%, respectively); citric acid, CA (HOC(COOH)(CH2COOH)2, Sigma Aldrich, ACS reagent, ≥99.5%); and ethylene glycol, EG (HOCH2CH2OH, Sigma Aldrich, anhydrous, 99.8%) were used as starting materials without further purification.
In this work, a YAP: 2 mol% Dy3+ (Y0.98Dy0.02AlO3) sample was obtained using a modified Pechini method. The desired material was synthesized by adding stoichiometric amounts of metal nitrates to the solution of CA in EG (M: CA: EG = 1: 5: 25), followed by stirring at 80 °C for 30 min, and then at 120 °C until a brownish gel was obtained. The gel was treated at 600 °C for 2 h, annealed at 1100 °C for 2 h, cooled to room temperature, and then ground in a mortar.
The crystal structure of the powder was studied by X-ray diffraction (XRD) using a Rigaku SmartLab diffractometer (Cu-Kα1, 2 radiation, λ = 0.1540 nm) at ambient temperature. The measurements were recorded over a 10 °–90 ° range, with a 0.02 ° step size and 1 °/min counting time. The morphology of the prepared sample was defined by a field emission gun TESCAN MIRA3 scanning electron microscope (SEM). The samples were coated with a thin layer of Au using a typical sputtering technique (Polaron SC502, Fison Instruments, UK)).
The photoluminescence excitation and emission spectra were recorded using a Horiba Jobin Yvon Fluorolog (FL3-22) spectrofluorometer through a fiber-optic bundle using a 450 W xenon lamp as the excitation source; further, the temperature of the sample was regulated by a custom-built hot-stage apparatus [27]. Temperature-dependent emission spectra were then recorded in the 300–850 K temperature range.
3. Results & Discussion
3.1. Structural and Phase Characterization of YAP: 2 mol% Dy3+
X-ray diffraction patterns of the YAP: 2 mol% Dy3+ powder sample shown in Figure 1a match the orthorhombic structure with the Pbnm (62) space group (ICDD card no. 01-074-4232). No other phases were detected, indicating that the Dy3+ dopant was successfully integrated into the YAP host lattice. In YAP, due to their similar ionic radii and balance, Dy3+ ions can simply replace Y3+ ions (1.027 Å and 1.019 Å, respectively) [28]. The mean crystallite size and appropriate structural parameters were determined using the built-in PDXL2 package software and the initial parameters for the analysis were taken according to the reference [29] (Table 1). The mean crystallite size of the synthesized powder was calculated as ~46 nm.
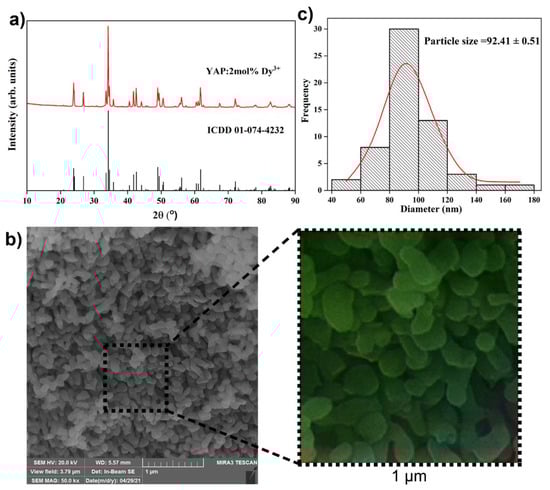
Figure 1.
(a) X-ray diffraction pattern of the YAP: 2 mol% Dy3+ sample. The diffraction peaks are indexed according to the ICDD card No. 01-074-4232; (b) scanning electron microscopy images of the YAP:2 mol% Dy3+ sample recorder under 50,000× magnification and artificial colorization of 1 μm2 by Wolfram Mathematica Neural network; and (c) particle size distribution histogram.

Table 1.
Selected structural parameters of the synthesized YAP:2 mol% Dy3+ nanocrystals.
Scanning electron microscopy was performed in order to explore the powder morphology and micrograph of the sample taken under 50,000× magnification with a corresponding size distribution histogram that is presented in Figure 1b,c. The micrograph shows densely packed, elongated sphere particles the majority of which are between 80 and 100 nm in size (the average particle size is ~92 nm).
3.2. Multilevel LIR of YAP: 2 mol% Dy3+
Figure 2a shows the excitation spectrum of YAP: 2 mol% Dy3+ that was obtained by observing the most intense emission attributed to the 4F9/2→6H15/2 transition (λem = 483 nm). Further, this is where the characteristic 4f intra-configurational peaks of Dy3+ ions are present at typical positions [30,31,32]: 6H15/2 → 4H11/2 + 4G9/2, 6H15/2 → 4M17/2 + 6P3/2, 6H15/2 → 4F5/2 + 4D5/2, 6H15/2 → 4I11/2 + 6P7/2 + 4M15/2 + 4I15/2, 6H15/2 → 6P3/2 + 4D3/2 + 6P5/2, 6H15/2 → 4M19/2, 6H15/2 → 4F7/2 + 4I13/2 + 4M21/2 + 4K17/2, 6H15/2 → 4G11/2, and 6H15/2 → 4I15/2 at ca. 295 nm, 330 nm, 340 nm, 353 nm, 370 nm, 380 nm, 390 nm, 430 nm, and 450 nm, respectively.
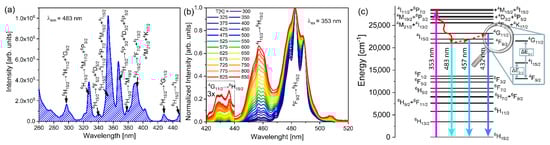
Figure 2.
(a) Excitation spectrum of YAP:2 mol% Dy3+ recorded by monitoring the 4F9/2→6H15/2 emission. (b) Temperature dependent emission spectra normalized to 4F9/2→6H15/2 transition with 420–440 nm spectral range zoomed three times. (c) Energy level diagram of Dy3+ ions with marked transitions used for LIR1 and LIR2, and the corresponding energy differences ΔE2-1, ΔE3-1 (red, dashed upwards arrows represent the thermalization process, straight upward arrow is the excitation, straight downward arrows are emissions, and the red, wavy downward arrow represents the multiphonon de-excitation process).
Upon excitation at 353 nm, the electrons rapidly de-excite to the 4I15/2 level via multiphonon relaxation where the large energy difference to the next energetically lower level prevents a further nonradiative de-excitation process. The competing effect to the multiphonon de-excitation process is thermalization, which is process by which the population of higher excited levels are achieved via the thermal energy. The ratio of the optical center population between the thermalized levels is then given by the rates of thermalization and multiphonon relaxation, which is in a steady-state regime summed up as the Boltzmann distribution, as mentioned in the introduction.
Temperature-dependent emission spectra (λex = 353 nm), measured in the 300 K to 850 K temperature range and normalized to a 4F9/2→6H15/2 transition, are shown in Figure 2b. At longer wavelengths, the emission spectra show Dy3+ 4I15/2→6H15/2 (~458 nm, blue) and 4F9/2→6H15/2 (~483 nm, blue) transitions, whereas above 600 K, the emission from the third thermalized level, 4G11/2, arises at shorter wavelengths (~430 nm, violet). In the normalized spectra, both 4I15/2→6H15/2 and 4G11/2→6H15/2 emission intensities increase with temperature, the latter at a higher rate. Energy level diagrams with indicated emissions and energy differences, ΔE2-1, ΔE3-1, are shown in Figure 2c. The levels with efficient populations via thermalization at the investigated temperature range are 4I15/2 and 4G11/2 from the 4F9/2 level.
The traditional LIR1 for Dy3+ ions was assessed by the intensity ratio of 4I15/2→6H15/2 and 4F9/2→6H15/2 transitions, with an energy difference of ΔE2-1 (Figure 2c). As shown in reference [18], the emission from the third thermalized level, 4G11/2, can be used for LIR2 to overcome the limitation of sensitivity obtained by LIR1, as ΔE3-1 is substantially larger than ΔE2-1.
The fits to Equation (1) are shown in Figure 3a (LIR1) and Figure 3b (LIR2). The high fit quality proves that thermalization is effective and follows a Boltzmann distribution, for both LIR1 and LIR2. As SR (Equation (2)) depends only on the energy difference between levels at a given temperature, the improvement in relative sensitivity for LIR2 in comparison to the traditional, two-thermalized levels LIR1, is linearly proportional to the ratio of the energy difference. The obtained SR values for LIR1 and LIR2 (Figure 3c) decreased with temperature, as Equation (2) predicts, and the relative sensitivity of LIR2 outperforms that of LIR1 by approximately two times at high temperatures. Alas, the approach using the third, higher energy level has its temperature limitations—those at which the emission intensity is not significant enough to be utilized for luminescence thermometry (lower temperature limit) and those at which temperature quenching of the corresponding emissions starts (upper temperature limit). In Dy3+- activated YAP, the lower temperature limit for LIR2 was ~600 K where the calculated SR values have the maximum of 0.41% K−1 (LIR1) and 0.86% K−1 (LIR2) (Figure 3c). Additionally, another limitation is the choice of host materials—temperature quenching should not start before higher excited levels are thermalized; thus, hosts can only be materials that are chemically stable at higher temperatures (such as yttria-stabilized zirconia, vanadates, garnets, silicates, and phosphates) [33,34,35,36]. At 850 K the emission intensity from the highest thermalized level was still increasing. Unfortunately, we could not reach the upper temperature limit for this luminescent thermometer probe due to the limitations of our heating stage.
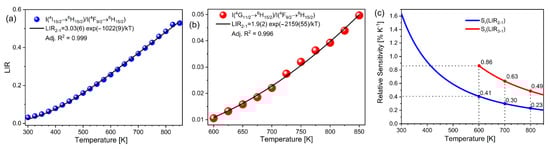
Figure 3.
Temperature dependent (a) LIR1; (b) LIR2 (note: uncertainties are proportional to the point size); and (c) SR values obtained by LIR1 and LIR2 temperature readouts.
The comparison of the performance of YAP:Dy3+ with other probes that include the thermalization of the 3rd excited level for LIR is given in Table 2. The more extensive comparison of LIR2 and sensitivities for Er3+ and Dy3+ ions can be found in the literature where the values were obtained theoretically for many hosts from the Judd–Ofelt theory [37,38], while Table 2 only presents and compares the values obtained experimentally. Sr values in Table 2 are given in a format that allows comparisons at all temperatures. The comparison at a single temperature for all the probe materials was not possible as they were investigated at different temperature ranges. Thus, the relative sensitivities are given in the form of (ΔE/k)/T2, for the reported values of ΔE in the corresponding literature. As the energy level difference between the 4f levels of lanthanides is approximately host independent, and the relative sensitivity of LIR depends solely on the energy difference between the emitting levels, it is no surprise that the YAP:Dy3+ shows similar performance to the other Dy3+ investigated probes and also a larger sensitivity than other ions. All three Dy3+- activated hosts seen in Table 2, CaWO4, YAG, and YAP can be used for high-temperature measurements and assessment of the ultra-high temperature sensing capabilities as well as in a true comparison.
Table 2.
Comparison of luminescence thermometry sensor probes that employ the energetically higher thermalized level. The relative sensitivities are given in the form of (ΔE/k)/T2. Only the experimentally obtained values were taken into consideration.
4. Conclusions
In this study, three-level luminescence thermometry with Dy3+- activated YAP was investigated in order to overcome the sensitivity limitations of Boltzmann thermometers and to obtain a greater relative sensitivity for the LIR readout at high temperatures. As the relative sensitivity at a given temperature is linearly proportional to the ratio of the energy difference, an improvement of approximately two times the relative sensitivity for three-thermalized levels of LIR in comparison to the traditional, two-thermalized levels of LIR is obtained at high temperatures. Three-level thermometry with a higher sensitivity could be used in the following temperature range: beyond temperatures where traditional LIR shows extremely low sensitivity and below the working temperatures of lifetime-based luminescent thermometers. However, the thermometry is limited to the hosts that are chemically stable at high temperatures and to a temperature range in which temperature quenching does not begin prior to the thermalization of higher excited levels.
Author Contributions
Study, conception, and design: M.D.D. and A.Ć. Material preparation: J.P. Data collection: J.P., A.Ć., I.Z., and M.S. Analysis: J.P., A.Ć., V.Đ. and Ž.A. Visualization: J.P., A.Ć. and V.Đ. The first draft of the manuscript: J.P. and Ž.A. Final manuscript: Ž.A., A.Ć. and M.D.D. Supervision: M.D.D. All authors have read and agreed to the published version of the manuscript.
Funding
This research was funded by the Ministry of Education, Science and Technological Development of the Republic of Serbia.
Institutional Review Board Statement
Not applicable.
Informed Consent Statement
Not applicable.
Data Availability Statement
The data presented in this study are available on request from the corresponding author.
Conflicts of Interest
The authors declare no conflict of interest.
References
- Brites, C.D.S.; Balabhadra, S.; Carlos, L.D. Lanthanide-Based Thermometers: At the Cutting-Edge of Luminescence Thermometry. Adv. Opt. Mater. 2018, 7, 1801239. [Google Scholar] [CrossRef]
- Suta, M.; Meijerink, A. A Theoretical Framework for Ratiometric Single Ion Luminescent Thermometers—Thermodynamic and Kinetic Guidelines for Optimized Performance. Adv. Theory Simul. 2020, 3, 2000176. [Google Scholar] [CrossRef]
- Dramićanin, M.D. Trends in luminescence thermometry. J. Appl. Phys. 2020, 128, 040902. [Google Scholar] [CrossRef]
- Stefanska, J.; Marciniak, L. Single-Band Ratiometric Luminescent Thermometry Using Pr3+ Ions Emitting in Yellow and Red Spectral Ranges. Adv. Photonics Res. 2021, 2, 2100070. [Google Scholar] [CrossRef]
- Mykhaylyk, V.; Kraus, H.; Zhydachevskyy, Y.; Tsiumra, V.; Luchechko, A.; Wagner, A.; Suchocki, A. Multimodal Non-Contact Luminescence Thermometry with Cr-Doped Oxides. Sensors 2020, 20, 5259. [Google Scholar] [CrossRef] [PubMed]
- Allison, S.W.; Beshears, D.L.; Cates, M.R.; Scudiere, M.B.; Shaw, D.W.; Ellis, A.D. Luminescence of YAG:Dy and YAG:Dy,Er crystals to 1700 °C. Meas. Sci. Technol. 2020, 31, 044001. [Google Scholar] [CrossRef]
- Bednarkiewicz, A.; Marciniak, L.; Carlos, L.D.; Jaque, D. Standardizing luminescence nanothermometry for biomedical applications. Nanoscale 2020, 12, 14405–14421. [Google Scholar] [CrossRef]
- Ximendes, E.; Marin, R.; Carlos, L.D.; Jaque, D. Less is more: Dimensionality reduction as a general strategy for more precise luminescence thermometry. Light Sci. Appl. 2022, 11, 237. [Google Scholar] [CrossRef]
- Morey, W.W.; Glenn, W.H.; Snitzer, E. Fiber Optic Temperature Sensor. Instrum. Aerosp. Ind. 1983, 29, 261–274. [Google Scholar]
- Thiem, J.; Spelthann, S.; Neumann, L.; Jakobs, F.; Johannes, H.-H.; Kowalsky, W.; Kracht, D.; Neumann, J.; Ruehl, A.; Ristau, D. Upconversion Nanocrystal Doped Polymer Fiber Thermometer. Sensors 2020, 20, 6048. [Google Scholar] [CrossRef]
- Venturini, F.; Baumgartner, M.; Borisov, S. Mn4+-Doped Magnesium Titanate—A Promising Phosphor for Self-Referenced Optical Temperature Sensing. Sensors 2018, 18, 668. [Google Scholar] [CrossRef] [PubMed]
- Sposito, A.; Heaps, E.; Sutton, G.; Machin, G.; Bernard, R.; Clarke, S. Phosphor thermometry for nuclear decommissioning and waste storage. Nucl. Eng. Des. 2021, 375, 111091. [Google Scholar] [CrossRef]
- Dramićanin, M. Schemes for Temperature Read-Out From Luminescence. In Luminescence Thermometry; Elsevier: Amsterdam, The Netherlands, 2018; pp. 63–83. [Google Scholar]
- Swieten, T.P.; Yu, D.; Yu, T.; Vonk, S.J.W.; Suta, M.; Zhang, Q.; Meijerink, A.; Rabouw, F.T. A Ho3+ -Based Luminescent Thermometer for Sensitive Sensing over a Wide Temperature Range. Adv. Opt. Mater. 2021, 9, 2001518. [Google Scholar] [CrossRef]
- Kolesnikov, I.E.; Afanaseva, E.V.; Kurochkin, M.A.; Vaishlia, E.I.; Kolesnikov, E.Y.; Lähderanta, E. Dual-center co-doped and mixed ratiometric LuVO4:Nd3+/Yb 3+ nanothermometers. Nanotechnology 2022, 33, 165504. [Google Scholar] [CrossRef]
- Geitenbeek, R.G.; De Wijn, H.W.; Meijerink, A. Non-Boltzmann Luminescence in NayF4:Eu3+: Implications for Luminescence Thermometry. Phys. Rev. Appl. 2018, 10, 1. [Google Scholar] [CrossRef]
- Wade, S.A.; Collins, S.F.; Baxter, G.W. Fluorescence intensity ratio technique for optical fiber point temperature sensing. J. Appl. Phys. 2003, 94, 4743. [Google Scholar] [CrossRef]
- Li, L.; Qin, F.; Zhou, Y.; Zheng, Y.; Miao, J.; Zhang, Z. Three-energy-level-cascaded strategy for a more sensitive luminescence ratiometric thermometry. Sens. Actuators A Phys. 2020, 304, 111864. [Google Scholar] [CrossRef]
- Ćirić, A.; Periša, J.; Zeković, I.; Antić, Ž.; Dramićanin, M.D. Multilevel-cascade intensity ratio temperature read-out of Dy3+ luminescence thermometers. J. Lumin. 2022, 245, 118795. [Google Scholar] [CrossRef]
- Tian, X.; Wei, X.; Chen, Y.; Duan, C.; Yin, M. Temperature sensor based on ladder-level assisted thermal coupling and thermal-enhanced luminescence in NaYF4:Nd3+. Opt. Express 2014, 22, 30333. [Google Scholar] [CrossRef]
- Ćirić, A.; Aleksić, J.; Barudžija, T.; Antić, Ž.; Đorđević, V.; Medić, M.; Periša, J.; Zeković, I.; Mitrić, M.; Dramićanin, M.D. Comparison of three ratiometric temperature readings from the Er3+ upconversion emission. Nanomaterials 2020, 10, 627. [Google Scholar] [CrossRef]
- Yu, D.; Li, H.; Zhang, D.; Zhang, Q.; Meijerink, A.; Suta, M. One ion to catch them all: Targeted high-precision Boltzmann thermometry over a wide temperature range with Gd3+. Light Sci. Appl. 2021, 10, 236. [Google Scholar] [CrossRef] [PubMed]
- Chepyga, L.M.; Osvet, A.; Brabec, C.J.; Batentschuk, M. High-temperature thermographic phosphor mixture YAP/YAG:Dy3+ and its photoluminescence properties. J. Lumin. 2017, 188, 582–588. [Google Scholar] [CrossRef]
- Chambers, M.D.; Clarke, D.R. Doped Oxides for High-Temperature Luminescence and Lifetime Thermometry. Annu. Rev. Mater. Res. 2009, 39, 325–359. [Google Scholar] [CrossRef]
- Trajić, J.; Rabasović, M.S.; Savić-Šević, S.; Ševic, D.; Babić, B.; Romčević, M.; Ristić-Djurović, J.L.; Paunović, N.; Križan, J.; Romčević, N. Far-infrared spectra of dysprosium doped yttrium aluminum garnet nanopowder. Infrared Phys. Technol. 2016, 77, 226–229. [Google Scholar] [CrossRef]
- Pechini, M. Method of Preparing Lead and Alkaline Earth Titanates and Niobates and Coating Method Using the Same to Form a Capacitor 1967. U.S. Patent 3,330,697, 11 July 1967. [Google Scholar]
- Ćirić, A.; Stojadinović, S.; Dramićanin, M.D. Custom-built thermometry apparatus and luminescence intensity ratio thermometry of ZrO2:Eu3+ and Nb2O5:Eu3+. Meas. Sci. Technol. 2019, 30, 045001. [Google Scholar] [CrossRef]
- Shannon, R.D. Revised effective ionic radii and systematic studies of interatomic distances in halides and chalcogenides. Acta Crystallogr. Sect. A 1976, 32, 751–767. [Google Scholar] [CrossRef]
- Ross, N.; Zhao, J.; Angel, R. High-pressure single-crystal X-ray diffraction study of YAlO3 perovskite. J. Solid State Chem. 2004, 177, 1276–1284. [Google Scholar] [CrossRef]
- Carnall, W.T.; Fields, P.R.; Rajnak, K. Electronic Energy Levels in the Trivalent Lanthanide Aquo Ions. I. Pr 3+, Nd 3+, Pm 3+, Sm 3+, Dy 3+, Ho 3+, Er 3+ and Tm 3+. J. Chem. Phys. 1968, 49, 4424–4442. [Google Scholar] [CrossRef]
- Carnall, W.T.; Crosswhite, H.; Crosswhite, H.M. Energy Level Structure and Transition Probabilities in the Spectra of the Trivalent Lanthanides in LaF₃; Argonne: Lemont, IL, USA, 1978. [Google Scholar]
- Ćirić, A.; Stojadinović, S. Photoluminescence of ZrO2:Gd3+ and ZrO2:Dy3+ coatings formed by the plasma electrolytic oxidation. J. Alloys Compd. 2020, 832, 154907. [Google Scholar] [CrossRef]
- Ćirić, A.; Stojadinović, S.; Dramićanin, M.D. Time-integrated luminescence thermometry of Eu3+ and Dy3+ doped YVO4. Sens. Actuators A Phys. 2019, 295, 450–455. [Google Scholar] [CrossRef]
- Cates, M.R. YAG:Dy and YAG:Tm Fluorescence Above 1400 C.; Department of Energy: Oak Ridge, TN, USA, 2003. [Google Scholar]
- Ishiwada, N.; Tsuchiya, K.; Yokomori, T. Applicability of Dy-doped yttrium aluminum garnet (YAG:Dy) in phosphor thermometry at different oxygen concentrations. J. Lumin. 2019, 208, 82–88. [Google Scholar] [CrossRef]
- Skinner, S.J.; Feist, J.P.; Brooks, I.J.E.; Seefeldt, S.; Heyes, A.L. YAG:YSZ composites as potential thermographic phosphors for high temperature sensor applications. Sens. Actuators B Chem. 2009, 136, 52–59. [Google Scholar] [CrossRef]
- Ćirić, A.; Gavrilović, T.; Dramićanin, M.D. Luminescence Intensity Ratio Thermometry with Er3+: Performance Overview. Crystals 2021, 11, 189. [Google Scholar] [CrossRef]
- Martinović, A.; Dramićanin, M.D.; Ćirić, A. Modeling the Performance of Dy3+-Based Boltzmann Thermometers by the Judd–Ofelt Theory. Adv. Theory Simul. 2022, 5, 2200029. [Google Scholar] [CrossRef]
Publisher’s Note: MDPI stays neutral with regard to jurisdictional claims in published maps and institutional affiliations. |
© 2022 by the authors. Licensee MDPI, Basel, Switzerland. This article is an open access article distributed under the terms and conditions of the Creative Commons Attribution (CC BY) license (https://creativecommons.org/licenses/by/4.0/).