


Video-Based Hand Movement Analysis of Parkinson Patients before and after Medication Using High-Frame-Rate Videos and MediaPipe

 , ,
, ,  and
and
Abstract
1. Introduction
2. Materials and Methods
2.1. Participants
2.2. Accelerometer Data Recording
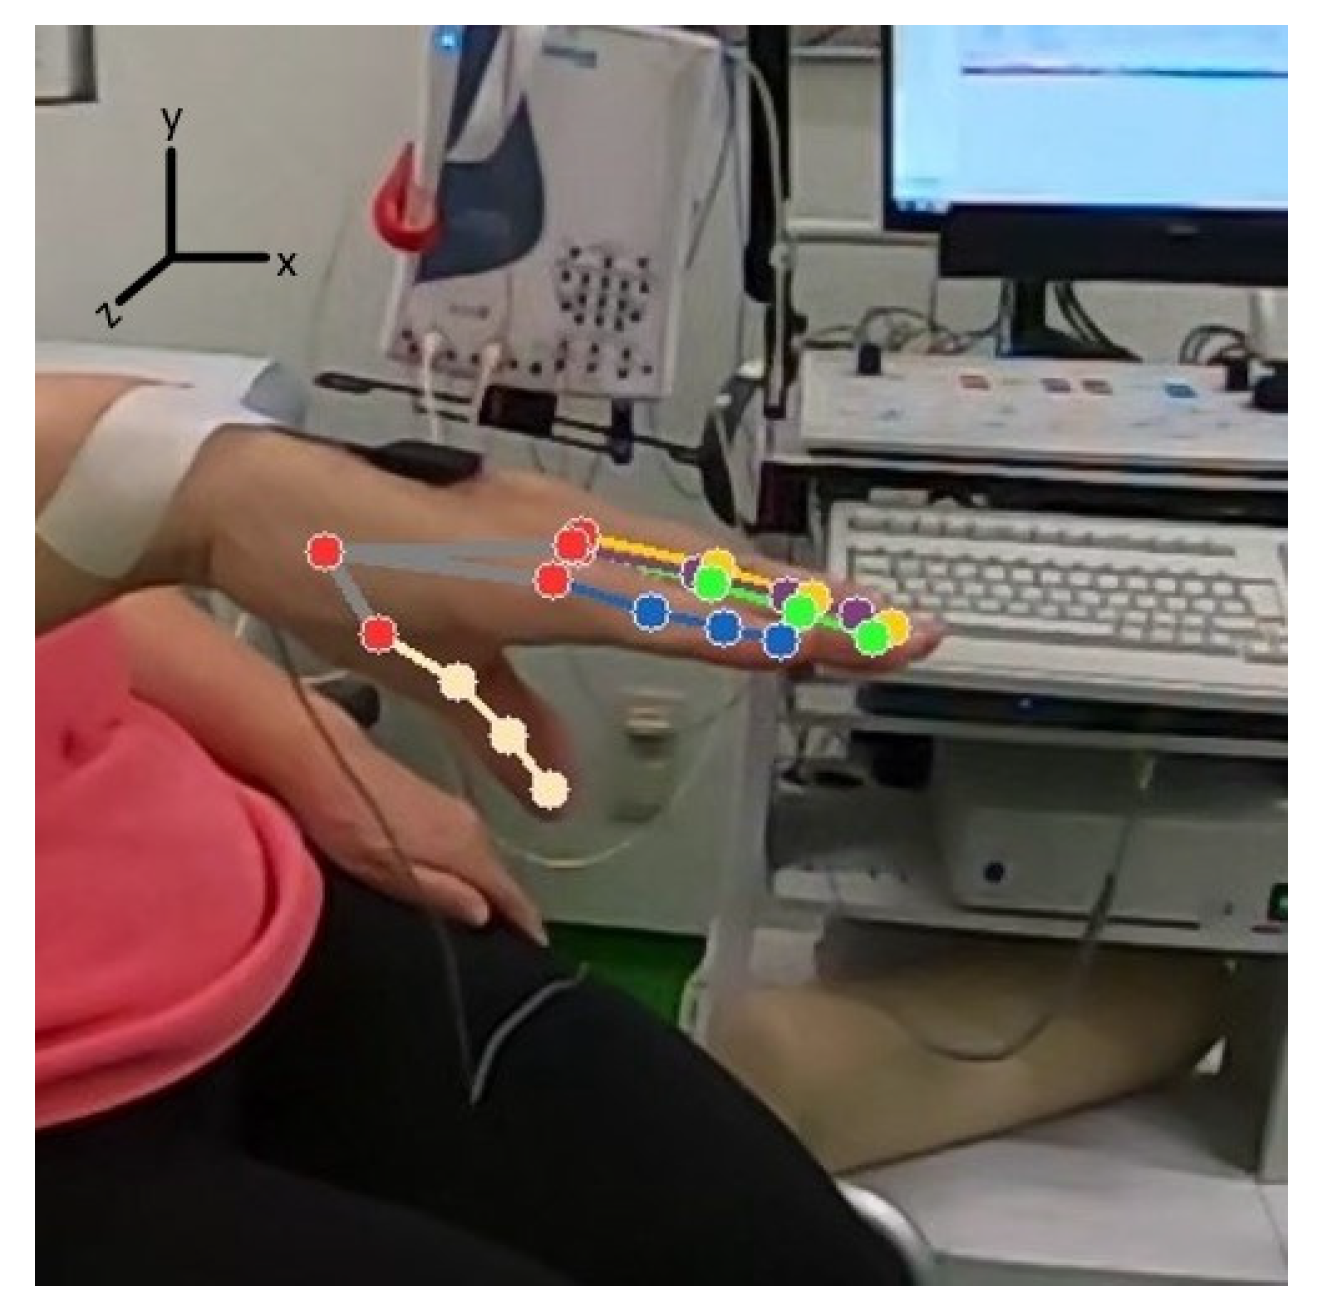
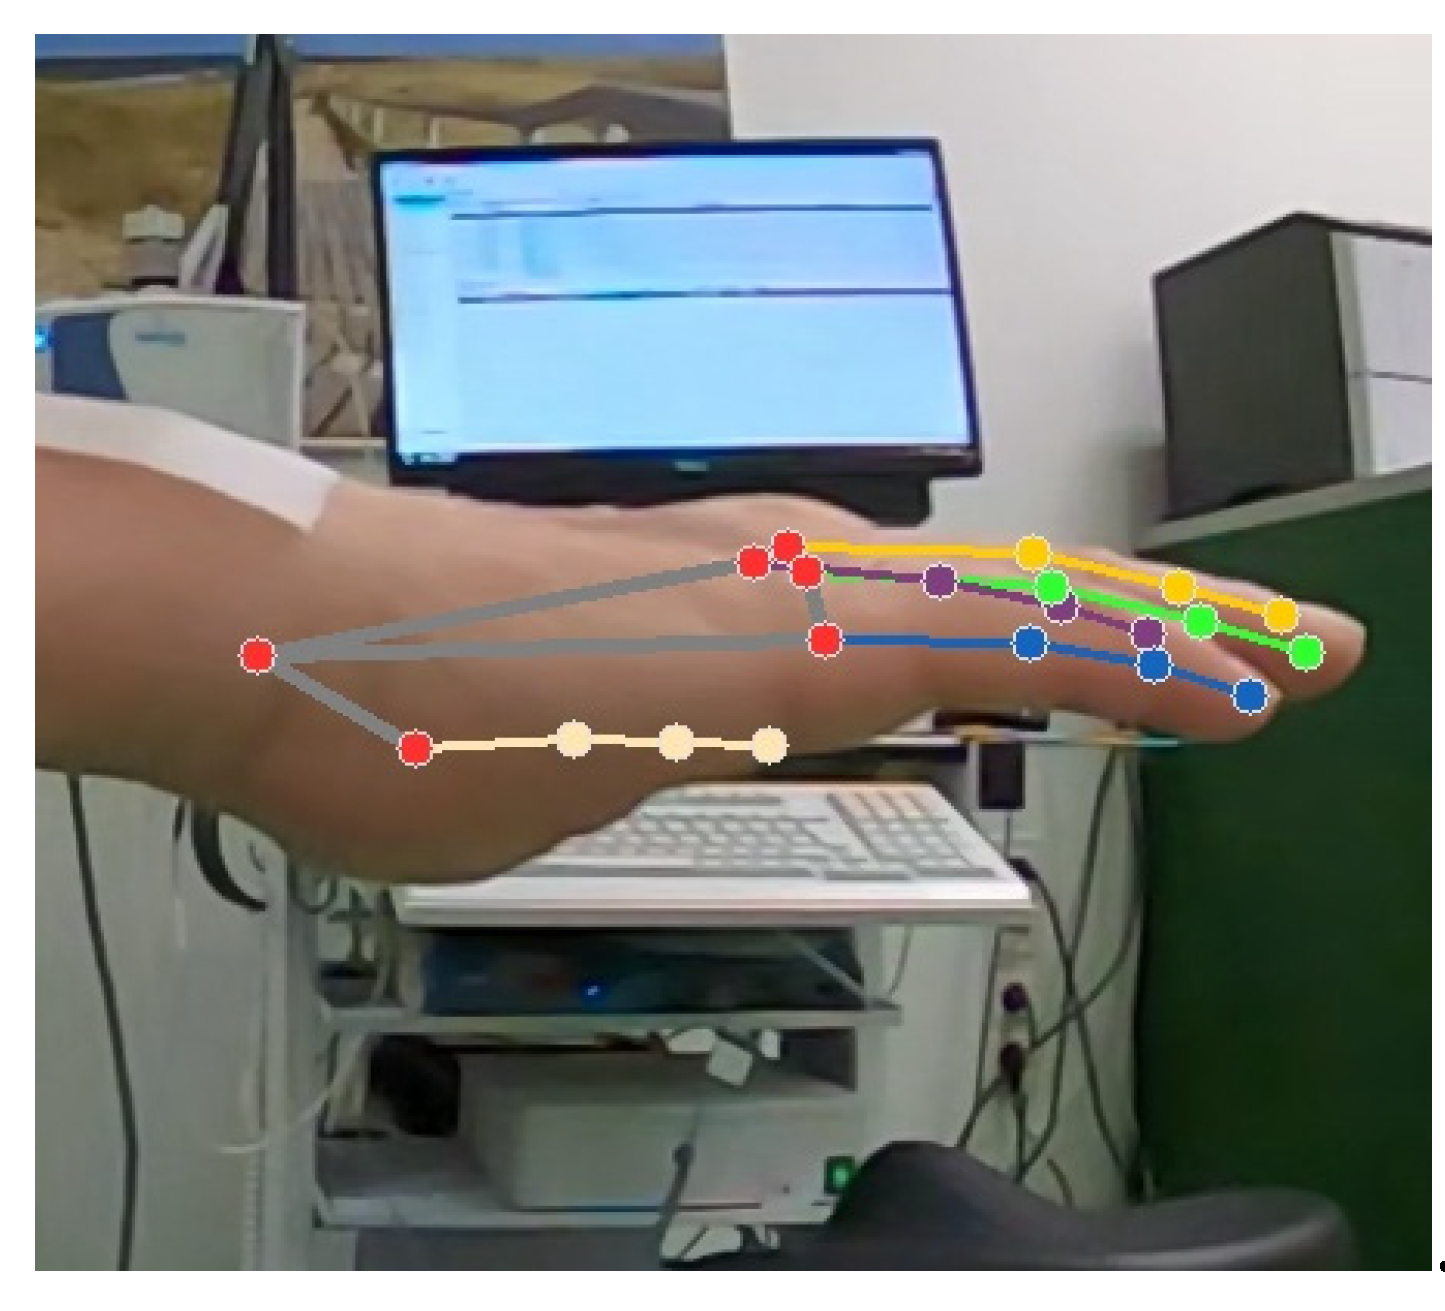
2.3. Video Recording
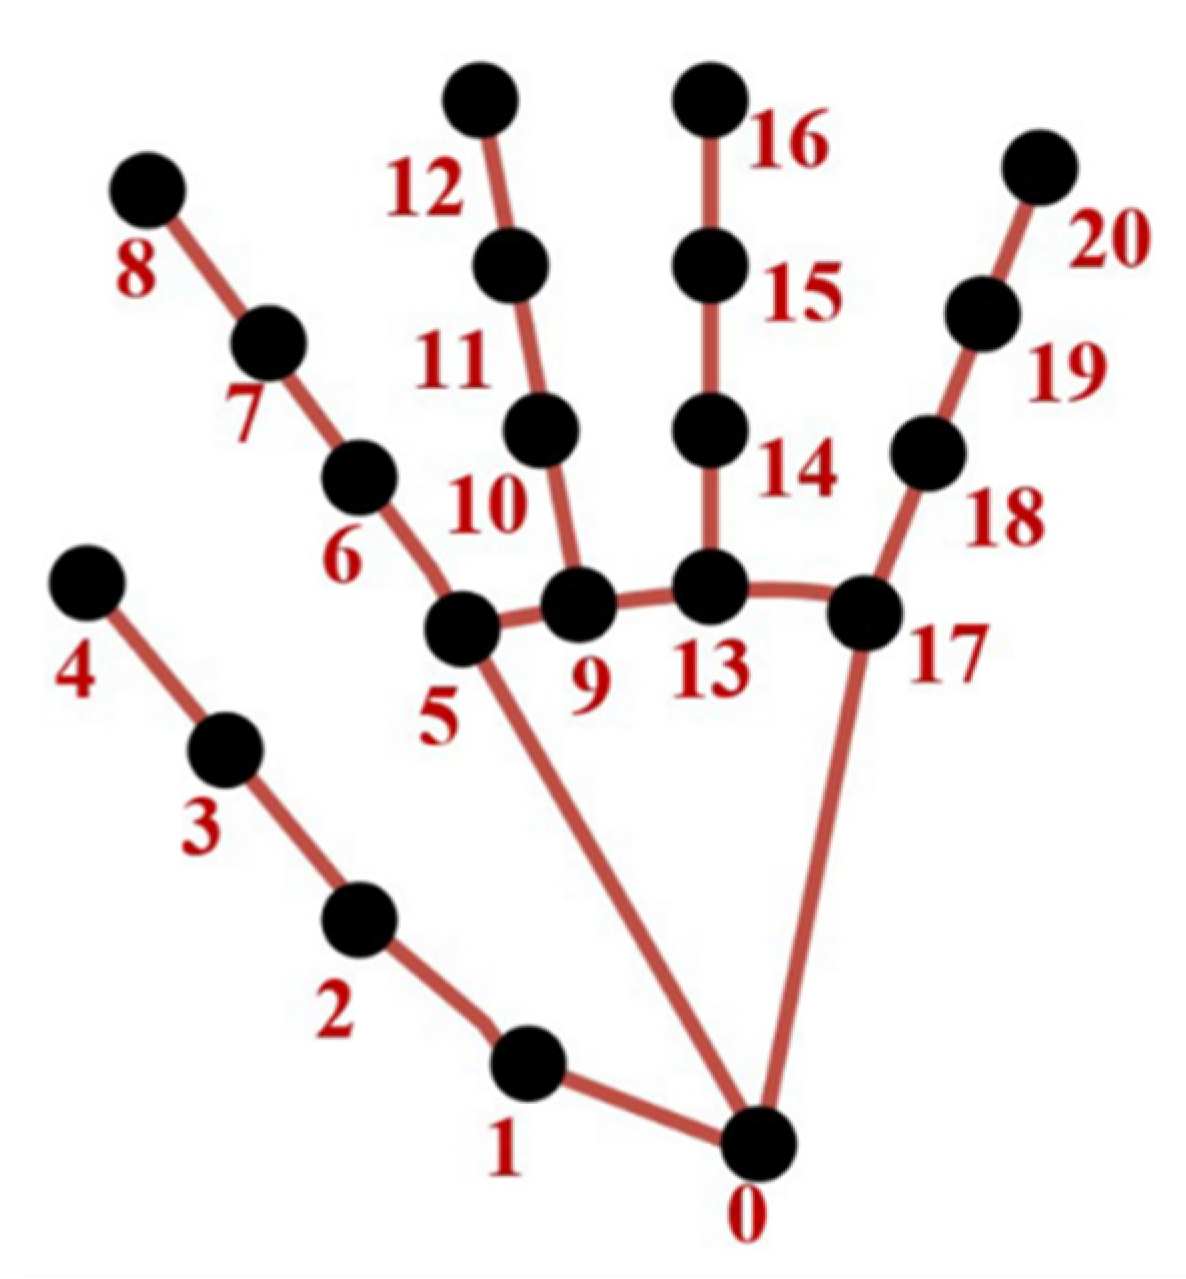
2.4. Data Extraction and Processing
3. Results
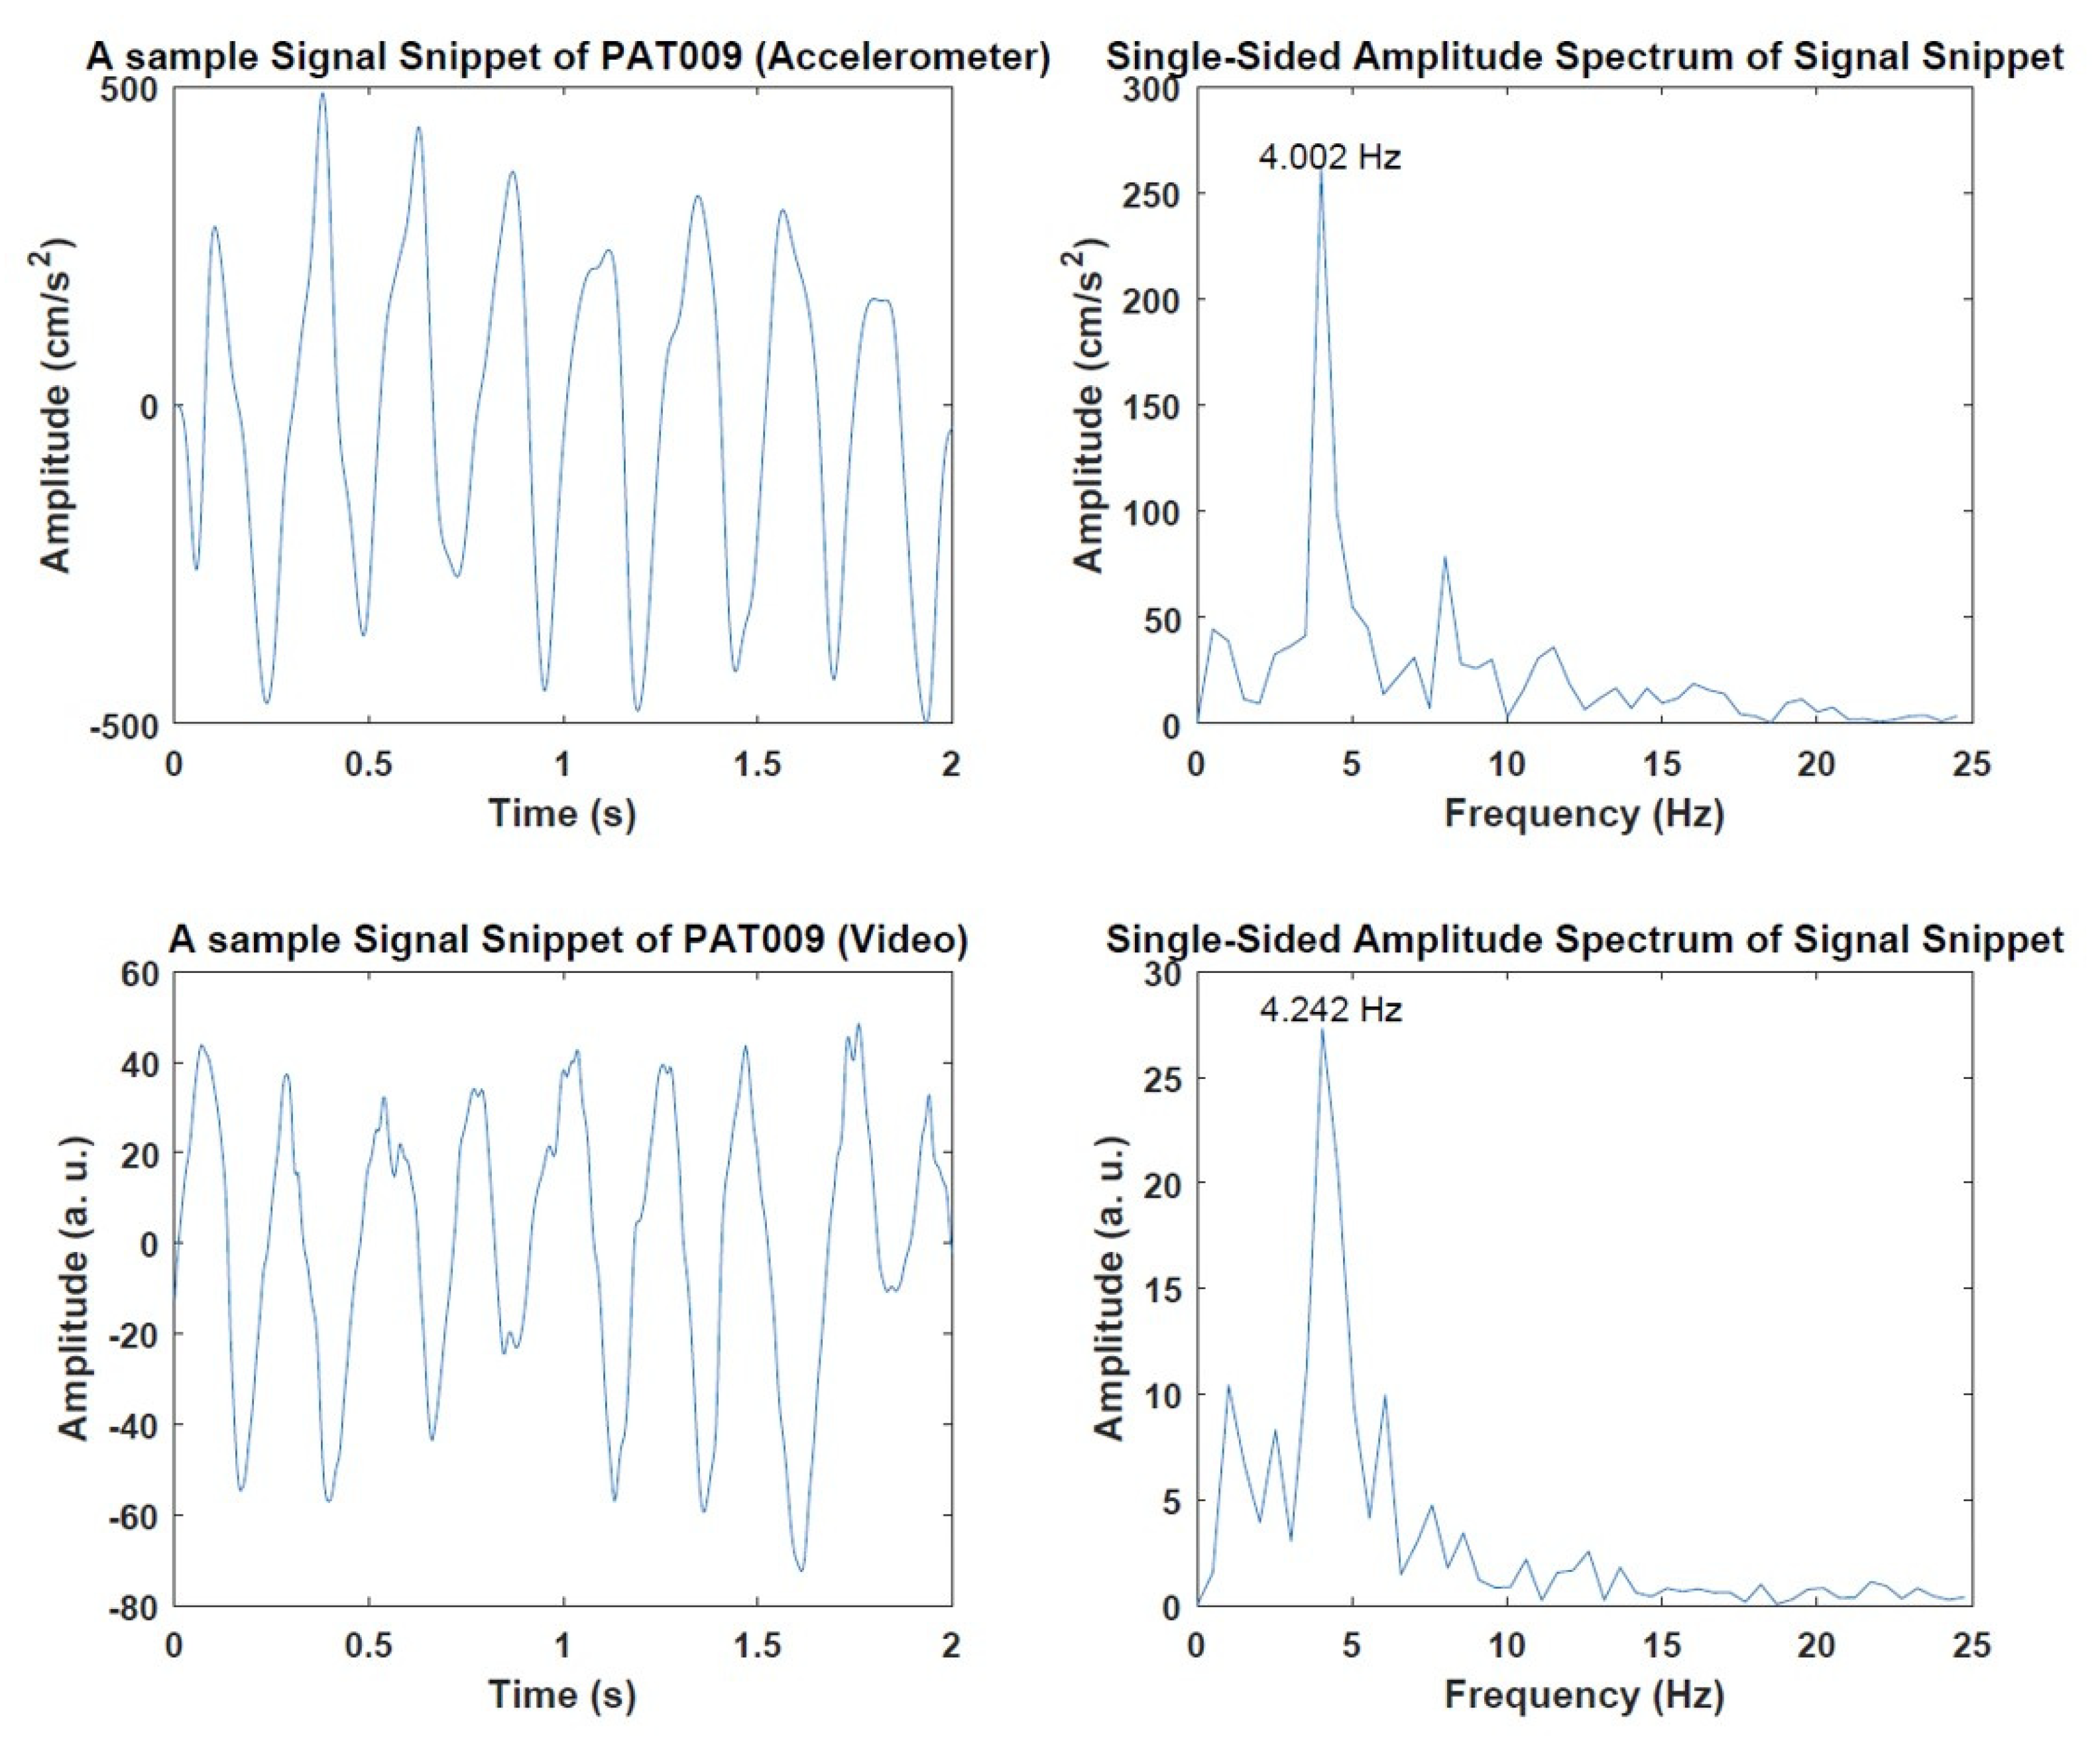
3.1. Preliminary Results of Video and Accelerometer Data
3.2. Video and AccelerometerAnalysis Results
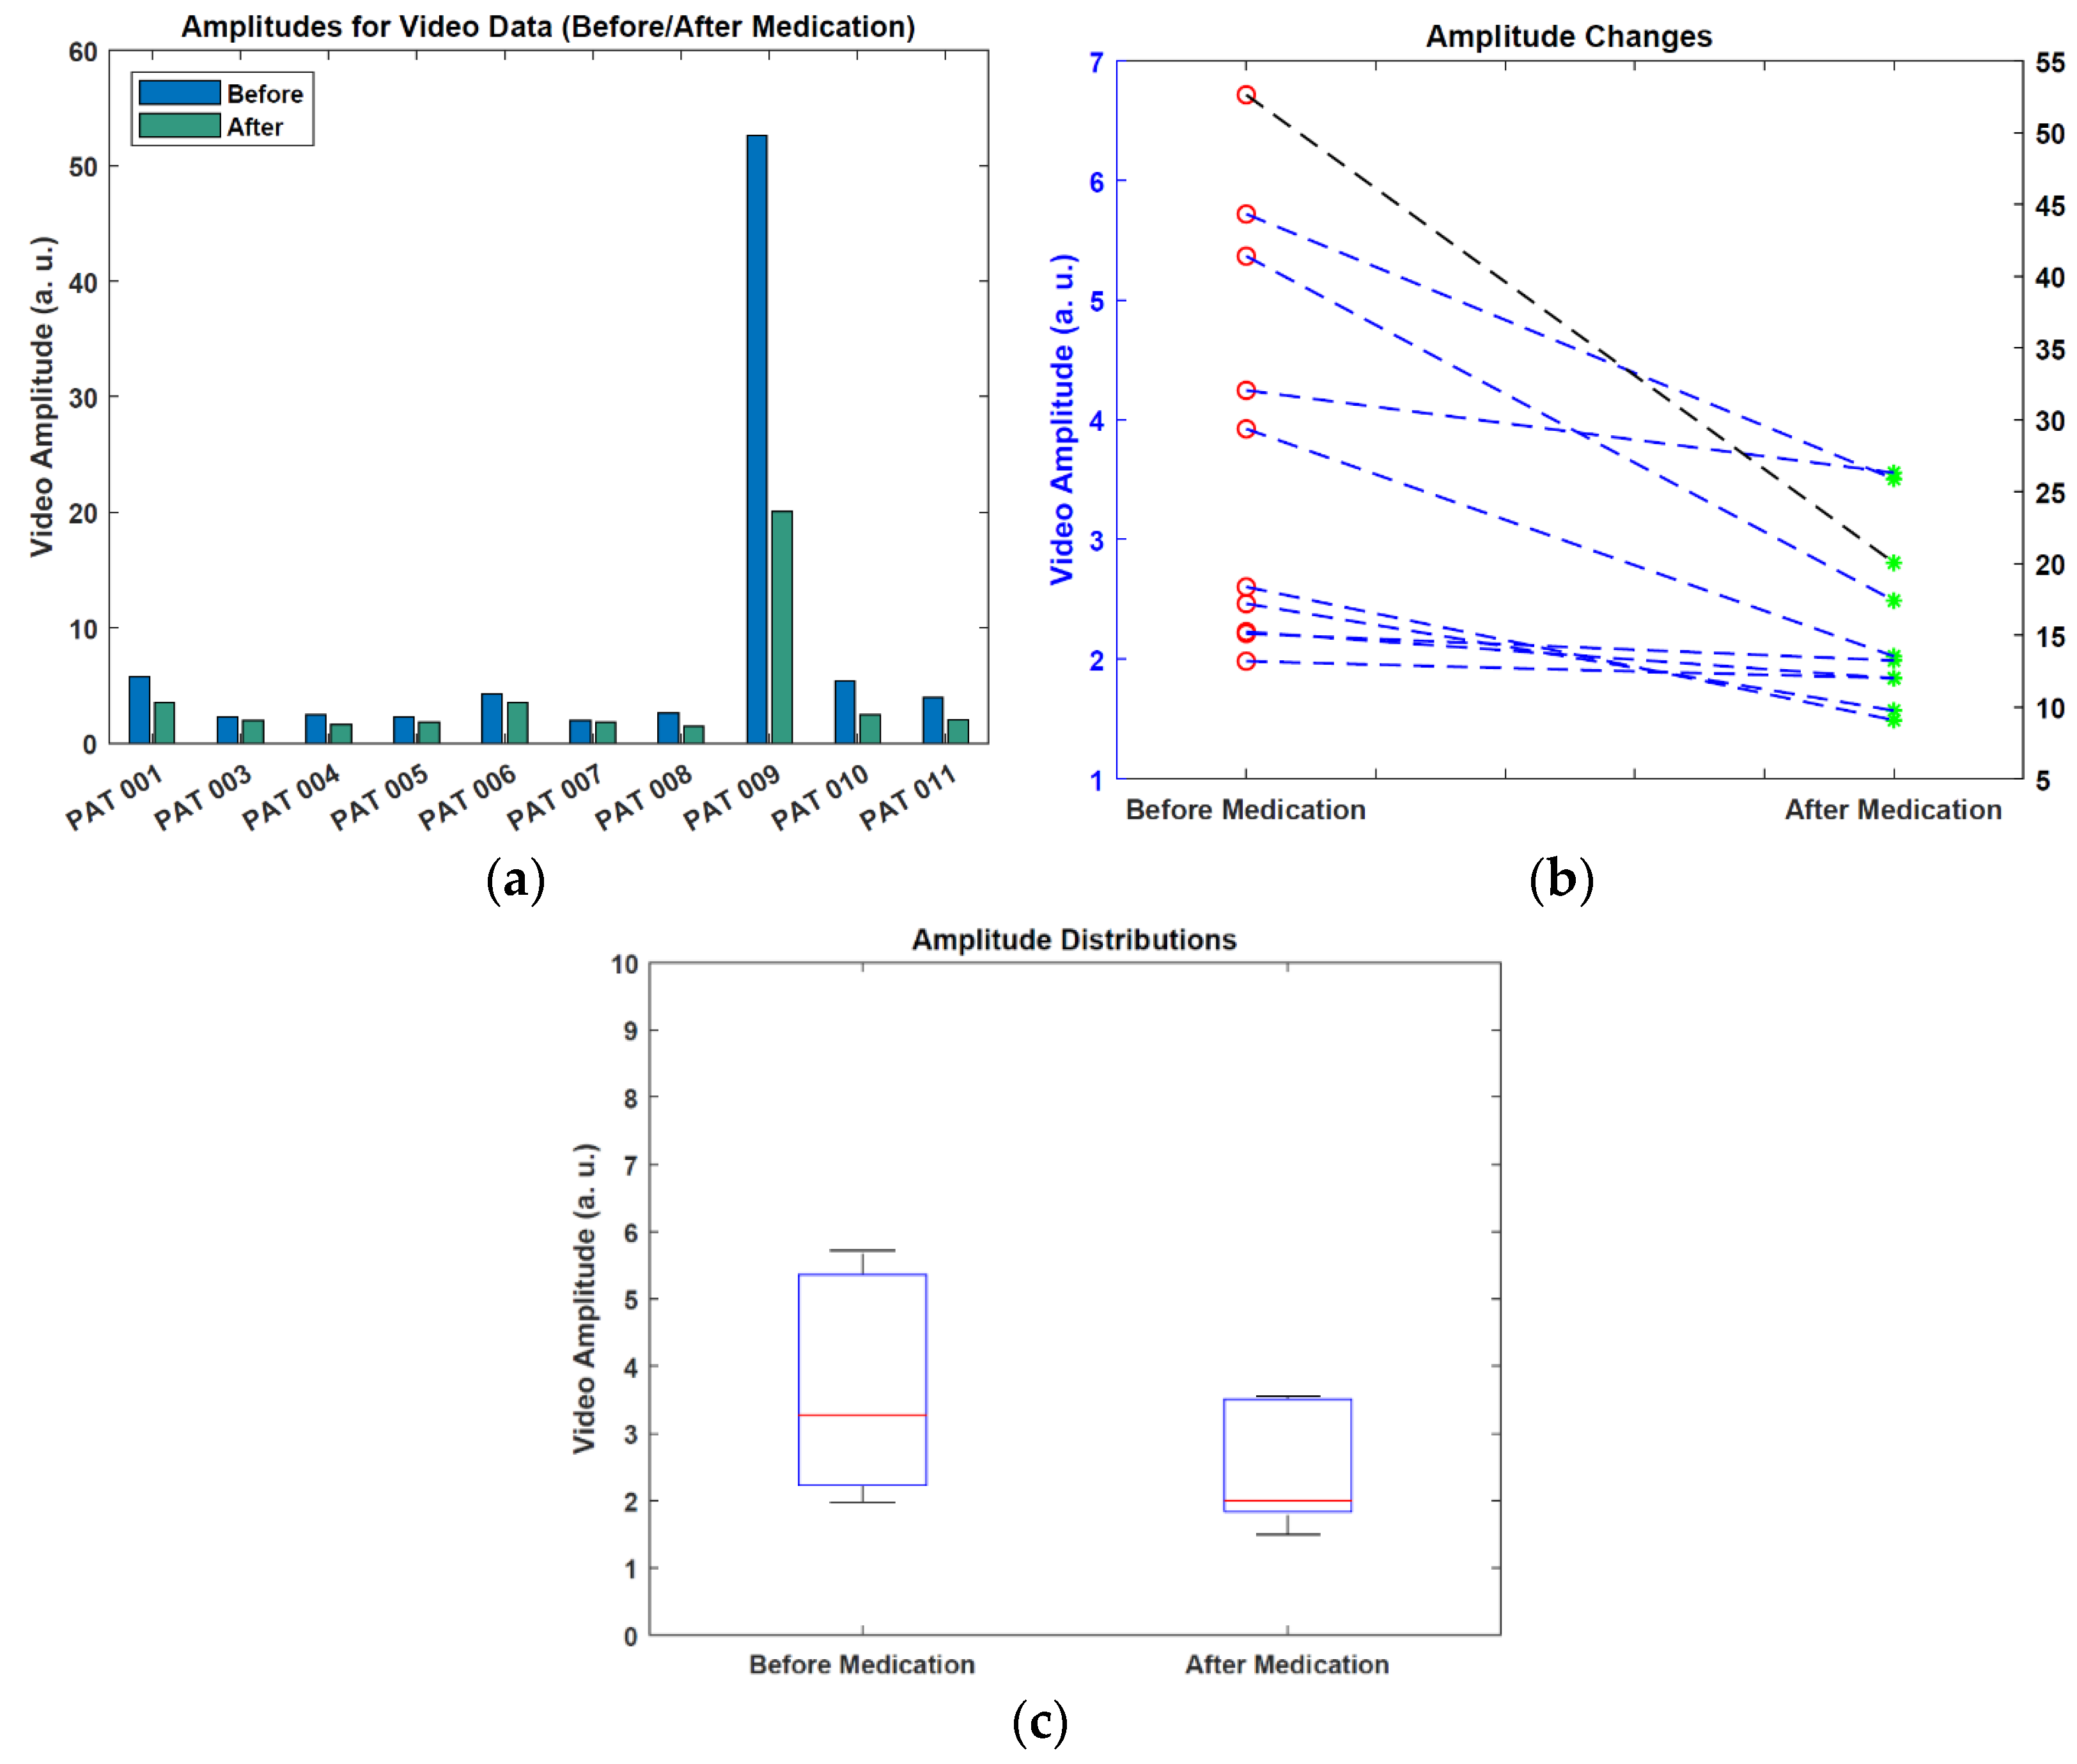
3.3. Video before/after Medication Analysis Results
4. Discussion
5. Conclusions
Author Contributions
Funding
Institutional Review Board Statement
Informed Consent Statement
Data Availability Statement
Acknowledgments
Conflicts of Interest
References
- Parkinson, J. An Essay on the Shaking Palsy, 1817. J. Neuropsychiatry Clin. Neurosci. 2002, 14, 223–236. [Google Scholar] [CrossRef] [PubMed]
- Oertel, W.; Schulz, J.B. Current and Experimental Treatments of Parkinson Disease: A Guide for Neuroscientists. J. Neurochem. 2016, 139, 325–337. [Google Scholar] [CrossRef] [PubMed]
- Ray Dorsey, E.; Elbaz, A.; Nichols, E.; Abd-Allah, F.; Abdelalim, A.; Adsuar, J.C.; Ansha, M.G.; Brayne, C.; Choi, J.Y.J.; Collado-Mateo, D.; et al. Global, Regional, and National Burden of Parkinson’s Disease, 1990–2016: A Systematic Analysis for the Global Burden of Disease Study 2016. Lancet Neurol. 2018, 17, 939–953. [Google Scholar] [CrossRef]
- Hughes, A.J.; Lees, A.J.; Daniel, S.E.; Blankson, S. A Clinicopathologic Study of 100 Cases of Parkinson’s Disease. Arch. Neurol. 1993, 50, 140–148. [Google Scholar] [CrossRef] [PubMed]
- Goetz, C.G.; Tilley, B.C.; Shaftman, S.R.; Stebbins, G.T.; Fahn, S.; Martinez-Martin, P.; Poewe, W.; Sampaio, C.; Stern, M.B.; Dodel, R.; et al. Movement Disorder Society-Sponsored Revision of the Unified Parkinson’s Disease Rating Scale (MDS-UPDRS): Scale Presentation and Clinimetric Testing Results. Mov. Disord. 2008, 23, 2129–2170. [Google Scholar] [CrossRef] [PubMed]
- Vial, F.; Kassavetis, P.; Merchant, S.; Haubenberger, D.; Hallett, M. How to Do an Electrophysiological Study of Tremor. Clin. Neurophysiol. Pract. 2019, 4, 134–142. [Google Scholar] [CrossRef] [PubMed]
- Chandrabhatla, A.S.; Pomeraniec, I.J.; Ksendzovsky, A. Co-Evolution of Machine Learning and Digital Technologies to Improve Monitoring of Parkinson’s Disease Motor Symptoms. Npj Digit. Med. 2022, 5, 32. [Google Scholar] [CrossRef] [PubMed]
- Gopal, A.; Hsu, W.Y.; Allen, D.D.; Bove, R. Remote Assessments of Hand Function in Neurological Disorders: Systematic Review. JMIR Rehabil. Assist. Technol. 2022, 9, e33157. [Google Scholar] [CrossRef] [PubMed]
- López-Blanco, R.; Velasco, M.A.; Méndez-Guerrero, A.; Romero, J.P.; del Castillo, M.D.; Serrano, J.I.; Rocon, E.; Benito-León, J. Smartwatch for the Analysis of Rest Tremor in Patients with Parkinson’s Disease. J. Neurol. Sci. 2019, 401, 37–42. [Google Scholar] [CrossRef] [PubMed]
- Varghese, J.; Niewöhner, S.; Soto-Rey, I.; Schipmann-Miletić, S.; Warneke, N.; Warnecke, T.; Dugas, M. A Smart Device System to Identify New Phenotypical Characteristics in Movement Disorders. Front. Neurol. 2019, 10, 48. [Google Scholar] [CrossRef] [PubMed]
- Wile, D.J.; Ranawaya, R.; Kiss, Z.H.T. Smart Watch Accelerometry for Analysis and Diagnosis of Tremor. J. Neurosci. Methods 2014, 230, 1–4. [Google Scholar] [CrossRef] [PubMed]
- Lemoyne, R.; Tomycz, N.; Mastroianni, T.; McCandless, C.; Cozza, M.; Peduto, D. Implementation of a Smartphone Wireless Accelerometer Platform for Establishing Deep Brain Stimulation Treatment Efficacy of Essential Tremor with Machine Learning. In Proceedings of the 2015 37th Annual International Conference of the IEEE Engineering in Medicine and Biology Society (EMBC), Milan, Italy, 25–29 August 2015; pp. 6772–6775. [Google Scholar]
- Bazgir, O.; Habibi, S.A.H.; Palma, L.; Pierleoni, P.; Nafees, S. A Classification System for Assessment and Home Monitoring of Tremor in Patients with Parkinson’s Disease. J. Med. Signals Sens. 2018, 8, 65–72. [Google Scholar] [CrossRef] [PubMed]
- Araújo, R.; Tábuas-Pereira, M.; Almendra, L.; Ribeiro, J.; Arenga, M.; Negrão, L.; Matos, A.; Morgadinho, A.; Januário, C. Tremor Frequency Assessment by IPhone® Applications: Correlation with EMG Analysis. J. Park. Dis. 2016, 6, 717–721. [Google Scholar] [CrossRef] [PubMed]
- Antink, C.H.; Lyra, S.; Paul, M.; Yu, X.; Leonhardt, S. A Broader Look: Camera-Based Vital Sign Estimation across the Spectrum. Yearb. Med. Inform. 2019, 28, 102–114. [Google Scholar] [CrossRef] [PubMed]
- Paul, M.; Karthik, S.; Joseph, J.; Sivaprakasam, M.; Kumutha, J.; Leonhardt, S.; Hoog Antink, C. Non-Contact Sensing of Neonatal Pulse Rate Using Camera-Based Imaging: A Clinical Feasibility Study. Physiol. Meas. 2020, 41, 024001. [Google Scholar] [CrossRef] [PubMed]
- Uhríková, Z.; Šprdlík, O.; Hlaváč, V.; Růžička, E. Action Tremor Analysis from Ordinary Video Sequence. In Proceedings of the 31st Annual International Conference of the IEEE Engineering in Medicine and Biology Society: Engineering the Future of Biomedicine, Minneapolis, MN, USA, 3–6 September 2009; pp. 6123–6126. [Google Scholar]
- Pintea, S.L.; Zheng, J.; Li, X.; Bank, P.J.M.; van Hilten, J.J.; van Gemert, J.C. Hand-Tremor Frequency Estimation in Videos. In Computer Vision—ECCV 2018 Workshops; Lecture Notes in Computer Science Series (Including Subseries Lecture Notes in Artificial Intelligence and Lecture Notes in Bioinformatics); Springer: Cham, Switzerland, 2019; Volume 11134, pp. 213–228. [Google Scholar]
- Alper, M.A.; Goudreau, J.; Daniel, M. Pose and Optical Flow Fusion (POFF) for Accurate Tremor Detection and Quantification. Biocybern. Biomed. Eng. 2020, 40, 468–481. [Google Scholar] [CrossRef]
- Williams, S.; Fang, H.; Relton, S.D.; Wong, D.C.; Alam, T.; Alty, J.E. Accuracy of Smartphone Video for Contactless Measurement of Hand Tremor Frequency. Mov. Disord. Clin. Pract. 2021, 8, 69–75. [Google Scholar] [CrossRef] [PubMed]
- Wang, X.; Garg, S.; Tran, S.N.; Bai, Q.; Alty, J. Hand Tremor Detection in Videos with Cluttered Background Using Neural Network Based Approaches. Health Inf. Sci. Syst. 2021, 9, 30. [Google Scholar] [CrossRef] [PubMed]
- Wei, S.E.; Ramakrishna, V.; Kanade, T.; Sheikh, Y. Convolutional Pose Machines. In Proceedings of the IEEE Computer Society Conference on Computer Vision and Pattern Recognition, Las Vegas, NV, USA, 27–30 June 2016; Volume 2016, pp. 4724–4732. [Google Scholar]
- Google: MediaPipe (Hands). GitHub Repository. 2020. Available online: https://github.com/google/mediapipe (accessed on 22 June 2022).


| Patient | Age | Sex | Years Since Disease Onset | L-Dopa Equivalent Doses (mg) | UPDRS * Part III (3.15) | H&Y * | |
|---|---|---|---|---|---|---|---|
| Daily | Before the Second Measurement | ||||||
| PAT001 | 58 | m | 7 | 500 | 100 | 22 (2) | 2 |
| PAT002 | 83 | f | 13 | 632 | 133 | 35 (1) | 3 |
| PAT003 | 69 | f | 3 | 175 | 75 | 29 (0) | 3 |
| PAT004 | 67 | m | 7 | 600 | 100 | 26 (0) | 2 |
| PAT005 | 68 | f | 7 | 1125 | 150 | 36 (0) | 2 |
| PAT006 | 69 | m | 20 | 725 | 125 | 41 (1) | 2–3 |
| PAT007 | 52 | m | 17 | 785 | 75 | 26 (0) | 2 |
| PAT008 | 57 | f | 10 | 1716 | 133 | 48 (1) | 2–3 |
| PAT009 | 71 | m | 9 | 837 | 100 | 52 (3) | 3 |
| PAT010 | 63 | m | 10 | 601 | 109 | 73 (1) | 3 |
| PAT011 | 71 | m | 7 | 775 | 150 | 29 (0) | 3 |
|
|
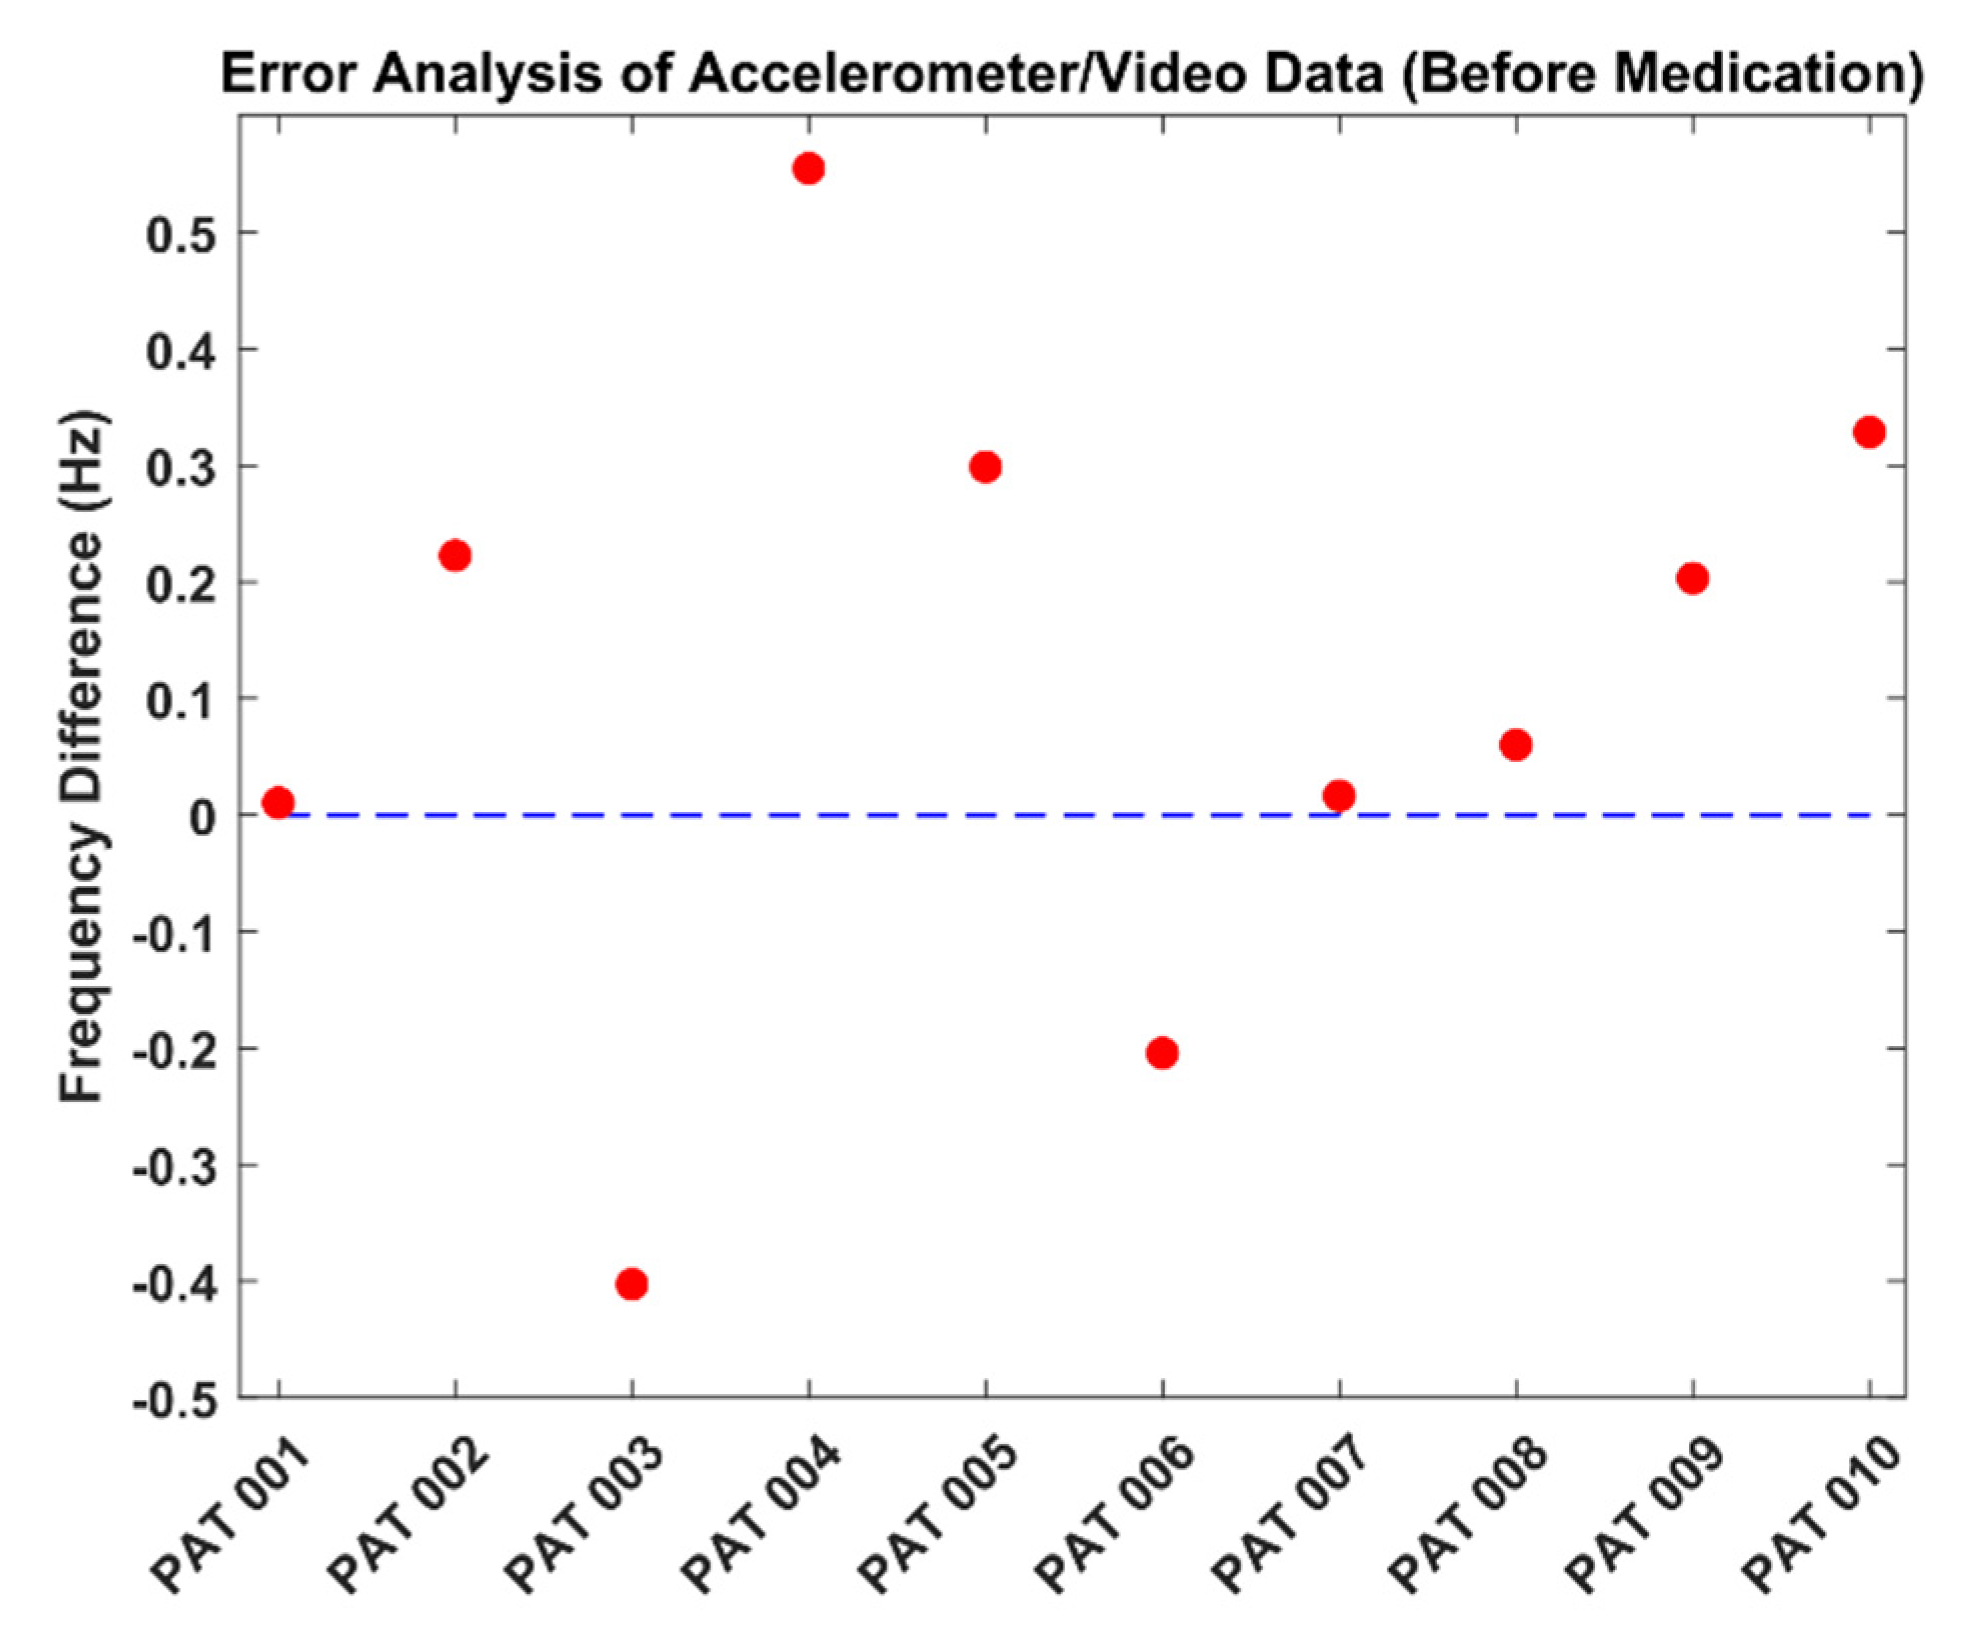
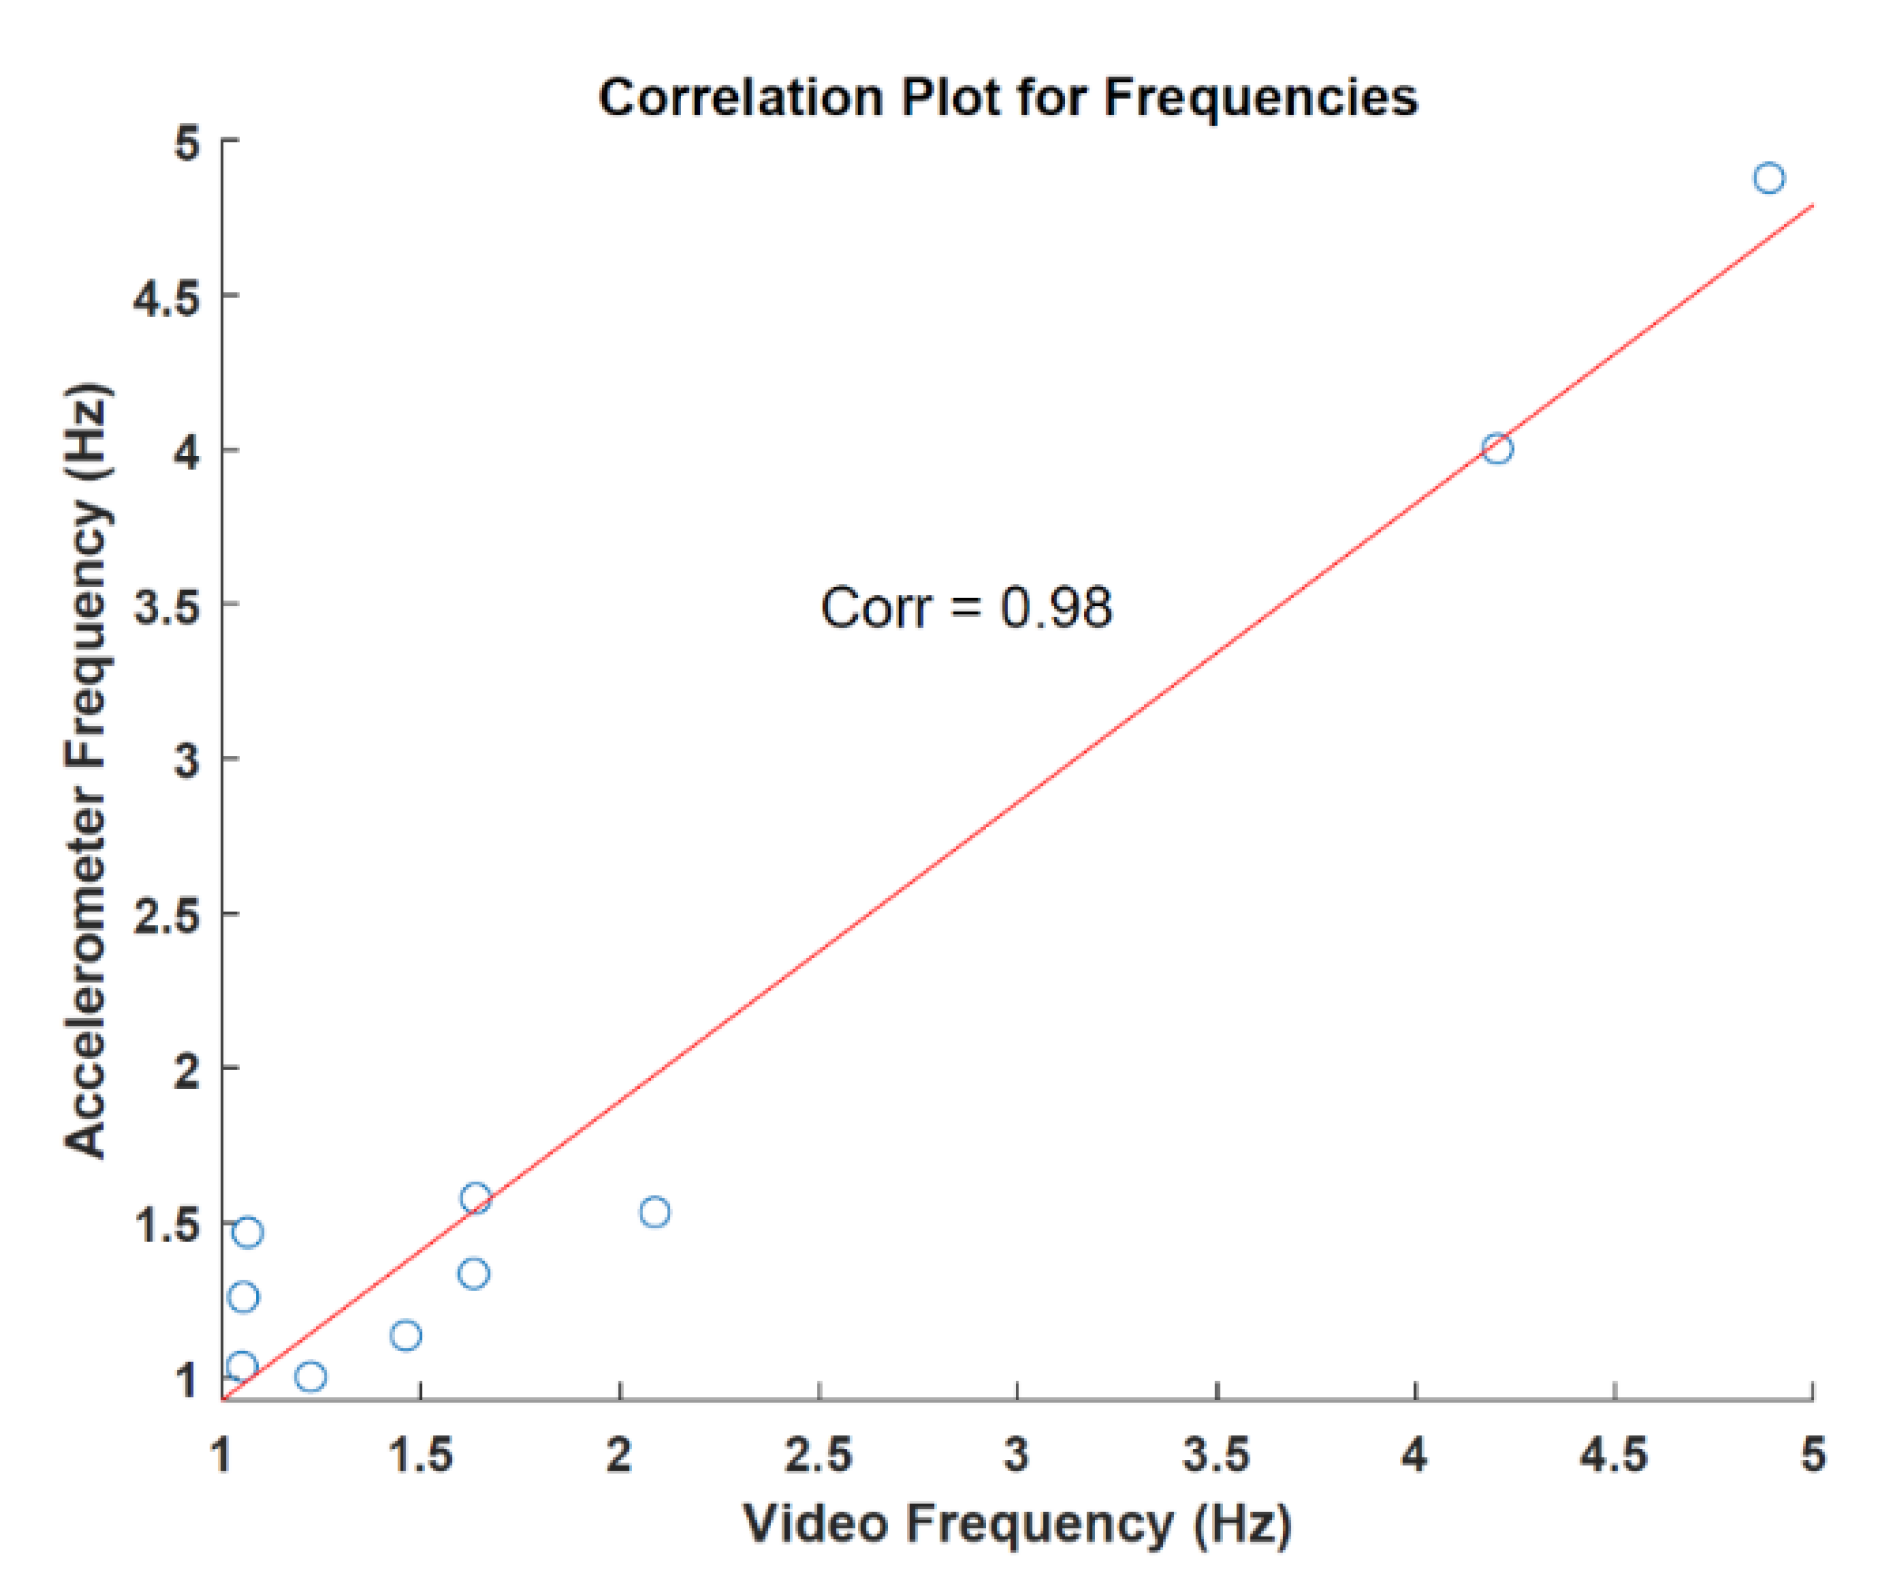
| Patient | Accelerometer (Hz) | Video Analysis (Hz) | AE (Hz) |
|---|---|---|---|
| PAT001 | 4.877 | 4.888 | 0.011 |
| PAT002 | 1.001 | 1.223 | 0.222 |
| PAT003 | 1.467 | 1.065 | 0.402 |
| PAT004 | 1.533 | 2.087 | 0.554 |
| PAT005 | 1.334 | 1.632 | 0.298 |
| PAT006 | 1.258 | 1.054 | 0.204 |
| PAT007 | 1.034 | 1.050 | 0.016 |
| PAT008 | 1.577 | 1.638 | 0.061 |
| PAT009 | 4.002 | 4.205 | 0.203 |
| PAT010 | 1.134 | 1.462 | 0.328 |
| PAT011 | - | 1.052 | - |
| Mean | 1.921 (±1.357) | 1.941 (±1.338) | 0.229 (±0.174) |
| RMSE | - | - | 0.283 |
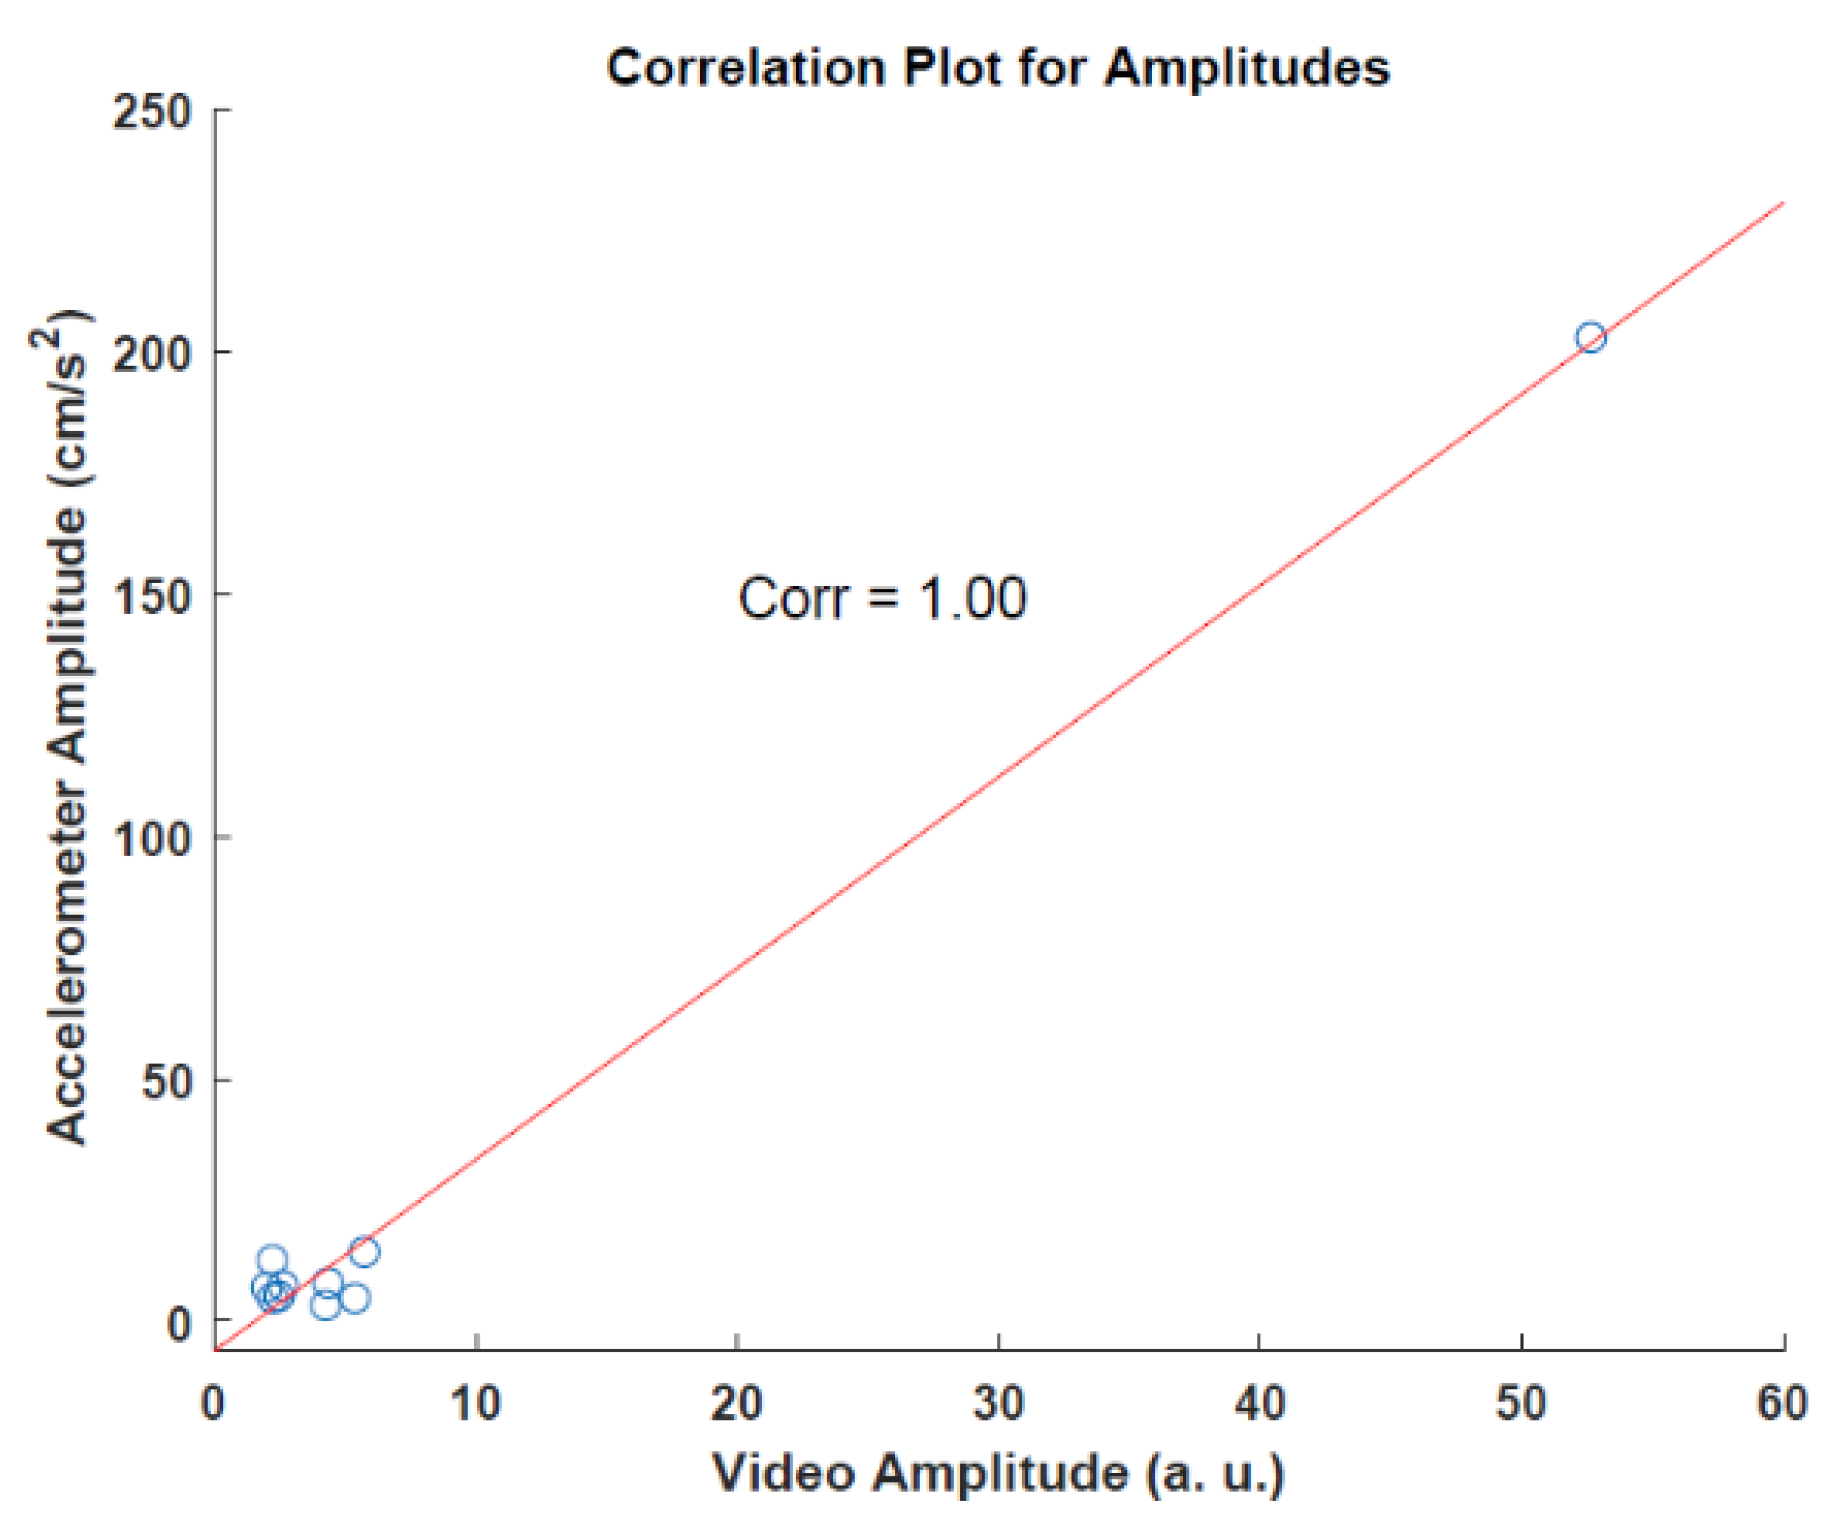
| Patient | Accelerometer (cm/s2) | Video Analysis (a.u.) |
|---|---|---|
| PAT001 | 14.251 | 5.720 |
| PAT002 | 7.900 | 4.347 |
| PAT003 | 12.589 | 2.213 |
| PAT004 | 5.172 | 2.463 |
| PAT005 | 4.7820 | 2.228 |
| PAT006 | 3.2490 | 4.246 |
| PAT007 | 6.259 | 1.982 |
| PAT008 | 7.325 | 2.603 |
| PAT009 | 202.873 | 52.637 |
| PAT010 | 4.788 | 5.368 |
| PAT011 | n.a. | n.a. |
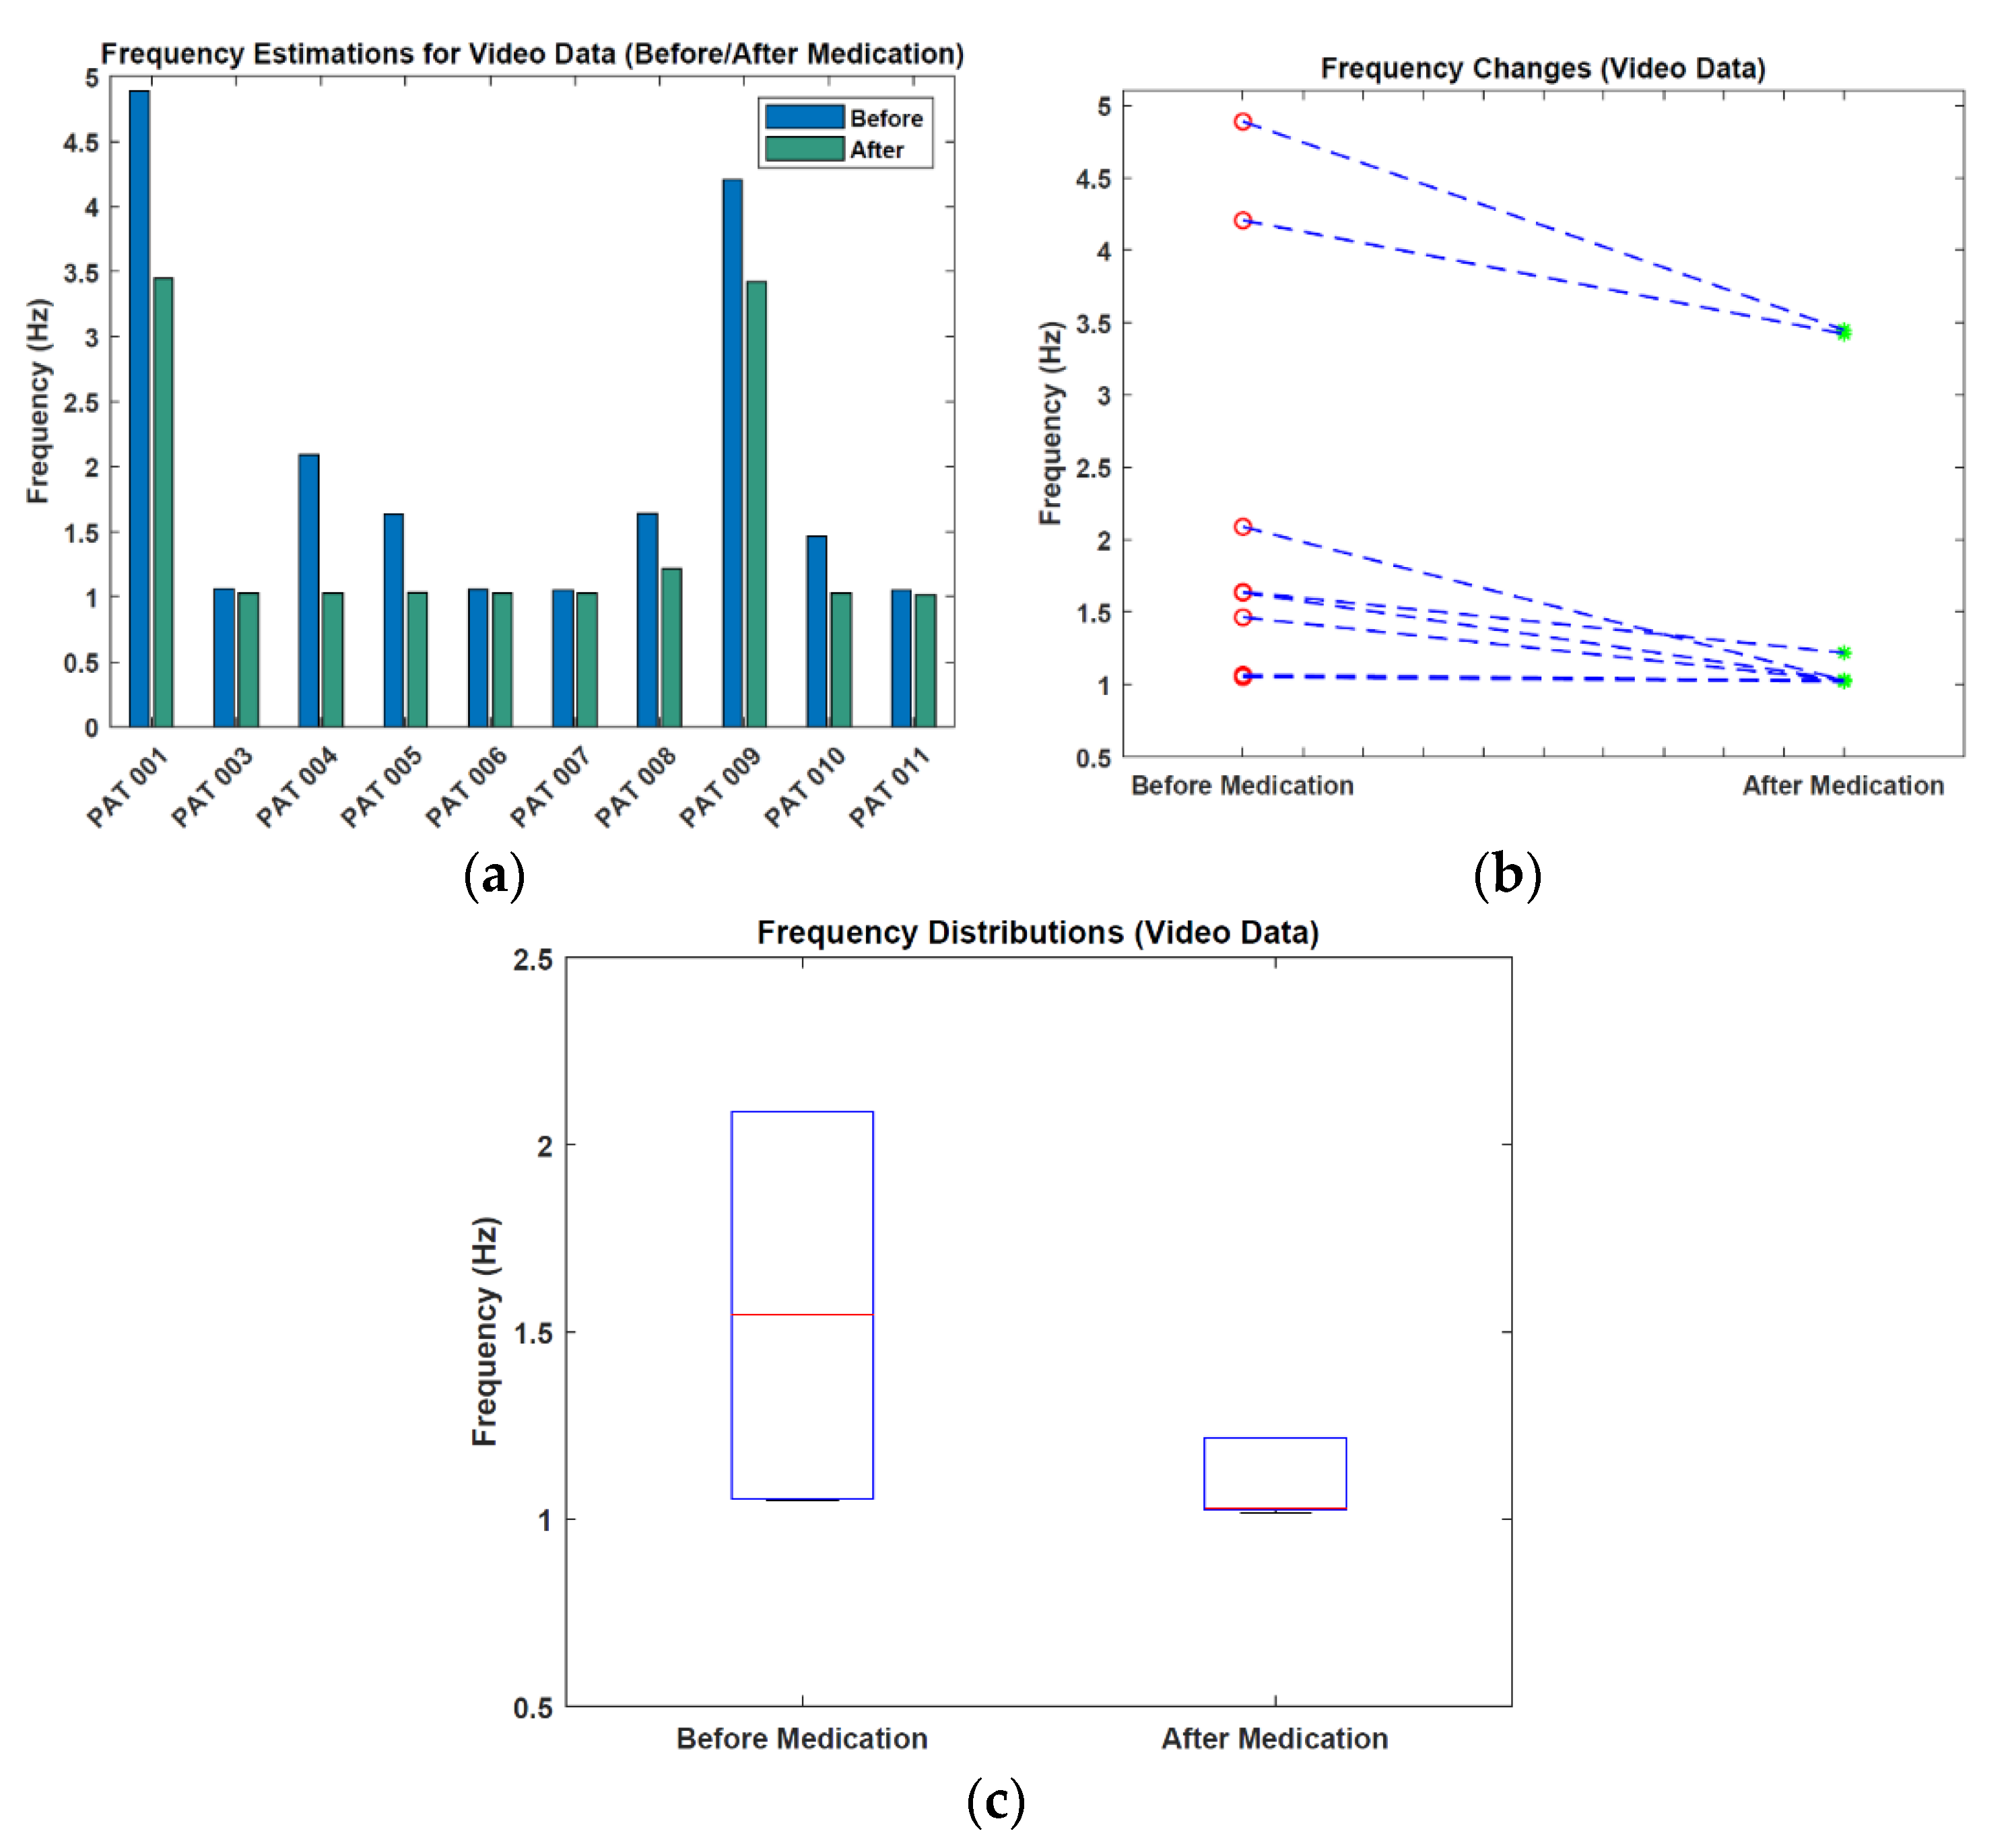
| Patient | Before Medication (Hz) | After Medication (Hz) | Frequency Change (Hz) |
|---|---|---|---|
| PAT001 | 4.888 | 3.447 | −1.441 |
| PAT003 | 1.065 | 1.024 | −0.041 |
| PAT004 | 2.087 | 1.027 | −1.060 |
| PAT005 | 1.632 | 1.030 | −0.602 |
| PAT006 | 1.054 | 1.027 | −0.027 |
| PAT007 | 1.050 | 1.028 | −0.022 |
| PAT008 | 1.638 | 1.217 | −0.421 |
| PAT009 | 4.205 | 3.421 | −0.784 |
| PAT010 | 1.462 | 1.025 | −0.437 |
| PAT011 | 1.052 | 1.017 | −0.035 |
| Mean | 2.012 (±1.385) | 1.526 (±1.007) | −0.487 (±0.491) |
| Patient | Before Medication (a.u.) | After Medication (a.u.) | Amplitude Change (a.u.) |
|---|---|---|---|
| PAT001 | 5.720 | 3.505 | −2.215 |
| PAT003 | 2.213 | 1.988 | −0.225 |
| PAT004 | 2.463 | 1.569 | −0.894 |
| PAT005 | 2.228 | 1.839 | −0.389 |
| PAT006 | 4.246 | 3.557 | −0.689 |
| PAT007 | 1.982 | 1.840 | −0.142 |
| PAT008 | 2.603 | 1.489 | −1.114 |
| PAT009 | 52.637 | 20.038 | −32.599 |
| PAT010 | 5.368 | 2.488 | −2.880 |
| PAT011 | 2.213 | 2.023 | −1.900 |
| Mean | 8.167 (±15.687) | 4.033 (±5.671) | −4.304 (±9.983) |
Publisher’s Note: MDPI stays neutral with regard to jurisdictional claims in published maps and institutional affiliations. |
© 2022 by the authors. Licensee MDPI, Basel, Switzerland. This article is an open access article distributed under the terms and conditions of the Creative Commons Attribution (CC BY) license (https://creativecommons.org/licenses/by/4.0/).
Share and Cite
Güney, G.; Jansen, T.S.; Dill, S.; Schulz, J.B.; Dafotakis, M.; Hoog Antink, C.; Braczynski, A.K. Video-Based Hand Movement Analysis of Parkinson Patients before and after Medication Using High-Frame-Rate Videos and MediaPipe. Sensors 2022, 22, 7992. https://doi.org/10.3390/s22207992
Güney G, Jansen TS, Dill S, Schulz JB, Dafotakis M, Hoog Antink C, Braczynski AK. Video-Based Hand Movement Analysis of Parkinson Patients before and after Medication Using High-Frame-Rate Videos and MediaPipe. Sensors. 2022; 22(20):7992. https://doi.org/10.3390/s22207992
Chicago/Turabian StyleGüney, Gökhan, Talisa S. Jansen, Sebastian Dill, Jörg B. Schulz, Manuel Dafotakis, Christoph Hoog Antink, and Anne K. Braczynski. 2022. "Video-Based Hand Movement Analysis of Parkinson Patients before and after Medication Using High-Frame-Rate Videos and MediaPipe" Sensors 22, no. 20: 7992. https://doi.org/10.3390/s22207992
APA StyleGüney, G., Jansen, T. S., Dill, S., Schulz, J. B., Dafotakis, M., Hoog Antink, C., & Braczynski, A. K. (2022). Video-Based Hand Movement Analysis of Parkinson Patients before and after Medication Using High-Frame-Rate Videos and MediaPipe. Sensors, 22(20), 7992. https://doi.org/10.3390/s22207992