


A Review of AI Cloud and Edge Sensors, Methods, and Applications for the Recognition of Emotional, Affective and Physiological States


 ,
,
Abstract
1. Introduction
- A fairly large number of studies around the world apply biometric and neuroscience methods to determine and analyze AFFECT. However, there has been no integrated review of these studies.
- Another missing piece is a review of AFFECT recognition, classification, and analysis based on Plutchik’s wheel of emotions theory. We have examined 30 emotions and affective states defined in the theory.
- Information on diversity attitudes, socioeconomic status, demographic and cultural background, and context is missing from many studies. We have therefore identified real-time context data and integrated them with AFFECT data. The correct assessment of AFFECT and predictions of imminent behavior are becoming very important in a highly competitive market.
- To demonstrate a few of the aforementioned new research areas in practice, we have developed our own metric, the Real-time Vilnius Happiness Index (Section 4), among other tools. These studies have used integrated methods of biometrics and neuroscience, which are widely applied in various fields of human activity.
- In this research, we therefore examine a more complex problem than any prior studies.
2. Method
- Construction of regression models for the numbers of publications and their citations.
- Calculation of statistical (Pearson correlation coefficient (r), standardized beta coefficient (β), coefficient of determination (R2), standard deviation, p-values) and non-statistical (research context, practical benefit, indicators with low values) effect size indicators describing these regression models.
3. Emotion Models
4. Brain and Biometric AFFECT Sensors
4.1. Classifications
- Physiological features: facial patterns, odor, pupil dilation and contraction, skin conductance, heart rate, respiratory rate, temperature, blood volume pulse, and others.
- Behavioral features: gait, keystroke, mouse tracking, signature, handwriting, speech/voice, and others.
- The authors of this article have used the classification of biometrics proposed by the abovementioned authors (physiological and behavioral features).
4.2. Brain AFFECT Devices and Sensors
- Electromagnetic methods, including magnetoencephalography (MEG), electroencephalography (EEG), and steady-state topography (SST). MEG involves the magnetic fields produced by the brain (its natural electrical currents) and is used to track the changes that occur when participants see or interact with various presentation outputs. EEG is related to the ways in which brainwaves change and is used to detect changes when participant see or interact with various promoting outputs (an electrode band or helmet is used for this purpose). SST measures a steady-state visually evoked potential, and is used to determine how brain activities change depending on the task;
- Metabolic methods, including positron emission tomography (PET) and functional magnetic resonance imaging (fMRI). PET is used to examine the metabolism of glucose within the brain with great accuracy by tracing radiation pulses, while fMRI is used to measure blood flow in the brain to determine changes in brain activity;
- Electrocardiography (ECG), which uses external skin electrodes to measure electrical changes related to cardiac cycles;
- Facial electromyography (fEMG), which amplifies tiny electrical impulses to record the physiological properties of the facial muscles;
- Transcranial Magnetic Stimulation (TMS), which is used to observe the effects of promoting output on behavior by temporarily disrupting specific brain activities. TMS is a non-invasive, safe brain stimulation method. By means of a strong electromagnet, this technique momentarily generates a short-lived virtual lesion, i.e., disrupts information processing in one of brain regions. If stimulation interferes with performing a certain task, the affected brain region is, then, necessary for normal performance of the task [252].
4.3. Physiological and Behavioral Biometrics
- Sample recommendations include reporting on recruitment strategies, sampling frames and participation rates; increasing the diversity of the study population by enrolling participants of different ages and ethnicities; reporting basic demographic data such as age, gender, ethnicity, and comorbidities; and measuring and reporting participant engagement and acceptability in terms of attrition rates, missing data, and/or qualitative data.
- Furthermore, in machine learning models—describing the model selection strategy, performance metrics and parameter estimates in the model with confidence intervals or nonparametric equivalents.
- Recommendations for data collection and analysis include using established and validated scales for depression assessment; presenting any available evidence on the validity and reliability of the sensor or device used; describing in sufficient detail so as to enable replication, data processing and feature construction; and providing a definition and description of how missing data is handled.
- Recommendations for data sharing include making the code used for feature extraction available within an open science framework and sharing anonymized datasets in data repositories.
- The key recommendation is recognizing the need for consistent reporting in this area. The fact that many studies—especially in the field of computer science—fail to report basic demographic information. A common framework should be developed that has standardized assessment and analysis tools and reliable feature extraction and missing data descriptions, and has been tested in more representative populations.
- Methods that monitor what is happening in the brain (i.e., the physiological activity of the CNS);
- Methods that record what is happening elsewhere in the body (i.e., the physiological activity of the PNS);
- Other techniques for tracking behavior and conduct.
5. Users’ Demographic and Cultural Background, Socioeconomic Status, Diversity Attitudes, and Context
6. Results
- Missing data imputation techniques: analysis of the variable containing missing data (Mean, Regression, Hot Deck, Multiply Imputation) and analysis of relationships between variables for a case containing missing data (Imputation based on Machine Learning: Neural Network, Self-organizing map, K-NN, Multilayer perceptron);
- Case deletion (Listwise Deletion (Complete-case), Pairwise Deletion);
- Approaches that take into account data distributions (Bayesian methods, Model-based likelihood, Maximum Likelihood with EM).
- Construction of regression models for the numbers of publications and their citations.
- Calculation of statistical effect size (ES) indicators describing these regression models. ES is a value used in statistics to measure the strength of the relationship between two variables, or to calculate a sample-size estimate of that amount [568]. An ES may reflect the regression coefficient in a regression, the correlation between two variables, the mean difference, or the risk of a specific event occurring [569]. Guidelines developed by Durlak [570] provide advice on the ESs to use in research, and how to calculate and interpret them. We used these guidelines, and applied the following five measures of ES, as these indicators are crucial for meta-analysis and could be computed from our measurements:
- ○
- ○
- Standardized beta coefficient (β): Theoretically, the highest-ranking variable is the one with the largest total effect, since β is a measure of the total effect of the predictor variables [573].
- ○
- Coefficient of determination (R2): This is a measurement of the accuracy of a CSP model. The outcome is represented by the dependent variables of the model. The closer the coefficient of determination to one, the more variability the model explains. R2 can therefore be used to determine the proportion of the variation in the dependent variable that can be predicted by examining the independent variables [573].
- ○
- Standard deviation: If this is too high, it will render the measurement virtually meaningless [574].
- ○
- p-values. There is no direct relationship between the p-value and the size, and a small p-value may be associated with a small, medium, or large effect. There is also no direct relationship between the ES and its practical or clinical significance: a lower ES for one outcome may be more important than a higher ES for another outcome, depending on the circumstances [570].
- Calculation of non-statistical ES measures, which may better indicate the significance of the relationships between pairs of variables in our two models:
- ○
- Research context: Durlak [570] argues that ESs must be interpreted in the context of other research.
- ○
- Practical benefit: As this is an intuitive measure, practical benefit can allow stakeholders to make more accurate assessments of whether the research findings published can significantly improve their ongoing projects [575].
- ○
- Indicators with low values: These are usually easier to improve than indicators with high values.
7. Evaluation of Biometric Systems
- In this context, efficiency means that users must be able to accomplish the tasks easily and in a timely manner. It is generally measured as task time;
- Here, effectiveness means that users are able to complete the desired tasks without excessive effort. This is generally measured by common metrics such as the completion rate and number of errors, for example the failure-to-enroll rate (FTE) [580];
- User satisfaction measures the user’s acceptance of and satisfaction with the system. It is generally measured by looking at a number of characteristics, such as ease of use and trust in the system. Even if the performance of one biometric system exceeds that of another in terms of performance, this will not necessarily mean that it will be more operational or acceptable.
8. Discussion and Conclusions
- Many studies fail to report information on demographic and cultural background, socioeconomic status, diversity attitudes, and context, and AFFECT papers often have limited descriptions of feature extraction and analysis. This has a significant impact on the interpretation of their findings. Sample recommendations include reporting on participant enrolment and selection approaches and analysis of demographic and cultural background (age, gender, ethnicity, race, major diagnoses, and major medical history); socioeconomic status (education, income and occupation), diversity attitudes, and context. In order to improve the ability of researchers to assess the strength of evidence, one of the first steps should be the development of this kind of consistent reporting.
- Behavioral traits (e.g., gesture, keystroke, voice) change over time, and therefore are less stable. Multiple interactions are typically required to set a reliable baseline. Injury, illness, age, and stress can also cause changes in behavioral traits. Many of the studies on AFFECT recognition examined brain and biometric data under different AFFECT while overlooking the baseline (spontaneous) brain and biometric data.
- The literature did not contain brain and biometric sensor-based AFFECT recognition of mixed emotions (parallel involvement of negative and positive emotions). We study the 30 primary, secondary, and tertiary dyads of Plutchik’s wheel of emotions, creating mixed emotions.
- Researchers need a set of guidelines to ensure AI models (artificial neural networks, evolutionary computing, natural language processing; metaheuristics, fuzzy logic, genetic algorithm) are correctly applied, and that their specifications and results are consistently reported (the model selection strategy, parameter estimates in the model with confidence intervals, performance metrics, etc.). There is also a need to further develop advanced AI and machine learning techniques (multi-modal learning, neuroscience-based deep learning, automated machine learning, self-supervised deep learning, Quantum ML, Tiny ML, System 2 deep learning).
- More results are also needed to identify which of the elicitation techniques applied in practice are effective, and in which cases they work best, taking into account the type of information obtained, the stakeholders’ (developers, end-users, etc.) characteristics, the context, and other factors. More data sets need to be created that use active elicitation techniques, such as various games, as these are better at mimicking real-life experiences and bringing about emotions. Gamification is a current trend that uses game methods for real-life AFFECT elicitation.
- Recommendations also state that the two sources of potential bias (AFFECT interpretation algorithmic biases, data sources and input) in multi-feature studies should be reduced, and a wider variety of multimodal samples should be used.
- Missing data analysis has some gaps, for example missing data descriptions and how missing data is handled, and most appropriate methods should be applied in AFFECT recognition. As far as missing data goes, the literature had major shortcomings.
- As algorithms improve, accuracy is growing, but this significantly depends on the data sets used. Some gaps and a lack of discussion have also been noted concerning the question of whether the integrated brain and biometric sensors used in this research are reliable and appropriate for AFFECT detection.
- A trend related to emotional AI businesses (Realeyes, Affectiva, etc.) that expand their global operations in regions with less stringent data collection and privacy laws has not been sufficiently examined globally.
- The recommendations for open science include the proposal to share and reuse open multimodal AFFECT data, information, knowledge, and science practices (publications and software) by preparing a Data Management Plan that would address any important aspects of making data findable, accessible, interoperable, and reusable, or FAIR. Open data analysis should also include recognized and validated scales for AFFECT evaluation; any accessible confirmation on the reliability and validity of the AFFECT device and sensor applied should be presented. The open datasets have usually sought to obtain higher accuracy by using different sets of stimuli and groups of participants.
- Many studies around the world apply neuroscience and biometric methods to identify and analyze human valence, arousal, emotional and physiological states, and affective attitudes (AFFECT). An integrated review of these studies is, however, yet missing.
- In view of the fact that no reviews of AFFECT recognition, classification and analysis based on Plutchik’s wheel of emotions theory are available, our study has examined the full spectrum of thirty affective states and emotions defined in the theory.
- The authors of the article have presented their own Real-time Vilnius Happiness Index (Figure 10a) and other systems and outputs to demonstrate several of the aforementioned new research areas in practice.
Author Contributions
Funding
Institutional Review Board Statement
Informed Consent Statement
Data Availability Statement
Conflicts of Interest
Abbreviations
| AFFECT | arousal, valence, affective attitudes, emotional and physiological states |
| AI | Artificial Intelligence |
| AISs | artificial intelligence subsystems |
| AON | action observation network |
| BAEPs | brainstem evoked potentials |
| BCI | brain–computer interface |
| BIM4Ren | Building Information Modelling based tools and technologies toward fast and efficient RENovation of residential buildings |
| BNCI | brain/neuronal computer interaction |
| BR | binary relevance |
| BTL | below the line |
| CNCP | model Collective Neuromarketing Consumer Persuasion Model |
| CNN | convolutional neural network |
| DEAP | Dataset for Emotions Analysis using Physiological signals |
| DTI | diffusion tensor imaging |
| DWI | diffusion-weighted imaging |
| EARs | emotion association rules |
| ECG | electrocardiography |
| EDA | electrodermal activity |
| EEG | electroencephalography |
| EMG | electromyography |
| EMSs | engagement marketing subsystems |
| EOG | electrooculogram |
| ERP | event-related potential |
| ESSs | emotional salient segments |
| ET | eye tracking |
| FA | fractional anisotropy |
| FC | facial action coding |
| FDG | fluoro-D-glucose |
| FDG-PET/fMRI | simultaneous [18 F]-fluorodeoxyglucose positron emission tomography and functional magnetic resonance imaging |
| fEMG | facial electromyography |
| fMRI | functional magnetic resonance imaging |
| fNIRS | functional near-infrared spectroscopy |
| fPET | functional positron emission tomography |
| GMM | gaussian mixture models |
| GSR | galvanometer or galvanic skin response |
| HMI | human–machine interactions |
| HMM | hidden Markov model |
| HR | heart rate |
| HVAC | heating, ventilation, and air conditioning |
| ICCs | intra-class correlation coefficients |
| IoT | Internet of Things |
| IRT | implicit reaction time |
| IS | information systems |
| iTBS | intermittent theta burst transcranial magnetic stimulation |
| K-NN | K-nearest neighbor |
| LP | label powerset |
| LSTM | long short-term memory |
| MDS | multidimensional scaling |
| MEG | magnetoencephalography |
| MLP | multi-layer perceptron |
| MRI | magnetic resonance imaging |
| MT | mouse tracking |
| N5PSC | neuromarketing, neuroeconomics, neuromanagement, neuro-information systems, neuro-industrial engineering, products, services, call centers |
| NEV | net emotional value |
| NIRS | near infrared spectroscopy |
| NLP | natural language processing |
| NT | neurotransmitter |
| PET | positron emission tomography |
| PPG | photoplethysmogram |
| PSD | power spectral density |
| RAKEL | random k-label sets |
| RF | random forest |
| ROCK | Regeneration and Optimization of Cultural heritage in creative and Knowledge cities |
| RRA | respiratory rate assessment |
| RT | reaction times |
| rTMS | transcranial magnetic stimulation |
| SC | skin conductance |
| SD | tests SDS denaturation test |
| SEEVal | the service encounter emotional value |
| SST | steady-state topography |
| SVM | support vector machine |
| tDCS | transcranial direct-current stimulation |
| TMS | transcranial magnetic stimulation |
| UIT-VSMEC | standard Vietnamese social media emotion corpus |
| VAAQ | virtual agent’s acceptance questionnaire |
| VPA | voice pitch analysis |
| VR | virtual reality |
References
- Rizzolatti, G.; Sinigaglia, C. The Mirror Mechanism: A Basic Principle of Brain Function. Nat. Rev. Neurosci. 2016, 17, 757–765. [Google Scholar] [CrossRef] [PubMed]
- Spunt, R.P.; Adolphs, R. The Neuroscience of Understanding the Emotions of Others. Neurosci. Lett. 2019, 693, 44–48. [Google Scholar] [CrossRef] [PubMed]
- Berčík, J.; Neomániová, K.; Mravcová, A.; Gálová, J. Review of the Potential of Consumer Neuroscience for Aroma Marketing and Its Importance in Various Segments of Services. Appl. Sci. 2021, 11, 7636. [Google Scholar] [CrossRef]
- Li, L.; Gow, A.D.I.; Zhou, J. The Role of Positive Emotions in Education: A Neuroscience Perspective. Mind Brain Educ. 2020, 14, 220–234. [Google Scholar] [CrossRef]
- Cromwell, H.C.; Papadelis, C. Mapping the Brain Basis of Feelings, Emotions and Much More: A Special Issue Focused on ‘The Human Affectome’. Neurosci. Biobehav. Rev. 2022, 137, 104672. [Google Scholar] [CrossRef]
- Alexander, R.; Aragón, O.R.; Bookwala, J.; Cherbuin, N.; Gatt, J.M.; Kahrilas, I.J.; Kästner, N.; Lawrence, A.; Lowe, L.; Morrison, R.G.; et al. The Neuroscience of Positive Emotions and Affect: Implications for Cultivating Happiness and Wellbeing. Neurosci. Biobehav. Rev. 2021, 121, 220–249. [Google Scholar] [CrossRef]
- Vuust, P.; Heggli, O.A.; Friston, K.J.; Kringelbach, M.L. Music in the Brain. Nat. Rev. Neurosci. 2022, 23, 287–305. [Google Scholar] [CrossRef]
- Green, M.F.; Horan, W.P.; Lee, J. Social Cognition in Schizophrenia. Nat. Rev. Neurosci. 2015, 16, 620–631. [Google Scholar] [CrossRef]
- Bunge, S.A. How We Use Rules to Select Actions: A Review of Evidence from Cognitive Neuroscience. Cogn. Affect. Behav. Neurosci. 2004, 4, 564–579. [Google Scholar] [CrossRef]
- Lieberman, M.D. Social Cognitive Neuroscience: A Review of Core Processes. Annu. Rev. Psychol. 2007, 58, 259–289. [Google Scholar] [CrossRef]
- Sawyer, K. The Cognitive Neuroscience of Creativity: A Critical Review. Creat. Res. J. 2011, 23, 137–154. [Google Scholar] [CrossRef]
- Byrom, B.; McCarthy, M.; Schueler, P.; Muehlhausen, W. Brain Monitoring Devices in Neuroscience Clinical Research: The Potential of Remote Monitoring Using Sensors, Wearables, and Mobile Devices. Clin. Pharmacol. Ther. 2018, 104, 59–71. [Google Scholar] [CrossRef]
- Johnson, K.T.; Picard, R.W. Advancing Neuroscience through Wearable Devices. Neuron 2020, 108, 8–12. [Google Scholar] [CrossRef]
- Soroush, M.Z.; Maghooli, K.; Setarehdan, S.K.; Motie Nasrabadi, A. A Review on EEG Signals Based Emotion Recognition. Int. Clin. Neurosci. J. 2017, 4, 118–129. [Google Scholar] [CrossRef]
- Gui, Q.; Ruiz-Blondet, M.V.; Laszlo, S.; Jin, Z. A Survey on Brain Biometrics. ACM Comput. Surv. 2019, 51, 1–38. [Google Scholar] [CrossRef]
- Fairhurst, M.; Li, C.; Da Costa-Abreu, M. Predictive Biometrics: A Review and Analysis of Predicting Personal Characteristics from Biometric Data. IET Biom. 2017, 6, 369–378. [Google Scholar] [CrossRef]
- Zhong, Y.; Deng, Y. A Survey on Keystroke Dynamics Biometrics: Approaches, Advances, and Evaluations. In Gate to Computer Science and Research; Zhong, Y., Deng, Y., Eds.; Science Gate Publishing P.C.: Thrace, Greece, 2015; Volume 2, pp. 1–22. [Google Scholar] [CrossRef]
- Hernandez-de-Menendez, M.; Morales-Menendez, R.; Escobar, C.A.; Arinez, J. Biometric Applications in Education. Int. J. Interact. Des. Manuf. 2021, 15, 365–380. [Google Scholar] [CrossRef]
- Berčík, J.; Horská, E.; Gálová, J.; Margianti, E.S. Consumer neuroscience in practice: The impact of store atmosphere on consumer behavior. Period. Polytech. Soc. Manag. Sci. 2016, 24, 96–101. [Google Scholar] [CrossRef]
- Pisani, P.H.; Mhenni, A.; Giot, R.; Cherrier, E.; Poh, N.; Ferreira de Carvalho, A.C.P.d.L.; Rosenberger, C.; Amara, N.E.B. Adaptive Biometric Systems: Review and Perspectives. ACM Comput. Surv. 2020, 52, 1–38. [Google Scholar] [CrossRef]
- Xu, S.; Fang, J.; Hu, X.; Ngai, E.; Guo, Y.; Leung, V.C.M.; Cheng, J.; Hu, B. Emotion Recognition from Gait Analyses: Current Research and Future Directions. arXiv 2020, arXiv:2003.11461. [Google Scholar] [CrossRef]
- Merone, M.; Soda, P.; Sansone, M.; Sansone, C. ECG Databases for Biometric Systems: A Systematic Review. Expert Syst. Appl. 2017, 67, 189–202. [Google Scholar] [CrossRef]
- Curtin, A.; Tong, S.; Sun, J.; Wang, J.; Onaral, B.; Ayaz, H. A Systematic Review of Integrated Functional Near-Infrared Spectroscopy (FNIRS) and Transcranial Magnetic Stimulation (TMS) Studies. Front. Neurosci. 2019, 13, 84. [Google Scholar] [CrossRef]
- da Silva, F.L. EEG and MEG: Relevance to Neuroscience. Neuron 2013, 80, 1112–1128. [Google Scholar] [CrossRef]
- Khushaba, R.N.; Wise, C.; Kodagoda, S.; Louviere, J.; Kahn, B.E.; Townsend, C. Consumer Neuroscience: Assessing the Brain Response to Marketing Stimuli Using Electroencephalogram (EEG) and Eye Tracking. Expert Syst. Appl. 2013, 40, 3803–3812. [Google Scholar] [CrossRef]
- Krugliak, A.; Clarke, A. Towards Real-World Neuroscience Using Mobile EEG and Augmented Reality. Sci. Rep. 2022, 12, 2291. [Google Scholar] [CrossRef]
- Gramann, K.; Jung, T.-P.; Ferris, D.P.; Lin, C.-T.; Makeig, S. Toward a New Cognitive Neuroscience: Modeling Natural Brain Dynamics. Front. Hum. Neurosci. 2014, 8, 444. [Google Scholar] [CrossRef]
- An, B.W.; Heo, S.; Ji, S.; Bien, F.; Park, J.-U. Transparent and Flexible Fingerprint Sensor Array with Multiplexed Detection of Tactile Pressure and Skin Temperature. Nat. Commun. 2018, 9, 2458. [Google Scholar] [CrossRef]
- Gadaleta, M.; Radin, J.M.; Baca-Motes, K.; Ramos, E.; Kheterpal, V.; Topol, E.J.; Steinhubl, S.R.; Quer, G. Passive Detection of COVID-19 with Wearable Sensors and Explainable Machine Learning Algorithms. NPJ Digit. Med. 2021, 4, 166. [Google Scholar] [CrossRef]
- Hayano, J.; Tanabiki, T.; Iwata, S.; Abe, K.; Yuda, E. Estimation of Emotions by Wearable Biometric Sensors Under Daily Activities. In 2018 IEEE 7th Global Conference on Consumer Electronics (GCCE), Osaka, Tokyo, 18–21 October 2022; IEEE: Nara, Japan, 2018; pp. 240–241. [Google Scholar] [CrossRef]
- Oostdijk, M.; van Velzen, A.; van Dijk, J.; Terpstra, A. State-of-the-Art in Biometrics for Multi-Factor Authentication in a Federative Context. Identity 2016, 14, 15. [Google Scholar]
- Salman, A.S.; Salman, A.S.; Salman, O.S. Using Behavioral Biometrics of Fingerprint Authentication to Investigate Physical and Emotional User States. In Proceedings of the Future Technologies Conference (FTC) 2021, Volume 2; Arai, K., Ed.; Lecture Notes in Networks and Systems. Springer International Publishing: Cham, Switzerland, 2022; Volume 359, pp. 240–256. [Google Scholar] [CrossRef]
- Zhang, Y.-J. Biometric Recognition. In Handbook of Image Engineering; Springer: Singapore, 2021; pp. 1231–1256. [Google Scholar]
- Maffei, A.; Angrilli, A. E-MOVIE—Experimental MOVies for Induction of Emotions in Neuroscience: An Innovative Film Database with Normative Data and Sex Differences. PLoS ONE 2019, 14, e0223124. [Google Scholar] [CrossRef]
- Apicella, A.; Arpaia, P.; Mastrati, G.; Moccaldi, N. EEG-Based Detection of Emotional Valence towards a Reproducible Measurement of Emotions. Sci. Rep. 2021, 11, 21615. [Google Scholar] [CrossRef] [PubMed]
- Tost, H.; Reichert, M.; Braun, U.; Reinhard, I.; Peters, R.; Lautenbach, S.; Hoell, A.; Schwarz, E.; Ebner-Priemer, U.; Zipf, A.; et al. Neural Correlates of Individual Differences in Affective Benefit of Real-Life Urban Green Space Exposure. Nat. Neurosci. 2019, 22, 1389–1393. [Google Scholar] [CrossRef] [PubMed]
- Mashrur, F.R.; Rahman, K.M.; Miya, M.T.I.; Vaidyanathan, R.; Anwar, S.F.; Sarker, F.; Mamun, K.A. An Intelligent Neuromarketing System for Predicting Consumers’ Future Choice from Electroencephalography Signals. Physiol. Behav. 2022, 253, 113847. [Google Scholar] [CrossRef] [PubMed]
- Asadzadeh, S.; Yousefi Rezaii, T.; Beheshti, S.; Meshgini, S. Accurate Emotion Recognition Using Bayesian Model Based EEG Sources as Dynamic Graph Convolutional Neural Network Nodes. Sci. Rep. 2022, 12, 10282. [Google Scholar] [CrossRef] [PubMed]
- Čeko, M.; Kragel, P.A.; Woo, C.-W.; López-Solà, M.; Wager, T.D. Common and Stimulus-Type-Specific Brain Representations of Negative Affect. Nat. Neurosci. 2022, 25, 760–770. [Google Scholar] [CrossRef]
- Prete, G.; Croce, P.; Zappasodi, F.; Tommasi, L.; Capotosto, P. Exploring Brain Activity for Positive and Negative Emotions by Means of EEG Microstates. Sci. Rep. 2022, 12, 3404. [Google Scholar] [CrossRef]
- Sitaram, R.; Ros, T.; Stoeckel, L.; Haller, S.; Scharnowski, F.; Lewis-Peacock, J.; Weiskopf, N.; Blefari, M.L.; Rana, M.; Oblak, E.; et al. Closed-Loop Brain Training: The Science of Neurofeedback. Nat. Rev. Neurosci. 2017, 18, 86–100. [Google Scholar] [CrossRef]
- Del Negro, C.A.; Funk, G.D.; Feldman, J.L. Breathing Matters. Nat. Rev. Neurosci. 2018, 19, 351–367. [Google Scholar] [CrossRef]
- Pugh, Z.H.; Choo, S.; Leshin, J.C.; Lindquist, K.A.; Nam, C.S. Emotion Depends on Context, Culture and Their Interaction: Evidence from Effective Connectivity. Soc. Cogn. Affect. Neurosci. 2022, 17, 206–217. [Google Scholar] [CrossRef]
- Barrett, L.F. How Emotions Are Made: The Secret Life of the Brain; Houghton Mifflin Harcourt: Boston, MA, USA, 2017. [Google Scholar]
- Barrett, L.F. The Theory of Constructed Emotion: An Active Inference Account of Interoception and Categorization. Soc. Cogn. Affect. Neurosci. 2017, 12, 1–23. [Google Scholar] [CrossRef]
- Basiri, M.E.; Nemati, S.; Abdar, M.; Cambria, E.; Acharya, U.R. ABCDM: An Attention-Based Bidirectional CNN-RNN Deep Model for Sentiment Analysis. Future Gener. Comput. Syst. 2021, 115, 279–294. [Google Scholar] [CrossRef]
- Parry, G.; Vuong, Q. Deep Affect: Using Objects, Scenes and Facial Expressions in a Deep Neural Network to Predict Arousal and Valence Values of Images. arXiv preprint 2021. [Google Scholar] [CrossRef]
- Gendron, B.; Kouremenou, E.-S.; Rusu, C. Emotional Capital Development, Positive Psychology and Mindful Teaching: Which Links? Int. J. Emot. Educ. 2016, 8, 63–74. [Google Scholar]
- Houge Mackenzie, S.; Brymer, E. Conceptualizing Adventurous Nature Sport: A Positive Psychology Perspective. Ann. Leis. Res. 2020, 23, 79–91. [Google Scholar] [CrossRef]
- Li, C. A Positive Psychology Perspective on Chinese EFL Students’ Trait Emotional Intelligence, Foreign Language Enjoyment and EFL Learning Achievement. J. Multiling. Multicult. Dev. 2020, 41, 246–263. [Google Scholar] [CrossRef]
- Bower, I.; Tucker, R.; Enticott, P.G. Impact of Built Environment Design on Emotion Measured via Neurophysiological Correlates and Subjective Indicators: A Systematic Review. J. Environ. Psychol. 2019, 66, 101344. [Google Scholar] [CrossRef]
- Cassidy, T. Environmental Psychology: Behaviour and Experience in Context; Contemporary Psychology Series; Psychology Press: Hove, UK, 1997. [Google Scholar]
- Cho, H.; Li, C.; Wu, Y. Understanding Sport Event Volunteers’ Continuance Intention: An Environmental Psychology Approach. Sport Manag. Rev. 2020, 23, 615–625. [Google Scholar] [CrossRef]
- Lin, S.; Döngül, E.S.; Uygun, S.V.; Öztürk, M.B.; Huy, D.T.N.; Tuan, P.V. Exploring the Relationship between Abusive Management, Self-Efficacy and Organizational Performance in the Context of Human–Machine Interaction Technology and Artificial Intelligence with the Effect of Ergonomics. Sustainability 2022, 14, 1949. [Google Scholar] [CrossRef]
- Privitera, M.; Ferrari, K.D.; von Ziegler, L.M.; Sturman, O.; Duss, S.N.; Floriou-Servou, A.; Germain, P.-L.; Vermeiren, Y.; Wyss, M.T.; de Deyn, P.P.; et al. A Complete Pupillometry Toolbox for Real-Time Monitoring of Locus Coeruleus Activity in Rodents. Nat. Protoc. 2020, 15, 2301–2320. [Google Scholar] [CrossRef]
- Rebelo, F.; Noriega, P.; Vilar, E.; Filgueiras, E. Ergonomics and Human Factors Research Challenges: The ErgoUX Lab Case Study. In Advances in Ergonomics in Design; Rebelo, F., Ed.; Lecture Notes in Networks and Systems; Springer International Publishing: Cham, Switzerland, 2021; Volume 261, pp. 912–922. [Google Scholar] [CrossRef]
- Khan, F. Making Savings Count. Nat. Energy 2018, 3, 354. [Google Scholar] [CrossRef]
- Zhang, B.; Kang, J. Effect of Environmental Contexts Pertaining to Different Sound Sources on the Mood States. Build. Environ. 2022, 207, 108456. [Google Scholar] [CrossRef]
- Zhu, B.-W.; Xiao, Y.H.; Zheng, W.-Q.; Xiong, L.; He, X.Y.; Zheng, J.-Y.; Chuang, Y.-C. A Hybrid Multiple-Attribute Decision-Making Model for Evaluating the Esthetic Expression of Environmental Design Schemes. SAGE Open 2022, 12, 215824402210872. [Google Scholar] [CrossRef]
- Silva, P.L.; Kiefer, A.; Riley, M.A.; Chemero, A. Trading Perception and Action for Complex Cognition: Application of Theoretical Principles from Ecological Psychology to the Design of Interventions for Skill Learning. In Handbook of Embodied Cognition and Sport Psychology; MIT Press: Boston, MA, USA, 2019; pp. 47–74. [Google Scholar]
- Szokolszky, A. Perceiving Metaphors: An Approach from Developmental Ecological Psychology. Metaphor Symb. 2019, 34, 17–32. [Google Scholar] [CrossRef]
- Van den Berg, P.; Larosi, H.; Maussen, S.; Arentze, T. Sense of Place, Shopping Area Evaluation, and Shopping Behaviour. Geogr. Res. 2021, 59, 584–598. [Google Scholar] [CrossRef]
- Argent, N. Behavioral Geography. In International Encyclopedia of Geography: People, the Earth, Environment and Technology; Richardson, D., Castree, N., Goodchild, M.F., Kobayashi, A., Liu, W., Marston, R.A., Eds.; John Wiley & Sons, Ltd: Oxford, UK, 2017; pp. 1–11. [Google Scholar] [CrossRef]
- Schwarz, N.; Dressler, G.; Frank, K.; Jager, W.; Janssen, M.; Müller, B.; Schlüter, M.; Wijermans, N.; Groeneveld, J. Formalising Theories of Human Decision-Making for Agent-Based Modelling of Social-Ecological Systems: Practical Lessons Learned and Ways Forward. SESMO 2020, 2, 16340. [Google Scholar] [CrossRef]
- Plutchik, R. The Emotions, Rev. ed.; University Press of America: Lanham, MD, USA, 1991. [Google Scholar]
- Kaklauskas, A.; Milevicius, V.; Kaklauskiene, L. Effects of Country Success on COVID-19 Cumulative Cases and Excess Deaths in 169 Countries. Ecol. Indic. 2022, 137, 108703. [Google Scholar] [CrossRef]
- Kaklauskas, A. Degree of project utility and investment value assessments. Int. J. Comput. Commun. Control. 2016, 11, 666–683. [Google Scholar] [CrossRef]
- Kaklauskas, A.; Herrera-Viedma, E.; Echenique, V.; Zavadskas, E.K.; Ubarte, I.; Mostert, A.; Podvezko, V.; Binkyte, A.; Podviezko, A. Multiple Criteria Analysis of Environmental Sustainability and Quality of Life in Post-Soviet States. Ecol. Indic. 2018, 89, 781–807. [Google Scholar] [CrossRef]
- Kaklauskas, A.; Dias, W.P.S.; Binkyte-Veliene, A.; Abraham, A.; Ubarte, I.; Randil, O.P.C.; Siriwardana, C.S.A.; Lill, I.; Milevicius, V.; Podviezko, A.; et al. Are Environmental Sustainability and Happiness the Keys to Prosperity in Asian Nations? Ecol. Indic. 2020, 119, 106562. [Google Scholar] [CrossRef]
- Kaklauskas, A.; Kaklauskiene, L. Analysis of the impact of success on three dimensions of sustainability in 173 countries. Sci. Rep. 2022, 12, 14719. [Google Scholar] [CrossRef]
- Barrett, L.F. Solving the Emotion Paradox: Categorization and the Experience of Emotion. Pers. Soc. Psychol. Rev. 2006, 10, 20–46. [Google Scholar] [CrossRef] [PubMed]
- Puce, A.; Latinus, M.; Rossi, A.; da Silva, E.; Parada, F.; Love, S.; Ashourvan, A.; Jayaraman, S. Neural Bases for Social Attention in Healthy Humans. In The Many Faces of Social Attention; Puce, A., Bertenthal, B.I., Eds.; Springer International Publishing: Cham, Switzerland, 2015; pp. 93–127. [Google Scholar] [CrossRef]
- Shablack, H.; Becker, M.; Lindquist, K.A. How Do Children Learn Novel Emotion Words? A Study of Emotion Concept Acquisition in Preschoolers. J. Exp. Psychol. Gen. 2020, 149, 1537–1553. [Google Scholar] [CrossRef] [PubMed]
- Izard, C.E. Basic Emotions, Natural Kinds, Emotion Schemas, and a New Paradigm. Perspect. Psychol. Sci. 2007, 2, 260–280. [Google Scholar] [CrossRef] [PubMed]
- Briesemeister, B.B.; Kuchinke, L.; Jacobs, A.M. Discrete Emotion Effects on Lexical Decision Response Times. PLoS ONE 2011, 6, e23743. [Google Scholar] [CrossRef] [PubMed]
- Ekman, P. An Argument for Basic Emotions. Cogn. Emot. 1992, 6, 169–200. [Google Scholar] [CrossRef]
- Ekman, P. Facial Expressions. In Handbook of Cognition and Emotion; Dalgleish, T., Power, M.J., Eds.; John Wiley & Sons, Ltd: Chichester, UK, 1999; pp. 301–320. [Google Scholar] [CrossRef]
- Colombetti, G. From Affect Programs to Dynamical Discrete Emotions. Philos. Psychol. 2009, 22, 407–425. [Google Scholar] [CrossRef]
- Fox, E. Emotion Science: Cognitive and Neuroscientific Approaches to Understanding Human Emotions; Palgrave Macmillan: Basingstoke, UK; New York, NY, USA, 2008. [Google Scholar]
- Russell, J.A.; Barrett, L.F. Core Affect, Prototypical Emotional Episodes, and Other Things Called Emotion: Dissecting the Elephant. J. Personal. Soc. Psychol. 1999, 76, 805–819. [Google Scholar] [CrossRef]
- Cross Francis, D.I.; Hong, J.; Liu, J.; Eker, A.; Lloyd, K.; Bharaj, P.K.; Jeon, M. The Dominance of Blended Emotions: A Qualitative Study of Elementary Teachers’ Emotions Related to Mathematics Teaching. Front. Psychol. 2020, 11, 1865. [Google Scholar] [CrossRef]
- Hakak, N.M.; Mohd, M.; Kirmani, M.; Mohd, M. Emotion Analysis: A Survey. In 2017 International Conference on Computer, Communications and Electronics (Comptelix), Jaipur, India, 1–2 July 2017; IEEE: Jaipur, India, 2017; pp. 397–402. [Google Scholar] [CrossRef]
- Posner, J.; Russell, J.A.; Peterson, B.S. The Circumplex Model of Affect: An Integrative Approach to Affective Neuroscience, Cognitive Development, and Psychopathology. Develop. Psychopathol. 2005, 17, 715–734. [Google Scholar] [CrossRef]
- Eerola, T.; Vuoskoski, J.K. A Comparison of the Discrete and Dimensional Models of Emotion in Music. Psychol. Music 2011, 39, 18–49. [Google Scholar] [CrossRef]
- Dzedzickis, A.; Kaklauskas, A.; Bucinskas, V. Human Emotion Recognition: Review of Sensors and Methods. Sensors 2020, 20, 592. [Google Scholar] [CrossRef]
- Bradley, M.M.; Greenwald, M.K.; Petry, M.C.; Lang, P.J. Remembering Pictures: Pleasure and Arousal in Memory. J. Exp. Psychol. Learn. Mem. Cogn. 1992, 18, 379–390. [Google Scholar] [CrossRef]
- Rubin, D.C.; Talarico, J.M. A Comparison of Dimensional Models of Emotion: Evidence from Emotions, Prototypical Events, Autobiographical Memories, and Words. Memory 2009, 17, 802–808. [Google Scholar] [CrossRef]
- Watson, D.; Tellegen, A. Toward a Consensual Structure of Mood. Psychol. Bull. 1985, 98, 219–235. [Google Scholar] [CrossRef]
- Karbauskaitė, R.; Sakalauskas, L.; Dzemyda, G. Kriging Predictor for Facial Emotion Recognition Using Numerical Proximities of Human Emotions. Informatica 2020, 31, 249–275. [Google Scholar] [CrossRef]
- Mehrabian, A. Framework for a Comprehensive Description and Measurement of Emotional States. Genet. Soc. Gen. Psychol. Monogr. 1995, 121, 339–361. [Google Scholar]
- Mehrabian, A. Correlations of the PAD Emotion Scales with Self-Reported Satisfaction in Marriage and Work. Genet. Soc. Gen. Psychol. Monogr. 1998, 124, 311–334. [Google Scholar]
- Detandt, S.; Leys, C.; Bazan, A. A French Translation of the Pleasure Arousal Dominance (PAD) Semantic Differential Scale for the Measure of Affect and Drive. Psychol. Belg. 2017, 57, 17. [Google Scholar] [CrossRef]
- Kaklauskas, A.; Bucinskas, V.; Dzedzickis, A.; Ubarte, I. Method for Controlling a Customized Microclimate in a Building and Realization System Thereof. European Patent Application. EP 4 020 134 A1, 7 February 2021. [Google Scholar]
- Nor, N.M.; Wahab, A.; Majid, H.; Kamaruddin, N. Pre-Post Accident Analysis Relates to Pre-Cursor Emotion for Driver Behavior Understanding. In Proceedings of the 11th WSEAS International Conference on Applied Computer Science, Rovaniemi, Finland, 18–20 April 2012; World Scientific and Engineering Academy and Society (WSEAS): Stevens Point, WI, USA; pp. 152–157. [Google Scholar]
- Kolmogorova, A.; Kalinin, A.; Malikova, A. Non-Discrete Sentiment Dataset Annotation: Case Study for Lövheim Cube Emotional Model. In Digital Transformation and Global Society; Alexandrov, D.A., Boukhanovsky, A.V., Chugunov, A.V., Kabanov, Y., Koltsova, O., Musabirov, I., Eds.; Communications in Computer and Information Science; Springer International Publishing: Cham, Switzerland, 2020; Volume 1242, pp. 154–164. [Google Scholar] [CrossRef]
- Lövheim, H. A New Three-Dimensional Model for Emotions and Monoamine Neurotransmitters. Med. Hypotheses 2012, 78, 341–348. [Google Scholar] [CrossRef]
- Mohsin, M.A.; Beltiukov, A. Summarizing Emotions from Text Using Plutchik’s Wheel of Emotions. In Proceedings of the 7th Scientific Conference on Information Technologies for Intelligent Decision Making Support (ITIDS 2019); Atlantis Press: Ufa, Russia, 2019. [Google Scholar] [CrossRef]
- Donaldson, M. A Plutchik’s Wheel of Emotions—2017 Update. 2018. Available online: https://www.uvm.edu/~mjk/013%20Intro%20to%20Wildlife%20Tracking/Plutchik’s%20Wheel%20of%20Emotions%20-%202017%20Update%20_%20Six%20Seconds.pdf (accessed on 5 September 2022).
- Mulder, P. Robert Plutchik’s Wheel of Emotions. 2018. Available online: https://www.toolshero.com/psychology/wheel-of-emotions-plutchik/ (accessed on 5 September 2022).
- Kołakowska, A.; Landowska, A.; Szwoch, M.; Szwoch, W.; Wróbel, M.R. Modeling Emotions for Affectaware Applications. In Information Systems Development and Applications; Faculty of Management, University of Gdańsk: Gdańsk, Poland, 2015; pp. 55–69. [Google Scholar]
- Suttles, J.; Ide, N. Distant Supervision for Emotion Classification with Discrete Binary Values. In Computational Linguistics and Intelligent Text Processing; Gelbukh, A., Hutchison, D., Kanade, T., Kittler, J., Kleinberg, J.M., Mattern, F., Mitchell, J.C., Naor, M., Eds.; Lecture Notes in Computer Science; Springer: Berlin/Heidelberg, Germany, 2013; Volume 7817, pp. 121–136. [Google Scholar] [CrossRef]
- Six seconds The Emotional Intelligence Network. Plutchik’s Wheel of Emotions: Exploring the Emotion Wheel. Available online: https://www.6seconds.org/2022/03/13/plutchik-wheel-emotions/ (accessed on 5 September 2022).
- Karnilowicz, H.R. The Emotion Wheel: Purpose, Definition, and Uses. Available online: https://www.berkeleywellbeing.com/emotion-wheel.html (accessed on 17 August 2022).
- Cambria, E.; Livingstone, A.; Hussain, A. The Hourglass of Emotions. In Cognitive Behavioural Systems; Esposito, A., Esposito, A.M., Vinciarelli, A., Hoffmann, R., Müller, V.C., Hutchison, D., Kanade, T., Eds.; Lecture Notes in Computer Science; Springer: Berlin/Heidelberg, Germany, 2012; Volume 7403, pp. 144–157. [Google Scholar] [CrossRef]
- Plutchik, R.; Kellerman, H. Theories of Emotion; Academic Press: Cambridge, MA, USA, 2013. [Google Scholar]
- Kušen, E.; Strembeck, M.; Cascavilla, G.; Conti, M. On the Influence of Emotional Valence Shifts on the Spread of Information in Social Networks. In Proceedings of the 2017 IEEE/ACM International Conference on Advances in Social Networks Analysis and Mining 2017, Sydney, Australia, 31 July–3 August 2017; ACM: Sydney, Australia, 2017; pp. 321–324. [Google Scholar] [CrossRef]
- Bassett, D.S.; Sporns, O. Network Neuroscience. Nat. Neurosci. 2017, 20, 353–364. [Google Scholar] [CrossRef]
- Deion, A. 8 Top Trends of Future Sensors. 2021. Available online: https://community.hackernoon.com/t/8-top-trends-of-future-sensors/57483 (accessed on 5 September 2022).
- Gartner; Panetta, K. Gartner Top Strategic Technology Trends for 2021. 2020. Available online: https://www.gartner.com/smarterwithgartner/gartner-top-strategic-technology-trends-for-2021 (accessed on 17 August 2022).
- Kobus, H. Future Sensor Technology: 21 Expected Trends. Available online: https://www.sentech.nl/en/rd-engineer/21-sensor-technology-future-trends/ (accessed on 5 September 2022).
- Sebastian, V. Neuromarketing and Evaluation of Cognitive and Emotional Responses of Consumers to Marketing Stimuli. Procedia-Soc. Behav. Sci. 2014, 127, 753–757. [Google Scholar] [CrossRef]
- Sawe, N.; Chawla, K. Environmental Neuroeconomics: How Neuroscience Can Inform Our Understanding of Human Responses to Climate Change. Curr. Opin. Behav. Sci. 2021, 42, 147–154. [Google Scholar] [CrossRef]
- Serra, D. Neuroeconomics: Reliable, Scientifically Legitimate and Useful Knowledge for Economists? 2020. Available online: https://hal.inrae.fr/hal-02956441 (accessed on 5 September 2022).
- Braeutigam, S. Neuroeconomics—From Neural Systems to Economic Behaviour. Brain Res. Bull. 2005, 67, 355–360. [Google Scholar] [CrossRef]
- Kenning, P.; Plassmann, H. NeuroEconomics: An Overview from an Economic Perspective. Brain Res. Bull. 2005, 67, 343–354. [Google Scholar] [CrossRef]
- Wirdayanti, Y.N.; Ghoni, M.A. Neuromanagement Under the Light of Maqasid Sharia. Al Tijarah 2020, 5, 63–71. [Google Scholar] [CrossRef]
- Teacu Parincu, A.M.; Capatina, A.; Varon, D.J.; Bennet, P.F.; Recuerda, A.M. Neuromanagement: The Scientific Approach to Contemporary Management. Proc. Int. Conf. Bus. Excell. 2020, 14, 1046–1056. [Google Scholar] [CrossRef]
- Arce, A.L.; Cordero, J.M.B.; Mejía, E.T.; González, B.P. Tools of Neuromanagement, to Strengthen the Leadership Competencies of Executives in the Logistics Areas of the Auto Parts Industry. StrategyTechnol. Soc. 2020, 10, 36–63. [Google Scholar]
- Michalczyk, S.; Jung, D.; Nadj, M.; Knierim, M.T.; Rissler, R. BrownieR: The R-Package for Neuro Information Systems Research. In Information Systems and Neuroscience; Davis, F.D., Riedl, R., vom Brocke, J., Léger, P.-M., Randolph, A.B., Eds.; Lecture Notes in Information Systems and Organisation; Springer International Publishing: Cham, Switzerland, 2019; Volume 29, pp. 101–109. [Google Scholar] [CrossRef]
- Riedl, R.; Léger, P. Neuro-Information-Systems (NeuroIS). In Association for Information Systems; Springer: Berlin/Heidelberg, Germany, 2016. [Google Scholar] [CrossRef]
- Ma, Q.; Ji, W.; Fu, H.; Bian, J. Neuro-Industrial Engineering: The New Stage of Modern IE—From the Human-Oriented Perspective. Int. J. Serv. Oper. Inform. 2012, 7, 150–166. [Google Scholar] [CrossRef]
- Rymer, W.Z. Neural Engineering. Encyclopedia Britannica. 2018. Available online: https://www.britannica.com/science/neural-engineering (accessed on 5 September 2022).
- Hodson, H. Hang on Your Every Word. New Sci. 2014, 222, 20. [Google Scholar]
- Tzirakis, P.; Zhang, J.; Schuller, B.W. End-to-End Speech Emotion Recognition Using Deep Neural Networks. In 2018 IEEE International Conference on Acoustics, Speech and Signal Processing (ICASSP), Calgary, AB, Canada, 15–20 April 2018; IEEE: Calgary, AB, Canada, 2018; pp. 5089–5093. [Google Scholar] [CrossRef]
- Parkin, B.L.; Ekhtiari, H.; Walsh, V.F. Non-Invasive Human Brain Stimulation in Cognitive Neuroscience: A Primer. Neuron 2015, 87, 932–945. [Google Scholar] [CrossRef]
- Annavarapu, R.N.; Kathi, S.; Vadla, V.K. Non-Invasive Imaging Modalities to Study Neurodegenerative Diseases of Aging Brain. J. Chem. Neuroanat. 2019, 95, 54–69. [Google Scholar] [CrossRef] [PubMed]
- Bergmann, T.O.; Karabanov, A.; Hartwigsen, G.; Thielscher, A.; Siebner, H.R. Combining Non-Invasive Transcranial Brain Stimulation with Neuroimaging and Electrophysiology: Current Approaches and Future Perspectives. NeuroImage 2016, 140, 4–19. [Google Scholar] [CrossRef] [PubMed]
- Cao, M.; Galvis, D.; Vogrin, S.J.; Woods, W.P.; Vogrin, S.; Wang, F.; Woldman, W.; Terry, J.R.; Peterson, A.; Plummer, C.; et al. Virtual Intracranial EEG Signals Reconstructed from MEG with Potential for Epilepsy Surgery. Nat. Commun. 2022, 13, 994. [Google Scholar] [CrossRef] [PubMed]
- Currà, A.; Gasbarrone, R.; Cardillo, A.; Trompetto, C.; Fattapposta, F.; Pierelli, F.; Missori, P.; Bonifazi, G.; Serranti, S. Near-Infrared Spectroscopy as a Tool for in Vivo Analysis of Human Muscles. Sci. Rep. 2019, 9, 8623. [Google Scholar] [CrossRef]
- De Camp, N.V.; Kalinka, G.; Bergeler, J. Light-Cured Polymer Electrodes for Non-Invasive EEG Recordings. Sci. Rep. 2018, 8, 14041. [Google Scholar] [CrossRef]
- Etchell, A.C.; Civier, O.; Ballard, K.J.; Sowman, P.F. A Systematic Literature Review of Neuroimaging Research on Developmental Stuttering between 1995 and 2016. J. Fluen. Disord. 2018, 55, 6–45. [Google Scholar] [CrossRef]
- Peters, J.C.; Reithler, J.; de Graaf, T.A.; Schuhmann, T.; Goebel, R.; Sack, A.T. Concurrent Human TMS-EEG-FMRI Enables Monitoring of Oscillatory Brain State-Dependent Gating of Cortico-Subcortical Network Activity. Commun. Biol. 2020, 3, 40. [Google Scholar] [CrossRef]
- Shibasaki, H. Human Brain Mapping: Hemodynamic Response and Electrophysiology. Clin. Neurophysiol. 2008, 119, 731–743. [Google Scholar] [CrossRef]
- Silberstein, R.B.; Nield, G.E. Brain Activity Correlates of Consumer Brand Choice Shift Associated with Television Advertising. Int. J. Advert. 2008, 27, 359–380. [Google Scholar] [CrossRef]
- Uludag, U.; Pankanti, S.; Prabhakar, S.; Jain, A.K. Biometric Cryptosystems: Issues and Challenges. Proc. IEEE 2004, 92, 948–960. [Google Scholar] [CrossRef]
- Presby, D.M.; Capodilupo, E.R. Biometrics from a Wearable Device Reveal Temporary Effects of COVID-19 Vaccines on Cardiovascular, Respiratory, and Sleep Physiology. J. Appl. Physiol. 2022, 132, 448–458. [Google Scholar] [CrossRef]
- Stephen, M.J.; Reddy, P. Implementation of Easy Fingerprint Image Authentication with Traditional Euclidean and Singular Value Decomposition Algorithms. Int. J. Adv. Soft Comput. Its Appl. 2011, 3, 1–19. [Google Scholar]
- Banirostam, H.; Shamsinezhad, E.; Banirostam, T. Functional Control of Users by Biometric Behavior Features in Cloud Computing. In 2013 4th International Conference on Intelligent Systems, Modelling and Simulation, Bangkok, Thailand, 29–30 January 2013; IEEE: Bangkok, Thailand, 2013; pp. 94–98. [Google Scholar] [CrossRef]
- Yang, W.; Wang, S.; Hu, J.; Zheng, G.; Chaudhry, J.; Adi, E.; Valli, C. Securing Mobile Healthcare Data: A Smart Card Based Cancelable Finger-Vein Bio-Cryptosystem. IEEE Access 2018, 6, 36939–36947. [Google Scholar] [CrossRef]
- Kodituwakku, S.R. Biometric Authentication: A Review. Int. J. Trend Res. Dev. 2015, 2, 113–123. [Google Scholar]
- Jain, A.; Hong, L.; Pankanti, S. Biometric Identification. Commun. ACM 2000, 43, 90–98. [Google Scholar] [CrossRef]
- Choudhary, S.K.; Naik, A.K. Multimodal Biometric Authentication with Secured Templates—A Review. In 2019 3rd International Conference on Trends in Electronics and Informatics (ICOEI), Tirunelveli, India, 23–25 April 2019; IEEE: Tirunelveli, India, 2019; pp. 1062–1069. [Google Scholar] [CrossRef]
- Kim, J.S.; Pan, S.B. A Study on EMG-Based Biometrics. Internet Serv. Inf. Secur. (JISIS) 2017, 7, 19–31. [Google Scholar]
- Maiorana, E. Deep Learning for EEG-Based Biometric Recognition. Neurocomputing 2020, 410, 374–386. [Google Scholar] [CrossRef]
- Revett, K. Cognitive Biometrics: A Novel Approach to Person Authentication. IJCB 2012, 1, 1–9. [Google Scholar] [CrossRef]
- Prasse, P.; Jäger, L.A.; Makowski, S.; Feuerpfeil, M.; Scheffer, T. On the Relationship between Eye Tracking Resolution and Performance of Oculomotoric Biometric Identification. Procedia Comput. Sci. 2020, 176, 2088–2097. [Google Scholar] [CrossRef]
- Cho, Y. Rethinking Eye-Blink: Assessing Task Difficulty through Physiological Representation of Spontaneous Blinking. In Proceedings of the 2021 CHI Conference on Human Factors in Computing Systems, Yokohama, Japan, 8–13 May 2021; ACM: Yokohama, Japan, 2021; pp. 1–12. [Google Scholar] [CrossRef]
- Abdulrahman, S.A.; Alhayani, B. A Comprehensive Survey on the Biometric Systems Based on Physiological and Behavioural Characteristics. Mater. Today Proc. 2021, In Press, Corrected Proof. S2214785321048513. [Google Scholar] [CrossRef]
- Allado, E.; Poussel, M.; Moussu, A.; Saunier, V.; Bernard, Y.; Albuisson, E.; Chenuel, B. Innovative Measurement of Routine Physiological Variables (Heart Rate, Respiratory Rate and Oxygen Saturation) Using a Remote Photoplethysmography Imaging System: A Prospective Comparative Trial Protocol. BMJ Open 2021, 11, e047896. [Google Scholar] [CrossRef] [PubMed]
- Dargan, S.; Kumar, M. A Comprehensive Survey on the Biometric Recognition Systems Based on Physiological and Behavioral Modalities. Expert Syst. Appl. 2020, 143, 113114. [Google Scholar] [CrossRef]
- Mordini, E.; Tzovaras, D.; Ashton, H. Introduction. In Second Generation Biometrics: The Ethical, Legal and Social Context; Mordini, E., Tzovaras, D., Eds.; The International Library of Ethics, Law and Technology; Springer: Dordrecht, The Netherlands, 2012; Volume 11, pp. 1–19. [Google Scholar] [CrossRef]
- Fuster, G.G. Artificial Intelligence and Law Enforcement: Impact on Fundamental Rights (European Parliament 2020). 2020. Available online: http://www.europarl.europa.eu/supporting-analyses (accessed on 5 September 2022).
- Ghilardi, G.; Keller, F. Epistemological Foundation of Biometrics. In Second Generation Biometrics: The Ethical, Legal and Social Context; Mordini, E., Tzovaras, D., Eds.; The International Library of Ethics, Law and Technology; Springer: Dordrecht, The Netherlands, 2012; Volume 11, pp. 23–47. [Google Scholar] [CrossRef]
- Riera, A.; Dunne, S.; Cester, I.; Ruffini, G. Electrophysiological biometrics: Opportunities and risks. In Second Generation Biometrics: The Ethical, Legal and Social Context; Mordini, E., Tzovaras, D., Eds.; The International Library of Ethics, Law and Technology; Springer: Dordrecht, The Netherlands, 2012; Volume 11, pp. 149–176. [Google Scholar] [CrossRef]
- Smith, M.; Mann, M.; Urbas, G. Biometrics, Crime and Security; Law, science and society; Routledge: New York, NY, USA, 2018. [Google Scholar]
- Simó, F.Z. Then and Now. Profuturo 2019, 9, 78–90. [Google Scholar] [CrossRef]
- U.S Department of Homeland Security. Future Attribute Screening Technology. 2014. Available online: https://www.dhs.gov/sites/default/files/publications/Future%20Attribute%20Screening%20Technology-FAST.pdf (accessed on 5 September 2022).
- Alhalaseh, R.; Alasasfeh, S. Machine-Learning-Based Emotion Recognition System Using EEG Signals. Computers 2020, 9, 95. [Google Scholar] [CrossRef]
- Ma, X.; Jiang, X.; Jiang, Y. Increased Spontaneous Fronto-Central Oscillatory Power during Eye Closing in Patients with Multiple Somatic Symptoms. Psychiatry Res. Neuroimaging 2022, 324. [Google Scholar] [CrossRef]
- Ramesh, S.; Gomathi, S.; Sasikala, S.; Saravanan, T.R. Automatic Speech Emotion Detection Using Hybrid of Gray Wolf Optimizer and Naïve Bayes. Int. J. Speech Technol. 2021, 1–8. [Google Scholar] [CrossRef]
- Moses, E.; Clark, K.R.; Jacknis, N.J. The Future of Advertising: Influencing and Predicting Response Through Artificial Intelligence, Machine Learning, and Neuroscience. In Advances in Business Information Systems and Analytics; Chkoniya, V., Ed.; IGI Global: Hershey, PA, USA, 2021; pp. 151–166. [Google Scholar] [CrossRef]
- Sun, L.; Fu, S.; Wang, F. Decision Tree SVM Model with Fisher Feature Selection for Speech Emotion Recognition. J. Audio Speech Music Proc. 2019, 2019, 2. [Google Scholar] [CrossRef]
- Sun, L.; Zou, B.; Fu, S.; Chen, J.; Wang, F. Speech Emotion Recognition Based on DNN-Decision Tree SVM Model. Speech Commun. 2019, 115, 29–37. [Google Scholar] [CrossRef]
- Chen, L.; Su, W.; Feng, Y.; Wu, M.; She, J.; Hirota, K. Two-Layer Fuzzy Multiple Random Forest for Speech Emotion Recognition in Human-Robot Interaction. Inf. Sci. 2020, 509, 150–163. [Google Scholar] [CrossRef]
- Rai, M.; Husain, A.A.; Sharma, R.; Maity, T.; Yadav, R. Facial Feature-Based Human Emotion Detection Using Machine Learning: An Overview. In Artificial Intelligence and Cybersecurity; CRC Press: Boca Raton, FL, USA, 2022; pp. 107–120. [Google Scholar]
- Zhang, J.; Yin, Z.; Chen, P.; Nichele, S. Emotion Recognition Using Multi-Modal Data and Machine Learning Techniques: A Tutorial and Review. Inf. Fusion 2020, 59, 103–126. [Google Scholar] [CrossRef]
- Aouani, H.; Ben Ayed, Y. Deep Support Vector Machines for Speech Emotion Recognition. In Intelligent Systems Design and Applications; Abraham, A., Siarry, P., Ma, K., Kaklauskas, A., Eds.; Advances in Intelligent Systems and Computing; Springer International Publishing: Cham, Switzerland, 2021; Volume 1181, pp. 406–415. [Google Scholar] [CrossRef]
- Bhavan, A.; Chauhan, P.; Hitkul; Shah, R.R. Bagged Support Vector Machines for Emotion Recognition from Speech. Knowl.-Based Syst. 2019, 184, 104886. [Google Scholar] [CrossRef]
- Miller, C.H.; Sacchet, M.D.; Gotlib, I.H. Support Vector Machines and Affective Science. Emot. Rev. 2020, 12, 297–308. [Google Scholar] [CrossRef]
- Abo, M.E.M.; Idris, N.; Mahmud, R.; Qazi, A.; Hashem, I.A.T.; Maitama, J.Z.; Naseem, U.; Khan, S.K.; Yang, S. A Multi-Criteria Approach for Arabic Dialect Sentiment Analysis for Online Reviews: Exploiting Optimal Machine Learning Algorithm Selection. Sustainability 2021, 13, 10018. [Google Scholar] [CrossRef]
- Singh, B.K.; Khare, A.; Soni, A.K.; Kumar, A. Electroencephalography-Based Classification of Human Emotion: A Hybrid Strategy in Machine Learning Paradigm. Int. J. Comput. Vis. Robot. 2019, 9, 583–598. [Google Scholar] [CrossRef]
- Yudhana, A.; Muslim, A.; Wati, D.E.; Puspitasari, I.; Azhari, A.; Mardhia, M.M. Human Emotion Recognition Based on EEG Signal Using Fast Fourier Transform and K-Nearest Neighbor. Adv. Sci. Technol. Eng. Syst. J. 2020, 5, 1082–1088. [Google Scholar] [CrossRef]
- Assielou, K.A.; Haba, C.T.; Gooré, B.T.; Kadjo, T.L.; Yao, K.D. Emotional Impact for Predicting Student Performance in Intelligent Tutoring Systems (ITS). Int. J. Adv. Comput. Sci. Appl. 2020, 11, 219–225. [Google Scholar] [CrossRef]
- Lenzoni, S.; Bozzoni, V.; Burgio, F.; de Gelder, B.; Wennberg, A.; Botta, A.; Pegoraro, E.; Semenza, C. Recognition of Emotions Conveyed by Facial Expression and Body Postures in Myotonic Dystrophy (DM). Cortex 2020, 127, 58–66. [Google Scholar] [CrossRef]
- Li, Y.; Zheng, W.; Cui, Z.; Zong, Y.; Ge, S. EEG Emotion Recognition Based on Graph Regularized Sparse Linear Regression. Neural Process Lett. 2019, 49, 555–571. [Google Scholar] [CrossRef]
- Loos, E.; Egli, T.; Coynel, D.; Fastenrath, M.; Freytag, V.; Papassotiropoulos, A.; de Quervain, D.J.-F.; Milnik, A. Predicting Emotional Arousal and Emotional Memory Performance from an Identical Brain Network. NeuroImage 2019, 189, 459–467. [Google Scholar] [CrossRef]
- Tottenham, N.; Weissman, M.M.; Wang, Z.; Warner, V.; Gameroff, M.J.; Semanek, D.P.; Hao, X.; Gingrich, J.A.; Peterson, B.S.; Posner, J.; et al. Depression Risk Is Associated with Weakened Synchrony Between the Amygdala and Experienced Emotion. Biol. Psychiatry Cogn. Neurosci. Neuroimaging 2021, 6, 343–351. [Google Scholar] [CrossRef]
- Doma, V.; Pirouz, M. A Comparative Analysis of Machine Learning Methods for Emotion Recognition Using EEG and Peripheral Physiological Signals. J. Big Data 2020, 7, 18. [Google Scholar] [CrossRef]
- Pan, C.; Shi, C.; Mu, H.; Li, J.; Gao, X. EEG-Based Emotion Recognition Using Logistic Regression with Gaussian Kernel and Laplacian Prior and Investigation of Critical Frequency Bands. Appl. Sci. 2020, 10, 1619. [Google Scholar] [CrossRef]
- Rafi, T.H.; Farhan, F.; Hoque, M.Z.; Quayyum FMRafi, T.H.; Farhan, F.; Hoque, M.Z.; Quayyum, F.M. Electroencephalogram (EEG) Brainwave Signal-Based Emotion Recognition Using Extreme Gradient Boosting Algorithm. Ann. Eng. 2020, 1, 1–19. [Google Scholar]
- Jackson-Koku, G.; Grime, P. Emotion Regulation and Burnout in Doctors: A Systematic Review. Occup. Med. 2019, 69, 9–21. [Google Scholar] [CrossRef]
- Shams, S. Predicting Coronavirus Anxiety Based on Cognitive Emotion Regulation Strategies, Anxiety Sensitivity, and Psychological Hardiness in Nurses. Q. J. Nurs. Manag. 2021, 10, 25–36. [Google Scholar]
- Scribner, D.R. Predictors of Shoot–Don’t Shoot Decision-Making Performance: An Examination of Cognitive and Emotional Factors. J. Cogn. Eng. Decis. Mak. 2016, 10, 3–13. [Google Scholar] [CrossRef]
- Smith, G. Be Wary of Black-Box Trading Algorithms. JOI 2019, 28, 7–15. [Google Scholar] [CrossRef]
- Hajarolasvadi, N.; Demirel, H. 3D CNN-Based Speech Emotion Recognition Using K-Means Clustering and Spectrograms. Entropy 2019, 21, 479. [Google Scholar] [CrossRef] [PubMed]
- Morawetz, C.; Riedel, M.C.; Salo, T.; Berboth, S.; Eickhoff, S.B.; Laird, A.R.; Kohn, N. Multiple Large-Scale Neural Networks Underlying Emotion Regulation. Neurosci. Biobehav. Rev. 2020, 116, 382–395. [Google Scholar] [CrossRef] [PubMed]
- Zou, L.; Guo, Q.; Xu, Y.; Yang, B.; Jiao, Z.; Xiang, J. Functional Connectivity Analysis of the Neural Bases of Emotion Regulation: A Comparison of Independent Component Method with Density-Based k-Means Clustering Method. Technol. Health Care 2016, 24, S817–S825. [Google Scholar] [CrossRef] [PubMed]
- Mohammed, N.S.; Abdul Hassan, K.A. The Effect of the Number of Key-Frames on the Facial Emotion Recognition Accuracy. Eng. Technol. J. 2021, 39, 89–100. [Google Scholar] [CrossRef]
- Shi, F.; Dey, N.; Ashour, A.S.; Sifaki-Pistolla, D.; Sherratt, R.S. Meta-KANSEI Modeling with Valence-Arousal FMRI Dataset of Brain. Cogn. Comput. 2019, 11, 227–240. [Google Scholar] [CrossRef]
- Kaunhoven, R.J.; Dorjee, D. Mindfulness Versus Cognitive Reappraisal: The Impact of Mindfulness-Based Stress Reduction (MBSR) on the Early and Late Brain Potential Markers of Emotion Regulation. Mindfulness 2021, 12, 2266–2280. [Google Scholar] [CrossRef]
- Li, G.; Zhang, W.; Hu, Y.; Wang, J.; Li, J.; Jia, Z.; Zhang, L.; Sun, L.; von Deneen, K.M.; Duan, S.; et al. Distinct Basal Brain Functional Activity and Connectivity in the Emotional-Arousal Network and Thalamus in Patients With Functional Constipation Associated With Anxiety and/or Depressive Disorders. Psychosom. Med. 2021, 83, 707–714. [Google Scholar] [CrossRef]
- Xiao, G.; Ma, Y.; Liu, C.; Jiang, D. A Machine Emotion Transfer Model for Intelligent Human-Machine Interaction Based on Group Division. Mech. Syst. Signal Processing 2020, 142, 106736. [Google Scholar] [CrossRef]
- Li, H.; Xu, H. Deep Reinforcement Learning for Robust Emotional Classification in Facial Expression Recognition. Knowl.-Based Syst. 2020, 204, 106172. [Google Scholar] [CrossRef]
- Li, Y.; Chen, Y. Research on Chorus Emotion Recognition and Intelligent Medical Application Based on Health Big Data. J. Healthc. Eng. 2022, 2022, 1363690. [Google Scholar] [CrossRef]
- Yakovyna, V.; Khavalko, V.; Sherega, V.; Boichuk, A.; Barna, A. Biosignal and Image Processing System for Emotion Recognition Applications. In Proceedings of the IT&AS’2021: Symposium on Information Technologies & Applied Sciences, Bratislava, Slovakia, 5 March 2021; pp. 181–191. [Google Scholar]
- Chan, J.C.P.; Ho, E.S.L. Emotion Transfer for 3D Hand and Full Body Motion Using StarGAN. Computers 2021, 10, 38. [Google Scholar] [CrossRef]
- Global Industry Analysts Inc. Neuroscience—Global Market Trajectory & Analytics. 2021. Available online: https://www.prnewswire.com/news-releases/new-analysis-from-global-industry-analysts-reveals-steady-growth-for-neuroscience-with-the-market-to-reach-36-2-billion-worldwide-by-2026--301404252.html (accessed on 5 September 2022).
- Neuroscience Market. Global Industry Analysis, Size, Share, Growth, Trends, and Forecast, 2021–2031. Available online: https://www.transparencymarketresearch.com/neuroscience-market.html (accessed on 17 August 2022).
- Celeghin, A.; Diano, M.; Bagnis, A.; Viola, M.; Tamietto, M. Basic Emotions in Human Neuroscience: Neuroimaging and Beyond. Front. Psychol. 2017, 8, 1432. [Google Scholar] [CrossRef]
- Sander, D.; Nummenmaa, L. Reward and Emotion: An Affective Neuroscience Approach. Curr. Opin. Behav. Sci. 2021, 39, 161–167. [Google Scholar] [CrossRef]
- Podladchikova, L.N.; Shaposhnikov, D.G.; Kozubenko, E.A. Towards Neuroinformatic Approach for Second-Person Neuroscience. In Advances in Neural Computation, Machine Learning, and Cognitive Research IV.; Kryzhanovsky, B., Dunin-Barkowski, W., Redko, V., Tiumentsev, Y., Eds.; Studies in Computational Intelligence; Springer International Publishing: Cham, Switzerland, 2021; Volume 925, pp. 143–148. [Google Scholar] [CrossRef]
- Tan, C.; Liu, X.; Zhang, G. Inferring Brain State Dynamics Underlying Naturalistic Stimuli Evoked Emotion Changes with DHA-HMM. Neuroinform 2022, 20, 737–753. [Google Scholar] [CrossRef]
- Blair, R.J.R.; Meffert, H.; White, S.F. Psychopathy and Brain Function: Insights from Neuroimaging Research. In Handbook of Psychopathy; The Guilford Press: New York, NY, USA, 2018; pp. 401–421. [Google Scholar]
- Blair, R.J.R.; Mathur, A.; Haines, N.; Bajaj, S. Future Directions for Cognitive Neuroscience in Psychiatry: Recommendations for Biomarker Design Based on Recent Test Re-Test Reliability Work. Curr. Opin. Behav. Sci. 2022, 44, 101102. [Google Scholar] [CrossRef]
- Hamann, S. Integrating Perspectives on Affective Neuroscience: Introduction to the Special Section on the Brain and Emotion. Emot. Rev. 2018, 10, 187–190. [Google Scholar] [CrossRef]
- Shaffer, C.; Westlin, C.; Quigley, K.S.; Whitfield-Gabrieli, S.; Barrett, L.F. Allostasis, Action, and Affect in Depression: Insights from the Theory of Constructed Emotion. Annu. Rev. Clin. Psychol. 2022, 18, 553–580. [Google Scholar] [CrossRef]
- Hackel, L.M.; Amodio, D.M. Computational Neuroscience Approaches to Social Cognition. Curr. Opin. Psychol. 2018, 24, 92–97. [Google Scholar] [CrossRef]
- Smith, R.; Lane, R.D.; Nadel, L.; Moutoussis, M. A Computational Neuroscience Perspective on the Change Process in Psychotherapy. In Neuroscience of Enduring Change; Oxford University Press: New York, NY, USA, 2020; pp. 395–432. [Google Scholar] [CrossRef]
- Hill, K.E.; South, S.C.; Egan, R.P.; Foti, D. Abnormal Emotional Reactivity in Depression: Contrasting Theoretical Models Using Neurophysiological Data. Biol. Psychol. 2019, 141, 35–43. [Google Scholar] [CrossRef]
- Kontaris, I.; East, B.S.; Wilson, D.A. Behavioral and Neurobiological Convergence of Odor, Mood and Emotion: A Review. Front. Behav. Neurosci. 2020, 14, 35. [Google Scholar] [CrossRef]
- Kyrios, M.; Trotzke, P.; Lawrence, L.; Fassnacht, D.B.; Ali, K.; Laskowski, N.M.; Müller, A. Behavioral Neuroscience of Buying-Shopping Disorder: A Review. Curr. Behav. Neurosci. Rep. 2018, 5, 263–270. [Google Scholar] [CrossRef]
- Wang, J.; Cheng, R.; Liao, P.-C. Trends of Multimodal Neural Engineering Study: A Bibliometric Review. Arch. Comput. Methods Eng. 2021, 28, 4487–4501. [Google Scholar] [CrossRef]
- Wu, X.; Zheng, W.-L.; Li, Z.; Lu, B.-L. Investigating EEG-Based Functional Connectivity Patterns for Multimodal Emotion Recognition. J. Neural Eng. 2022, 19, 016012. [Google Scholar] [CrossRef]
- Balconi, M.; Sansone, M. Neuroscience and Consumer Behavior: Where to Now? Front. Psychol. 2021, 12, 705850. [Google Scholar] [CrossRef] [PubMed]
- Serra, D. Decision-Making: From Neuroscience to Neuroeconomics—An Overview. Theory Decis. 2021, 91, 1–80. [Google Scholar] [CrossRef]
- Hinojosa, J.A.; Moreno, E.M.; Ferré, P. Affective Neurolinguistics: Towards a Framework for Reconciling Language and Emotion. Lang. Cogn. Neurosci. 2020, 35, 813–839. [Google Scholar] [CrossRef]
- Wu, C.; Zhang, J. Emotion Word Type Should Be Incorporated in Affective Neurolinguistics: A Commentary on Hinojosa, Moreno and Ferré (2019). Lang. Cogn. Neurosci. 2020, 35, 840–843. [Google Scholar] [CrossRef]
- Burkitt, I. Emotions, Social Activity and Neuroscience: The Cultural-Historical Formation of Emotion. New Ideas Psychol. 2019, 54, 1–7. [Google Scholar] [CrossRef]
- Gluck, M.A.; Mercado, E.; Myers, C.E. Learning and Memory: From Brain to Behavior; Worth Publishers: New York, NY, USA, 2008. [Google Scholar]
- Shaw, S.D.; Bagozzi, R.P. The Neuropsychology of Consumer Behavior and Marketing. Soc. Consum. Psychol. 2018, 1, 22–40. [Google Scholar] [CrossRef]
- Al-Rodhan, N.R.F. Emotional Amoral Egoism: A Neurophilosophy of Human Nature and Motivations, 1st ed.; The Lutterworth Press: Cambridge, UK, 2021. [Google Scholar] [CrossRef]
- Carrozzo, C. Scientific Practice and the Moral Task of Neurophilosophy. AJOB Neurosci. 2019, 10, 115–117. [Google Scholar] [CrossRef]
- Northoff, G. Neurophilosophy and Neuroethics: Template for Neuropsychoanalysis? In Neuropsychodynamic Psychiatry; Boeker, H., Hartwich, P., Northoff, G., Eds.; Springer International Publishing: Cham, Switzerland, 2018; pp. 599–615. [Google Scholar] [CrossRef]
- Chatterjee, A.; Coburn, A.; Weinberger, A. The Neuroaesthetics of Architectural Spaces. Cogn. Process. 2021, 22, 115–120. [Google Scholar] [CrossRef]
- Li, R.; Zhang, J. Review of Computational Neuroaesthetics: Bridging the Gap between Neuroaesthetics and Computer Science. Brain Inf. 2020, 7, 16. [Google Scholar] [CrossRef]
- Nadal, M.; Chatterjee, A. Neuroaesthetics and Art’s Diversity and Universality. WIREs Cogn. Sci. 2019, 10, e1487. [Google Scholar] [CrossRef]
- Klemm, W. Expanding the Vision of Neurotheology: Make Neuroscience Religion’s Ally. J. Spiritual. Ment. Health 2020, 24, 1–16. [Google Scholar] [CrossRef]
- Klemm, W.R. Whither Neurotheology? Religions 2019, 10, 634. [Google Scholar] [CrossRef]
- Newberg, A. Chapter Three. Neuroscience and Neurotheology. In Neurotheology; Columbia University Press: New York, NY, USA, 2018; pp. 46–66. [Google Scholar] [CrossRef]
- Haas, I.J.; Warren, C.; Lauf, S.J. Political Neuroscience: Understanding How the Brain Makes Political Decisions. In Oxford Research Encyclopedia of Politics; Redlawsk, D., Ed.; Oxford University Press: Oxford, UK, 2020. [Google Scholar] [CrossRef]
- Murphy, E. Anarchism and Science. In The Palgrave Handbook of Anarchism; Levy, C., Adams, M.S., Eds.; Springer International Publishing: Cham, Switzerland, 2019; pp. 193–209. [Google Scholar] [CrossRef]
- Yun, J.H.; Kim, Y.; Lee, E.-J. ERP Study of Liberals’ and Conservatives’ Moral Reasoning Processes: Evidence from South Korea. J. Bus. Ethics 2022, 176, 723–739. [Google Scholar] [CrossRef]
- Bush, S.S.; Tussey, C.M. Neuroscience and Neurolaw: Special Issue of Psychological Injury and Law. Psychol. Inj. Law 2013, 6, 1–2. [Google Scholar] [CrossRef]
- Schleim, S. Real Neurolaw in the Netherlands: The Role of the Developing Brain in the New Adolescent Criminal Law. Front. Psychol. 2020, 11, 1762. [Google Scholar] [CrossRef]
- Shen, F.X. The Law and Neuroscience Bibliography: Navigating the Emerging Field of Neurolaw. Int. J. Leg. Inf. 2010, 38, 352–399. [Google Scholar] [CrossRef]
- Long, M.; Verbeke, W.; Ein-Dor, T.; Vrtička, P. A Functional Neuro-Anatomical Model of Human Attachment (NAMA): Insights from First- and Second-Person Social Neuroscience. Cortex 2020, 126, 281–321. [Google Scholar] [CrossRef]
- Weisz, E.; Zaki, J. Motivated Empathy: A Social Neuroscience Perspective. Curr. Opin. Psychol. 2018, 24, 67–71. [Google Scholar] [CrossRef]
- Chiao, J.Y. Developmental Aspects in Cultural Neuroscience. Dev. Rev. 2018, 50, 77–89. [Google Scholar] [CrossRef]
- Chiao, J.Y. Cultural neuroscience: A once and future discipline. Progress in brain research 2009, 178, 287–304. [Google Scholar] [CrossRef]
- Antolin, P. “I Am a Freak of Nature”: Tourette’s and the Grotesque in Jonathan Lethem’s Motherless Brooklyn. Transatlantica 2019, 1, 1–20. [Google Scholar] [CrossRef]
- Burn, S.J. The Gender of the Neuronovel: Joyce Carol Oates and the Double Brain. Eur. J. Am. Stud. 2021, 16, 1–17. [Google Scholar] [CrossRef]
- Rahaman, V.; Sharma, S. Reading an Extremist Mind through Literary Language: Approaching Cognitive Literary Hermeneutics to R.N. Tagore’s Play the Post Office for Neuro-Computational Predictions. In Cognitive Informatics, Computer Modelling, and Cognitive Science; Elsevier: Amsterdam, The Netherlands, 2020; pp. 197–210. [Google Scholar] [CrossRef]
- Ceciu, R.L. Neurocinematics, the (Brain) Child of Film and Neuroscience. J. Commun. Behav. Sci. 2020, 1, 46–62. [Google Scholar]
- Moghadasi, A.N. Evaluation of Neurocinema as An Introduction to an Interdisciplinary Science. CINEJ 2020, 8, 307–323. [Google Scholar] [CrossRef]
- Olenina, A.H. Sergei Eisenstein, Neurocinematics, and Embodied Cognition: A Reassessment. Discourse 2021, 43, 351–382. [Google Scholar] [CrossRef]
- Bearman, H. Music & The Brain–How Music Affects Mood, Cognition, and Mental Health. 2018. Available online: https://www.naturalnootropic.com/music-and-the-brain/ (accessed on 15 August 2022).
- Garg, A.; Chaturvedi, V.; Kaur, A.B.; Varshney, V.; Parashar, A. Machine Learning Model for Mapping of Music Mood and Human Emotion Based on Physiological Signals. Multimed. Tools Appl. 2022, 81, 5137–5177. [Google Scholar] [CrossRef]
- Liu, Y. Research on the Characteristics and Functions of Brain Activity in Musical Performance. Acad. J. Humanit. Soc. Sci. 2020, 3, 71–79. [Google Scholar]
- Berčík, J.; Paluchová, J.; Neomániová, K. Neurogastronomy as a Tool for Evaluating Emotions and Visual Preferences of Selected Food Served in Different Ways. Foods 2021, 10, 354. [Google Scholar] [CrossRef]
- Girona-Ruíz, D.; Cano-Lamadrid, M.; Carbonell-Barrachina, Á.A.; López-Lluch, D.; Esther, S. Aromachology Related to Foods, Scientific Lines of Evidence: A Review. Appl. Sci. 2021, 11, 6095. [Google Scholar] [CrossRef]
- Lim, W.M. Demystifying Neuromarketing. J. Bus. Res. 2018, 91, 205–220. [Google Scholar] [CrossRef]
- Sliwinska, M.W.; Vitello, S.; Devlin, J.T. Transcranial Magnetic Stimulation for Investigating Causal Brain-Behavioral Relationships and Their Time Course. J. Vis. Exp. 2014, 89, e51735. [Google Scholar] [CrossRef] [PubMed]
- Agarwal, S.; Xavier, M.J. Innovations in Consumer Science: Applications of Neuro-Scientific Research Tools. In Adoption of Innovation; Brem, A., Viardot, É., Eds.; Springer International Publishing: Cham, Switzerland, 2015; pp. 25–42. [Google Scholar] [CrossRef]
- Bakardjieva, E.; Kimmel, A.J. Neuromarketing Research Practices: Attitudes, Ethics, and Behavioral Intentions. Ethics Behav. 2017, 27, 179–200. [Google Scholar] [CrossRef]
- Bercea, M.D. Anatomy of Methodologies for Measuring Consumer Behavior in Neuromarketing Research. In Proceedings of the Lupcon Center for Business Research (LCBR) European Marketing Conference, Ebermannstadt, Germany, 9 August 2012. [Google Scholar]
- Bitbrain. Business & Marketing. The 7 Most Common Neuromarketing Research Techniques and Tools. 2019. Available online: https://www.bitbrain.com/blog/neuromarketing-research-techniques-tools (accessed on 15 August 2022).
- CoolTool. How To Choose the Most Suitable NeuroLab Technology. Available online: https://cooltool.com/blog/-infographics-how-to-choose-the-most-suitable-neurolab-technology (accessed on 17 August 2022).
- Farnsworth, B. Neuromarketing Methods [Cheat Sheet]. 2020. Available online: https://imotions.com/blog/neuromarketing-methods/ (accessed on 17 August 2022).
- Fortunato, V.C.R.; Giraldi, J.D.M.E.; de Oliveira, J.H.C. A Review of Studies on Neuromarketing: Practical Results, Techniques, Contributions and Limitations. J. Manag. Res. 2014, 6, 201–220. [Google Scholar] [CrossRef]
- Ganapathy, K. Neuromarketing: An Overview. Asian Hosp. Healthc. Manag. 2019. Available online: https://www.asianhhm.com/healthcare-management/current-concepts-on-neuromarketing (accessed on 15 August 2022).
- Gill, G. Innerscope Research Inc. JITE DC 2012, 1, 5. [Google Scholar] [CrossRef]
- Ohme, R.; Matukin, M.; Pacula-Lesniak, B. Biometric Measures for Interactive Advertising Research. J. Interact. Advert. 2011, 11, 60–72. [Google Scholar] [CrossRef]
- Nazarova, R.; Lazizovich, T.K. Neuromarketing—A Tool for Influencing Consumer Behavior. Int. J. Innov. Technol. Econ. 2019, 5, 11–14. [Google Scholar] [CrossRef]
- Saltini, T. Some Neuromarketing Tools. 2015. Available online: https://tiphainesaltini.wordpress.com/2015/03/10/some-neuromarketing-tools/ (accessed on 15 August 2022).
- Stasi, A.; Songa, G.; Mauri, M.; Ciceri, A.; Diotallevi, F.; Nardone, G.; Russo, V. Neuromarketing Empirical Approaches and Food Choice: A Systematic Review. Food Res. Int. 2018, 108, 650–664. [Google Scholar] [CrossRef]
- Yağci, M.I.; Kuhzady, S.; Balik, Z.S.; Öztürk, L. In Search of Consumer’s Black Box: A Bibliometric Analysis of Neuromarketing Research. J. Consum. Consum. Res. 2018, 10, 101–134. [Google Scholar]
- Klinčeková, S. Neuromarketing—Research and Prediction of the Future. Int. J. Manag. Sci. Bus. Adm. 2016, 2, 54–58. [Google Scholar] [CrossRef]
- Malvern Panalytical. Near-Infrared (NIR) Spectroscopy. Available online: https://www.malvernpanalytical.com/en/products/technology/spectroscopy/near-infrared-spectroscopy/ (accessed on 15 August 2022).
- Villringer, A.; Planck, J.; Hock, C.; Schleinkofer, L.; Dirnagl, U. Near Infrared Spectroscopy (NIRS): A New Tool to Study Hemodynamic Changes during Activation of Brain Function in Human Adults. Neurosci. Lett. 1993, 154, 101–104. [Google Scholar] [CrossRef]
- Assaf, Y.; Pasternak, O. Diffusion Tensor Imaging (DTI)-Based White Matter Mapping in Brain Research: A Review. J. Mol. Neurosci. 2008, 34, 51–61. [Google Scholar] [CrossRef]
- Imagilys. Diffusion Tensor Imaging. Available online: https://www.imagilys.com/diffusion-tensor-imaging-dti/ (accessed on 15 August 2022).
- Sun, F.; Zang, W.; Gravina, R.; Fortino, G.; Li, Y. Gait-Based Identification for Elderly Users in Wearable Healthcare Systems. Inf. Fusion 2020, 53, 134–144. [Google Scholar] [CrossRef]
- Majumder, S.; Mondal, T.; Deen, M.J. A Simple, Low-Cost and Efficient Gait Analyzer for Wearable Healthcare Applications. IEEE Sens. J. 2019, 19, 2320–2329. [Google Scholar] [CrossRef]
- Arvaneh, M.; Tanaka, T. Brain–Computer Interfaces and Electroencephalogram: Basics and Practical Issues. In Signal Processing and Machine Learning for Brain—Machine Interfaces; 2018; Available online: http://dl.konkur.in/post/Book/Bargh/Signal-Processing-and-Machine-Learning-for-Brain-Machine-Interfaces-%5Bkonkur.in%5D.pdf#page=16 (accessed on 15 August 2022).
- Hantus, S. Continuous EEG Monitoring: Principles and Practice. J. Clin. Neurophysiol. 2019, 37, 1. [Google Scholar] [CrossRef]
- Tyagi, A.; Semwal, S.; Shah, G. A Review of Eeg Sensors Used for Data Acquisition. Int. J. Comput. Appl. 2012, 1, 13–18. [Google Scholar]
- Burgess, R.C. MEG Reporting. J. Clin. Neurophysiol. 2020, 37, 545–553. [Google Scholar] [CrossRef]
- Harmsen, I.E.; Rowland, N.C.; Wennberg, R.A.; Lozano, A.M. Characterizing the Effects of Deep Brain Stimulation with Magnetoencephalography: A Review. Brain Stimul. 2018, 11, 481–491. [Google Scholar] [CrossRef]
- Seymour, R.A.; Alexander, N.; Mellor, S.; O’Neill, G.C.; Tierney, T.M.; Barnes, G.R.; Maguire, E.A. Interference Suppression Techniques for OPM-Based MEG: Opportunities and Challenges. NeuroImage 2021, 247, 118834. [Google Scholar] [CrossRef]
- Shirinpour, S. Tools for Improving and Understanding Transcranial Magnetic Stimulation. 2020. Available online: https://hdl.handle.net/11299/217801 (accessed on 15 August 2022).
- Shirinpour, S.; Hananeia, N.; Rosado, J.; Tran, H.; Galanis, C.; Vlachos, A.; Jedlicka, P.; Queisser, G.; Opitz, A. Multi-Scale Modeling Toolbox for Single Neuron and Subcellular Activity under Transcranial Magnetic Stimulation. Brain Stimul. 2021, 14, 1470–1482. [Google Scholar] [CrossRef]
- Widhalm, M.L.; Rose, N.S. How Can Transcranial Magnetic Stimulation Be Used to Causally Manipulate Memory Representations in the Human Brain? WIREs Cogn. Sci. 2019, 10, e1469. [Google Scholar] [CrossRef]
- Gannouni, S.; Aledaily, A.; Belwafi, K.; Aboalsamh, H. Emotion Detection Using Electroencephalography Signals and a Zero-Time Windowing-Based Epoch Estimation and Relevant Electrode Identification. Sci. Rep. 2021, 11, 7071. [Google Scholar] [CrossRef]
- Dixson, B.J.W.; Spiers, T.; Miller, P.A.; Sidari, M.J.; Nelson, N.L.; Craig, B.M. Facial Hair May Slow Detection of Happy Facial Expressions in the Face in the Crowd Paradigm. Sci. Rep. 2022, 12, 5911. [Google Scholar] [CrossRef]
- Wang, X.-W.; Nie, D.; Lu, B.-L. EEG-Based Emotion Recognition Using Frequency Domain Features and Support Vector Machines. In Neural Information Processing; Lu, B.-L., Zhang, L., Kwok, J., Eds.; Lecture Notes in Computer Science; Springer Berlin Heidelberg: Berlin/Heidelberg, Germany, 2011; Volume 7062, pp. 734–743. [Google Scholar] [CrossRef]
- John, E.R. Principles of Neurometries. Am. J. EEG Technol. 1990, 30, 251–266. [Google Scholar] [CrossRef]
- Alkhasli, I.; Sakreida, K.; Mottaghy, F.M.; Binkofski, F. Modulation of Fronto-Striatal Functional Connectivity Using Transcranial Magnetic Stimulation. Front. Hum. Neurosci. 2019, 13, 190. [Google Scholar] [CrossRef]
- Jamadar, S.D.; Ward, P.G.D.; Close, T.G.; Fornito, A.; Premaratne, M.; O’Brien, K.; Stäb, D.; Chen, Z.; Shah, N.J.; Egan, G.F. Simultaneous BOLD-FMRI and Constant Infusion FDG-PET Data of the Resting Human Brain. Sci. Data 2020, 7, 363. [Google Scholar] [CrossRef]
- Kraft, R.H.; Dagro, A.M. Design and Implementation of a Numerical Technique to Inform Anisotropic Hyperelastic Finite Element Models Using Diffusion-Weighted Imaging. 2011. Available online: https://apps.dtic.mil/sti/pdfs/ADA565877.pdf (accessed on 15 August 2022).
- Koong, C.-S.; Yang, T.-I.; Tseng, C.-C. A User Authentication Scheme Using Physiological and Behavioral Biometrics for Multitouch Devices. Sci. World J. 2014, 2014, 781234. [Google Scholar] [CrossRef]
- Heydarzadegan, A.; Moradi, M.; Toorani, A. Biometric Recognition Systems: A Survey. Int. Res. J. Appl. Basic Sci. 2013, 6, 1609–1618. [Google Scholar]
- Shingetsu. Global Biometric Systems Market. 2021. Available online: https://www.shingetsuresearch.com/biometric-systems-market/?gclid=Cj0KCQiAybaRBhDtARIsAIEG3kkQZsv-1LwHknyBvnAfURBeXvBbB-uk9YGdpwf22Uw6waMmssmt1ycaAr9hEALw_wcB (accessed on 29 July 2022).
- Abo-Zahhad, M.; Ahmed, S.M.; Abbas, S.N. A Novel Biometric Approach for Human Identification and Verification Using Eye Blinking Signal. IEEE Signal Process. Lett. 2015, 22, 876–880. [Google Scholar] [CrossRef]
- Larsson, M.; Pedersen, N.L.; Stattin, H. Associations between Iris Characteristics and Personality in Adulthood. Biol. Psychol. 2007, 75, 165–175. [Google Scholar] [CrossRef]
- Gentry, T.A.; Polzine, K.M.; Wakefield, J.A. Human Genetic Markers Associated with Variation in Intellectual Abilities and Personality. Personal. Individ. Differ. 1985, 6, 111–113. [Google Scholar] [CrossRef]
- Gary, A.L.; Glover, J.A. Eye Color, Sex, and Children’s Behavior; Nelson-Hall Publishers: Chicago, IL, USA, 1976. [Google Scholar]
- Markle, A. Eye Color and Responsiveness to Arousing Stimuli. Percept. Mot. Ski. 1976, 43, 127–133. [Google Scholar] [CrossRef] [PubMed]
- Bailador, G.; Sanchez-Avila, C.; Guerra-Casanova, J.; de Santos Sierra, A. Analysis of Pattern Recognition Techniques for In-Air Signature Biometrics. Pattern Recognit. 2011, 44, 2468–2478. [Google Scholar] [CrossRef]
- Miller, W. Different Types of Biometrics. 2019. Available online: https://www.ibeta.com/different-types-of-biometrics/ (accessed on 29 July 2022).
- Biometrics Institute. Types of Biometrics. Available online: https://www.biometricsinstitute.org/what-is-biometrics/types-of-biometrics/ (accessed on 29 July 2022).
- Chen, D.; Haviland-Jones, J. Human Olfactory Communication of Emotion. Percept. Mot. Ski. 2000, 91, 771–781. [Google Scholar] [CrossRef] [PubMed]
- Kaklauskas, A.; Zavadskas, E.K.; Seniut, M.; Dzemyda, G.; Stankevic, V.; Simkevičius, C.; Stankevic, T.; Paliskiene, R.; Matuliauskaite, A.; Kildiene, S.; et al. Web-Based Biometric Computer Mouse Advisory System to Analyze a User’s Emotions and Work Productivity. Eng. Appl. Artif. Intell. 2011, 24, 928–945. [Google Scholar] [CrossRef]
- American Heart Association. Electrocardiogram (ECG or EKG). 2015. Available online: https://www.heart.org/en/health-topics/heart-attack/diagnosing-a-heart-attack/electrocardiogram-ecg-or-ekg (accessed on 29 July 2022).
- Nicolò, A.; Massaroni, C.; Schena, E.; Sacchetti, M. The Importance of Respiratory Rate Monitoring: From Healthcare to Sport and Exercise. Sensors 2020, 20, 6396. [Google Scholar] [CrossRef]
- Wang, B.; Zhou, H.; Yang, G.; Li, X.; Yang, H. Human Digital Twin (HDT) Driven Human-Cyber-Physical Systems: Key Technologies and Applications. Chin. J. Mech. Eng. 2022, 35, 11. [Google Scholar] [CrossRef]
- Nahavandi, S. Industry 5.0—A Human-Centric Solution. Sustainability 2019, 11, 4371. [Google Scholar] [CrossRef]
- Lugovic, S.; Dunder, I.; Horvat, M. Techniques and Applications of Emotion Recognition in Speech. In 2016 39th International Convention on Information and Communication Technology, Electronics and Microelectronics (MIPRO), Opatija, Croatia, 30 May–3 June 2016; IEEE: Opatija, Croatia, 2016; pp. 1278–1283. [Google Scholar] [CrossRef]
- Ge, Y.; Liu, J. Psychometric Analysis on Neurotransmitter Deficiency of Internet Addicted Urban Left-behind Children. J. Alcohol Drug Depend. 2015, 3, 1–6. [Google Scholar] [CrossRef]
- Lafta, H.A.; Abbas, S.S. Effectiveness of Extended Invariant Moments in Fingerprint Analysis. Asian J. Comput. Inf. Syst. 2013, 01, 78–89. [Google Scholar]
- Singh, J.; Goyal, G.; Gill, R. Use of Neurometrics to Choose Optimal Advertisement Method for Omnichannel Business. Enterp. Inf. Syst. 2020, 14, 243–265. [Google Scholar] [CrossRef]
- Fiedler, K.; Bluemke, M. Faking the IAT: Aided and Unaided Response Control on the Implicit Association Tests. Basic Appl. Soc. Psychol. 2005, 27, 307–316. [Google Scholar] [CrossRef]
- Simons, S.; Zhou, J.; Liao, Y.; Bradway, L.; Aguilar, M.; Connolly, P.M. Cognitive Biometrics Using Mouse Perturbation. US Patent Application US14/011,351, 20 March 2014. [Google Scholar]
- Martinez-Marquez, D.; Pingali, S.; Panuwatwanich, K.; Stewart, R.A.; Mohamed, S. Application of Eye Tracking Technology in Aviation, Maritime, and Construction Industries: A Systematic Review. Sensors 2021, 21, 4289. [Google Scholar] [CrossRef]
- Skvarekova, I.; Skultety, F. Objective Measurement of Pilot’s Attention Using Eye Track Technology during IFR Flights. Transp. Res. Procedia 2019, 40, 1555–1562. [Google Scholar] [CrossRef]
- Eachus, P. The Use of Eye Tracking Technology in the Evaluation of E-Learning: A Feasibility Study; University of Salford: Manchester, UK, 2008; pp. 12–14. [Google Scholar]
- Sharafi, Z.; Soh, Z.; Guéhéneuc, Y.-G. A Systematic Literature Review on the Usage of Eye-Tracking in Software Engineering. Inf. Softw. Technol. 2015, 67, 79–107. [Google Scholar] [CrossRef]
- Gonzalez-Sanchez, J.; Chavez-Echeagaray, M.E.; Atkinson, R.; Burleson, W. ABE: An Agent-Based Software Architecture for a Multimodal Emotion Recognition Framework. In 2011 Ninth Working IEEE/IFIP Conference on Software Architecture, Washington, United States, 20–24 June 2011; IEEE: Boulder, CO, USA, 2011; pp. 187–193. [Google Scholar] [CrossRef]
- Borkhataria, C. The Algorithm That Could End Office Thermostat Wars: Researchers Claim New Software Can Find the Best Temperature for Everyone. 2017. Available online: https://www.dailymail.co.uk/sciencetech/article-4979148/The-algorithm-end-office-thermostat-war.html (accessed on 29 July 2022).
- Rukavina, S.; Gruss, S.; Hoffmann, H.; Tan, J.-W.; Walter, S.; Traue, H.C. Affective Computing and the Impact of Gender and Age. PLoS ONE 2016, 11, e0150584. [Google Scholar] [CrossRef]
- Saini, R.; Rana, N. Comparison of Various Biometric Methods. Int. J. Adv. Sci. Technol. 2014, 2, 24–30. [Google Scholar]
- Elprocus. Biometric Sensors—Types and Its Working. 2022. Available online: https://www.elprocus.com/different-types-biometric-sensors/ (accessed on 29 July 2022).
- Loaiza, J.R. Emotions and the Problem of Variability. Rev. Phil. Psych. 2021, 12, 329–351. [Google Scholar] [CrossRef]
- Pace-Schott, E.F.; Amole, M.C.; Aue, T.; Balconi, M.; Bylsma, L.M.; Critchley, H.; Demaree, H.A.; Friedman, B.H.; Gooding, A.E.K.; Gosseries, O.; et al. Physiological Feelings. Neurosci. Biobehav. Rev. 2019, 103, 267–304. [Google Scholar] [CrossRef]
- Dolensek, N.; Gehrlach, D.A.; Klein, A.S.; Gogolla, N. Facial Expressions of Emotion States and Their Neuronal Correlates in Mice. Science 2020, 368, 89–94. [Google Scholar] [CrossRef]
- Kamila, S.; Hasanuzzaman, M.; Ekbal, A.; Bhattacharyya, P. Investigating the Impact of Emotion on Temporal Orientation in a Deep Multitask Setting. Sci. Rep. 2022, 12, 493. [Google Scholar] [CrossRef]
- Saganowski, S.; Komoszyńska, J.; Behnke, M.; Perz, B.; Kunc, D.; Klich, B.; Kaczmarek, Ł.D.; Kazienko, P. Emognition Dataset: Emotion Recognition with Self-Reports, Facial Expressions, and Physiology Using Wearables. Sci. Data 2022, 9, 158. [Google Scholar] [CrossRef]
- Swanborough, H.; Staib, M.; Frühholz, S. Neurocognitive Dynamics of Near-Threshold Voice Signal Detection and Affective Voice Evaluation. Sci. Adv. 2020, 6, eabb3884. [Google Scholar] [CrossRef]
- Singh, R.; Baby, B.; Suri, A. A Virtual Repository of Neurosurgical Instrumentation for Neuroengineering Research and Collaboration. World Neurosurg. 2019, 126, e84–e93. [Google Scholar] [CrossRef]
- Alonso-Fernandez, F.; Fierrez, J.; Ortega-Garcia, J. Quality measures in biometric systems. IEEE Secur. Priv. 2011, 10, 52–62. [Google Scholar] [CrossRef]
- De Angel, V.; Lewis, S.; White, K.; Oetzmann, C.; Leightley, D.; Oprea, E.; Lavelle, G.; Matcham, F.; Pace, A.; Mohr, D.C.; et al. Digital health tools for the passive monitoring of depression: A systematic review of methods. NPJ Digit. Med. 2022, 5, 3. [Google Scholar] [CrossRef]
- Kable, J.W. The Cognitive Neuroscience Toolkit for the Neuroeconomist: A Functional Overview. J. Neurosci. Psychol. Econ. 2011, 4, 63–84. [Google Scholar] [CrossRef]
- Zurawicki, L. Neuromarketing: Exploring the Brain of the Consumer; Springer: Berlin/Heidelberg, Germany, 2010. [Google Scholar] [CrossRef]
- Magdin, M.; Prikler, F. Are Instructed Emotional States Suitable for Classification? Demonstration of How They Can Significantly Influence the Classification Result in An Automated Recognition System. IJIMAI 2019, 5, 141–147. [Google Scholar] [CrossRef]
- Camurri, A.; Lagerlöf, I.; Volpe, G. Recognizing Emotion from Dance Movement: Comparison of Spectator Recognition and Automated Techniques. Int. J. Hum.-Comput. Stud. 2003, 59, 213–225. [Google Scholar] [CrossRef]
- Alarcao, S.M.; Fonseca, M.J. Emotions Recognition Using EEG Signals: A Survey. IEEE Trans. Affect. Comput. 2017, 10, 374–393. [Google Scholar] [CrossRef]
- Kim, M.-K.; Kim, M.; Oh, E.; Kim, S.-P. A Review on the Computational Methods for Emotional State Estimation from the Human EEG. Comput. Math. Methods Med. 2013, 2013, 573734. [Google Scholar] [CrossRef]
- Xu, Q.; Ruohonen, E.M.; Ye, C.; Li, X.; Kreegipuu, K.; Stefanics, G.; Luo, W.; Astikainen, P. Automatic Processing of Changes in Facial Emotions in Dysphoria: A Magnetoencephalography Study. Front. Hum. Neurosci. 2018, 12, 186. [Google Scholar] [CrossRef] [PubMed]
- Bublatzky, F.; Kavcıoğlu, F.; Guerra, P.; Doll, S.; Junghöfer, M. Contextual Information Resolves Uncertainty about Ambiguous Facial Emotions: Behavioral and Magnetoencephalographic Correlates. NeuroImage 2020, 215, 116814. [Google Scholar] [CrossRef] [PubMed]
- Van Loon, A.M.; van den Wildenberg, W.P.M.; van Stegeren, A.H.; Ridderinkhof, K.R.; Hajcak, G. Emotional Stimuli Modulate Readiness for Action: A Transcranial Magnetic Stimulation Study. Cogn. Affect. Behav. Neurosci. 2010, 10, 174–181. [Google Scholar] [CrossRef] [PubMed]
- Bandara, D.; Velipasalar, S.; Bratt, S.; Hirshfield, L. Building Predictive Models of Emotion with Functional Near-Infrared Spectroscopy. Int. J. Hum.-Comput. Stud. 2018, 110, 75–85. [Google Scholar] [CrossRef]
- Bae, S.; Kang, K.D.; Kim, S.W.; Shin, Y.J.; Nam, J.J.; Han, D.H. Investigation of an Emotion Perception Test Using Functional Magnetic Resonance Imaging. Comput. Methods Programs Biomed. 2019, 179, 104994. [Google Scholar] [CrossRef]
- Dweck, M.R. Multisystem Positron Emission Tomography: Interrogating Vascular Inflammation, Emotional Stress, and Bone Marrow Activity in a Single Scan. Eur. Heart J. 2021, 42, 1896–1897. [Google Scholar] [CrossRef]
- Reiman, E.M. The Application of Positron Emission Tomography to the Study of Normal and Pathologic Emotions. J. Clin. Psychiatry 1997, 58 (Suppl. S16), 4–12. [Google Scholar]
- Takahashi, M.; Kitamura, S.; Matsuoka, K.; Yoshikawa, H.; Yasuno, F.; Makinodan, M.; Kimoto, S.; Miyasaka, T.; Kichikawa, K.; Kishimoto, T. Uncinate Fasciculus Disruption Relates to Poor Recognition of Negative Facial Emotions in Alzheimer’s Disease: A Cross-sectional Diffusion Tensor Imaging Study. Psychogeriatrics 2020, 20, 296–303. [Google Scholar] [CrossRef]
- Kaklauskas, A.; Abraham, A.; Dzemyda, G.; Raslanas, S.; Seniut, M.; Ubarte, I.; Kurasova, O.; Binkyte-Veliene, A.; Cerkauskas, J. Emotional, Affective and Biometrical States Analytics of a Built Environment. Eng. Appl. Artif. Intell. 2020, 91, 103621. [Google Scholar] [CrossRef]
- Kaklauskas, A.; Jokubauskas, D.; Cerkauskas, J.; Dzemyda, G.; Ubarte, I.; Skirmantas, D.; Podviezko, A.; Simkute, I. Affective Analytics of Demonstration Sites. Eng. Appl. Artif. Intell. 2019, 81, 346–372. [Google Scholar] [CrossRef]
- Kaklauskas, A.; Zavadskas, E.K.; Bardauskiene, D.; Cerkauskas, J.; Ubarte, I.; Seniut, M.; Dzemyda, G.; Kaklauskaite, M.; Vinogradova, I.; Velykorusova, A. An Affect-Based Built Environment Video Analytics. Autom. Constr. 2019, 106, 102888. [Google Scholar] [CrossRef]
- Kaklauskas, A.; Bardauskiene, D.; Cerkauskiene, R.; Ubarte, I.; Raslanas, S.; Radvile, E.; Kaklauskaite, U.; Kaklauskiene, L. Emotions Analysis in Public Spaces for Urban Planning. Land Use Policy 2021, 107, 105458. [Google Scholar] [CrossRef]
- Porcherot, C.; Raviot-Derrien, S.; Beague, M.-P.; Henneberg, S.; Niedziela, M.; Ambroze, K.; McEwan, J.A. Effect of Context on Fine Fragrance-Elicited Emotions: Comparison of Three Experimental Methodologies. Food Qual. Prefer. 2022, 95, 104342. [Google Scholar] [CrossRef]
- Child, S.; Oakhill, J.; Garnham, A. Tracking Your Emotions: An Eye-Tracking Study on Reader’s Engagement with Perspective during Text Comprehension. Q. J. Exp. Psychol. 2020, 73, 929–940. [Google Scholar] [CrossRef]
- Tarnowski, P.; Kołodziej, M.; Majkowski, A.; Rak, R.J. Eye-Tracking Analysis for Emotion Recognition. Comput. Intell. Neurosci. 2020, 2020, 2909267. [Google Scholar] [CrossRef]
- Coutinho, E.; Miranda, E.R.; Cangelosi, A. Towards a Model for Embodied Emotions. In 2005 Purtuguese Conference on Artificial Intelligence, Covilha, Portugal, 5–8 December 2005; IEEE: Covilha, Portugal, 2005; pp. 54–63. [Google Scholar] [CrossRef]
- Kim, M.; Lee, H.S.; Park, J.W.; Jo, S.H.; Chung, M.J. Determining Color and Blinking to Support Facial Expression of a Robot for Conveying Emotional Intensity. In RO-MAN 2008—The 17th IEEE International Symposium on Robot and Human Interactive Communication, Munich, Germany, 1–3 August 2008; IEEE: Munich, Germany, 2008; pp. 219–224. [Google Scholar] [CrossRef]
- Terada, K.; Yamauchi, A.; Ito, A. Artificial Emotion Expression for a Robot by Dynamic Color Change. In 2012 IEEE RO-MAN: The 21st IEEE International Symposium on Robot and Human Interactive Communication, Paris, France, 9–13 September 2012; IEEE: Paris, France, 2012; pp. 314–321. [Google Scholar] [CrossRef]
- Li, S.; Walters, G.; Packer, J.; Scott, N. Using Skin Conductance and Facial Electromyography to Measure Emotional Responses to Tourism Advertising. Curr. Issues Tour. 2018, 21, 1761–1783. [Google Scholar] [CrossRef]
- Nakasone, A.; Prendinger, H.; Ishizuka, M. Emotion Recognition from Electromyography and Skin Conductance. In Proceedings of the 5th International Workshop on Biosignal Interpretation; 2005; pp. 219–222. Available online: https://citeseerx.ist.psu.edu/viewdoc/download?doi=10.1.1.64.7269&rep=rep1&type=pdf (accessed on 29 July 2022).
- Val-Calvo, M.; Álvarez-Sánchez, J.R.; Ferrández-Vicente, J.M.; Díaz-Morcillo, A.; Fernández-Jover, E. Real-Time Multi-Modal Estimation of Dynamically Evoked Emotions Using EEG, Heart Rate and Galvanic Skin Response. Int. J. Neur. Syst. 2020, 30, 2050013. [Google Scholar] [CrossRef]
- Minhad, K.N.; Ali, S.H.M.; Reaz, M.B.I. Happy-Anger Emotions Classifications from Electrocardiogram Signal for Automobile Driving Safety and Awareness. J. Transp. Health 2017, 7, 75–89. [Google Scholar] [CrossRef]
- Orini, M.; Bailón, R.; Enk, R.; Koelsch, S.; Mainardi, L.; Laguna, P. A Method for Continuously Assessing the Autonomic Response to Music-Induced Emotions through HRV Analysis. Med. Biol. Eng. Comput. 2010, 48, 423–433. [Google Scholar] [CrossRef]
- Hernando, A.; Lazaro, J.; Gil, E.; Arza, A.; Garzon, J.M.; Lopez-Anton, R.; de la Camara, C.; Laguna, P.; Aguilo, J.; Bailon, R. Inclusion of Respiratory Frequency Information in Heart Rate Variability Analysis for Stress Assessment. IEEE J. Biomed. Health Inform. 2016, 20, 1016–1025. [Google Scholar] [CrossRef]
- Dasgupta, P.B. Detection and Analysis of Human Emotions through Voice and Speech Pattern Processing. Int. J. Comput. Trends Technol. 2017, 52, 1–3. [Google Scholar] [CrossRef]
- Rüsch, N.; Corrigan, P.W.; Bohus, M.; Kühler, T.; Jacob, G.A.; Lieb, K. The Impact of Posttraumatic Stress Disorder on Dysfunctional Implicit and Explicit Emotions Among Women with Borderline Personality Disorder. J. Nerv. Ment. Dis. 2007, 195, 537–539. [Google Scholar] [CrossRef]
- Yi, Q.; Xiong, S.; Wang, B.; Yi, S. Identification of Trusted Interactive Behavior Based on Mouse Behavior Considering Web User’s Emotions. Int. J. Ind. Ergon. 2020, 76, 102903. [Google Scholar] [CrossRef]
- Lozano-Goupil, J.; Bardy, B.G.; Marin, L. Toward an Emotional Individual Motor Signature. Front. Psychol. 2021, 12, 647704. [Google Scholar] [CrossRef]
- Venture, G.; Kadone, H.; Zhang, T.; Grèzes, J.; Berthoz, A.; Hicheur, H. Recognizing Emotions Conveyed by Human Gait. Int. J. Soc. Robot. 2014, 6, 621–632. [Google Scholar] [CrossRef]
- Bevacqua, E.; Mancini, M. Speaking with Emotions. In Proceedings of the AISB Symposium on Motion, Emotion and Cognition, Leeds, UK, 29 March–1 April 2004; pp. 58–65. [Google Scholar]
- Maalej, A.; Kallel, I. Does Keystroke Dynamics Tell Us about Emotions? A Systematic Literature Review and Dataset Construction. In 2020 16th International Conference on Intelligent Environments (IE), Madrid, Spain, 20–23 July 2020; IEEE: Madrid, Spain, 2020; pp. 60–67. [Google Scholar] [CrossRef]
- Chanel, G.; Kierkels, J.J.M.; Soleymani, M.; Pun, T. Short-Term Emotion Assessment in a Recall Paradigm. Int. J. Hum.-Comput. Stud. 2009, 67, 607–627. [Google Scholar] [CrossRef]
- Chanel, G.; Kronegg, J.; Grandjean, D.; Pun, T. Emotion Assessment: Arousal Evaluation Using EEG’s and Peripheral Physiological Signals. In Multimedia Content Representation, Classification and Security; Gunsel, B., Jain, A.K., Tekalp, A.M., Sankur, B., Hutchison, D., Kanade, T., Eds.; Lecture Notes in Computer Science; Springer: Berlin/Heidelberg, Germany, 2006; Volume 4105, pp. 530–537. [Google Scholar] [CrossRef]
- Peter, C.; Ebert, E.; Beikirch, H. A Wearable Multi-Sensor System for Mobile Acquisition of Emotion-Related Physiological Data. In Affective Computing and Intelligent Interaction; Tao, J., Tan, T., Picard, R.W., Hutchison, D., Kanade, T., Kittler, J., Kleinberg, J.M., Eds.; Lecture Notes in Computer Science; Springer: Berlin/Heidelberg, Germany, 2005; Volume 3784, pp. 691–698. [Google Scholar] [CrossRef]
- Villon, O.; Lisetti, C. A User-Modeling Approach to Build User’s Psycho-Physiological Maps of Emotions Using Bio-Sensors. In ROMAN 2006—The 15th IEEE International Symposium on Robot and Human Interactive Communication, Hatfield, UK, 6–8 September 2006; IEEE: Hatfield, UK, 2006; pp. 269–276. [Google Scholar] [CrossRef]
- Lee, S.; Hong, C.-s.; Lee, Y.K.; Shin, H.-s. Experimental Emotion Recognition System and Services for Mobile Network Environments. In Proceedings of the 2010 IEEE Sensors; IEEE: Kona, HI, USA, 2010; pp. 136–140. Available online: https://ieeexplore.ieee.org/stamp/stamp.jsp?arnumber=5690670 (accessed on 29 July 2022). [CrossRef]
- De Santos Sierra, A.; Ávila, C.S.; Casanova, J.G.; del Pozo, G.B. Real-Time Stress Detection by Means of Physiological Signals. In Advanced Biometric Technologies; IntechOpen: London, UK, 2011; pp. 23–44. [Google Scholar]
- Hsieh, P.-Y.; Chin, C.-L. The Emotion Recognition System with Heart Rate Variability and Facial Image Features. In Proceedings of the 2011 IEEE International Conference on Fuzzy Systems (FUZZ-IEEE 2011); IEEE: Taipei, Taiwan, 2011; pp. 1933–1940. [Google Scholar] [CrossRef]
- Zhang, J.; Chen, M.; Hu, S.; Cao, Y.; Kozma, R. PNN for EEG-Based Emotion Recognition. In Proceedings of the 2016 IEEE International Conference on Systems, Man, and Cybernetics (SMC); IEEE: Budapest, Hungary, 2016; pp. 2319–2323. [Google Scholar] [CrossRef]
- Mehmood, R.; Lee, H. Towards Building a Computer Aided Education System for Special Students Using Wearable Sensor Technologies. Sensors 2017, 17, 317. [Google Scholar] [CrossRef]
- Purnamasari, P.; Ratna, A.; Kusumoputro, B. Development of Filtered Bispectrum for EEG Signal Feature Extraction in Automatic Emotion Recognition Using Artificial Neural Networks. Algorithms 2017, 10, 63. [Google Scholar] [CrossRef]
- Li, Y.; Huang, J.; Zhou, H.; Zhong, N. Human Emotion Recognition with Electroencephalographic Multidimensional Features by Hybrid Deep Neural Networks. Appl. Sci. 2017, 7, 1060. [Google Scholar] [CrossRef]
- Hu, X.; Yu, J.; Song, M.; Yu, C.; Wang, F.; Sun, P.; Wang, D.; Zhang, D. EEG Correlates of Ten Positive Emotions. Front. Hum. Neurosci. 2017, 11, 26. [Google Scholar] [CrossRef]
- Taneli, B.; Krahne, W. EEG Changes of Transcendental Meditation Practitioners. In Advances in Biological Psychiatry; Taneli, B., Perris, C., Kemali, D., Eds.; S. Karger AG: Basel, Switzerland, 1987; Volume 16, pp. 41–71. [Google Scholar] [CrossRef]
- Si, Y.; Jiang, L.; Tao, Q.; Chen, C.; Li, F.; Jiang, Y.; Zhang, T.; Cao, X.; Wan, F.; Yao, D.; et al. Predicting Individual Decision-Making Responses Based on the Functional Connectivity of Resting-State EEG. J. Neural Eng. 2019, 16, 066025. [Google Scholar] [CrossRef] [PubMed]
- Akash, K.; Hu, W.-L.; Jain, N.; Reid, T. A Classification Model for Sensing Human Trust in Machines Using EEG and GSR. ACM Trans. Interact. Intell. Syst. 2018, 8, 1–20. [Google Scholar] [CrossRef]
- Tsao, Y.-C.; Huang, C.-M.; Miou, Y.-C. The Role of Opposing Emotions in Design Satisfaction and Perceived Innovation. J. Sci. Des. 2021, 5, 111–120. [Google Scholar]
- Martin, O.; Kotsia, I.; Macq, B.; Pitas, I. The eNTERFACE’ 05 Audio-Visual Emotion Database. In Proceedings of the 22nd International Conference on Data Engineering Workshops (ICDEW’06), Atlanta, GA, USA, 3–7 April 2006; IEEE: Atlanta, GA, USA, 2006; p. 8. [Google Scholar] [CrossRef]
- McDermott, O.D.; Prigerson, H.G.; Reynolds, C.F.; Houck, P.R.; Dew, M.A.; Hall, M.; Mazumdar, S.; Buysse, D.J.; Hoch, C.C.; Kupfer, D.J. Sleep in the Wake of Complicated Grief Symptoms: An Exploratory Study. Biol. Psychiatry 1997, 41, 710–716. [Google Scholar] [CrossRef]
- Rusalova, M.N.; Kostyunina, M.B.; Kulikov, M.A. Spatial Distribution of Coefficients of Asymmetry of Brain Bioelectrical Activity during the Experiencing of Negative Emotions. Neurosci. Behav. Physiol. 2003, 33, 703–706. [Google Scholar] [CrossRef] [PubMed]
- Uyan, U. EEG-Based Assessment of Cybersickness in a VR Environment and Adjusting Stereoscopic Parameters According to Level of Sickness to Present a Comfortable Vision; Hacettepe University: Ankara, Turkey, 2020. [Google Scholar]
- Yankovsky, A.E.; Veilleux, M.; Dubeau, F.; Andermann, F. Post-Ictal Rage and Aggression: A Video-EEG Study. Epileptic Disord. 2005, 7, 143–147. [Google Scholar]
- Kim, S.-H.; Nguyen Thi, N.A. Feature Extraction of Emotional States for EEG-Based Rage Control. In Proceedings of the 2016 39th International Conference on Telecommunications and Signal Processing (TSP), Vienna, Austria, 27–29 June 2016; IEEE: Vienna, Austria, 2016; pp. 361–364. [Google Scholar] [CrossRef]
- Cannon, P.A.; Drake, M.E. EEG and Brainstem Auditory Evoked Potentials in Brain-Injured Patients with Rage Attacks and Self-Injurious Behavior. Clin. Electroencephalogr. 1986, 17, 169–172. [Google Scholar]
- Chen, X.; Lin, J.; Jin, H.; Huang, Y.; Liu, Z. The Psychoacoustics Annoyance Research Based on EEG Rhythms for Passengers in High-Speed Railway. Appl. Acoust. 2021, 171, 107575. [Google Scholar] [CrossRef]
- Li, Z.-G.; Di, G.-Q.; Jia, L. Relationship between Electroencephalogram Variation and Subjective Annoyance under Noise Exposure. Appl. Acoust. 2014, 75, 37–42. [Google Scholar] [CrossRef]
- Benlamine, M.S.; Chaouachi, M.; Frasson, C.; Dufresne, A. Physiology-Based Recognition of Facial Micro-Expressions Using EEG and Identification of the Relevant Sensors by Emotion. In Proceedings of the 3rd International Conference on Physiological Computing Systems; SCITEPRESS—Science and Technology Publications: Lisbon, Portugal, 2016; pp. 130–137. Available online: https://www.scitepress.org/Papers/2016/60027/60027.pdf (accessed on 9 July 2022). [CrossRef]
- Aftanas, L.I.; Pavlov, S.V. Trait Anxiety Impact on Posterior Activation Asymmetries at Rest and during Evoked Negative Emotions: EEG Investigation. Int. J. Psychophysiol. 2005, 55, 85–94. [Google Scholar] [CrossRef]
- Ragozinskaya, V.G. Features of Psychosomatic Patient’s Aggressiveness. Procedia-Soc. Behav. Sci. 2013, 86, 232–235. [Google Scholar] [CrossRef][Green Version]
- Konareva, I.N. Correlation between Level of Aggressiveness of Personality and Characteristics of EEG Frequency Components. Neurophysiology 2006, 38, 380–388. [Google Scholar] [CrossRef]
- Munian, L.; Wan Ahmad, W.K.; Xu, T.K.; Mustafa, W.A.; Rahim, M.A. An Aggressiveness Level Analysis Based On Buss Perry Questionnaire (BPQ) And Brain Signal (EEG). J. Phys.: Conf. Ser. 2021, 2107, 012045. [Google Scholar] [CrossRef]
- Flores, A.; Münte, T.F.; Doñamayor, N. Event-Related EEG Responses to Anticipation and Delivery of Monetary and Social Reward. Biol. Psychol. 2015, 109, 10–19. [Google Scholar] [CrossRef]
- Gorka, S.M.; Phan, K.L.; Shankman, S.A. Convergence of EEG and FMRI Measures of Reward Anticipation. Biol. Psychol. 2015, 112, 12–19. [Google Scholar] [CrossRef]
- Alazrai, R.; Homoud, R.; Alwanni, H.; Daoud, M. EEG-Based Emotion Recognition Using Quadratic Time-Frequency Distribution. Sensors 2018, 18, 2739. [Google Scholar] [CrossRef]
- Cai, J.; Chen, W.; Yin, Z. Multiple Transferable Recursive Feature Elimination Technique for Emotion Recognition Based on EEG Signals. Symmetry 2019, 11, 683. [Google Scholar] [CrossRef]
- Chao, H.; Dong, L.; Liu, Y.; Lu, B. Emotion Recognition from Multiband EEG Signals Using CapsNet. Sensors 2019, 19, 2212. [Google Scholar] [CrossRef]
- Gao, Z.; Cui, X.; Wan, W.; Gu, Z. Recognition of Emotional States Using Multiscale Information Analysis of High Frequency EEG Oscillations. Entropy 2019, 21, 609. [Google Scholar] [CrossRef]
- Garg, D.; Verma, G.K. Emotion recognition in valence-arousal space from multi-channel EEG data and wavelet based deep learning framework. Procedia Computer Science 2020, 171, 857–867. [Google Scholar] [CrossRef]
- Soleymani, M.; Lichtenauer, J.; Pun, T.; Pantic, M. A Multimodal Database for Affect Recognition and Implicit Tagging. IEEE Trans. Affect. Comput. 2012, 3, 42–55. [Google Scholar] [CrossRef]
- Yogeeswaran, K.; Nash, K.; Jia, H.; Adelman, L.; Verkuyten, M. Intolerant of Being Tolerant? Examining the Impact of Intergroup Toleration on Relative Left Frontal Activity and Outgroup Attitudes. Curr. Psychol. 2021, 41, 7228–7239. [Google Scholar] [CrossRef]
- Fan, C.; Peng, Y.; Peng, S.; Zhang, H.; Wu, Y.; Kwong, S. Detection of Train Driver Fatigue and Distraction Based on Forehead EEG: A Time-Series Ensemble Learning Method. IEEE Trans. Intell. Transport. Syst. 2021, 23, 13559–13569. [Google Scholar] [CrossRef]
- Mück, M.; Ohmann, K.; Dummel, S.; Mattes, A.; Thesing, U.; Stahl, J. Face Perception and Narcissism: Variations of Event-Related Potential Components (P1 & N170) with Admiration and Rivalry. Cogn. Affect. Behav. Neurosci. 2020, 20, 1041–1055. [Google Scholar] [CrossRef]
- Tolgay, B.; Dell’Orco, S.; Maldonato, M.N.; Vogel, C.; Trojano, L.; Esposito, A. EEGs as Potential Predictors of Virtual Agents’ Acceptance. In 2019 10th IEEE International Conference on Cognitive Infocommunications (CogInfoCom), Naples, Italy, 23–25 October 2019; IEEE: Naples, Italy, 2019; pp. 433–438. [Google Scholar] [CrossRef]
- Tarai, S.; Mukherjee, R.; Qurratul, Q.A.; Singh, B.K.; Bit, A. Use of Prosocial Word Enhances the Processing of Language: Frequency Domain Analysis of Human EEG. J. Psycholinguist Res. 2019, 48, 145–161. [Google Scholar] [CrossRef]
- Ho, V.A.; Nguyen, D.H.-C.; Nguyen, D.H.; Pham, L.T.-V.; Nguyen, D.-V.; Nguyen, K.V.; Nguyen, N.L.-T. Emotion Recognition for Vietnamese Social Media Text. In Computational Linguistics; Nguyen, L.-M., Phan, X.-H., Hasida, K., Eds.; Communications in Computer and Information Science; Springer: Singapore, 2020; Volume 1215, pp. 319–333. [Google Scholar] [CrossRef]
- Hu, X.; Zhuang, C.; Wang, F.; Liu, Y.-J.; Im, C.-H.; Zhang, D. FNIRS Evidence for Recognizably Different Positive Emotions. Front. Hum. Neurosci. 2019, 13, 120. [Google Scholar] [CrossRef]
- Khazankin, G.R.; Shmakov, I.S.; Malinin, A.N. Remote Facial Emotion Recognition System. In Proceedings of the 2019 International Multi-Conference on Engineering, Computer and Information Sciences (SIBIRCON), Novosibirsk, Russia, 21–27 October 2019; IEEE: Novosibirsk, Russia, 2019; pp. 0975–0979. [Google Scholar] [CrossRef]
- Guo, J.; Lei, Z.; Wan, J.; Avots, E.; Hajarolasvadi, N.; Knyazev, B.; Kuharenko, A.; Jacques Junior, J.C.S.; Baro, X.; Demirel, H.; et al. Dominant and Complementary Emotion Recognition from Still Images of Faces. IEEE Access 2018, 6, 26391–26403. [Google Scholar] [CrossRef]
- Mumenthaler, C.; Sander, D.; Manstead, A. Emotion Recognition in Simulated Social Interactions. IEEE Trans. Affect. Comput. 2018, 11, 308–312. [Google Scholar] [CrossRef]
- Zheng, W.-L.; Lu, B.-L. A Multimodal Approach to Estimating Vigilance Using EEG and Forehead EOG. J. Neural Eng. 2017, 14, 026017. [Google Scholar] [CrossRef]
- Tomar, D.; Agarwal, S. Multi-Label Classifier for Emotion Recognition from Music. In Proceedings of 3rd International Conference on Advanced Computing, Networking and Informatics; Nagar, A., Mohapatra, D.P., Chaki, N., Eds.; Smart Innovation, Systems and Technologies; Springer: New Delhi, India, 2016; Volume 43, pp. 111–123. [Google Scholar] [CrossRef]
- Bhatti, A.M.; Majid, M.; Anwar, S.M.; Khan, B. Human Emotion Recognition and Analysis in Response to Audio Music Using Brain Signals. Comput. Hum. Behav. 2016, 65, 267–275. [Google Scholar] [CrossRef]
- Shih, Y.-L.; Lin, C.-Y. The Relationship between Action Anticipation and Emotion Recognition in Athletes of Open Skill Sports. Cogn. Process 2016, 17, 259–268. [Google Scholar] [CrossRef]
- Patwardhan, A.; Knapp, G. Aggressive Actions and Anger Detection from Multiple Modalities Using Kinect, 2016. arXiv preprint 2016, arXiv:1607.01076. [Google Scholar]
- Fernández-Alcántara, M.; Cruz-Quintana, F.; Pérez-Marfil, M.N.; Catena-Martínez, A.; Pérez-García, M.; Turnbull, O.H. Assessment of Emotional Experience and Emotional Recognition in Complicated Grief. Front. Psychol. 2016, 7, 126. [Google Scholar] [CrossRef]
- Naji, M.; Firoozabadi, M.; Azadfallah, P. Classification of Music-Induced Emotions Based on Information Fusion of Forehead Biosignals and Electrocardiogram. Cogn. Comput. 2014, 6, 241–252. [Google Scholar] [CrossRef]
- Wen, W.; Liu, G.; Cheng, N.; Wei, J.; Shangguan, P.; Huang, W. Emotion Recognition Based on Multi-Variant Correlation of Physiological Signals. IEEE Trans. Affect. Comput. 2014, 5, 126–140. [Google Scholar] [CrossRef]
- Kamińska, D.; Pelikant, A. Recognition of Human Emotion from a Speech Signal Based on Plutchik’s Model. Int. J. Electron. Telecommun. 2012, 58, 165–170. [Google Scholar] [CrossRef]
- Furley, P.; Dicks, M.; Memmert, D. Nonverbal Behavior in Soccer: The Influence of Dominant and Submissive Body Language on the Impression Formation and Expectancy of Success of Soccer Players. J. Sport Exerc. Psychol. 2012, 34, 61–82. [Google Scholar] [CrossRef] [PubMed]
- Wagner, J.; Kim, J.; Andre, E. From Physiological Signals to Emotions: Implementing and Comparing Selected Methods for Feature Extraction and Classification. In Proceedings of the 2005 IEEE International Conference on Multimedia and Expo, Amsterdam, The Netherlands, 6–8 July 2005; IEEE: Amsterdam, The Netherlands, 2005; pp. 940–943. [Google Scholar] [CrossRef]
- Furman, J.M.; Wuyts, F.L. Vestibular Laboratory Testing. In Aminoff’s Electrodiagnosis in Clinical Neurology; Elsevier: Philadelphia, PA, USA, 2012; pp. 699–723. [Google Scholar] [CrossRef]
- Lord Mary, P.; Wright, W.D. The Investigation of Eye Movements. Rep. Prog. Phys. 1950, 13, 1–23. [Google Scholar] [CrossRef]
- Landowska, A. Emotion Monitoring—Verification of Physiological Characteristics Measurement Procedures. Metrol. Meas. Syst. 2014, 21, 719–732. [Google Scholar] [CrossRef]
- Skiendziel, T.; Rösch, A.G.; Schultheiss, O.C. Assessing the Convergent Validity between the Automated Emotion Recognition Software Noldus FaceReader 7 and Facial Action Coding System Scoring. PLoS ONE 2019, 14, e0223905. [Google Scholar] [CrossRef] [PubMed]
- Frescura, A.; Lee, P.J. Emotions and Physiological Responses Elicited by Neighbours Sounds in Wooden Residential Buildings. Build. Environ. 2022, 210, 108729. [Google Scholar] [CrossRef]
- Nikolova, D.; Petkova, P.; Manolova, A.; Georgieva, P. ECG-Based Emotion Recognition: Overview of Methods and Applications. In ANNA ’18; Advances in Neural Networks and Applications 2018; VDE: Varna, Bulgaria, 2018; pp. 118–122. [Google Scholar]
- Nakanishi, R.; Imai-Matsumura, K. Facial Skin Temperature Decreases in Infants with Joyful Expression. Infant Behav. Dev. 2008, 31, 137–144. [Google Scholar] [CrossRef]
- Park, M.W.; Kim, C.J.; Hwang, M.; Lee, E.C. Individual Emotion Classification between Happiness and Sadness by Analyzing Photoplethysmography and Skin Temperature. In 2013 Fourth World Congress on Software Engineering; IEEE: Hong Kong, China, 2013; pp. 190–194. [Google Scholar] [CrossRef]
- Gouizi, K.; Bereksi Reguig, F.; Maaoui, C. Emotion Recognition from Physiological Signals. J. Med. Eng. Technol. 2011, 35, 300–307. [Google Scholar] [CrossRef]
- Abadi, M.K.; Kia, S.M.; Subramanian, R.; Avesani, P.; Sebe, N. User-Centric Affective Video Tagging from MEG and Peripheral Physiological Responses. In Proceedings of the 2013 Humaine Association Conference on Affective Computing and Intelligent Interaction, Geneva, Switzerland, 2–5 September 2013; IEEE: Geneva, Switzerland, 2013; pp. 582–587. [Google Scholar] [CrossRef]
- Aguiñaga, A.R.; Lopez Ramirez, M.; Alanis Garza, A.; Baltazar, R.; Zamudio, V.M. Emotion Analysis through Hysiological Measurements; IOS Press: Amsterdam, The Netherlands, 2013; pp. 97–106. [Google Scholar]
- Javaid, M.; Haleem, A.; Vaishya, R.; Bahl, S.; Suman, R.; Vaish, A. Industry 4.0 Technologies and Their Applications in Fighting COVID-19 Pandemic. Diabetes Metab. Syndr. Clin. Res. Rev. 2020, 14, 419–422. [Google Scholar] [CrossRef]
- Kalhori, S.R.N.; Bahaadinbeigy, K.; Deldar, K.; Gholamzadeh, M.; Hajesmaeel-Gohari, S.; Ayyoubzadeh, S.M. Digital Health Solutions to Control the COVID-19 Pandemic in Countries with High Disease Prevalence: Literature Review. J. Med. Internet Res. 2021, 23, e19473. [Google Scholar] [CrossRef]
- Rahman, M.S.; Peeri, N.C.; Shrestha, N.; Zaki, R.; Haque, U.; Hamid, S.H.A. Defending against the Novel Coronavirus (COVID-19) Outbreak: How Can the Internet of Things (IoT) Help to Save the World? Health Policy Technol. 2020, 9, 136–138. [Google Scholar] [CrossRef]
- Rajeesh Kumar, N.V.; Arun, M.; Baraneetharan, E.; Stanly Jaya Prakash, J.; Kanchana, A.; Prabu, S. Detection and Monitoring of the Asymptotic COVID-19 Patients Using IoT Devices and Sensors. Int. J. Pervasive Comput. Commun. 2020, 18(4), 407–418. [Google Scholar] [CrossRef]
- Stojanovic, R.; Skraba, A.; Lutovac, B. A Headset Like Wearable Device to Track COVID-19 Symptoms. In 2020 9th Mediterranean Conference on Embedded Computing (MECO), Budva, Montenegro, 8–11 June 2020; IEEE: Budva, Montenegro, 2020; pp. 8–11. [Google Scholar] [CrossRef]
- Xian, M.; Luo, H.; Xia, X.; Fares, C.; Carey, P.H.; Chiu, C.-W.; Ren, F.; Shan, S.-S.; Liao, Y.-T.; Hsu, S.-M.; et al. Fast SARS-CoV-2 Virus Detection Using Disposable Cartridge Strips and a Semiconductor-Based Biosensor Platform. J. Vac. Sci. Technol. B 2021, 39, 033202. [Google Scholar] [CrossRef]
- Chamberlain, S.D.; Singh, I.; Ariza, C.; Daitch, A.; Philips, P.; Dalziel, B.D. Real-Time Detection of COVID-19 Epicenters within the United States Using a Network of Smart Thermometers. Epidemiology 2020, 1–15. [Google Scholar] [CrossRef]
- Cherry, K. The Role of Neurotransmitters. 2021. Available online: https://www.verywellmind.com/what-is-a-neurotransmitter-2795394 (accessed on 14 June 2022).
- Ali Fahmi, P.N.; Kodirov, E.; Choi, D.-J.; Lee, G.-S.; Mohd Fikri Azli, A.; Sayeed, S. Implicit Authentication Based on Ear Shape Biometrics Using Smartphone Camera during a Call. In 2012 IEEE International Conference on Systems, Man, and Cybernetics (SMC), Seoul, Korea, 14–17 October 2012; IEEE: Seoul, Korea, 2012; pp. 2272–2276. [Google Scholar] [CrossRef]
- Calvert, G. Everything You Need to Know about Implicit Reaction Time (IRTs). 2015. Available online: http://gemmacalvert.com/everything-you-need-to-know-about-implicit-reaction-time/ (accessed on 17 August 2022).
- Harris, J.M.; Ciorciari, J.; Gountas, J. Consumer Neuroscience for Marketing Researchers. J. Consum. Behav. 2018, 17, 239–252. [Google Scholar] [CrossRef]
- Fox, E. Perspectives from Affective Science on Understanding the Nature of Emotion. Brain Neurosci. Adv. 2018, 2, 239821281881262. [Google Scholar] [CrossRef]
- Casado-Aranda, L.A.; Sanchez-Fernandez, J. Advances in neuroscience and marketing: Analyzing tool possibilities and research opportunities. Span. J. Mark. – ESIC 2022, 26, 3–22. [Google Scholar] [CrossRef]
- Lantrip, C.; Gunning, F.M.; Flashman, L.; Roth, R.M.; Holtzheimer, P.E. Effects of Transcranial Magnetic Stimulation on the Cognitive Control of Emotion: Potential Antidepressant Mechanisms. J. ECT 2017, 33, 73–80. [Google Scholar] [CrossRef]
- Catalino, M.P.; Yao, S.; Green, D.L.; Laws, E.R.; Golby, A.J.; Tie, Y. Mapping Cognitive and Emotional Networks in Neurosurgical Patients Using Resting-State Functional Magnetic Resonance Imaging. Neurosurg. Focus 2020, 48, E9. [Google Scholar] [CrossRef]
- Grèzes, J.; Valabrègue, R.; Gholipour, B.; Chevallier, C. A Direct Amygdala-Motor Pathway for Emotional Displays to Influence Action: A Diffusion Tensor Imaging Study: A Direct Limbic Motor Anatomical Pathway. Hum. Brain Mapp. 2014, 35, 5974–5983. [Google Scholar] [CrossRef]
- Alhargan, A.; Cooke, N.; Binjammaz, T. Affect Recognition in an Interactive Gaming Environment Using Eye Tracking. In 2017 Seventh International Conference on Affective Computing and Intelligent Interaction (ACII), San Antonio, TX, USA, 23–26 October 2017; IEEE: San Antonio, TX, USA, 2017; pp. 285–291. [Google Scholar] [CrossRef]
- Szwoch, M.; Szwoch, W. Emotion Recognition for Affect Aware Video Games. In Image Processing & Communications Challenges 6; Choraś, R.S., Ed.; Advances in Intelligent Systems and Computing; Springer International Publishing: Cham, Switzerland, 2015; Volume 313, pp. 227–236. [Google Scholar] [CrossRef]
- Krol, L.R.; Freytag, S.-C.; Zander, T.O. Meyendtris: A Hands-Free, Multimodal Tetris Clone Using Eye Tracking and Passive BCI for Intuitive Neuroadaptive Gaming. In Proceedings of the 19th ACM International Conference on Multimodal Interaction, Glasgow, UK, 13–17 November 2017; ACM: Glasgow, UK, 2017; pp. 433–437. [Google Scholar] [CrossRef]
- Elor, A.; Powell, M.; Mahmoodi, E.; Teodorescu, M.; Kurniawan, S. Gaming Beyond the Novelty Effect of Immersive Virtual Reality for Physical Rehabilitation. IEEE Trans. Games 2022, 14, 107–115. [Google Scholar] [CrossRef]
- Tiwari, S.; Agarwal, S. A Shrewd Artificial Neural Network-Based Hybrid Model for Pervasive Stress Detection of Students Using Galvanic Skin Response and Electrocardiogram Signals. Big Data 2021, 9, 427–442. [Google Scholar] [CrossRef]
- Nakayama, N.; Arakawa, N.; Ejiri, H.; Matsuda, R.; Makino, T. Heart Rate Variability Can Clarify Students’ Level of Stress during Nursing Simulation. PLoS ONE 2018, 13, e0195280. [Google Scholar] [CrossRef]
- Tautchin, L.; Dussome, W. The Expanding Reach of Non-Traditional Marketing: A Discussion on the Application of Neuromarketing and Big Data Analytics in the Marketplace. Available online: https://lowelltautchin.ca/wp-content/uploads/2016/08/Neuromarketing-and-Big-Data-Analytics-Project.pdf (accessed on 14 June 2022).
- Goyal, G.; Singh, J. Minimum Annotation Identification of Facial Affects for Video Advertisement. In Proceedings of the 2018 International Conference on Intelligent Circuits and Systems (ICICS), Phagwara, India, 20–21 April 2018; IEEE: Phagwara, India, 2018; pp. 300–305. [Google Scholar] [CrossRef]
- Yadava, M.; Kumar, P.; Saini, R.; Roy, P.P.; Prosad Dogra, D. Analysis of EEG Signals and Its Application to Neuromarketing. Multimed. Tools Appl. 2017, 76, 19087–19111. [Google Scholar] [CrossRef]
- Lakhan, P.; Banluesombatkul, N.; Changniam, V.; Dhithijaiyratn, R.; Leelaarporn, P.; Boonchieng, E.; Hompoonsup, S.; Wilaiprasitporn, T. Consumer Grade Brain Sensing for Emotion Recognition. IEEE Sens. J. 2019, 19, 9896–9907. [Google Scholar] [CrossRef]
- Kong, W.; Wang, L.; Xu, S.; Babiloni, F.; Chen, H. EEG Fingerprints: Phase Synchronization of EEG Signals as Biomarker for Subject Identification. IEEE Access 2019, 7, 121165–121173. [Google Scholar] [CrossRef]
- El-Amir, M.M.; Al-Atabany, W.; Eldosoky, M.A. Emotion Recognition via Detrended Fluctuation Analysis and Fractal Dimensions. In Proceedings of the 2019 36th National Radio Science Conference (NRSC), Port Said, Egypt, 16–18 April 2019; IEEE: Port Said, Egypt, 2019; pp. 200–208. [Google Scholar] [CrossRef]
- Plassmann, H.; Kenning, P.; Deppe, M.; Kugel, H.; Schwindt, W. How Choice Ambiguity Modulates Activity in Brain Areas Representing Brand Preference: Evidence from Consumer Neuroscience. J. Consum. Behav. 2008, 7, 360–367. [Google Scholar] [CrossRef]
- Perrachione, T.K.; Perrachione, J.R. Brains and Brands: Developing Mutually Informative Research in Neuroscience and Marketing. J. Consum. Behav. 2008, 7, 303–318. [Google Scholar] [CrossRef]
- Gruter, D. Neuromarketing—New Science of Consumer Behavior. Available online: http://emarketingblog.nl/2014/12/neuromarketing-new-science-of-consumer-behavior/ (accessed on 14 June 2022).
- Leon, E.; Clarke, G.; Callaghan, V.; Sepulveda, F. A User-Independent Real-Time Emotion Recognition System for Software Agents in Domestic Environments. Eng. Appl. Artif. Intell. 2007, 20, 337–345. [Google Scholar] [CrossRef]
- Monajati, M.; Abbasi, S.H.; Shabaninia, F.; Shamekhi, S. Emotions States Recognition Based on Physiological Parameters by Employing of Fuzzy-Adaptive Resonance Theory. Int. J. Intell. Sci. 2012, 02, 166–175. [Google Scholar] [CrossRef]
- Andrew, H.; Haines, H.; Seixas, S. Using Neuroscience to Understand the Impact of Premium Digital Out-of-Home Media. Int. J. Mark. Res. 2019, 61, 588–600. [Google Scholar] [CrossRef]
- Kaklauskas, A.; Bucinskas, V.; Dzedzickis, A. Computer Implemented Neuromarketing Research Method. European Patent Application EP4016431, 7 February 2021. [Google Scholar]
- Lajante, M.; Ladhari, R. The Promise and Perils of the Peripheral Psychophysiology of Emotion in Retailing and Consumer Services. J. Retail. Consum. Serv. 2019, 50, 305–313. [Google Scholar] [CrossRef]
- Michael, I.; Ramsoy, T.; Stephens, M.; Kotsi, F. A Study of Unconscious Emotional and Cognitive Responses to Tourism Images Using a Neuroscience Method. J. Islamic Mark. 2019, 10, 543–564. [Google Scholar] [CrossRef]
- Libert, A.; van Hulle, M.M. Predicting Premature Video Skipping and Viewer Interest from EEG Recordings. Entropy 2019, 21, 1014. [Google Scholar] [CrossRef]
- Jiménez-Marín, G.; Bellido-Pérez, E.; López-Cortés, Á. Marketing Sensorial: El Concepto, Sus Técnicas y Su Aplicación En El Punto de Venta. Vivat Acad. 2019, 148, 121–147. [Google Scholar] [CrossRef]
- Cherubino, P.; Martinez-Levy, A.C.; Caratù, M.; Cartocci, G.; Di Flumeri, G.; Modica, E.; Rossi, D.; Mancini, M.; Trettel, A. Consumer Behaviour through the Eyes of Neurophysiological Measures: State-of-the-Art and Future Trends. Comput. Intell. Neurosci. 2019, 2019, 1976847. [Google Scholar] [CrossRef]
- Țichindelean, M.B.; Iuliana, C.; Țichindelean, M. Studying the User Experience in Online Banking Services: An Eye-Tracking Application. Stud. Bus. Econ. 2019, 14, 193–208. [Google Scholar] [CrossRef]
- Soria Morillo, L.M.; Alvarez-Garcia, J.A.; Gonzalez-Abril, L.; Ortega Ramírez, J.A. Discrete Classification Technique Applied to TV Advertisements Liking Recognition System Based on Low-Cost EEG Headsets. BioMed. Eng. OnLine 2016, 15, 75. [Google Scholar] [CrossRef]
- Pringle, H.; Field, P. Institute of Practitioners in Advertising. In Brand Immortality: How Brands Can Live Long and Prosper; Kogan Page: London, UK, 2008. [Google Scholar]
- Takahashi, K. Remarks on Emotion Recognition from Bio-Potential Signals. In Proceedings of the 2nd International Conference on Autonomous Robots and Agents, Palmerston North, New Zealand, 13–15 December 2004. [Google Scholar]
- Light, K.C.; Girdler, S.S.; Sherwood, A.; Bragdon, E.E.; Brownley, K.A.; West, S.G.; Hinderliter, A.L. High Stress Responsivity Predicts Later Blood Pressure Only in Combination with Positive Family History and High Life Stress. Hypertension 1999, 33, 1458–1464. [Google Scholar] [CrossRef]
- Gray, M.A.; Taggart, P.; Sutton, P.M.; Groves, D.; Holdright, D.R.; Bradbury, D.; Brull, D.; Critchley, H.D. A Cortical Potential Reflecting Cardiac Function. Proc. Natl. Acad. Sci. USA 2007, 104, 6818–6823. [Google Scholar] [CrossRef]
- Adrogué, H.J.; Madias, N.E. Sodium and Potassium in the Pathogenesis of Hypertension. N. Engl. J. Med. 2007, 356, 1966–1978. [Google Scholar] [CrossRef]
- Blair, D.A.; Glover, W.E.; Greenfield, A.D.M.; Roddie, I.C. Excitation of Cholinergic Vasodilator Nerves to Human Skeletal Muscles during Emotional Stress. J. Physiol. 1959, 148, 633–647. [Google Scholar] [CrossRef]
- Gasperin, D.; Netuveli, G.; Dias-da-Costa, J.S.; Pattussi, M.P. Effect of Psychological Stress on Blood Pressure Increase: A Meta-Analysis of Cohort Studies. Cad. Saúde Pública 2009, 25, 715–726. [Google Scholar] [CrossRef]
- Sun, F.-T.; Kuo, C.; Cheng, H.-T.; Buthpitiya, S.; Collins, P.; Griss, M. Activity-Aware Mental Stress Detection Using Physiological Sensors. In Mobile Computing, Applications, and Services; Gris, M., Yang, G., Eds.; Lecture Notes of the Institute for Computer Sciences, Social Informatics and Telecommunications Engineering; Springer: Berlin/Heidelberg, Germany, 2012; Volume 76, pp. 211–230. [Google Scholar] [CrossRef]
- Singh, R.R.; Conjeti, S.; Banerjee, R. A Comparative Evaluation of Neural Network Classifiers for Stress Level Analysis of Automotive Drivers Using Physiological Signals. Biomed. Signal Processing Control 2013, 8, 740–754. [Google Scholar] [CrossRef]
- Palacios, D.; Rodellar, V.; Lázaro, C.; Gómez, A.; Gómez, P. An ICA-Based Method for Stress Classification from Voice Samples. Neural Comput. Applic. 2020, 32, 17887–17897. [Google Scholar] [CrossRef]
- Oka, T.; Oka, K.; Hori, T. Mechanisms and Mediators of Psychological Stress-Induced Rise in Core Temperature. Psychosom. Med. 2001, 63, 476–486. [Google Scholar] [CrossRef] [PubMed]
- Wu, C.-H.; Liang, W.-B. Emotion Recognition of Affective Speech Based on Multiple Classifiers Using Acoustic-Prosodic Information and Semantic Labels. IEEE Trans. Affect. Comput. 2011, 2, 10–21. [Google Scholar] [CrossRef]
- Nilashi, M.; Mardani, A.; Liao, H.; Ahmadi, H.; Manaf, A.A.; Almukadi, W. A Hybrid Method with TOPSIS and Machine Learning Techniques for Sustainable Development of Green Hotels Considering Online Reviews. Sustainability 2019, 11, 6013. [Google Scholar] [CrossRef]
- Kaklauskas, A.; Ubarte, I.; Kalibatas, D.; Lill, I.; Velykorusova, A.; Volginas, P.; Vinogradova, I.; Milevicius, V.; Vetloviene, I.; Grubliauskas, I.; et al. A Multisensory, Green, and Energy Efficient Housing Neuromarketing Method. Energies 2019, 12, 3836. [Google Scholar] [CrossRef]
- Kaklauskas, A.; Dzitac, D.; Sliogeriene, J.; Lepkova, N.; Vetloviene, I. VINERS Method for the Multiple Criteria Analysis and Neuromarketing of Best Places to Live. Int. J. Comput. Commun. Control 2019, 14, 629–646. [Google Scholar] [CrossRef]
- Etzold, V.; Braun, A.; Wanner, T. Eye Tracking as a Method of Neuromarketing for Attention Research—An Empirical Analysis Using the Online Appointment Booking Platform from Mercedes-Benz. In Intelligent Decision Technologies 2019; Czarnowski, I., Howlett, R.J., Jain, L.C., Eds.; Smart Innovation, Systems and Technologies; Springer: Singapore, 2019; Volume 143, pp. 167–182. [Google Scholar] [CrossRef]
- Dedeoglu, B.B.; Bilgihan, A.; Ye, B.H.; Buonincontri, P.; Okumus, F. The Impact of Servicescape on Hedonic Value and Behavioral Intentions: The Importance of Previous Experience. Int. J. Hosp. Manag. 2018, 72, 10–20. [Google Scholar] [CrossRef]
- Khan, S.N.; Mohsin, M. The Power of Emotional Value: Exploring the Effects of Values on Green Product Consumer Choice Behavior. J. Clean. Prod. 2017, 150, 65–74. [Google Scholar] [CrossRef]
- Puustinen, P.; Maas, P.; Karjaluoto, H. Development and Validation of the Perceived Investment Value (PIV) Scale. J. Econ. Psychol. 2013, 36, 41–54. [Google Scholar] [CrossRef]
- Shaw, C. What’s Your Companies Emotion Score? Introducing Net Emotional Value (Nev) and Its Relationship to NPS and CSAT. 2012. Available online: https://beyondphilosophy.com/whats-your-companies-emotion-score-introducing-net-emotional-value-nev-and-its-relationship-to-nps-and-csat/ (accessed on 14 June 2022).
- Shaw, C. New CX Measure to Compliment NPS: Net Emotional Value. 2016. Available online: https://customerthink.com/new-cx-measure-to-compliment-nps-net-emotional-value/ (accessed on 14 June 2022).
- Shaw, C. How to Measure Customer Emotions. 2018. Available online: https://beyondphilosophy.com/measurecustomer-emotions/ (accessed on 14 June 2022).
- Situmorang, S.H. Gen C and Gen Y: Experience, Net Emotional Value and Net Promoter Score. In Proceedings of the 1st International Conference on Social and Political Development (ICOSOP 2016), Medan, Indonesia, 21–22 November 2016; Atlantis Press: Medan, Indonesia, 2017; pp. 259–265. [Google Scholar] [CrossRef]
- Williams, P.; Soutar, G.N. Value, Satisfaction and Behavioral Intentions in an Adventure Tourism Context. Ann. Tour. Res. 2009, 36, 413–438. [Google Scholar] [CrossRef]
- Bailey, J.J.; Gremler, D.D.; McCollough, M.A. Service Encounter Emotional Value: The Dyadic Influence of Customer and Employee Emotions. Serv. Mark. Q. 2001, 23, 1–24. [Google Scholar] [CrossRef]
- Zavadskas, E.K.; Bausys, R.; Kaklauskas, A.; Raslanas, S. Hedonic Shopping Rent Valuation by One-to-One Neuromarketing and Neutrosophic PROMETHEE Method. Appl. Soft Comput. 2019, 85, 105832. [Google Scholar] [CrossRef]
- De Leersnyder, J.; Mesquita, B.; Boiger, M. What Has Culture Got to Do with Emotions?: (A Lot). In Handbook of Advances in Culture and Psychology; Oxford University Press: Oxford, UK, 2021; Volume 8, pp. 62–119. [Google Scholar] [CrossRef]
- Frijda, N.H. The Laws of Emotion, 1st ed.; Psychology Press: New York, NY, USA, 2017. [Google Scholar] [CrossRef]
- Levenson, R.W. Human Emotions: A Functional View. In The Nature of Emotion: Fundamental Questions; Oxford University Press: New York, NY, USA, 1994; pp. 123–126. [Google Scholar]
- Nesse, R.M. Evolutionary Explanations of Emotions. Hum. Nat. 1990, 1, 261–289. [Google Scholar] [CrossRef]
- Bonanno, G.A.; Colak, D.M.; Keltner, D.; Shiota, M.N.; Papa, A.; Noll, J.G.; Putnam, F.W.; Trickett, P.K. Context Matters: The Benefits and Costs of Expressing Positive Emotion among Survivors of Childhood Sexual Abuse. Emotion 2007, 7, 824–837. [Google Scholar] [CrossRef]
- Coifman, K.G.; Bonanno, G.A. Emotion Context Sensitivity in Adaptation and Recovery. In Emotion Regulation and Psychopathology: A Transdiagnostic Approach to Etiology and Treatment; The Guilford Press: New York, NY, USA, 2010; pp. 157–173. [Google Scholar]
- Pugh, Z.H.; Huang, J.; Leshin, J.; Lindquist, K.A.; Nam, C.S. Culture and Gender Modulate DlPFC Integration in the Emotional Brain: Evidence from Dynamic Causal Modeling. Cogn. Neurodyn. 2022. Available online: https://link.springer.com/content/pdf/10.1007/s11571-022-09805-2.pdf (accessed on 14 June 2022). [CrossRef]
- Tomasino, B.; Maggioni, E.; Bonivento, C.; Nobile, M.; D’Agostini, S.; Arrigoni, F.; Fabbro, F.; Brambilla, P. Effects of Age and Gender on Neural Correlates of Emotion Imagery. Hum. Brain Mapp. 2022. [Google Scholar] [CrossRef]
- Hampton, R.S.; Varnum, M.E.W. The Cultural Neuroscience of Emotion Regulation. Cult. Brain 2018, 6, 130–150. [Google Scholar] [CrossRef]
- Rule, N.O.; Freeman, J.B.; Ambady, N. Culture in Social Neuroscience: A Review. Soc. Neurosci. 2013, 8, 3–10. [Google Scholar] [CrossRef]
- Kraus, M.W.; Piff, P.K.; Keltner, D. Social Class, Sense of Control, and Social Explanation. J. Personal. Soc. Psychol. 2009, 97, 992–1004. [Google Scholar] [CrossRef]
- Gallo, L.C.; Matthews, K.A. Understanding the Association between Socioeconomic Status and Physical Health: Do Negative Emotions Play a Role? Psychol. Bull. 2003, 129, 10–51. [Google Scholar] [CrossRef]
- Choudhury, S.; Nagel, S.K.; Slaby, J. Critical Neuroscience: Linking Neuroscience and Society through Critical Practice. BioSocieties 2009, 4, 61–77. [Google Scholar] [CrossRef]
- Goldfarb, M.G.; Brown, D.R. Diversifying Participation: The Rarity of Reporting Racial Demographics in Neuroimaging Research. NeuroImage 2022, 254, 119122. [Google Scholar] [CrossRef]
- Lane, R.D. From Reconstruction to Construction: The Power of Corrective Emotional Experiences in Memory Reconsolidation and Enduring Change. J. Am. Psychoanal. Assoc. 2018, 66, 507–516. [Google Scholar] [CrossRef]
- Nakamura, F. Creating or Performing Words? Observations on Contemporary Japanese Calligraphy. In Creativity and Cultural Improvisation; Routledge: Oxfordshire, UK, 2021; pp. 79–98. [Google Scholar]
- Markus, H.R.; Kitayama, S. Cultural Variation in the Self-Concept. In The Self: Interdisciplinary Approaches; Strauss, J., Goethals, G.R., Eds.; Springer: New York, NY, USA, 1991; pp. 18–48. [Google Scholar] [CrossRef]
- Mesquita, B.; Frijda, N.H. Cultural Variations in Emotions: A Review. Psychol. Bull. 1992, 112, 179–204. [Google Scholar] [CrossRef]
- Mesquita, B.; Leu, J. The Cultural Psychology of Emotion. In Handbook of Cultural Psychology; The Guilford Press: New York, NY, USA, 2007; pp. 734–759. [Google Scholar]
- Lim, N. Cultural Differences in Emotion: Differences in Emotional Arousal Level between the East and the West. Integr. Med. Res. 2016, 5, 105–109. [Google Scholar] [CrossRef]
- Hareli, S.; Kafetsios, K.; Hess, U. A Cross-Cultural Study on Emotion Expression and the Learning of Social Norms. Front. Psychol. 2015, 6, 1501. [Google Scholar] [CrossRef]
- Scollon, C.N.; Diener, E.; Oishi, S.; Biswas-Diener, R. Emotions Across Cultures and Methods. J. Cross-Cult. Psychol. 2004, 35, 304–326. [Google Scholar] [CrossRef]
- Siddiqui, H.U.R.; Shahzad, H.F.; Saleem, A.A.; Khan Khakwani, A.B.; Rustam, F.; Lee, E.; Ashraf, I.; Dudley, S. Respiration Based Non-Invasive Approach for Emotion Recognition Using Impulse Radio Ultra Wide Band Radar and Machine Learning. Sensors 2021, 21, 8336. [Google Scholar] [CrossRef]
- Houssein, E.H.; Hammad, A.; Ali, A.A. Human Emotion Recognition from EEG-Based Brain–Computer Interface Using Machine Learning: A Comprehensive Review. Neural Comput Applic 2022, 34, 12527–12557. [Google Scholar] [CrossRef]
- Shi, Y.; Zheng, X.; Li, T. Unconscious Emotion Recognition Based on Multi-Scale Sample Entropy. In Proceedings of the 2018 IEEE International Conference on Bioinformatics and Biomedicine (BIBM), Madrid, Spain, 3–6 December 2018; IEEE: Madrid, Spain, 2018; pp. 1221–1226. [Google Scholar] [CrossRef]
- Thomson, D.M.H.; Coates, T. Are Unconscious Emotions Important in Product Assessment? How Can We Access Them? Food Qual. Prefer. 2021, 92, 104123. [Google Scholar] [CrossRef]
- Poria, S.; Cambria, E.; Bajpai, R.; Hussain, A. A Review of Affective Computing: From Unimodal Analysis to Multimodal Fusion. Inf. Fusion 2017, 37, 98–125. [Google Scholar] [CrossRef]
- Caridakis, G.; Castellano, G.; Kessous, L.; Raouzaiou, A.; Malatesta, L.; Asteriadis, S.; Karpouzis, K. Multimodal Emotion Recognition from Expressive Faces, Body Gestures and Speech. In Artificial Intelligence and Innovations 2007: From Theory to Applications; Boukis, C., Pnevmatikakis, A., Polymenakos, L., Eds.; IFIP The International Federation for Information Processing; Springer: Boston, MA, USA, 2007; Volume 247, pp. 375–388. [Google Scholar] [CrossRef]
- Cambria, E.; Das, D.; Bandyopadhyay, S.; Feraco, A. Affective Computing and Sentiment Analysis. In A Practical Guide to Sentiment Analysis; Cambria, E., Das, D., Bandyopadhyay, S., Feraco, A., Eds.; Socio-Affective Computing; Springer International Publishing: Cham, Switzerland, 2017; Volume 5, pp. 102–107. [Google Scholar] [CrossRef]
- Dhanapal, R.; Bhanu, D. Electroencephalogram classification using various artificial neural networks. J. Crit. Rev. 2020, 7, 891–894. [Google Scholar] [CrossRef]
- Gunawan, T.S.; Alghifari, M.F.; Morshidi, M.A.; Kartiwi, M. A Review on Emotion Recognition Algorithms Using Speech Analysis. Indones. J. Electr. Eng. Inform. 2018, 6, 12–20. [Google Scholar] [CrossRef][Green Version]
- Sánchez-Reolid, R.; García, A.; Vicente-Querol, M.; Fernández-Aguilar, L.; López, M.; González, A. Artificial Neural Networks to Assess Emotional States from Brain-Computer Interface. Electronics 2018, 7, 384. [Google Scholar] [CrossRef]
- Nakisa, B.; Rastgoo, M.N.; Tjondronegoro, D.; Chandran, V. Evolutionary Computation Algorithms for Feature Selection of EEG-Based Emotion Recognition Using Mobile Sensors. Expert Syst. Appl. 2018, 93, 143–155. [Google Scholar] [CrossRef]
- Saxena, A.; Khanna, A.; Gupta, D. Emotion Recognition and Detection Methods: A Comprehensive Survey. J. Artif. Intell. Syst. 2020, 2, 53–79. [Google Scholar] [CrossRef]
- Ahmed, F.; Sieu, B.; Gavrilova, M.L. Score and Rank-Level Fusion for Emotion Recognition Using Genetic Algorithm. In Proceedings of the 2018 IEEE 17th International Conference on Cognitive Informatics & Cognitive Computing (ICCI*CC), IEEE, Berkeley, CA, USA, 7 October 2018; pp. 46–53. [Google Scholar] [CrossRef]
- Slimani, K.; Kas, M.; El Merabet, Y.; Ruichek, Y.; Messoussi, R. Local Feature Extraction Based Facial Emotion Recognition: A Survey. Int. J. Electr. Comput. Eng. 2020, 10, 4080–4092. [Google Scholar] [CrossRef]
- Maheshwari, D.; Ghosh, S.K.; Tripathy, R.K.; Sharma, M.; Acharya, U.R. Automated Accurate Emotion Recognition System Using Rhythm-Specific Deep Convolutional Neural Network Technique with Multi-Channel EEG Signals. Comput. Biol. Med. 2021, 134, 104428. [Google Scholar] [CrossRef]
- Zatarain Cabada, R.; Rodriguez Rangel, H.; Barron Estrada, M.L.; Cardenas Lopez, H.M. Hyperparameter Optimization in CNN for Learning-Centered Emotion Recognition for Intelligent Tutoring Systems. Soft Comput. 2020, 24, 7593–7602. [Google Scholar] [CrossRef]
- Poria, S.; Hazarika, D.; Majumder, N.; Naik, G.; Cambria, E.; Mihalcea, R. MELD: A Multimodal Multi-Party Dataset for Emotion Recognition in Conversations. In Proceedings of the 57th Annual Meeting of the Association for Computational Linguistics, Florence, Italy, 28 July–2 August 2019; Association for Computational Linguistics: Florence, Italy, 2019; pp. 527–536. [Google Scholar] [CrossRef]
- Xu, Y.; Sun, Y.; Liu, X.; Zheng, Y. A Digital-Twin-Assisted Fault Diagnosis Using Deep Transfer Learning. IEEE Access 2019, 7, 19990–19999. [Google Scholar] [CrossRef]
- Daneshfar, F.; Kabudian, S.J.; Neekabadi, A. Speech Emotion Recognition Using Hybrid Spectral-Prosodic Features of Speech Signal/Glottal Waveform, Metaheuristic-Based Dimensionality Reduction, and Gaussian Elliptical Basis Function Network Classifier. Appl. Acoust. 2020, 166, 107360. [Google Scholar] [CrossRef]
- Shi, W.; Jiang, M. Fuzzy Wavelet Network with Feature Fusion and LM Algorithm for Facial Emotion Recognition. In Proceedings of the 2018 IEEE International Conference of Safety Produce Informatization (IICSPI), Chongqing, China, 10–12 December 2018; IEEE: Chongqing, China, 2018; pp. 582–586. [Google Scholar] [CrossRef]
- Yildirim, S.; Kaya, Y.; Kılıç, F. A Modified Feature Selection Method Based on Metaheuristic Algorithms for Speech Emotion Recognition. Appl. Acoust. 2021, 173, 107721. [Google Scholar] [CrossRef]
- Bellamkonda, S.S. Facial Emotion Recognition by Hyper-Parameter Tuning of Convolutional Neural Network Using Genetic Algorithm. 2021. Available online: http://urn.kb.se/resolve?urn=urn:nbn:se:bth-22308 (accessed on 14 June 2022).
- Jalili, L.; Cervantes, J.; García-Lamont, F.; Trueba, A. Emotion Recognition from Facial Expressions Using a Genetic Algorithm to Feature Extraction. In Intelligent Computing Theories and Application; Huang, D.-S., Jo, K.-H., Li, J., Gribova, V., Bevilacqua, V., Eds.; Lecture Notes in Computer Science; Springer International Publishing: Cham, Switzerland, 2021; Volume 12836, pp. 59–71. [Google Scholar] [CrossRef]
- Sun, L.; Li, Q.; Fu, S.; Li, P. Speech Emotion Recognition Based on Genetic Algorithm–Decision Tree Fusion of Deep and Acoustic Features. ETRI J. 2022, 44, 462–475. [Google Scholar] [CrossRef]
- Madhoushi, Z.; Hamdan, A.R.; Zainudin, S. Sentiment Analysis Techniques in Recent Works. In Proceedings of the 2015 Science and Information Conference (SAI), London, UK, 28–30 August 2015; IEEE: London, UK, 2015; pp. 288–291. [Google Scholar] [CrossRef]
- Li, G.; Zhou, X.; Cao, L. AI Meets Database: AI4DB and DB4AI. In Proceedings of the 2021 International Conference on Management of Data, Virtual Event, China; 2021; pp. 2859–2866. Available online: https://dbgroup.cs.tsinghua.edu.cn/ligl/papers/sigmod21-tutorial-paper.pdf (accessed on 14 June 2022). [CrossRef]
- Arnau-Gonzalez, P.; Katsigiannis, S.; Arevalillo-Herraez, M.; Ramzan, N. BED: A New Data Set for EEG-Based Biometrics. IEEE Internet Things J. 2021, 8, 12219–12230. [Google Scholar] [CrossRef]
- Stappen, L.; Schuller, B.; Lefter, I.; Cambria, E.; Kompatsiaris, I. Summary of MuSe 2020: Multimodal Sentiment Analysis, Emotion-Target Engagement and Trustworthiness Detection in Real-Life Media. In Proceedings of the 28th ACM International Conference on Multimedia, Seattle, WA, USA; ACM: Seattle, WA, USA, 2020; pp. 4769–4770. Available online: https://dl.acm.org/doi/pdf/10.1145/3394171.3421901 (accessed on 14 June 2022). [CrossRef]
- Poria, S.; Majumder, N.; Mihalcea, R.; Hovy, E. Emotion Recognition in Conversation: Research Challenges, Datasets, and Recent Advances. IEEE Access 2019, 7, 100943–100953. [Google Scholar] [CrossRef]
- Petta, P.; Pelachaud, C.; Cowie, R. (Eds.) Emotion-Oriented Systems: The Humaine Handbook; Cognitive Technologies; Springer: Berlin, Germany; London, UK, 2011. [Google Scholar]
- Busso, C.; Bulut, M.; Lee, C.-C.; Kazemzadeh, A.; Mower, E.; Kim, S.; Chang, J.N.; Lee, S.; Narayanan, S.S. IEMOCAP: Interactive Emotional Dyadic Motion Capture Database. Lang Resour. Eval. 2008, 42, 335–359. [Google Scholar] [CrossRef]
- Douglas-Cowie, E.; Campbell, N.; Cowie, R.; Roach, P. Emotional Speech: Towards a New Generation of Databases. Speech Commun. 2003, 40, 33–60. [Google Scholar] [CrossRef]
- McKeown, G.; Valstar, M.; Cowie, R.; Pantic, M.; Schroder, M. The SEMAINE Database: Annotated Multimodal Records of Emotionally Colored Conversations between a Person and a Limited Agent. IEEE Trans. Affect. Comput. 2012, 3, 5–17. [Google Scholar] [CrossRef]
- Koelstra, S.; Muhl, C.; Soleymani, M.; Lee, J.-S.; Yazdani, A.; Ebrahimi, T.; Pun, T.; Nijholt, A.; Patras, I. DEAP: A Database for Emotion Analysis; Using Physiological Signals. IEEE Trans. Affect. Comput. 2012, 3, 18–31. [Google Scholar] [CrossRef]
- Katsigiannis, S.; Ramzan, N. DREAMER: A Database for Emotion Recognition Through EEG and ECG Signals from Wireless Low-Cost Off-the-Shelf Devices. IEEE J. Biomed. Health Inform. 2018, 22, 98–107. [Google Scholar] [CrossRef]
- GitHub. EEG-Datasets. Available online: https://github.com/meagmohit/EEG-Datasets (accessed on 17 August 2022).
- Olivas, E.S.; Guerrero, J.D.M.; Martinez-Sober, M.; Magdalena-Benedito, J.R.; Serrano, L. Handbook Of Research On Machine Learning Applications and Trends: Algorithms, Methods and Techniques; IGI global: Hershey, PA, USA, 2009. [Google Scholar]
- Haerpfer, C.; Inglehart, R.; Moreno, A.; Welzel, C.; Kizilova, K.; Diez-Medrano, J.; Lagos, M.; Norris, P.; Ponarin, E.; Puranen, B. World Values Survey Wave 7 (2017–2022) Cross-National Data-Set. 2022. Available online: https://www.worldvaluessurvey.org/WVSDocumentationWV7.jsp (accessed on 14 June 2022). [CrossRef]
- Sýkorová, K.; Flegr, J. Faster Life History Strategy Manifests Itself by Lower Age at Menarche, Higher Sexual Desire, and Earlier Reproduction in People with Worse Health. Sci. Rep. 2021, 11, 11254. [Google Scholar] [CrossRef]
- Wlezien, C. Patterns of Representation: Dynamics of Public Preferences and Policy. J. Politics 2004, 66, 1–24. [Google Scholar] [CrossRef]
- Kelley, K.; Preacher, K.J. On effect size. Psychol. Methods 2012, 17, 137–152. [Google Scholar] [CrossRef] [PubMed]
- Wilkinson, L. Task Force on Statistical Inference, American Psychological Association, Science Directorate. Statistical methods in psychology journals: Guidelines and explanations. Am. Psychol. 1999, 54, 594–604. [Google Scholar] [CrossRef]
- Durlak, J.A. How to select, calculate, and interpret effect sizes. J. Pediatric Psychol. 2009, 34, 917–928. [Google Scholar] [CrossRef] [PubMed]
- Courville, T.; Thompson, B. Use of structure coefficients in published multiple regression articles: β is not enough. Educ. Psychol. Meas. 2001, 61, 229–248. [Google Scholar] [CrossRef]
- Johnson, J.W. A heuristic method for estimating the relative weight of predictor variables in multiple regression. Multivar. Behav. Res. 2000, 35, 1–19. [Google Scholar] [CrossRef]
- Depuydt, C.E.; Jonckheere, J.; Berth, M.; Salembier, G.M.; Vereecken, A.J.; Bogers, J.J. Serial type-specific human papillomavirus (HPV) load measurement allows differentiation between regressing cervical lesions and serial virion productive transient infections. Cancer Med. 2015, 4, 1294–1302. [Google Scholar] [CrossRef]
- Funder, D.C.; Ozer, D.J. Evaluating effect size in psychological research: Sense and nonsense. Adv. Methods Pract. Psychol. Sci. 2019, 2, 156–168. [Google Scholar] [CrossRef]
- Pogrow, S. How effect size (practical significance) misleads clinical practice: The case for switching to practical benefit to assess applied research findings. Am. Stat. 2019, 73, 223–234. [Google Scholar] [CrossRef]
- Tabassi, E.; Wilson, C. A novel approach to fingerprint image quality. In International Conference on Image Processing, ICIP’05, Genoa, Italy, 11–14 September 2005; IEEE: Genova, Italy, 2005; pp. 37–40. [Google Scholar]
- El-Abed, M.; Giot, R.; Charrier, C.; Rosenberger, C. Evaluation of biometric systems: An svm-based quality index. In Proceedings of the Third Norsk Information Security Conference, NISK; 2010; pp. 57–68. Available online: https://hal.archives-ouvertes.fr/hal-00995094/ (accessed on 14 June 2022).
- iSO 13407:1999. Human Centred Design Process for Interactive Systems. Available online: https://www.iso.org/obp/ui/#iso:std:iso:13407:ed-1:v1:en (accessed on 10 May 2022).
- Giot, R.; El-Abed, M.; Rosenberger, C. Fast computation of the performance evaluation of biometric systems: Application to multibiometrics. Future Gener. Comput. Syst. 2013, 29, 788–799. [Google Scholar] [CrossRef]
- Mansfield, A. ISO/IEC 19795-1:2006; Information technology–biometric performance testing and reporting–part 1: Principles and framework. 2006. Available online: https://www.iso.org/standard/41447.html (accessed on 14 June 2022).
- iSO/IEC FCD 19792; Information Technology—Security Techniques—Security Evaluation of Biometrics. Available online: https://webstore.iec.ch/preview/info_isoiec19792%7Bed1.0%7Den.pdf (accessed on 10 May 2022).
- Rane, S. Standardization of biometric template protection. IEEE MultiMedia 2014, 21, 94–99. [Google Scholar] [CrossRef]
- Dube, A.; Singh, D.; Asthana, R.K.; Walia, G.S. A Framework for Evaluation of Biometric Based Authentication System. In Proceedings of the 2020 3rd International Conference on Intelligent Sustainable Systems, ICISS, Thoothukudi, India, 3–5 December 2020; IEEE: Thoothukudi, India, 2020; pp. 925–932. [Google Scholar]
- Mannepalli, K.; Sastry, P.N.; Suman, M. FDBN: Design and development of Fractional Deep Belief Networks for speaker emotion recognition. Int. J. Speech Technol. 2016, 19, 779–790. [Google Scholar] [CrossRef]
- Al-Shayea, Q.; Al-Ani, M. Biometric face recognition based on enhanced histogram approach. Int. J. Commun. Netw. Inf. Secur. 2018, 10, 148–154. [Google Scholar] [CrossRef]
- Valiyavalappil Haridas, A.; Marimuthu, R.; Sivakumar, V.G.; Chakraborty, B. Emotion recognition of speech signal using Taylor series and deep belief network based classification. Evol. Intell. 2020, 15, 1145–1158. [Google Scholar] [CrossRef]
- Arora, M.; Kumar, M. AutoFER: PCA and PSO based automatic facial emotion recognition. Multimed. Tools Appl. 2021, 80, 3039–3049. [Google Scholar] [CrossRef]
- Karmarkar, U.R.; Plassmann, H. Consumer neuroscience: Past, present, and future. Organ. Res. Methods 2019, 22, 174–195. [Google Scholar] [CrossRef]
- Seitamaa-Hakkarainen, P.; Huotilainen, M.; Mäkelä, M.; Groth, C.; Hakkarainen, K. The Promise of Cognitive Neuroscience in Design Studies. Available online: https://dl.designresearchsociety.org/drs-conference-papers/drs2014/researchpapers/62 (accessed on 14 June 2022).
- Su, F.; Xia, L.; Cai, A.; Ma, J. A dual-biometric-modality identification system based on fingerprint and EEG. In Proceedings of the IEEE 4th International Conference on Biometrics Theory, Applications and Systems, BTAS, Washington, DC, USA, 27–29 September 2010; IEEE: Washington, DC, USA, 2010; pp. 3–8. [Google Scholar]
- Pal, S.; Mitra, M. Increasing the accuracy of ECG based biometric analysis by data modelling. Measurement 2012, 45, 1927–1932. [Google Scholar] [CrossRef]
- Singh, Y.N.; Singh, S.K.; Gupta, P. Fusion of electrocardiogram with unobtrusive biometrics: An efficient individual authentication system. Pattern Recognit. Lett. 2012, 33, 1932–1941. [Google Scholar] [CrossRef]
- Lourenço, A.; Silva, H.; Fred, A. Unveiling the biometric potential of finger-based ECG signals. Comput. Intell. Neurosci. 2011, 2011, 1–8. [Google Scholar] [CrossRef]
- Wahabi, S.; Member, S.; Pouryayevali, S.; Member, S. On evaluating ECG biometric systems: Session-dependence and body posture. IEEE Trans. Inf. Forensics Secur. 2014, 9, 2002–2013. [Google Scholar] [CrossRef]
- Havenetidis, K. Encryption and Biometrics: Context, methodologies and perspectives of biological data. J. Appl. Math. Bioinform. 2013, 3, 141. [Google Scholar]
- Sanjeeva Reddy, M.; Narasimha, B.; Suresh, E.; Subba Rao, K. Analysis of EOG signals using wavelet transform for detecting eye blinks. In Proceedings of the 2010 International Conference on Wireless Communications & Signal Processing, WCSP 2010, Suzhou, China, 21–23 October 2010; pp. 1–3. [Google Scholar]
- Punsawad, Y.; Wongsawat, Y.; Parnichkun, M. Hybrid EEG-EOG brain-computer interface system for practical machine control. In Proceedings of the 2010 Annual International Conference of the IEEE Engineering in Medicine Biology Society, EMBC 2010, Buenos Aires, Argentina, 31 August–4 September 2010; pp. 1360–1363. [Google Scholar]
- Zapata, J.C.; Duque, C.M.; Rojas-Idarraga, Y.; Gonzalez, M.E.; Guzmán, J.A.; Botero, B. Data fusion applied to biometric identification–A review. In Colombian Conference on Computing; Springer: Cham, Switzerland, 2017; pp. 721–733. [Google Scholar]
- Gutu, D. A Study of Facial Electromyography for Improving Image Quality Assessment. Ph.D. Thesis, University of Toyama, Toyama, Japan, 2015. [Google Scholar]
- Jain, A.K.; Ross, A.; Prabhakar, S. An introduction to biometric recognition. IEEE Transactions on circuits and systems for video technology 2004, 14(1), 4–20. [Google Scholar] [CrossRef]
- National Research Council. Biometric Recognition: Challenges and Opportunities; The National Academies Press: Washington, DC, USA, 2010; p. 182. [Google Scholar] [CrossRef]
- Bhatia, R. Biometrics and face recognition techniques. Int. J. Adv. Res. Comput. Sci. Softw. Eng. 2013, 3, 93–99. [Google Scholar]
- Sabhanayagam, T.; Venkatesan, V.P.; Senthamaraikannan, K. A comprehensive survey on various biometric systems. Int. J. Appl. Eng. Res. 2018, 13, 2276–2297. [Google Scholar]
- Delac, K.; Grgic, M. A survey of biometric recognition methods. In Proceedings Elmar-200, 46th International Symposium on Electronics in Marine, Zadar, Croatia, 16–18 June 2004; IEEE: Zadar, Croatia, 2004; pp. 184–193. [Google Scholar]
- Kataria, A.N.; Adhyaru, D.M.; Sharma, A.K.; Zaveri, T.H. A survey of automated biometric authentication techniques. In Proceedings of the 2013 Nirma University International Conference on Engineering (NUiCONE), Ahmedabad, India, 28–30 November 2013; IEEE: Ahmedabad, India, 2013; pp. 1–6. [Google Scholar]
- Khairwa, A.; Abhishek, K.; Prakash, S.; Pratap, T. A comprehensive study of various biometric identification techniques. In Proceedings of the 2012 Third International Conference on Computing, Communication and Networking Technologies (ICCCNT’12), Coimbatore, India, 26–28 July 2012; IEEE: Coimbatore, India, 2012; pp. 1–6. [Google Scholar]
- Ooms, K.; Dupont, L.; Lapon, L.; Popelka, S. Accuracy and precision of fixation locations recorded with the Low-cost Eye Tribe tracker in different experimental setups. J. Eye Mov. Res. 2015, 8, 1–24. [Google Scholar] [CrossRef]
- Lopez-Basterretxea, A.; Mendez-Zorrilla, A.; Garcia-Zapirain, B. Eye/head tracking technology to improve HCI with iPad applications. Sensors 2015, 15, 2244–2264. [Google Scholar] [CrossRef]
- Harinda, E.; Ntagwirumugara, E. Security & privacy implications in the placement of biometric-based ID card for Rwanda Universities. J. Inf. Secur. 2015, 6, 93. [Google Scholar] [CrossRef]
- Ibrahim, D.R.; Tamimi, A.A.; Abdalla, A.M. Performance analysis of biometric recognition modalities. In Proceedings of the 2017 8th International Conference on Information Technology (ICIT); IEEE: Amman, Jordan, 2017; pp. 980–984. Available online: https://ieeexplore.ieee.org/stamp/stamp.jsp?tp=&arnumber=8079977 (accessed on 14 June 2022).
- Vats, S.; Kaur, H. A Comparative Study of Different Biometric Features. Int. J. Adv. Res. Comput. Sci. 2016, 7, 30–35. [Google Scholar] [CrossRef]
- Yu, F.X.; Suo, Y.N. Application of gesture recognition based on the somatosensory kinect sensor in human-computer interaction framework. Rev. Fac. Ing. 2017, 32, 580–585. [Google Scholar]
- Meitram, R.; Choudhary, P. Palm vein recognition based on 2D Gabor filter and artificial neural network. J. Adv. Inf. Technol. 2018, 9, 68–72. [Google Scholar] [CrossRef]
- Ahmed, A.A.E.; Traore, I. A new biometric technology based on mouse dynamics. IEEE Trans. Dependable Secur. Comput. 2007, 4, 165–179. [Google Scholar] [CrossRef]
- Trewin, S.; Swart, C.; Koved, L.; Martino, J.; Singh, K.; Ben-David, S. Biometric authentication on a mobile device: A study of user effort, error and task disruption. In Proceedings of the 28th Annual Computer Security Applications Conference, ACSAC, New York, NY, USA, 3–7 December 2012; pp. 159–168. [Google Scholar] [CrossRef]
- Haghighat, M.; Abdel-Mottaleb, M.; Alhalabi, W. Discriminant Correlation Analysis: Real-Time Feature Level Fusion for Multimodal Biometric Recognition. IEEE Trans. Inf. Forensics Security. Wash. Bus. J. 2016, 11, 1984–1996. [Google Scholar] [CrossRef]
- Flook, B. This is the ’biometric war’ Michael Saylor was talking about. Wash. Bus. J. 2013, 9, 91–98. [Google Scholar]
- Islam, M. Feature and score fusion based multiple classifier selection for iris recognition. Comput. Intell. Neurosci. 2014, 2014, 380585. [Google Scholar] [CrossRef]
- De Leersnyder, J.; Mesquita, B.; Kim, H.S. Where Do My Emotions Belong? A Study of Immigrants’ Emotional Acculturation. Pers. Soc. Psychol. Bull. 2011, 37, 451–463. [Google Scholar] [CrossRef] [PubMed]
- Vuong, Q.H.; Napier, N.K. Acculturation and Global Mindsponge: An Emerging Market Perspective. Int. J. Intercult. Relat. 2015, 49, 354–367. [Google Scholar] [CrossRef]
- Vuong, Q.-H. Global Mindset as the Integration of Emerging Socio-Cultural Values through Mindsponge Processes: A Transition Economy Perspective. In Global Mindsets: Exploration and Perspectives; Routledge: London, UK, 2016; pp. 109–126. [Google Scholar]
- Vuong, Q.-H.; Bui, Q.-K.; La, V.-P.; Vuong, T.-T.; Nguyen, V.-H.T.; Ho, M.-T.; Nguyen, H.-K.T.; Ho, M.-T. Cultural Additivity: Behavioural Insights from the Interaction of Confucianism, Buddhism and Taoism in Folktales. Palgrave Commun. 2018, 4, 143. [Google Scholar] [CrossRef]
- Vuong, Q.-H.; Ho, M.-T.; Nguyen, H.-K.T.; Vuong, T.-T.; Tran, T.; Hoang, K.-L.; Vu, T.-H.; Hoang, P.-H.; Nguyen, M.-H.; Ho, M.-T.; et al. On How Religions Could Accidentally Incite Lies and Violence: Folktales as a Cultural Transmitter. Palgrave Commun. 2020, 6, 82. [Google Scholar] [CrossRef]
- Ho, M.-T.; Mantello, P.; Nguyen, H.-K.T.; Vuong, Q.-H. Affective Computing Scholarship and the Rise of China: A View from 25 Years of Bibliometric Data. Hum. Soc. Sci. Commun. 2021, 8, 282. [Google Scholar] [CrossRef]
- FaceReader. Reference Manual Version 7. Tool for Automatic Analysis of Facial Expressions. Available online: http://sslab.nwpu.edu.cn/uploads/1500604789-971697563f64.pdf (accessed on 2 March 2022).
- Kaklauskas, A.; Abraham, A.; Milevicius, V. Diurnal Emotions, Valence and the Coronavirus Lockdown Analysis in Public Spaces. Eng. Appl. Artif. Intell. 2021, 98, 104122. [Google Scholar] [CrossRef]
- Sun, Z.; Li, Q.; Liu, Y.; Zhu, Y. Opportunities and Challenges for Biometrics. China’s E-Sci. Blue Book 2021, 101–125. [Google Scholar]
- Albuquerque, V.H.C.D.; Damaševičius, R.; Tavares, J.M.R.; Pinheiro, P.R. EEG-based biometrics: Challenges and applications. Comput. Intell. Neurosci. 2018, 2018, 5483921. [Google Scholar] [CrossRef]
- Fierrez, J.; Morales, A.; Vera-Rodriguez, R.; Camacho, D. Multiple classifiers in biometrics. Part 2: Trends and challenges. Inf. Fusion 2018, 44, 103–112. [Google Scholar] [CrossRef]
- Sivaraman, S. Top 10 Trending Biometric Technology for 2022. Available online: https://blog.mantratec.com/Top-10-trending-Biometric-technology-for-2022 (accessed on 2 March 2022).


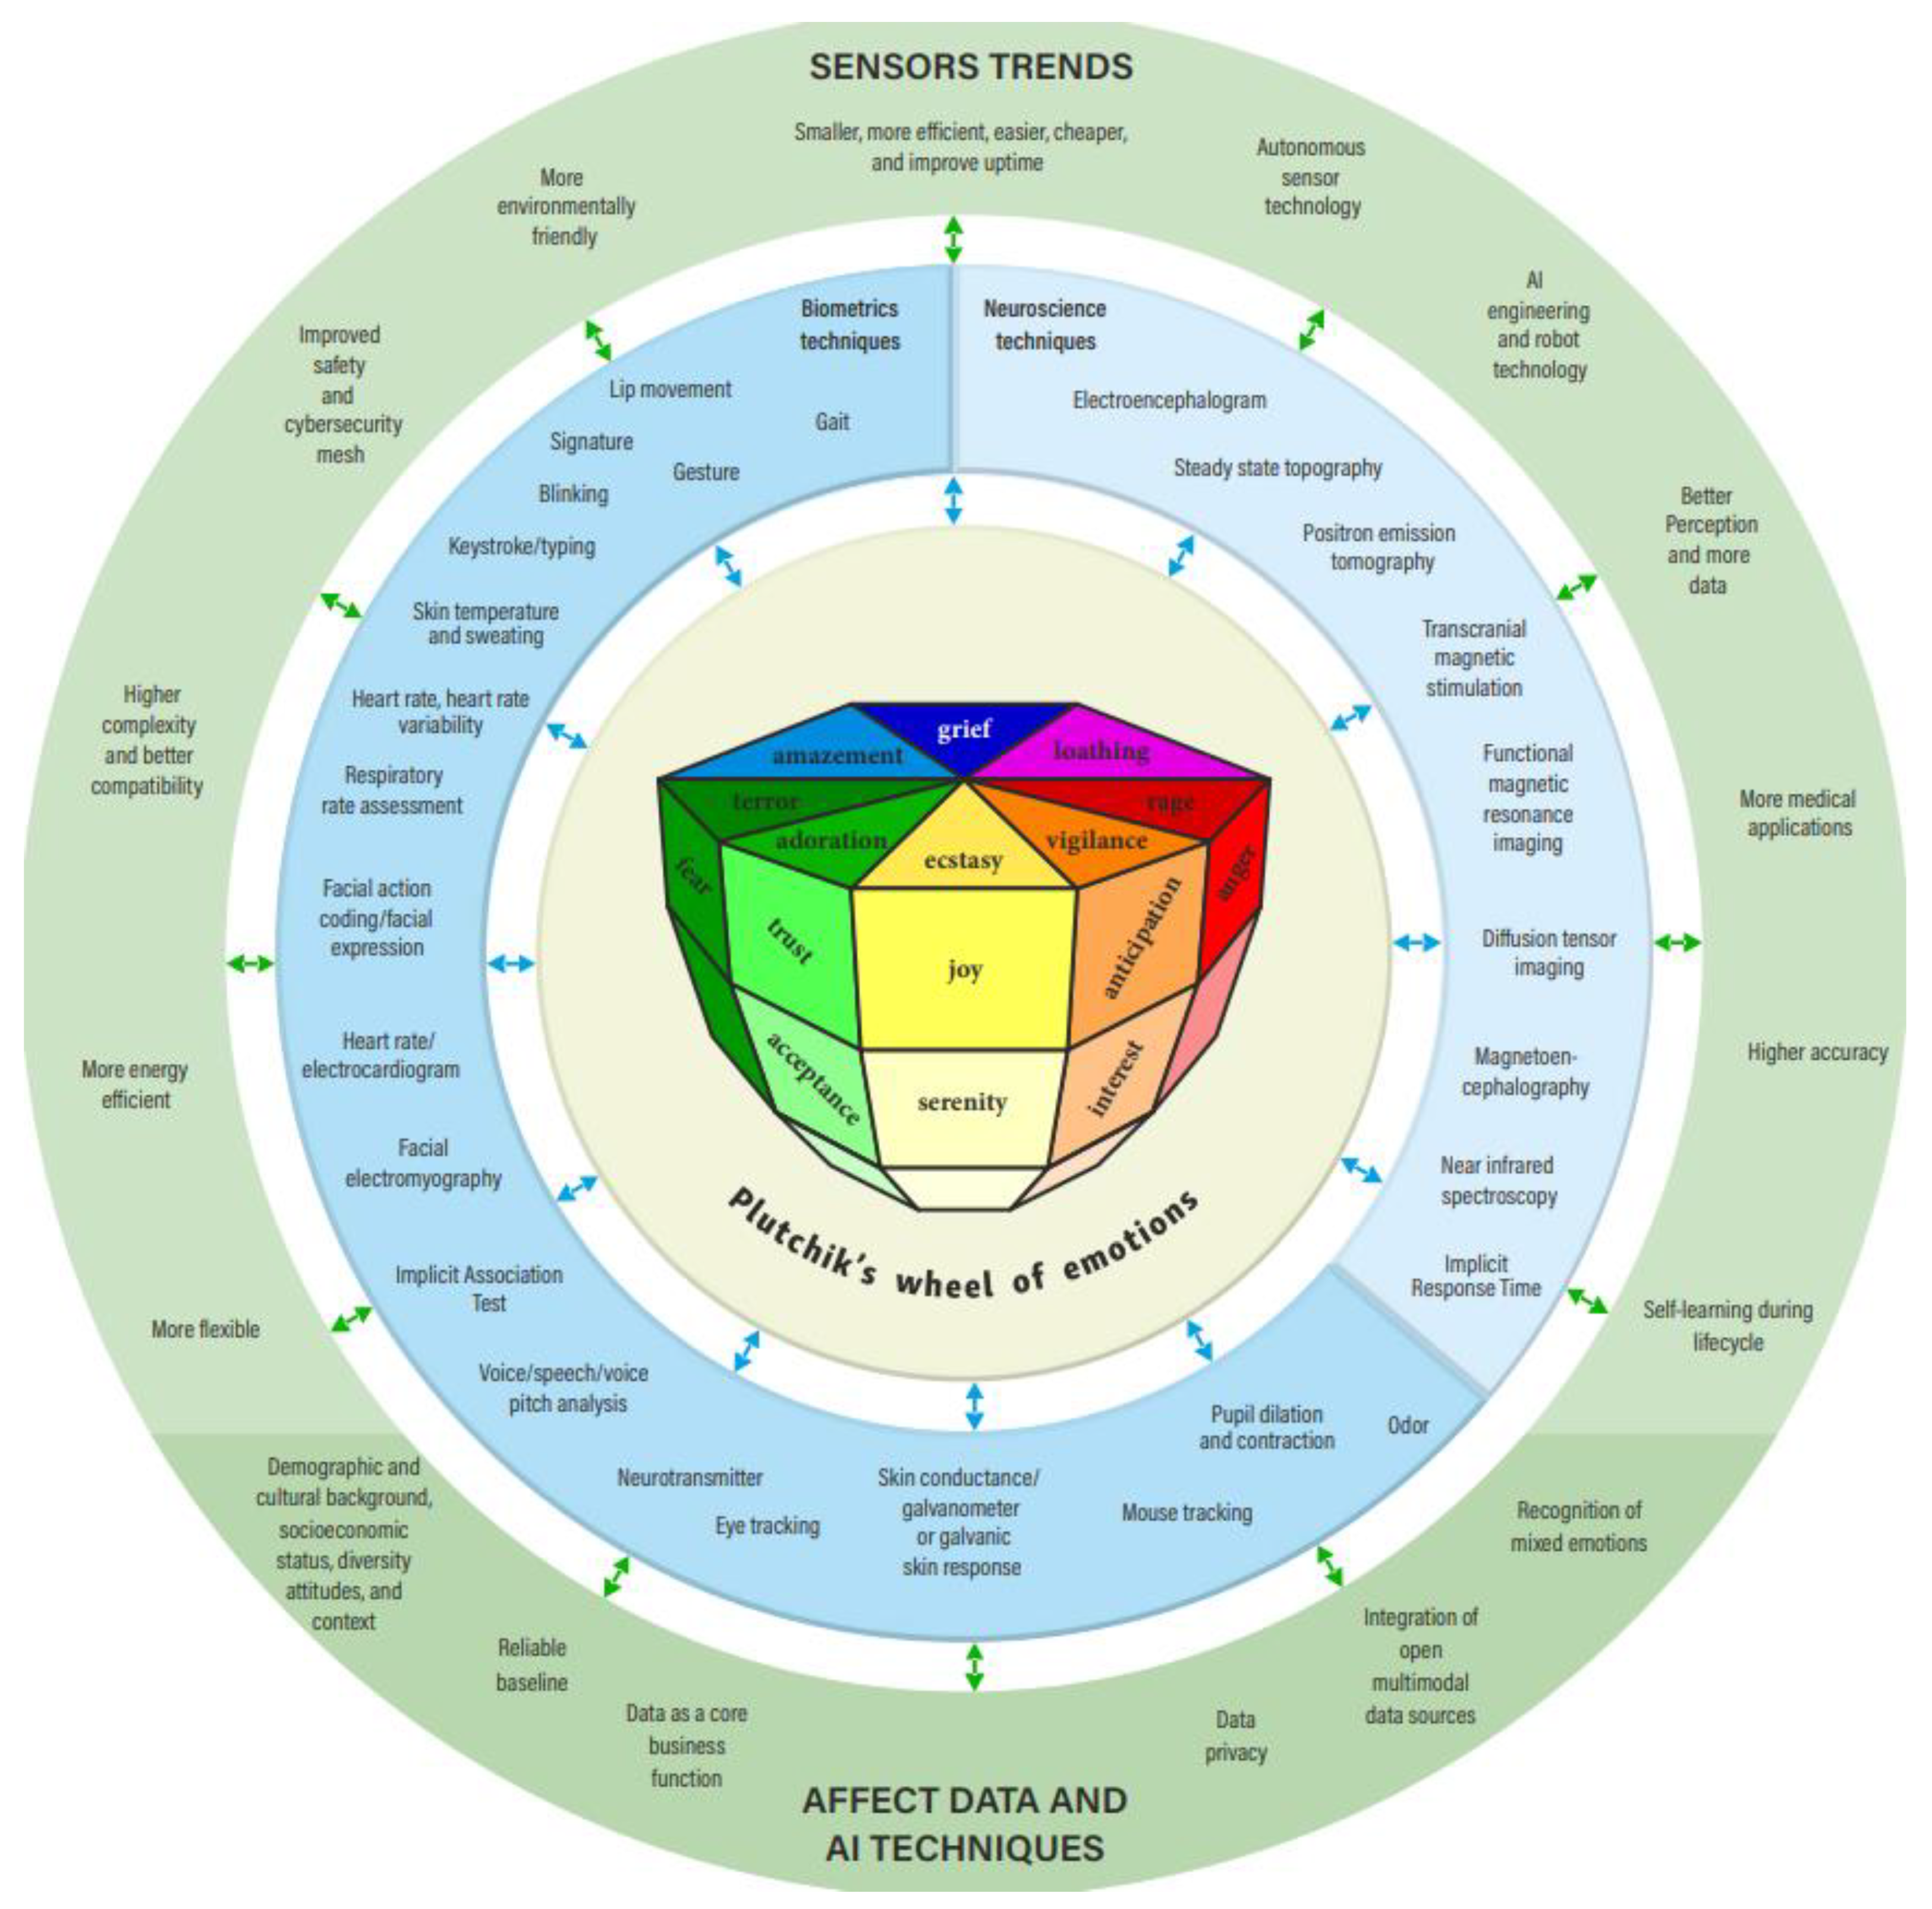
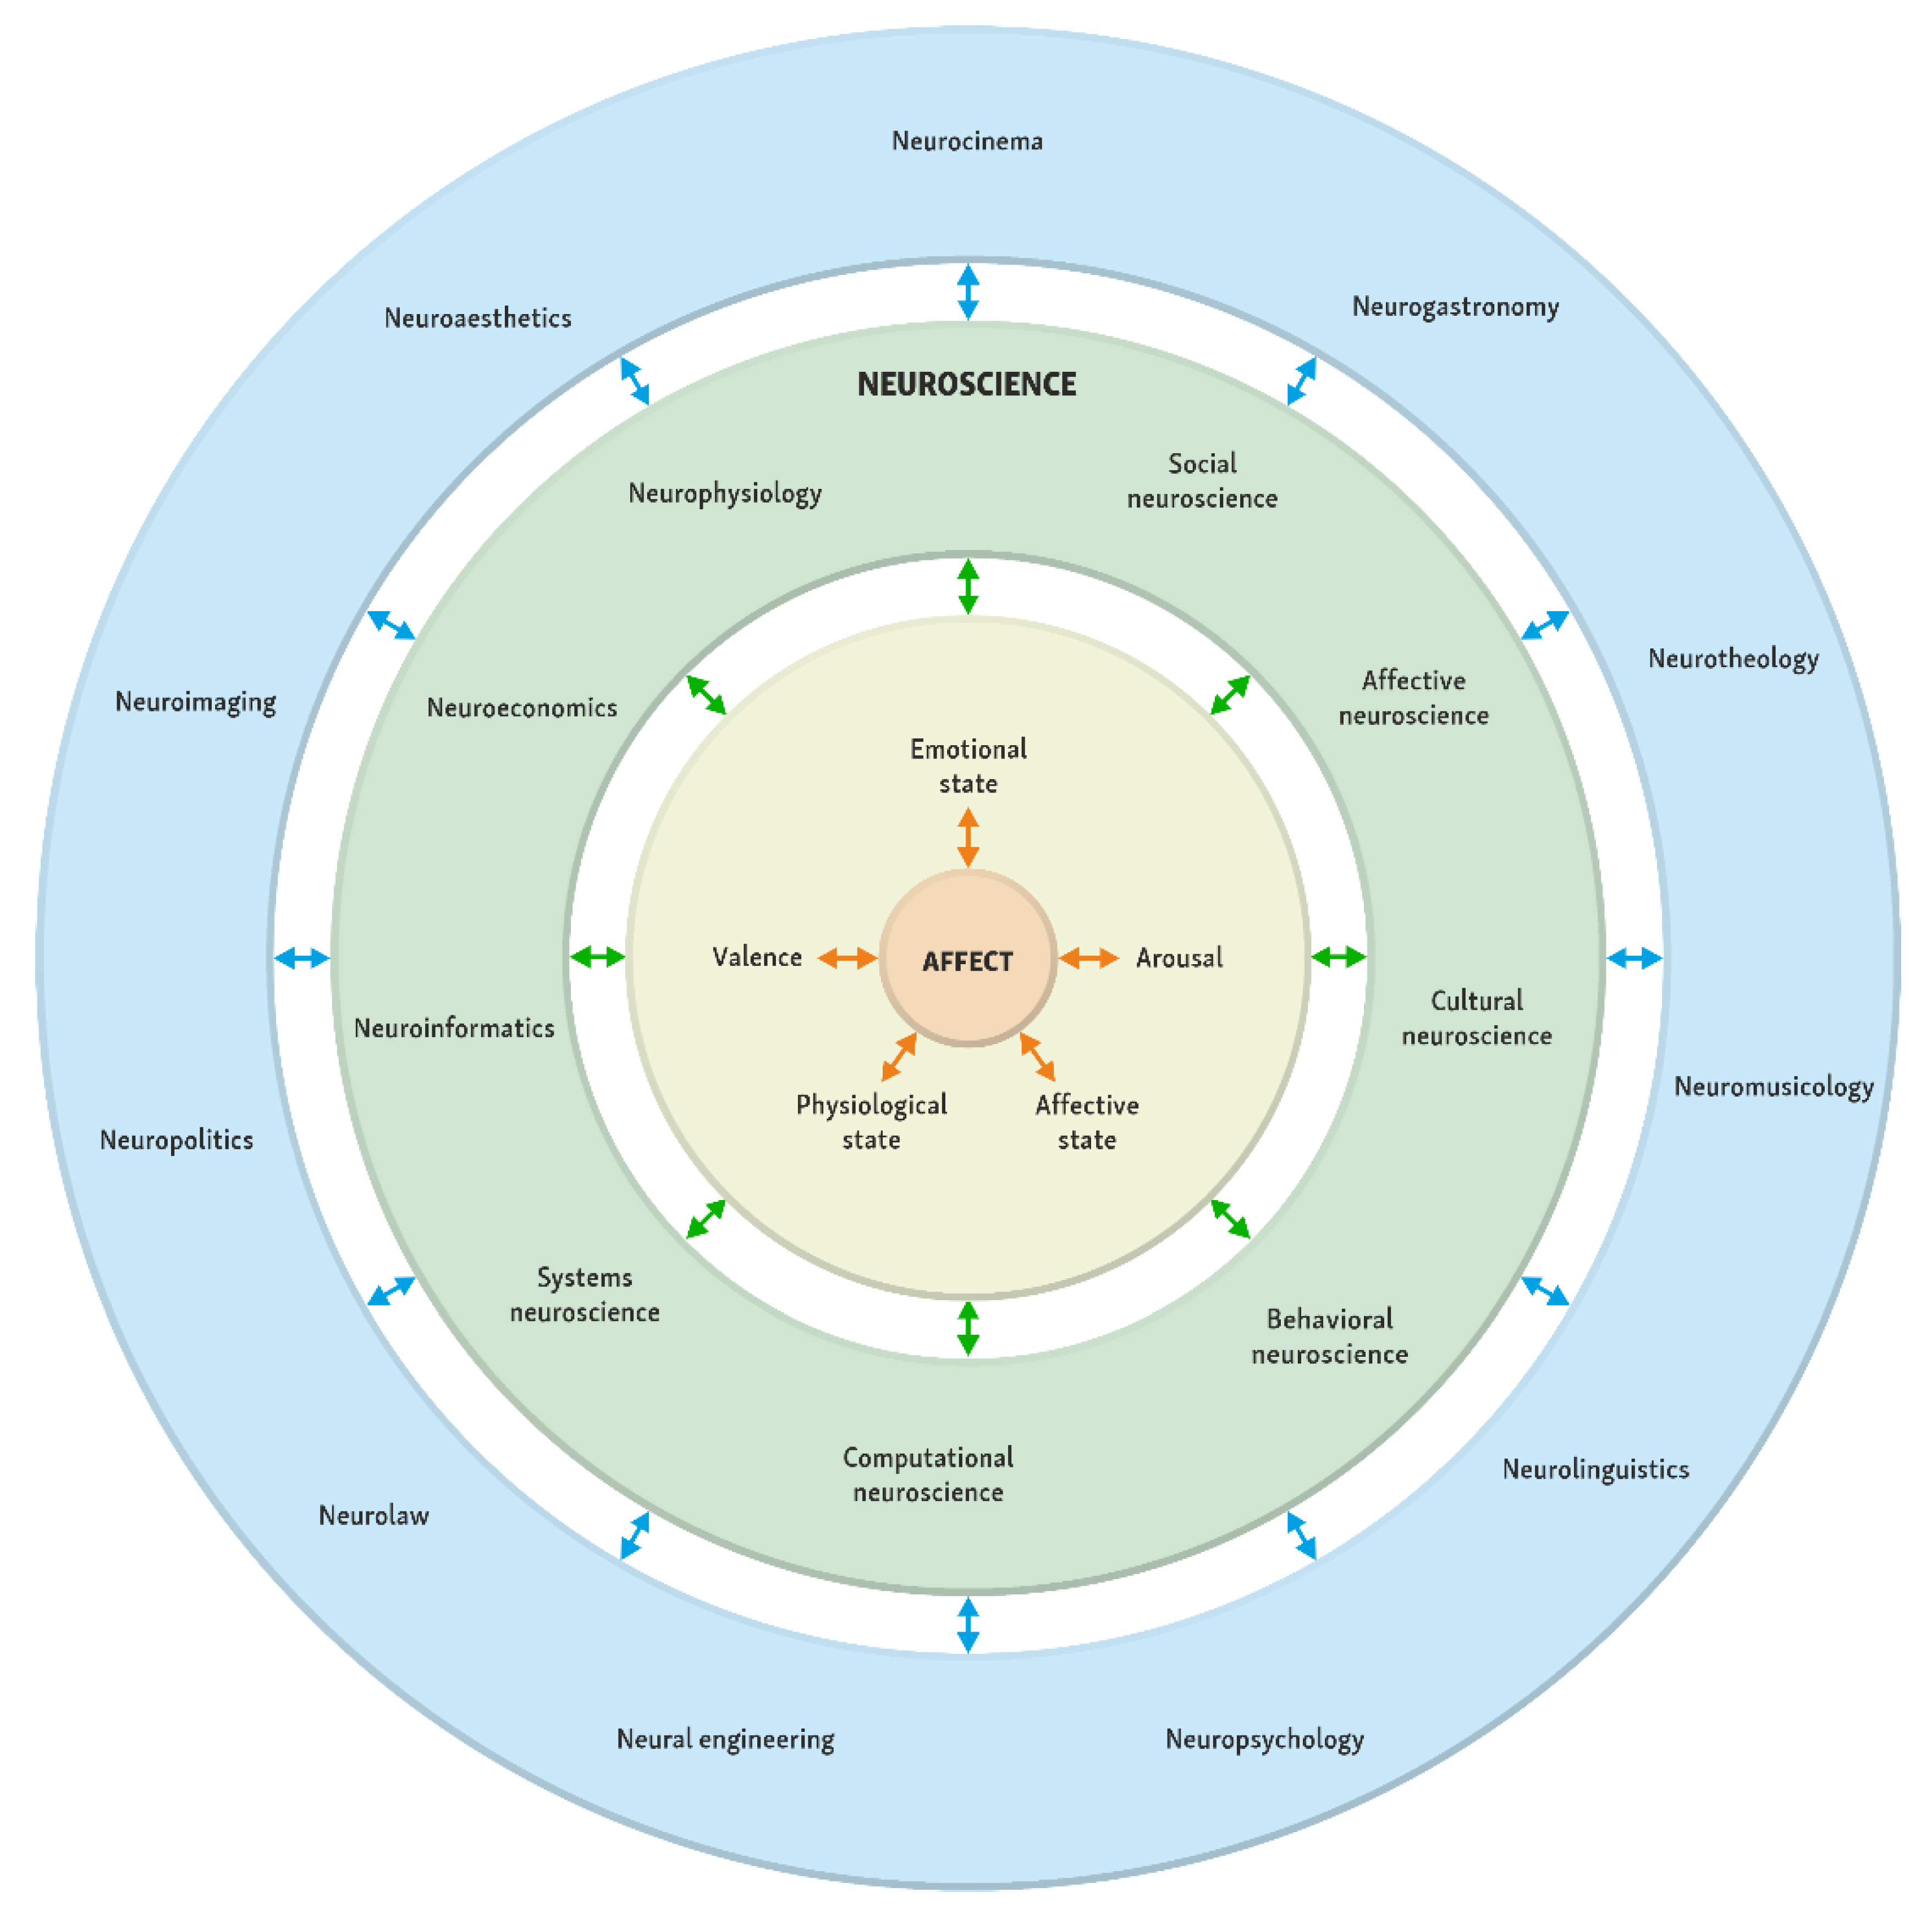
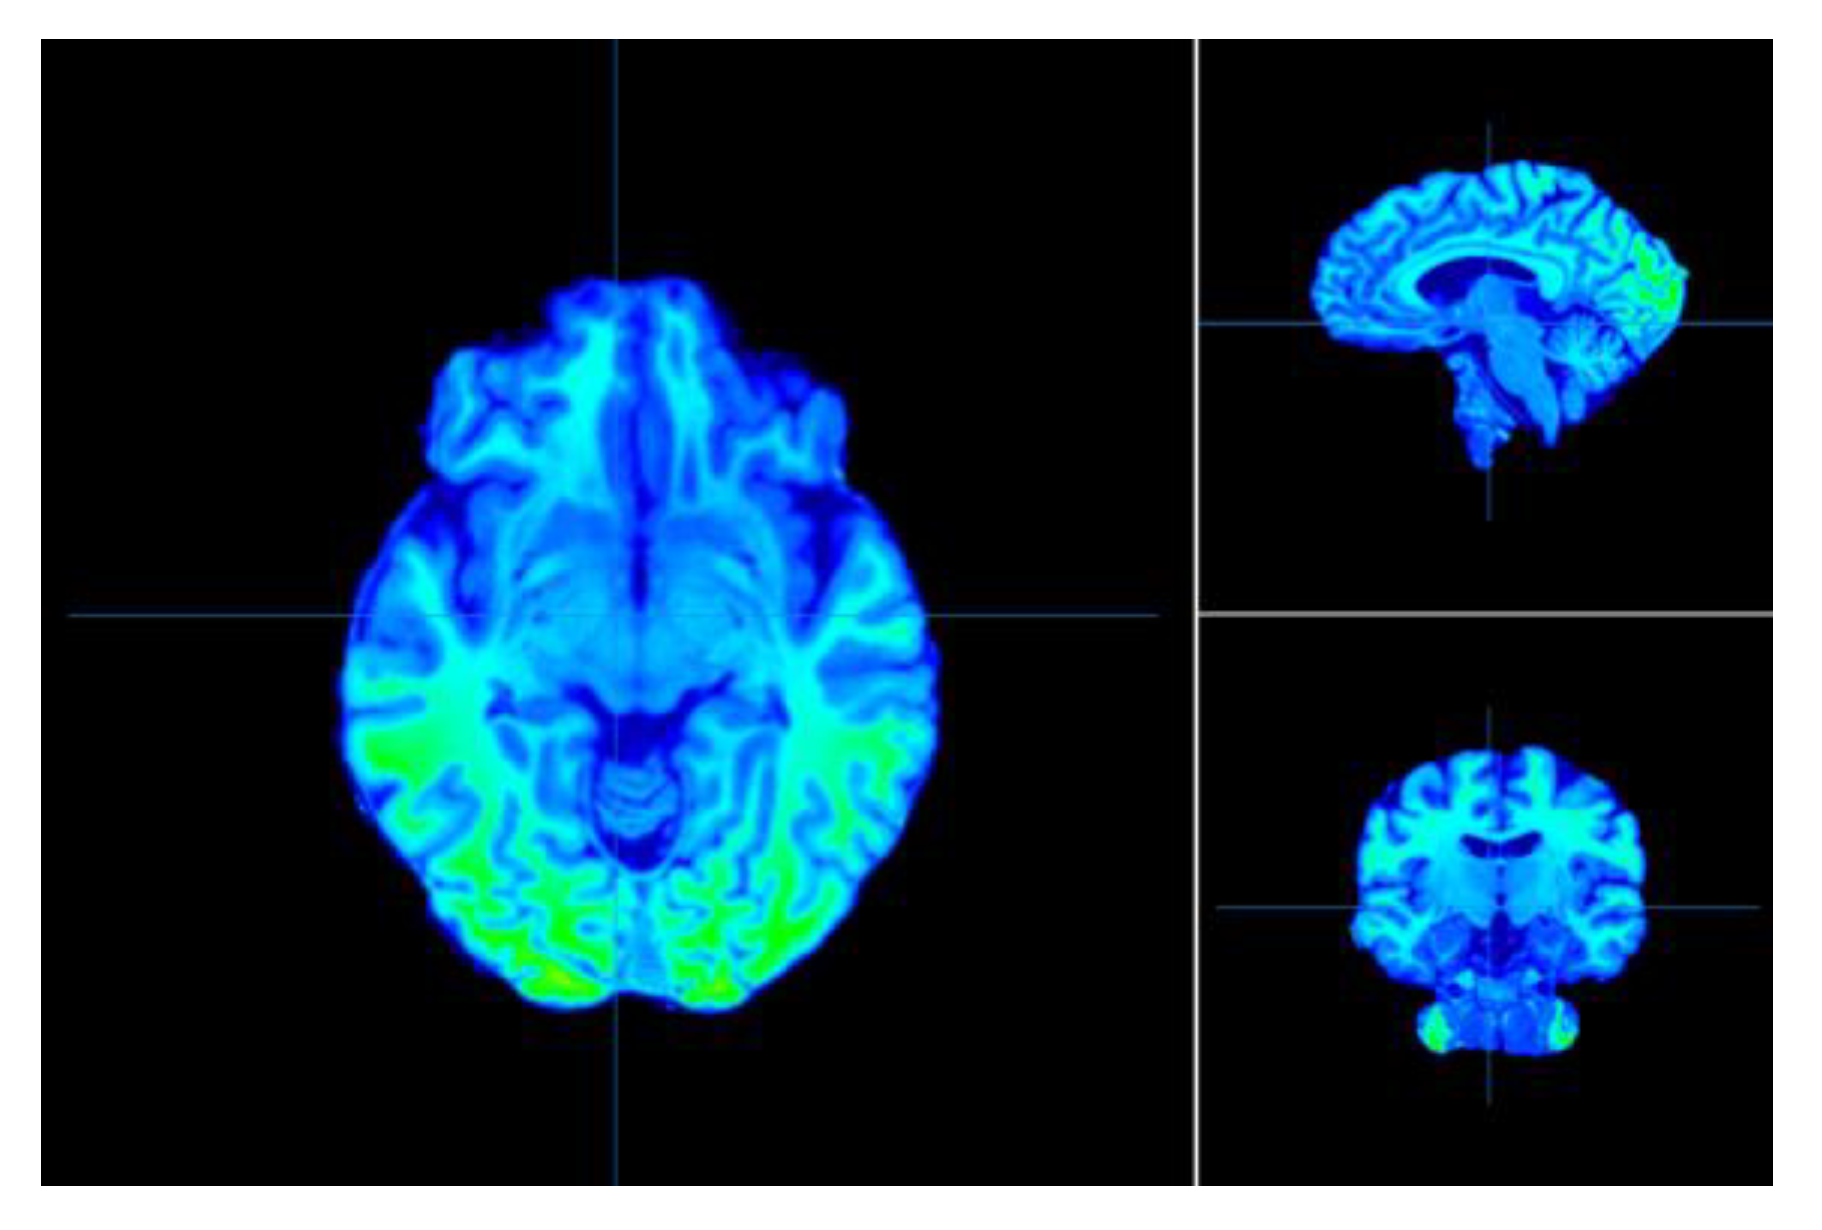
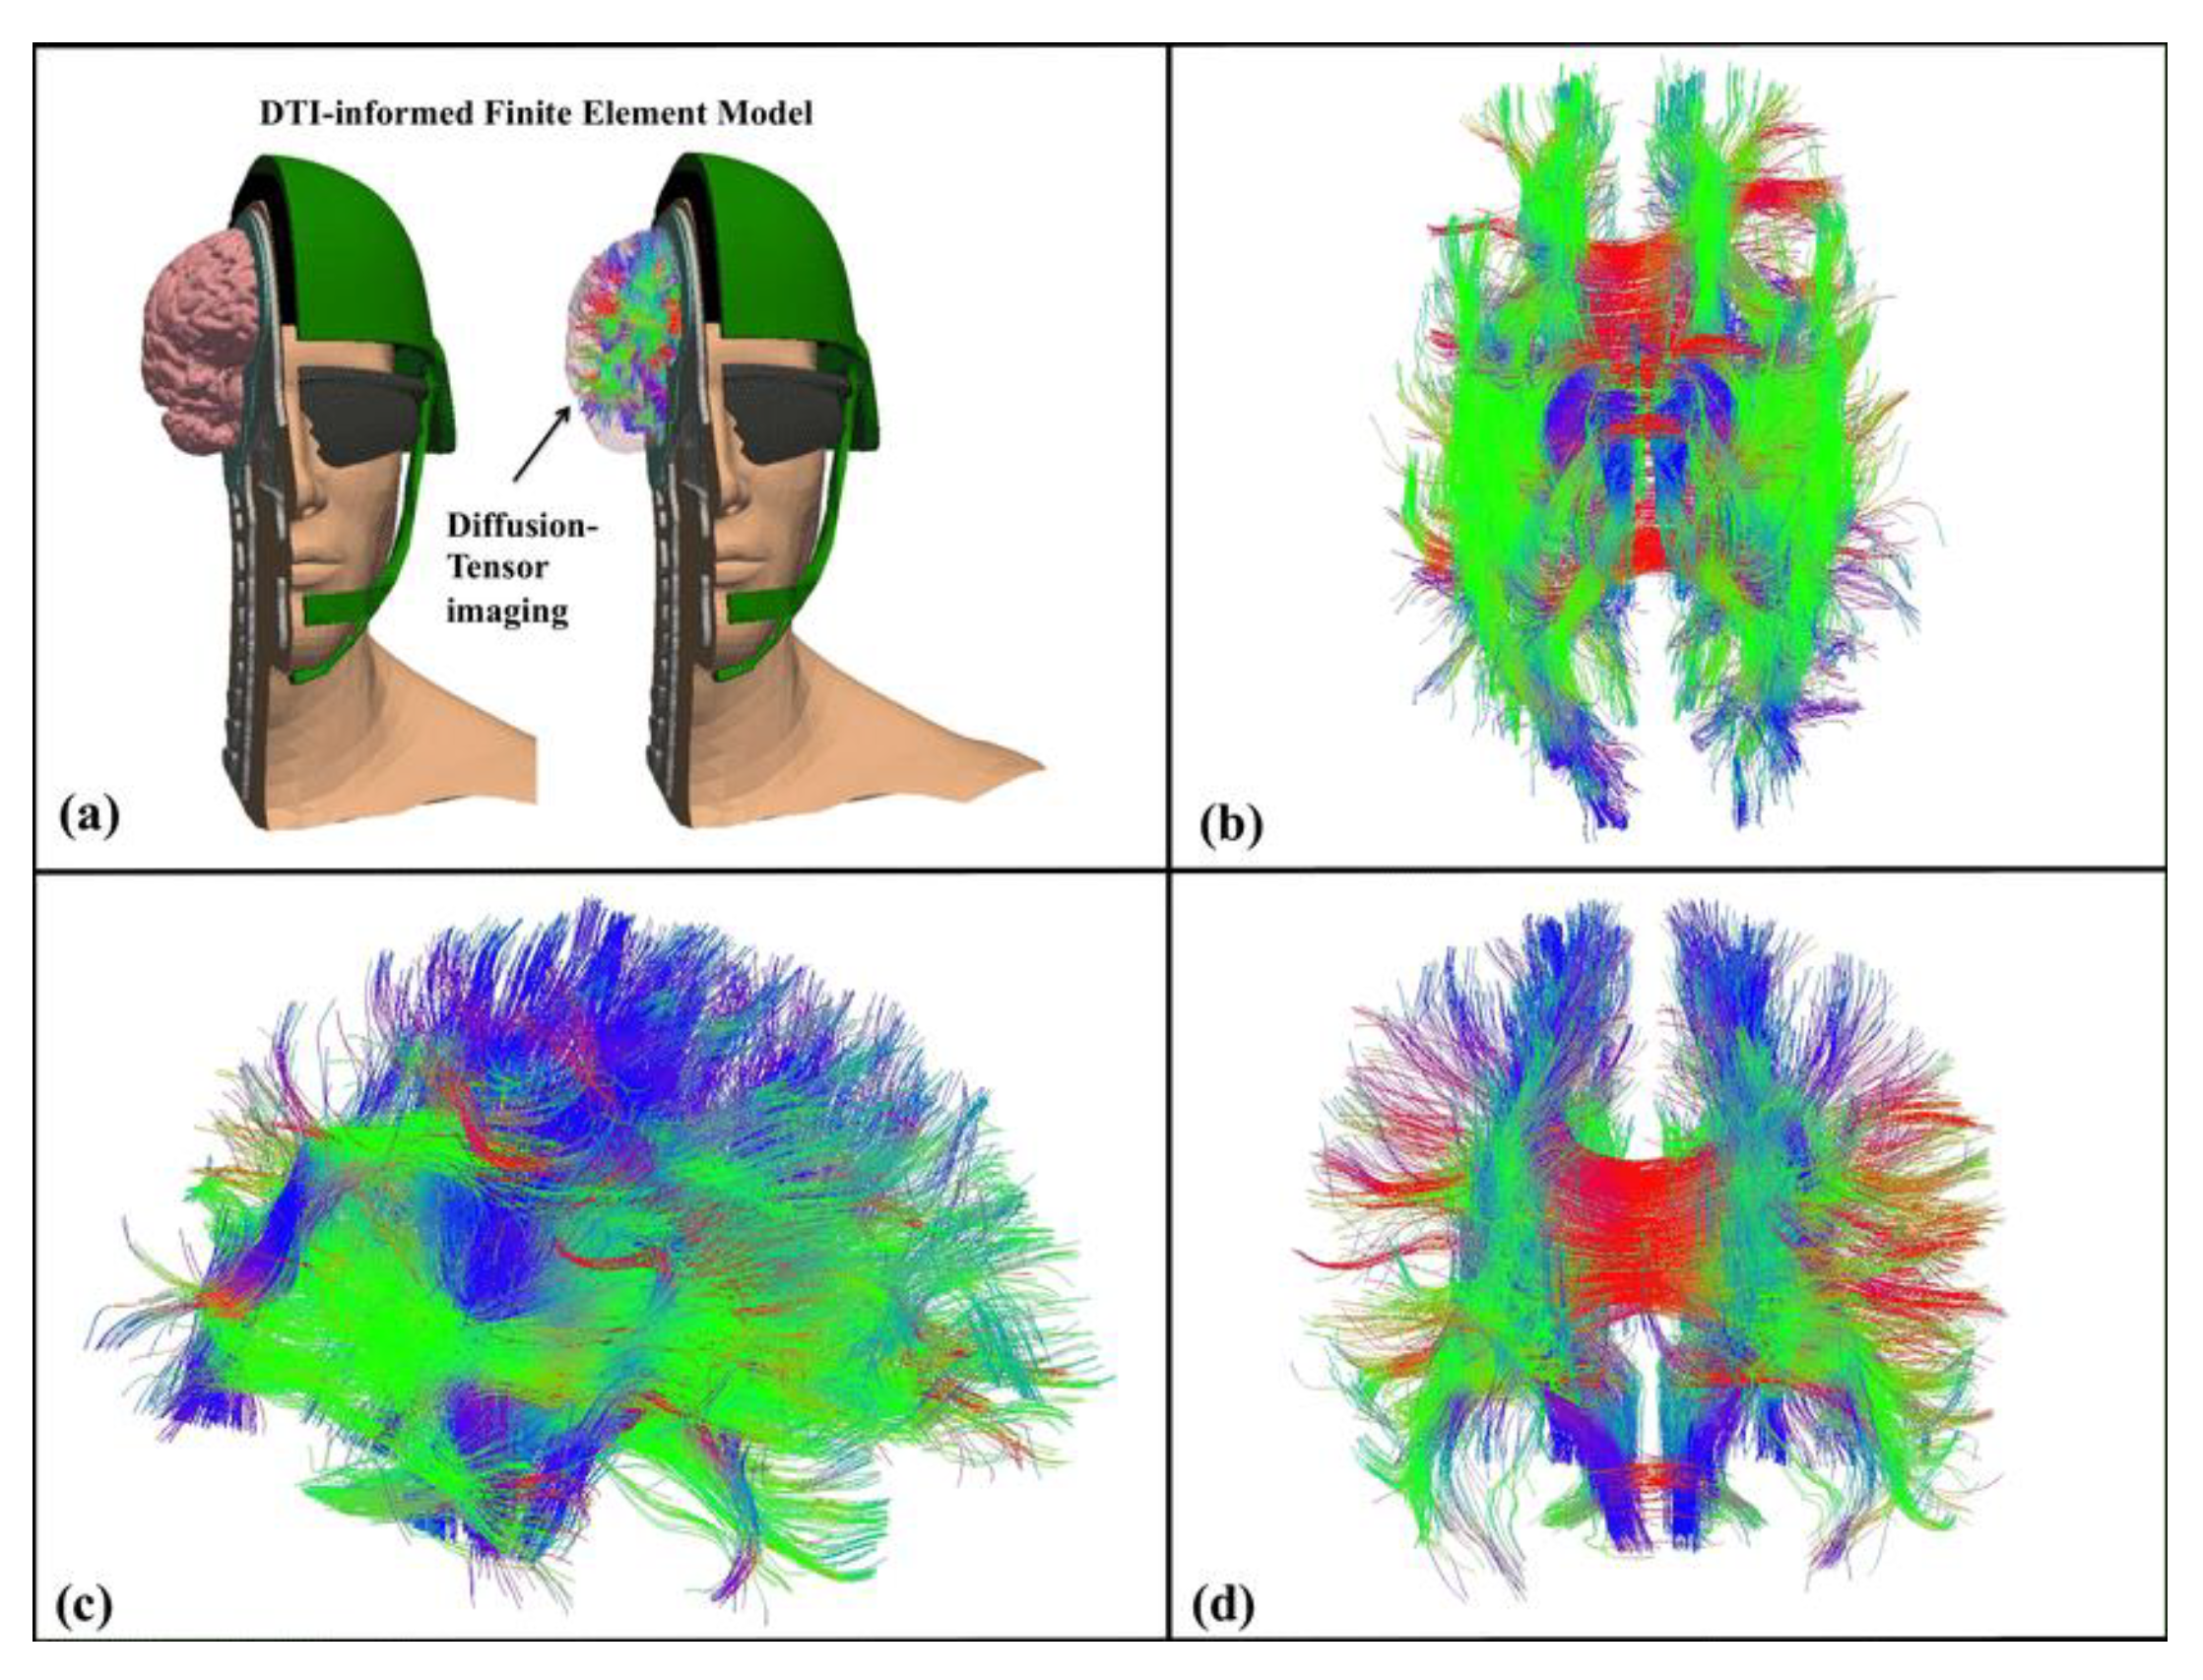
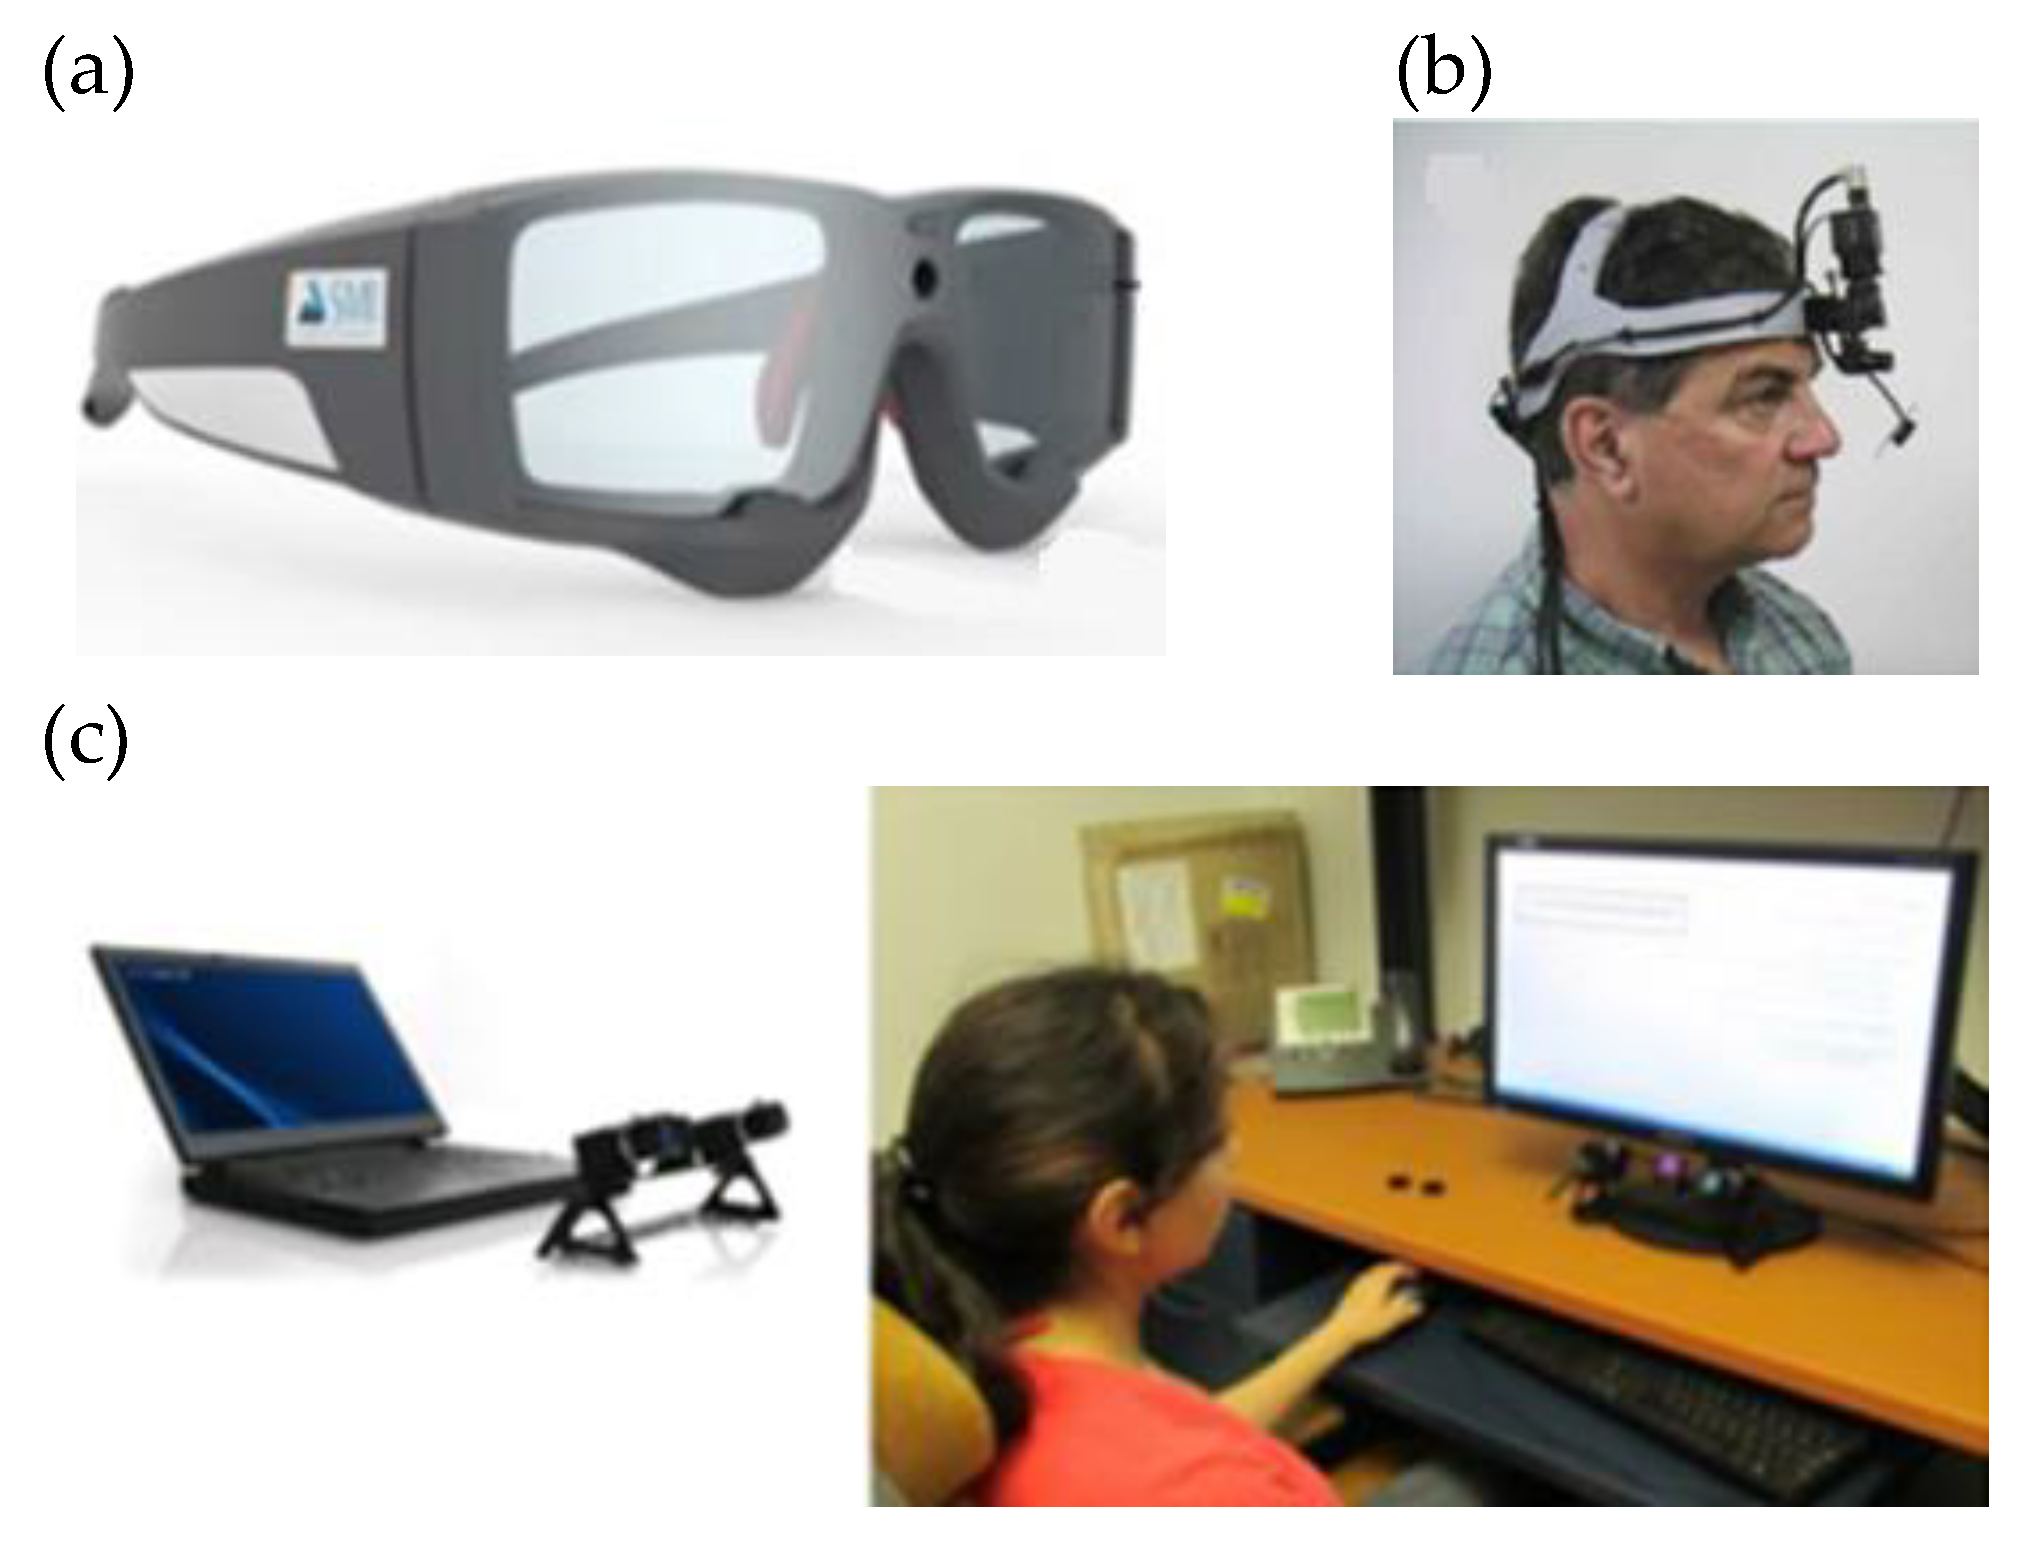
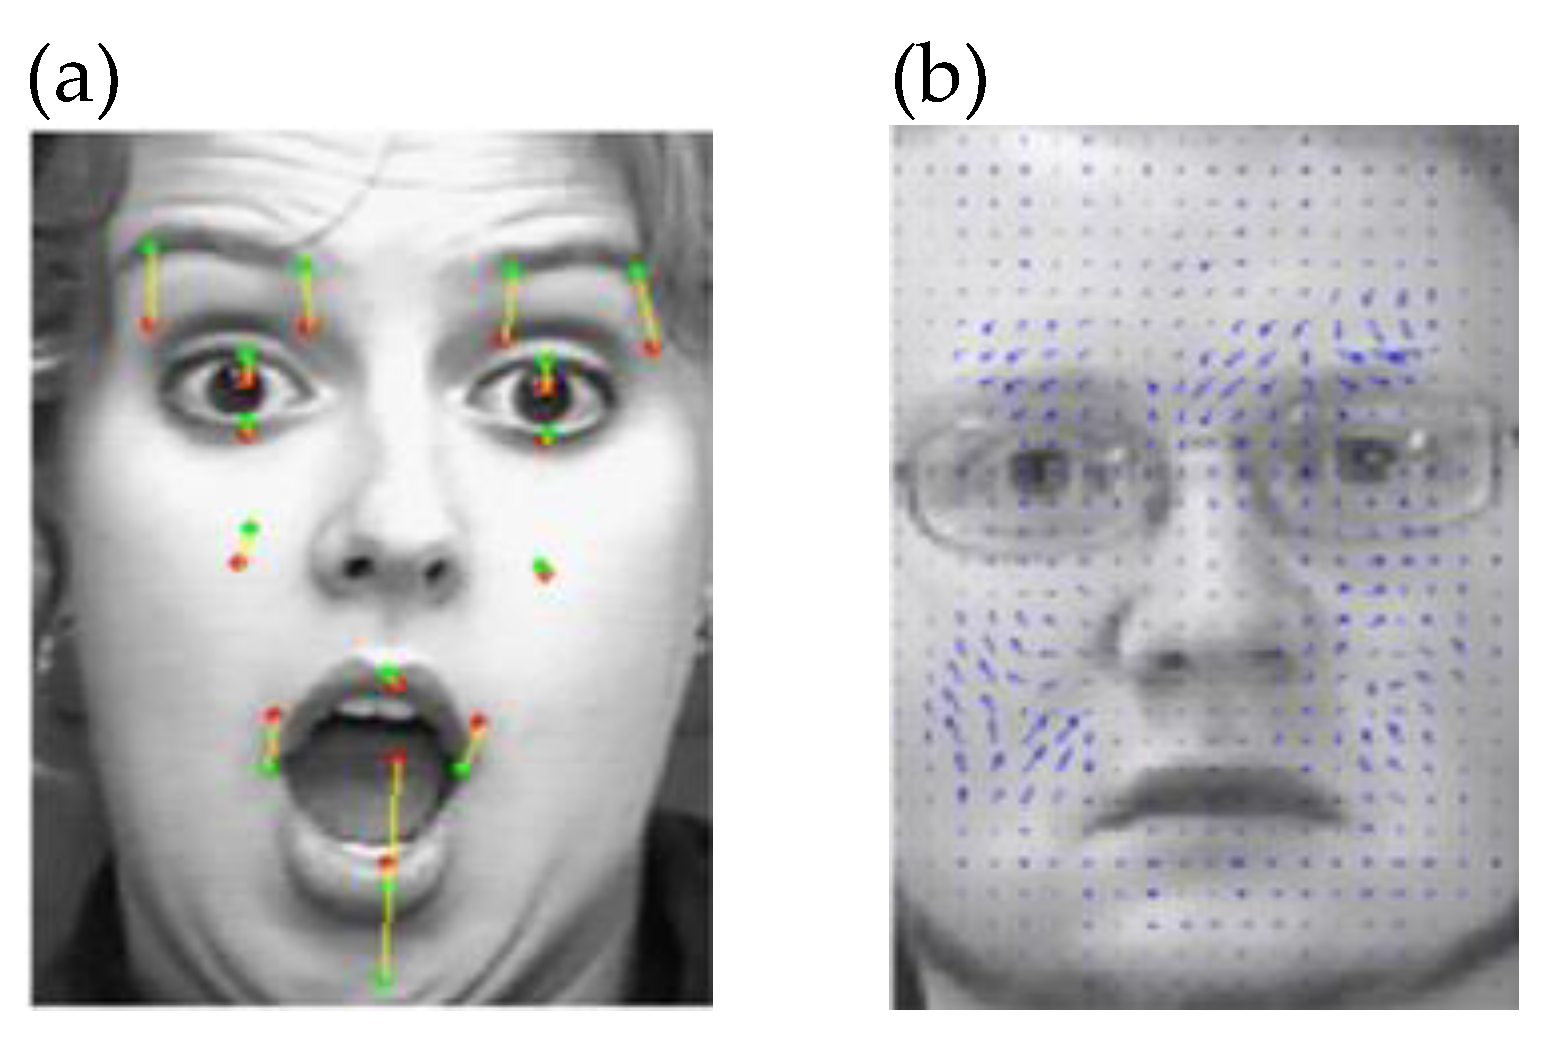
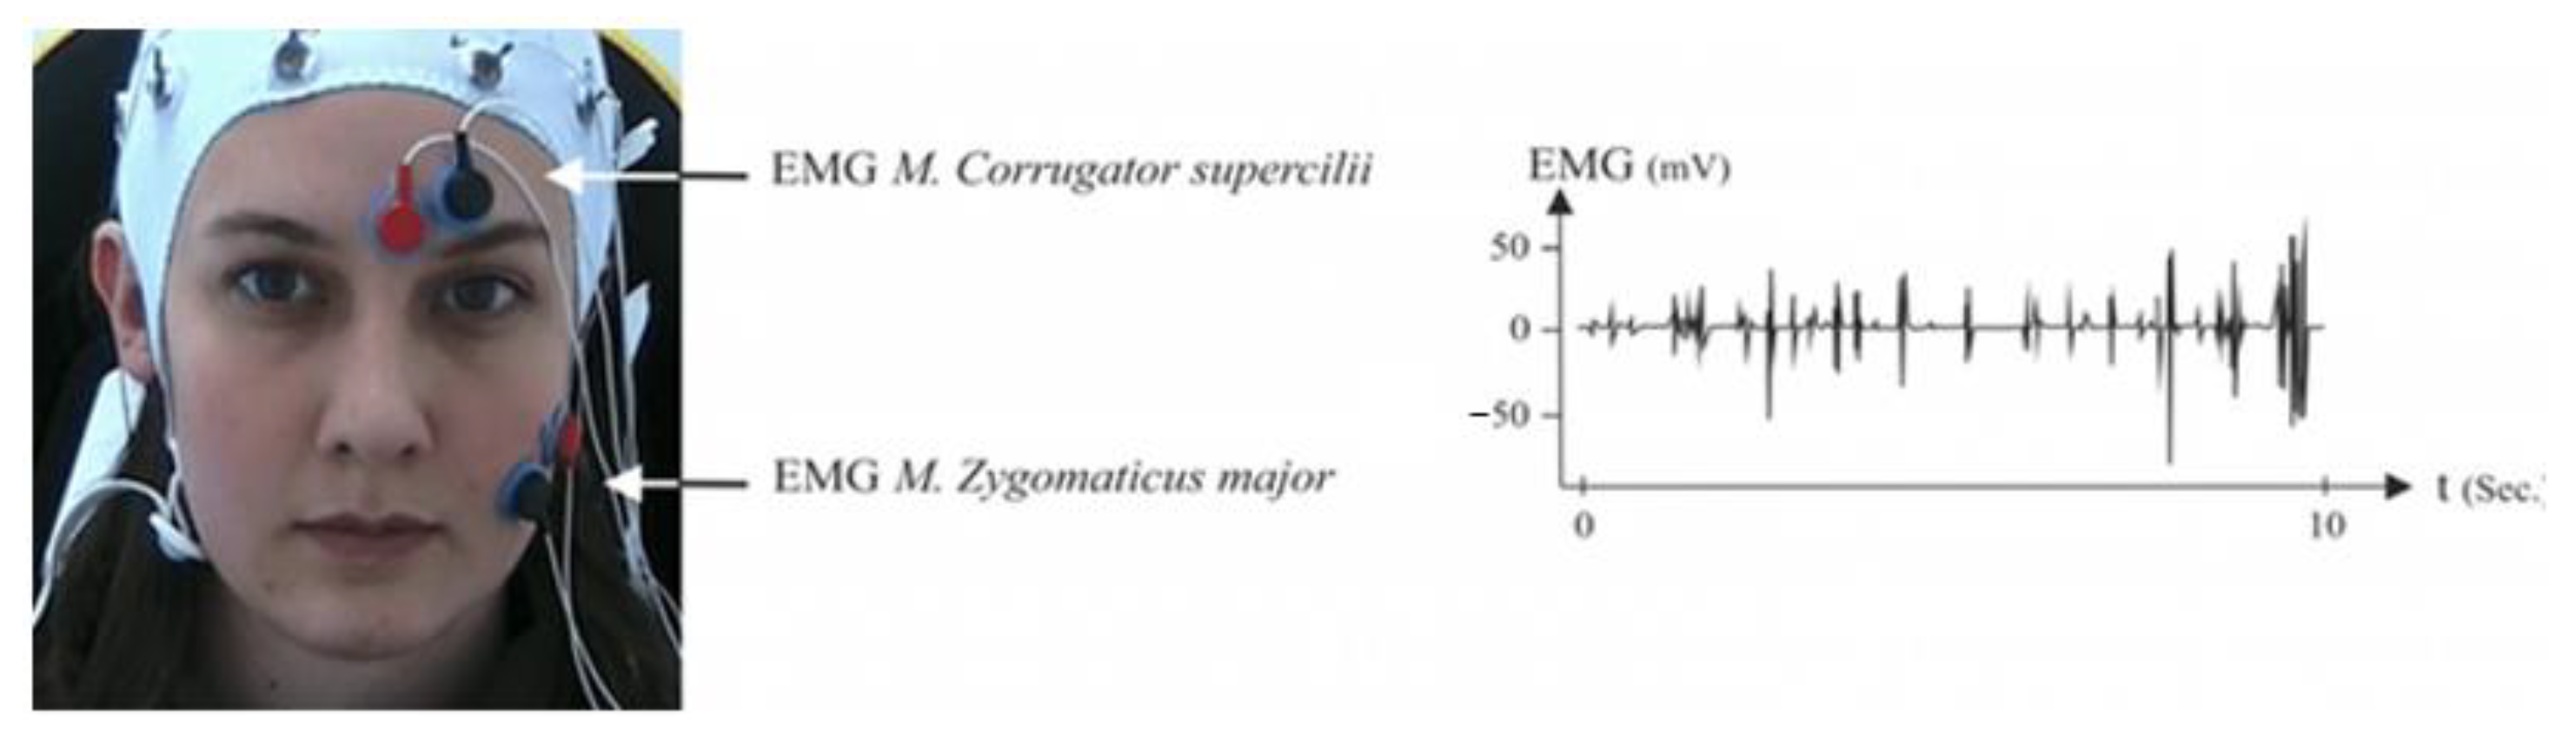
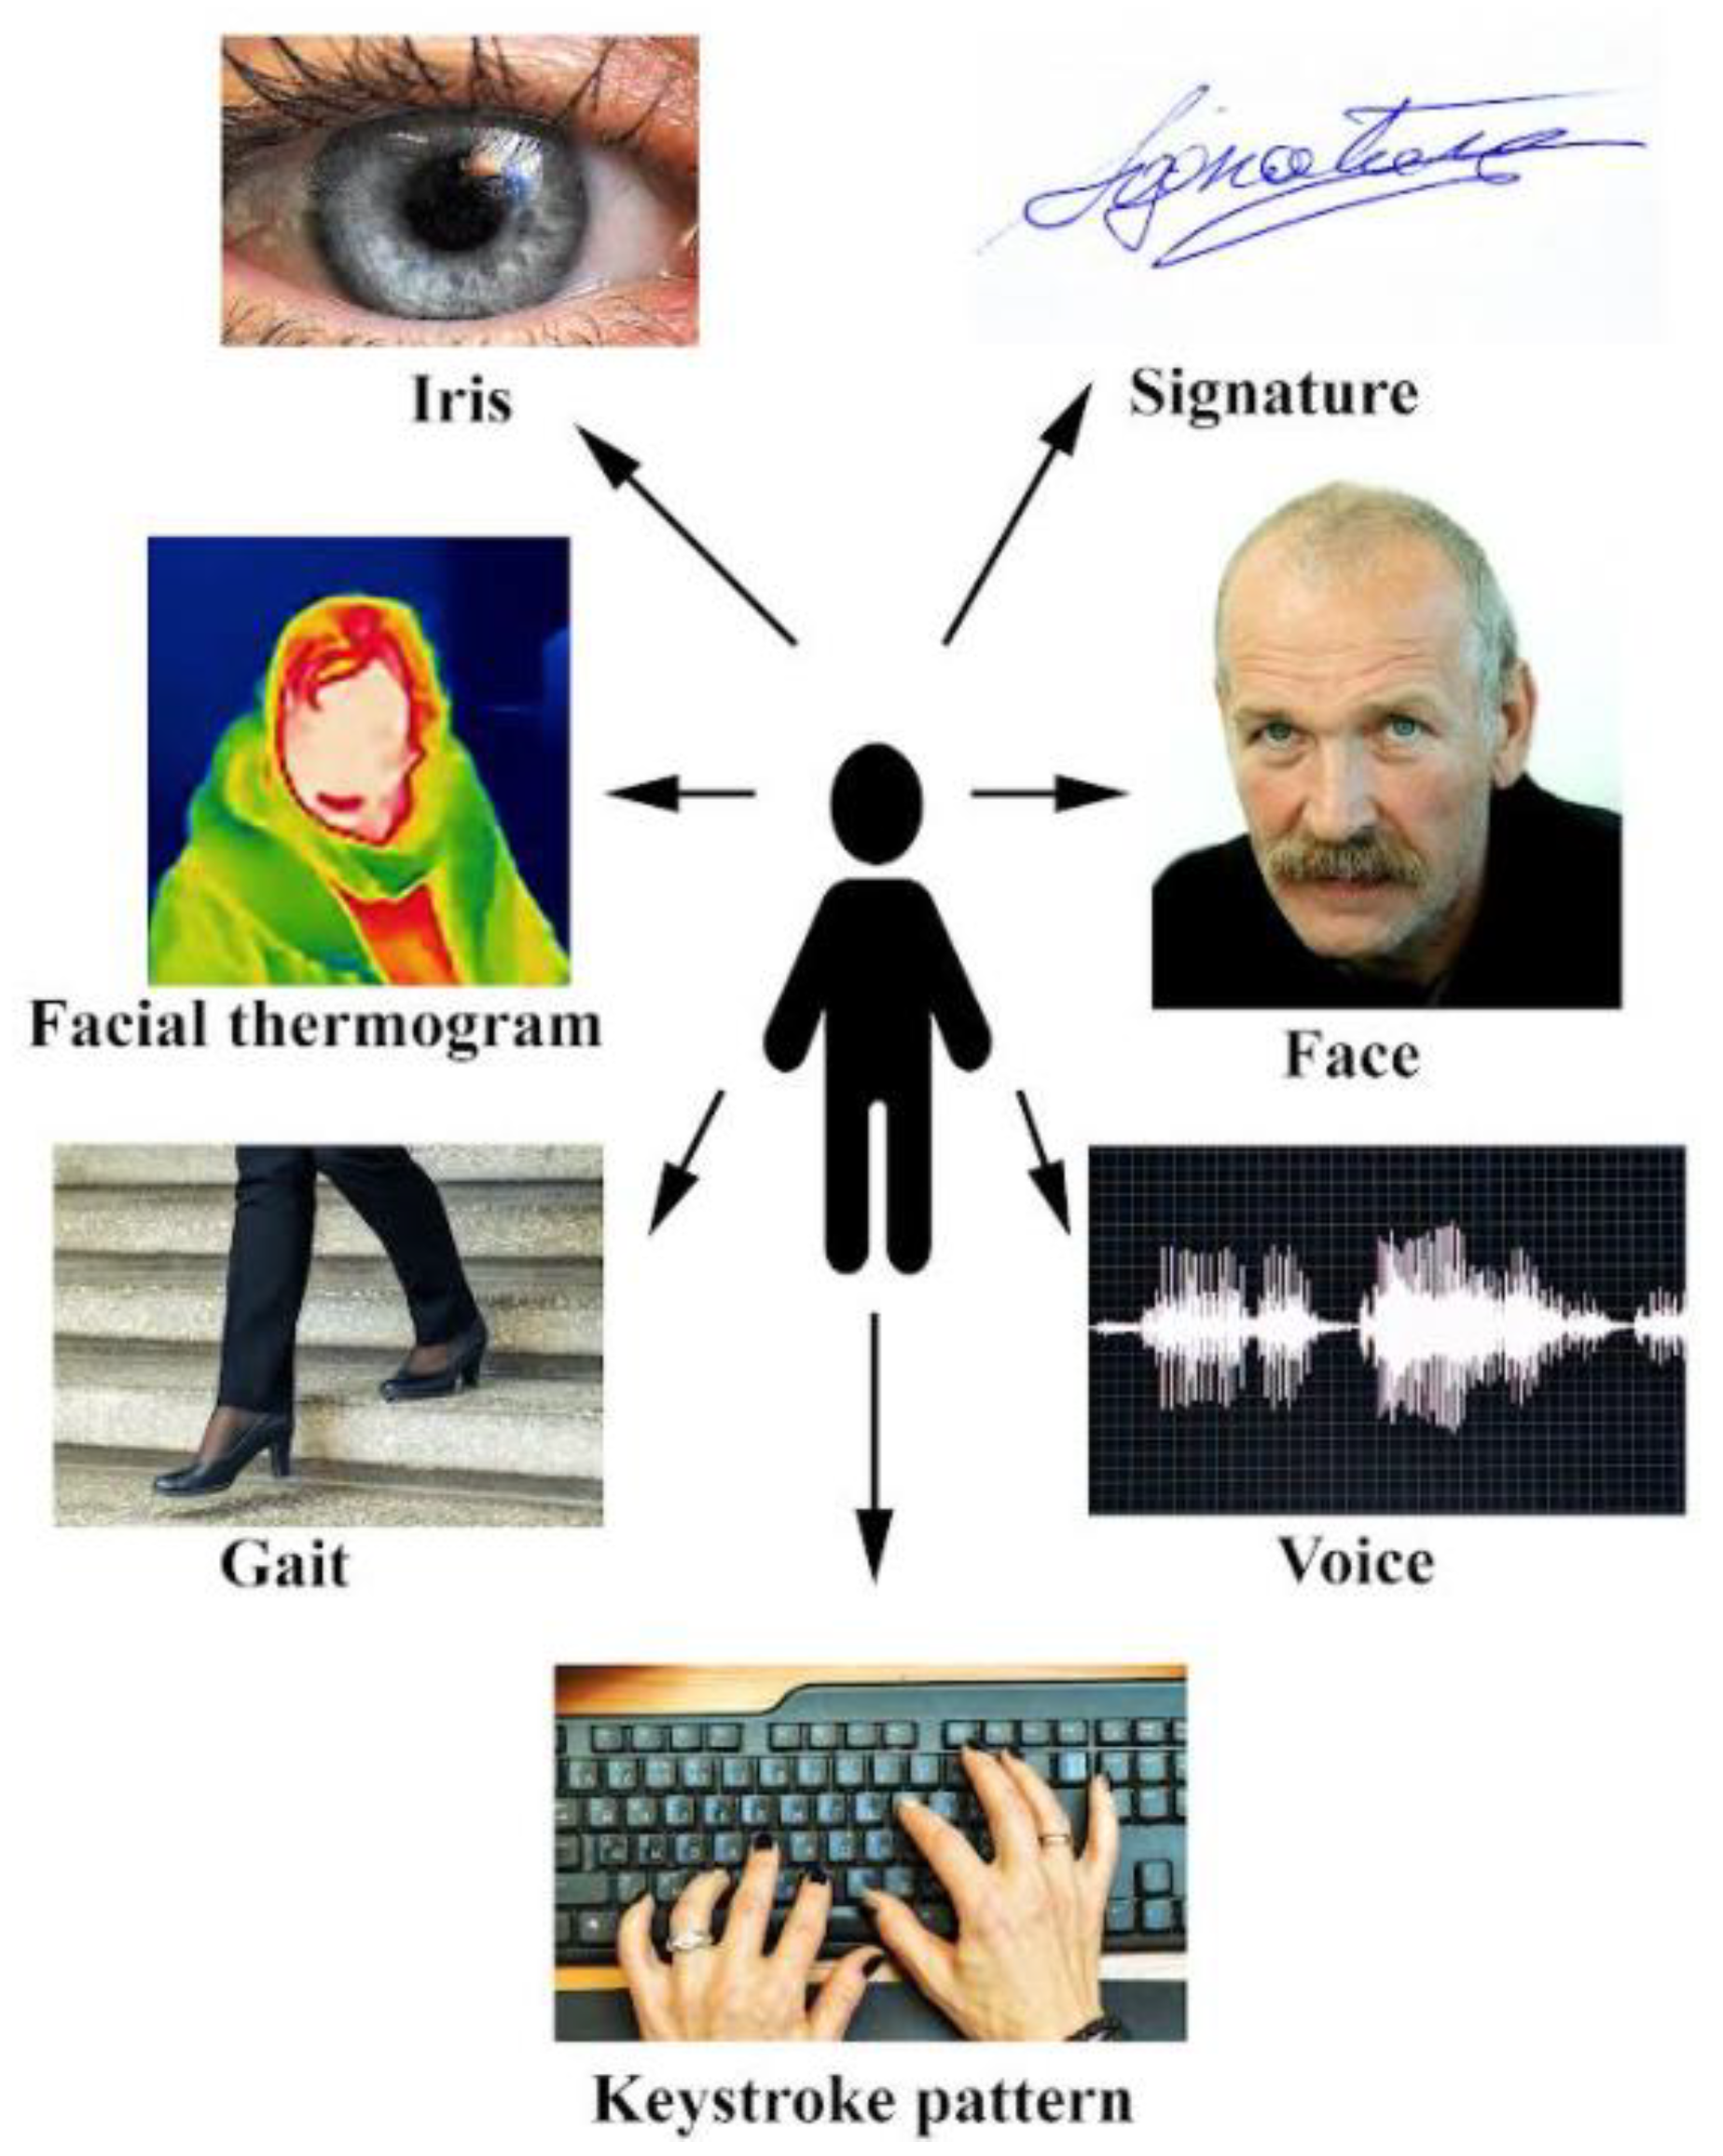
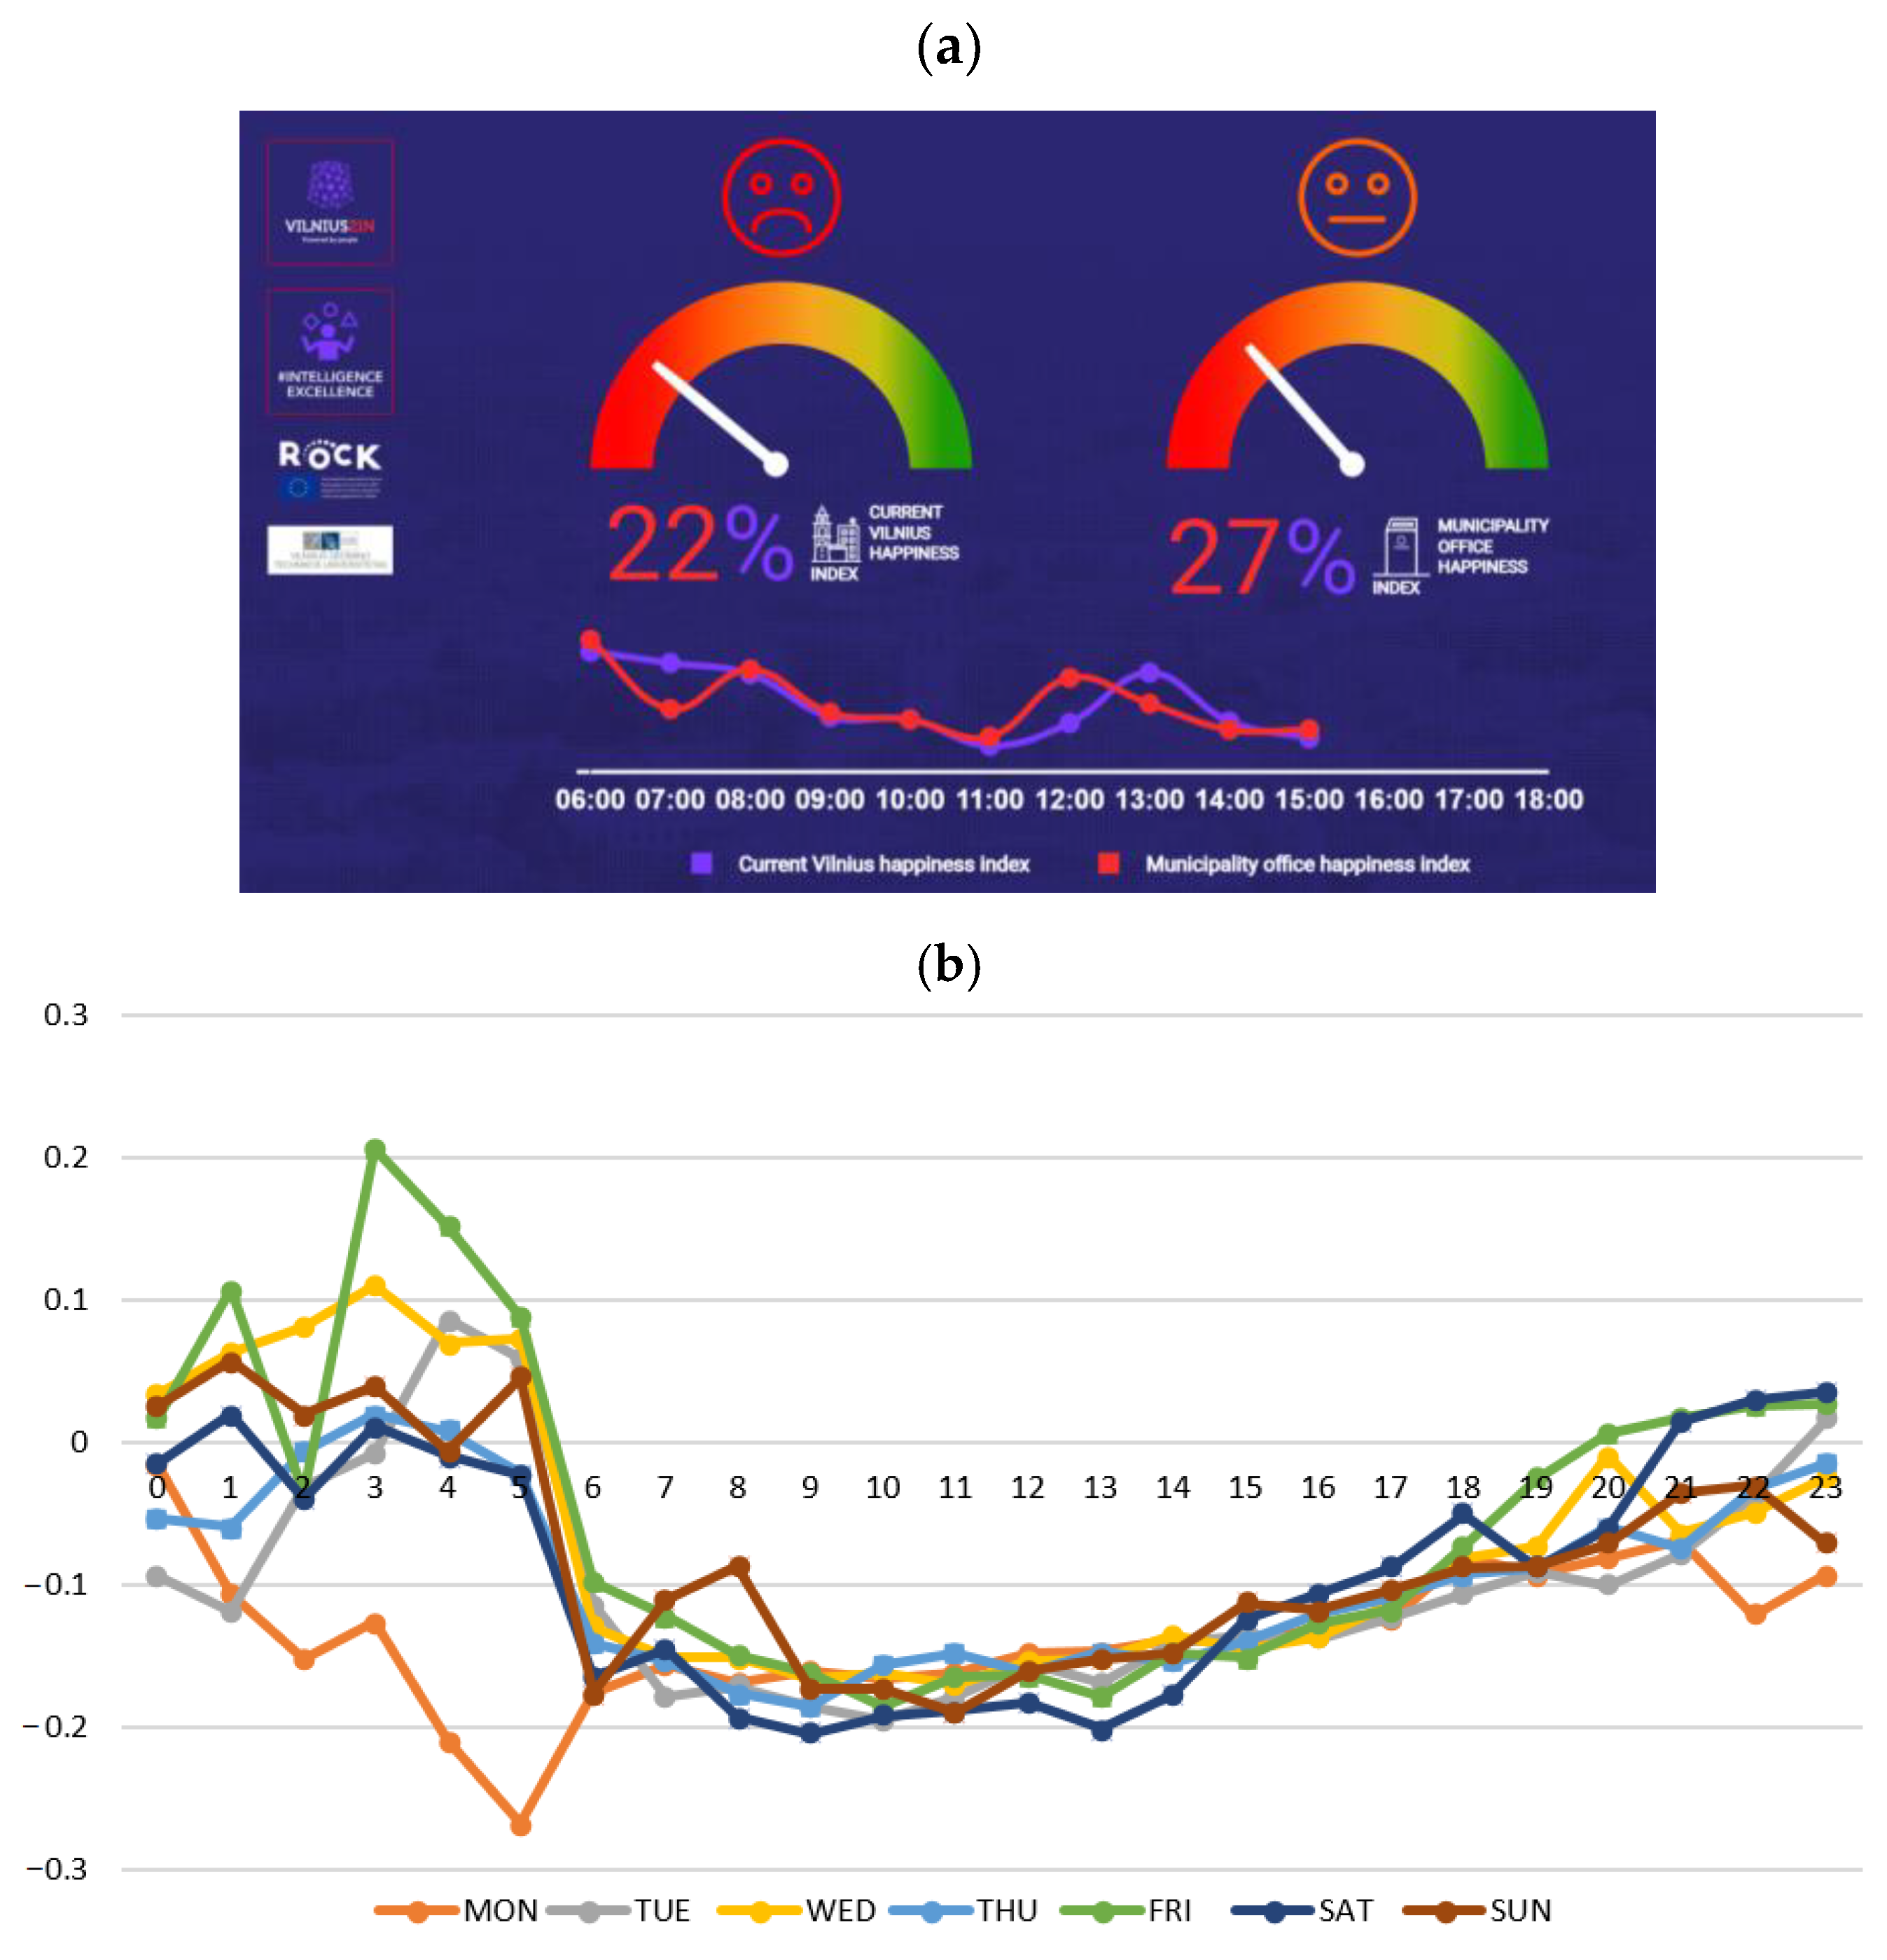
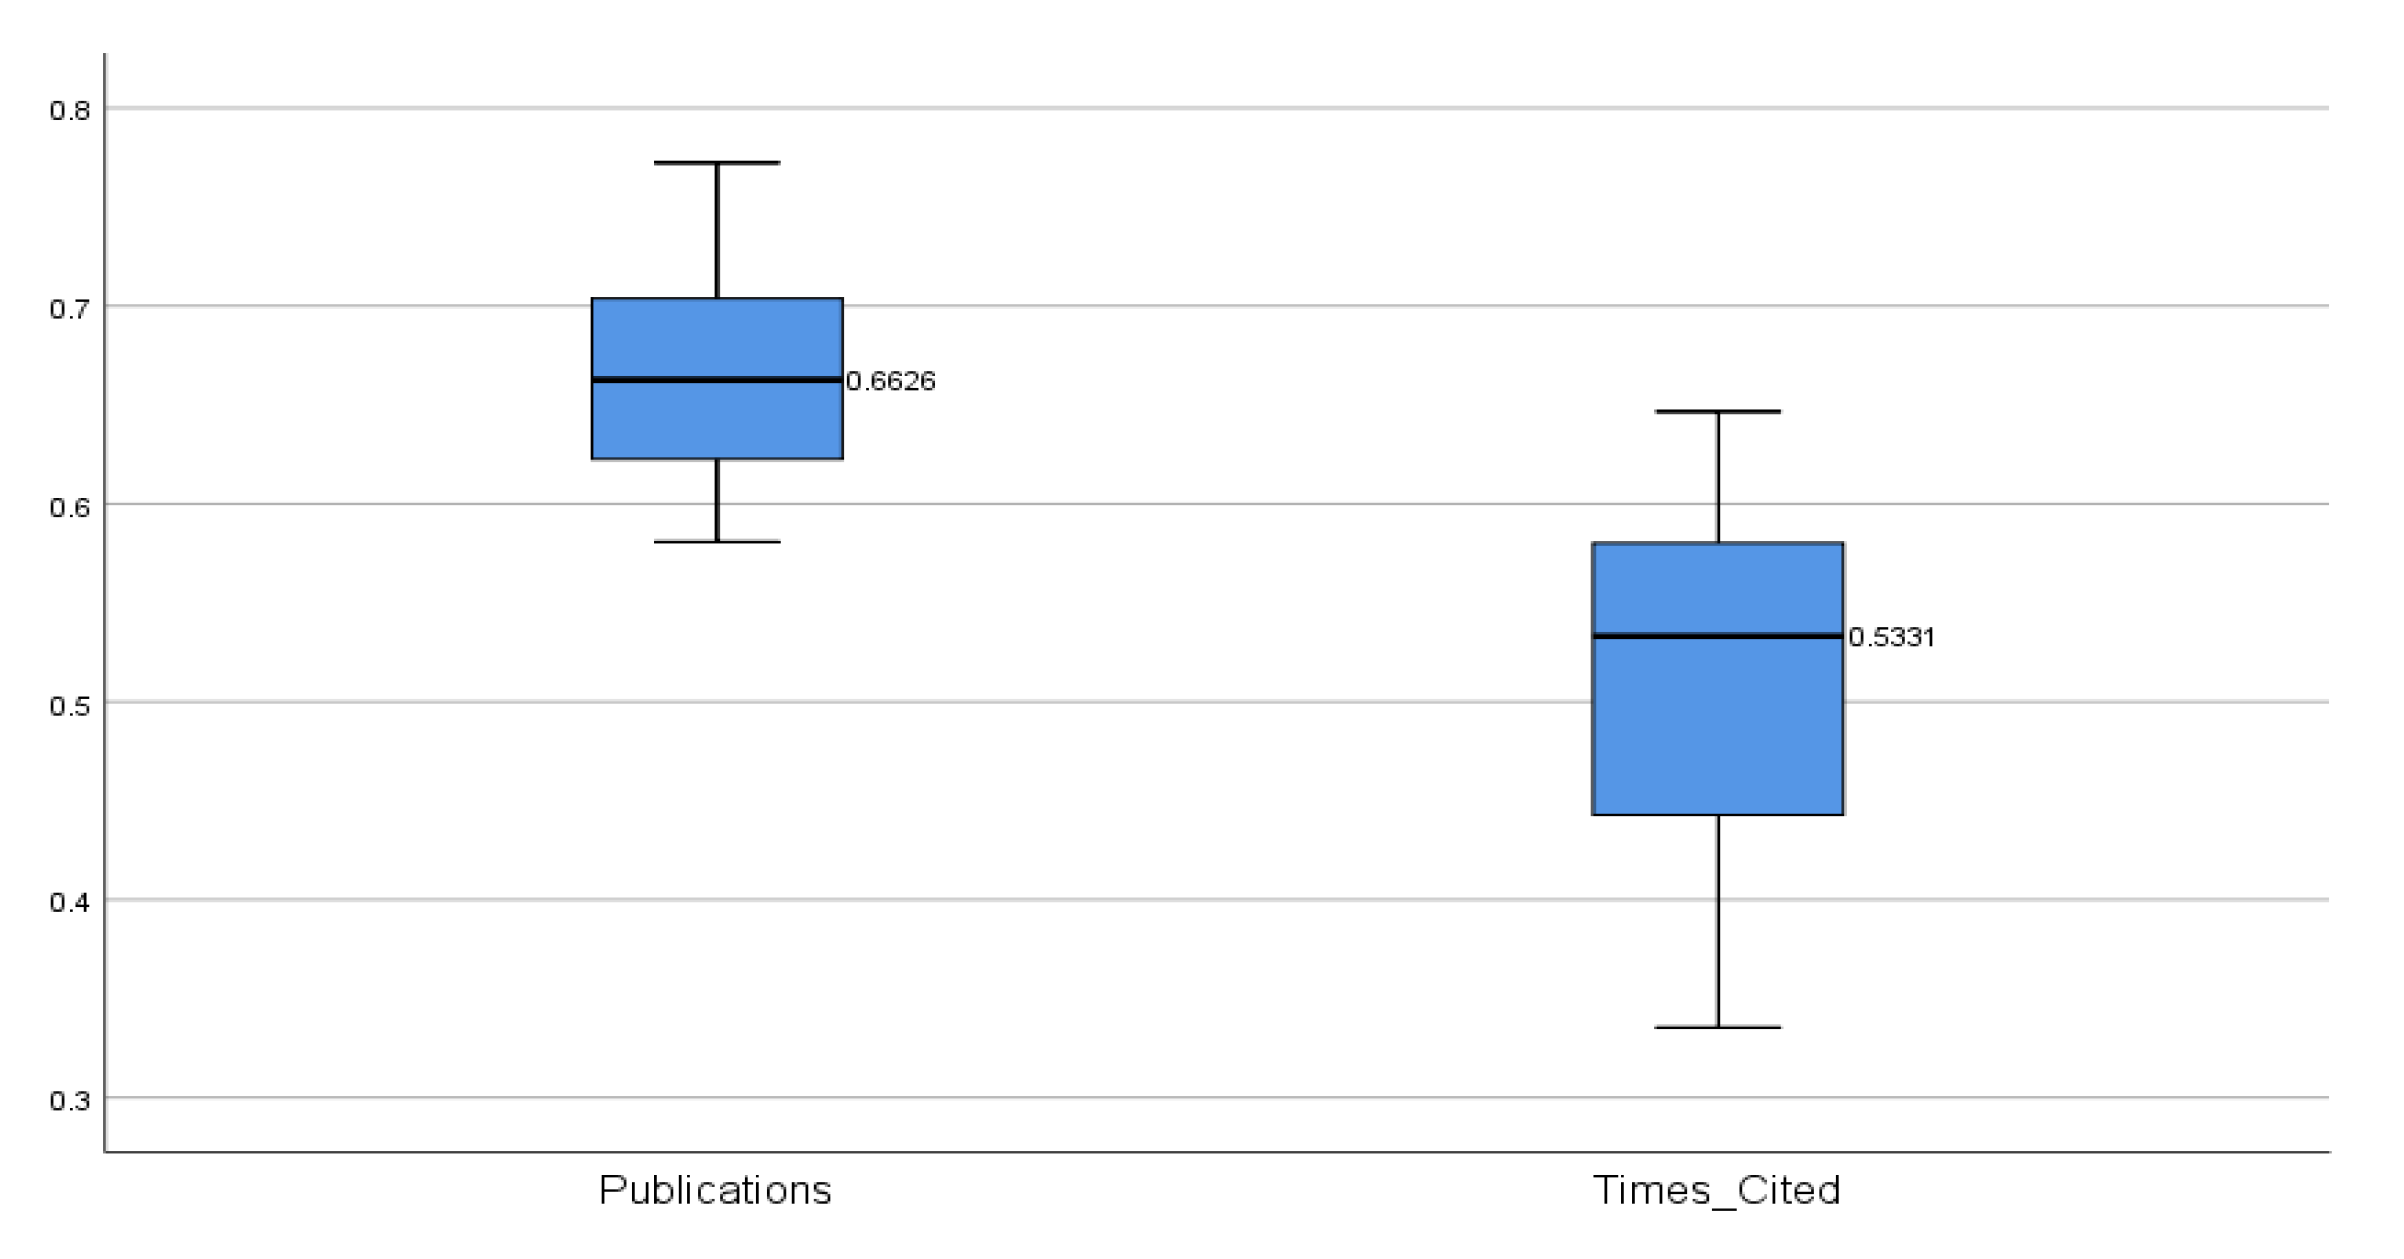
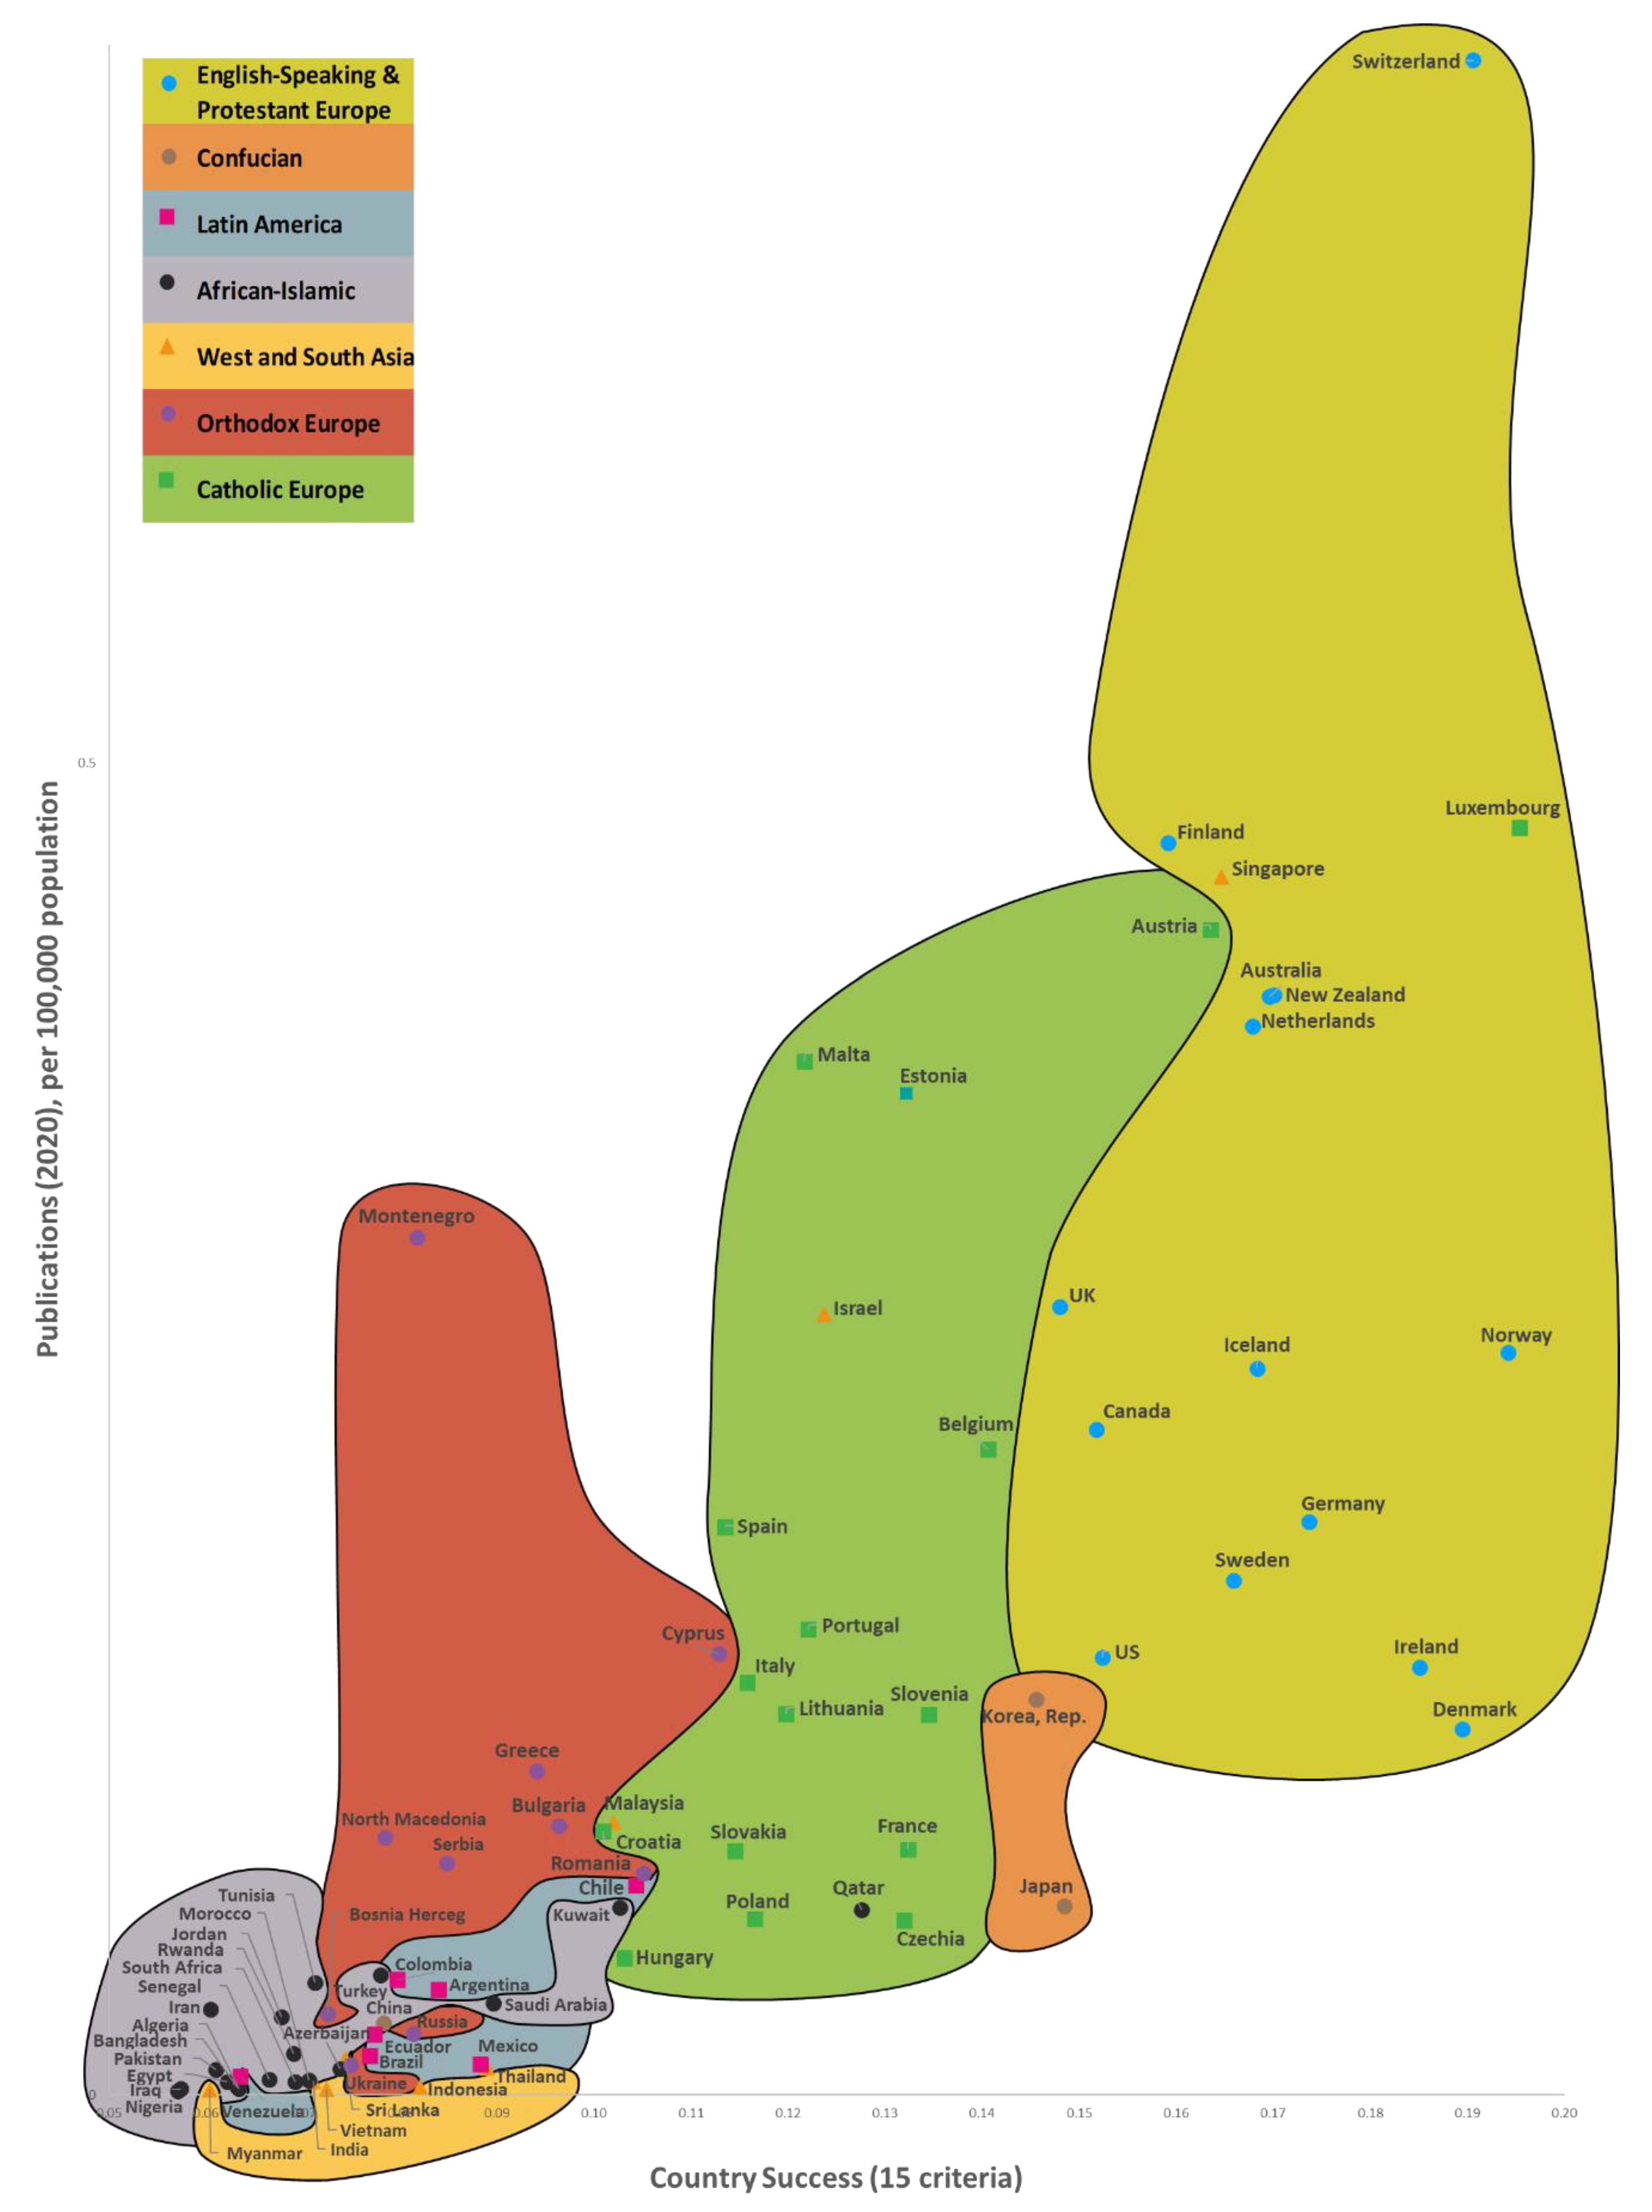
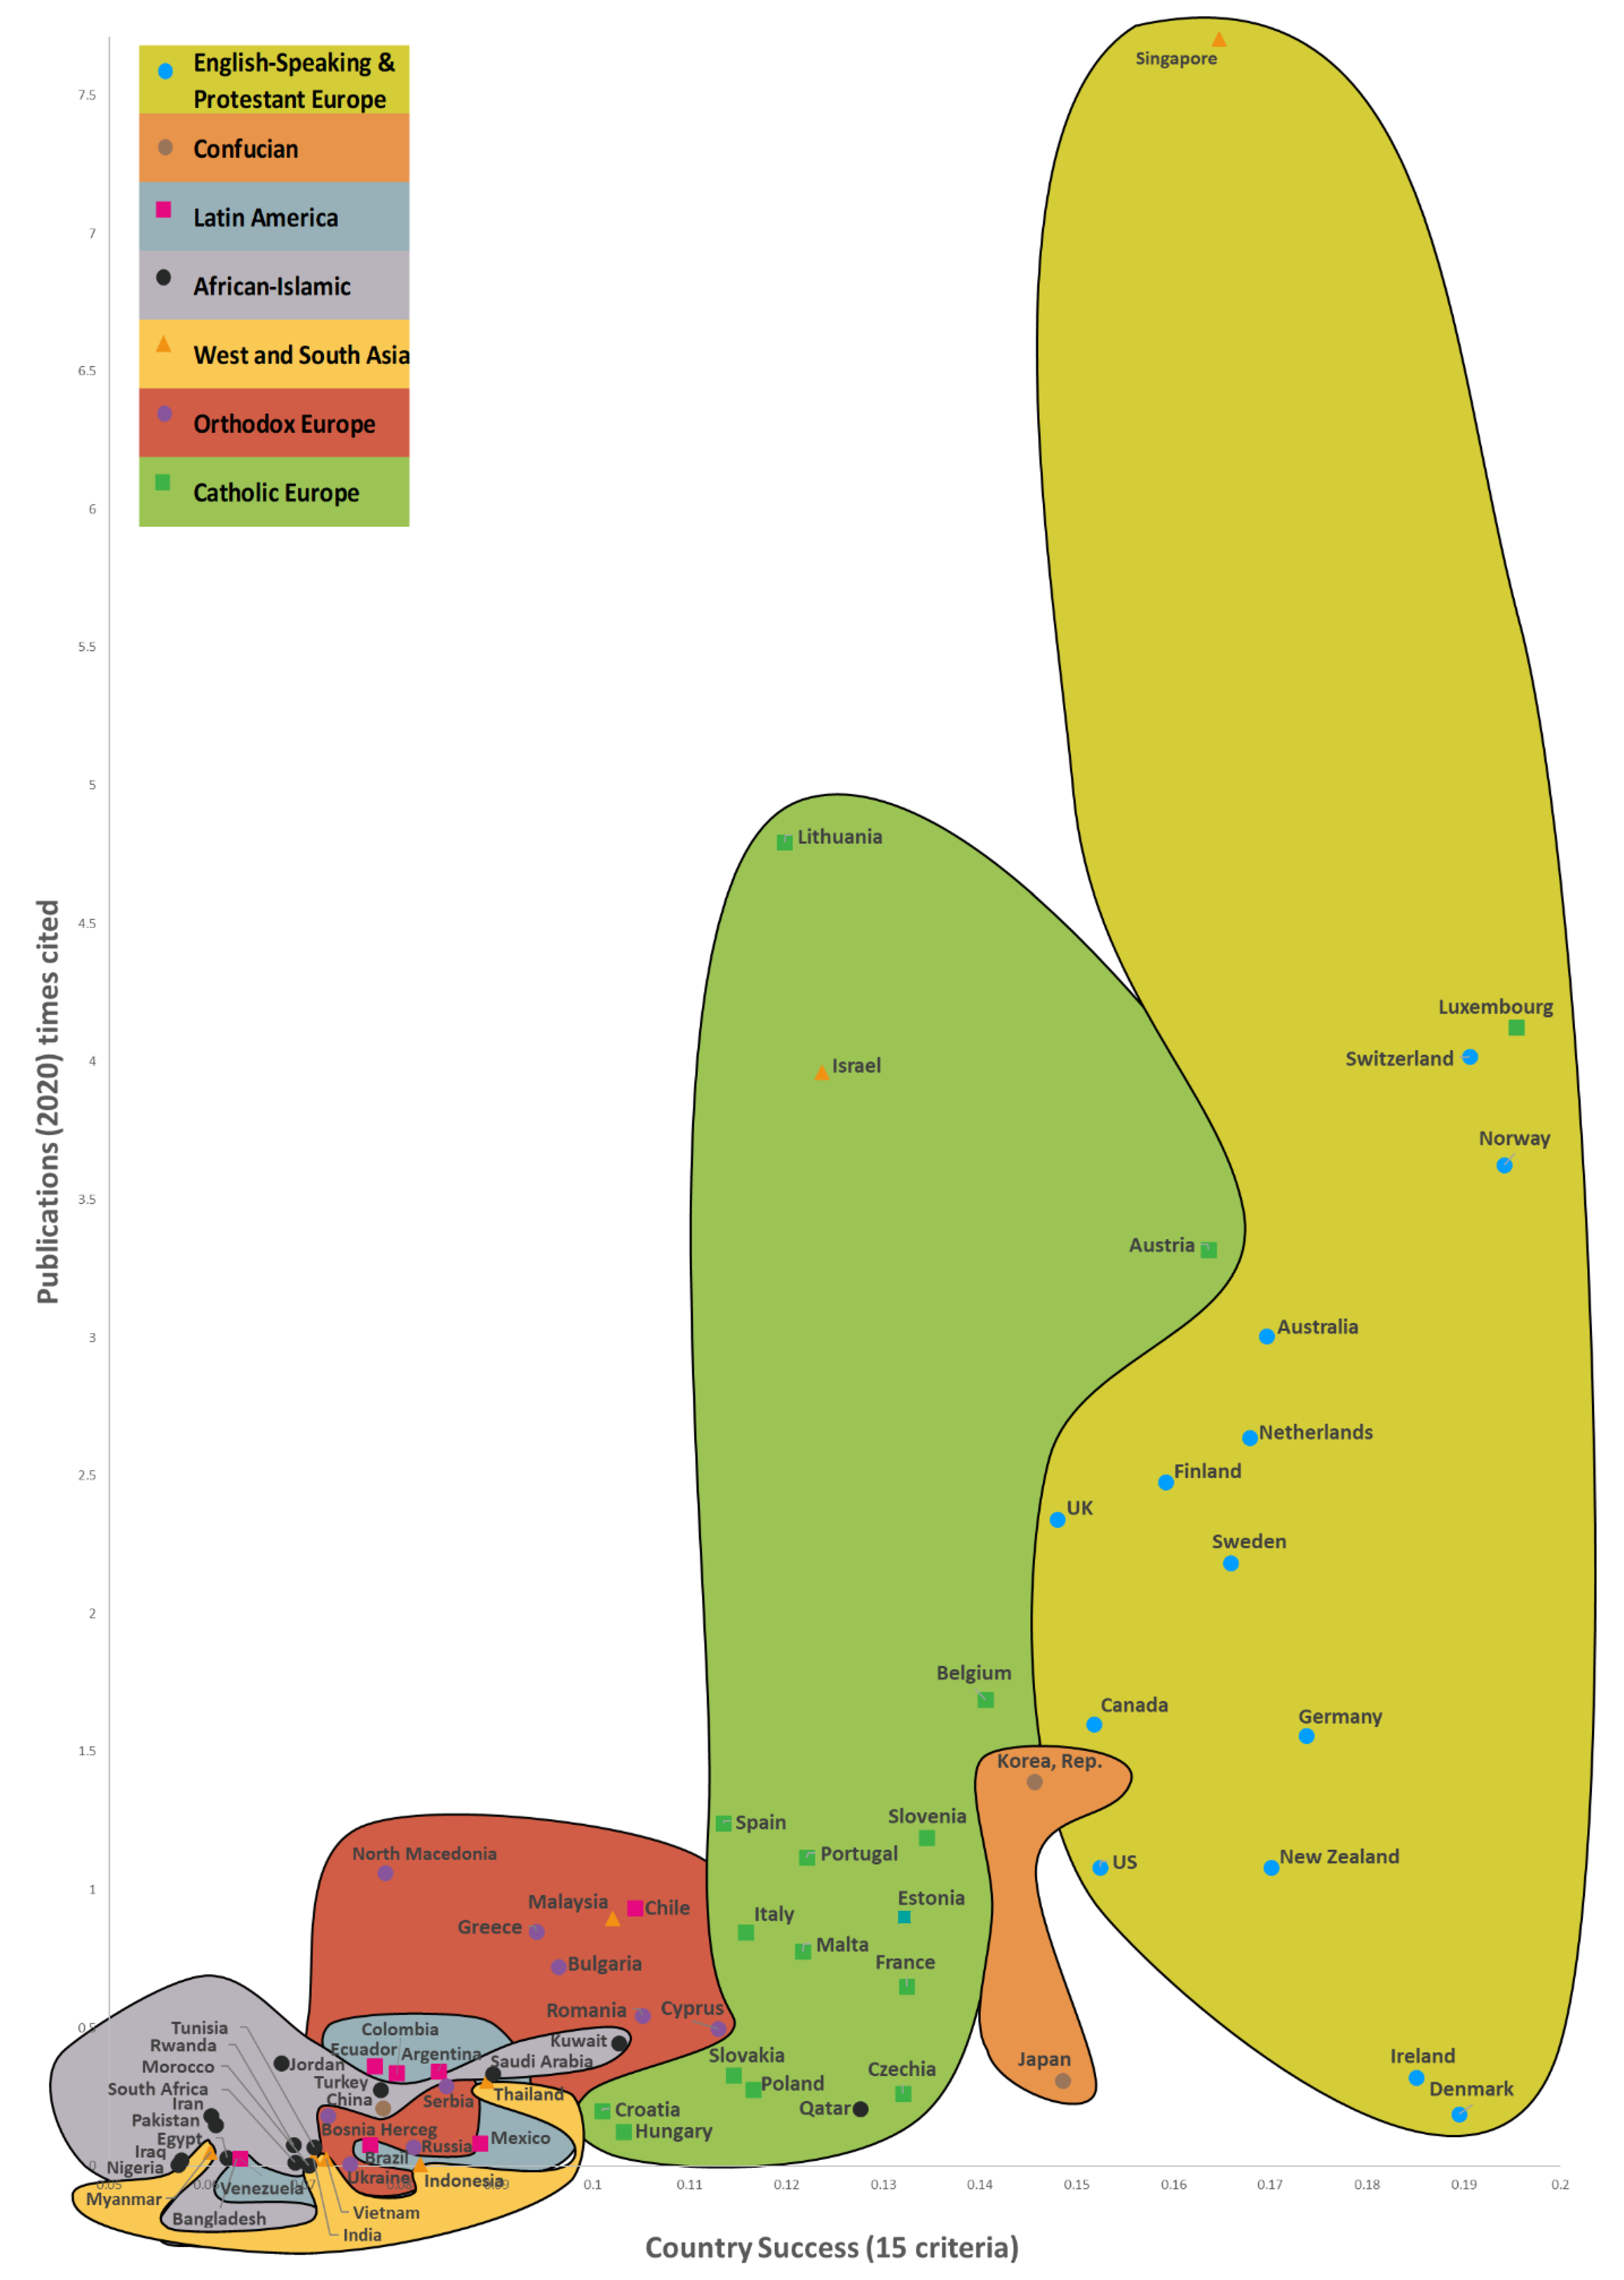
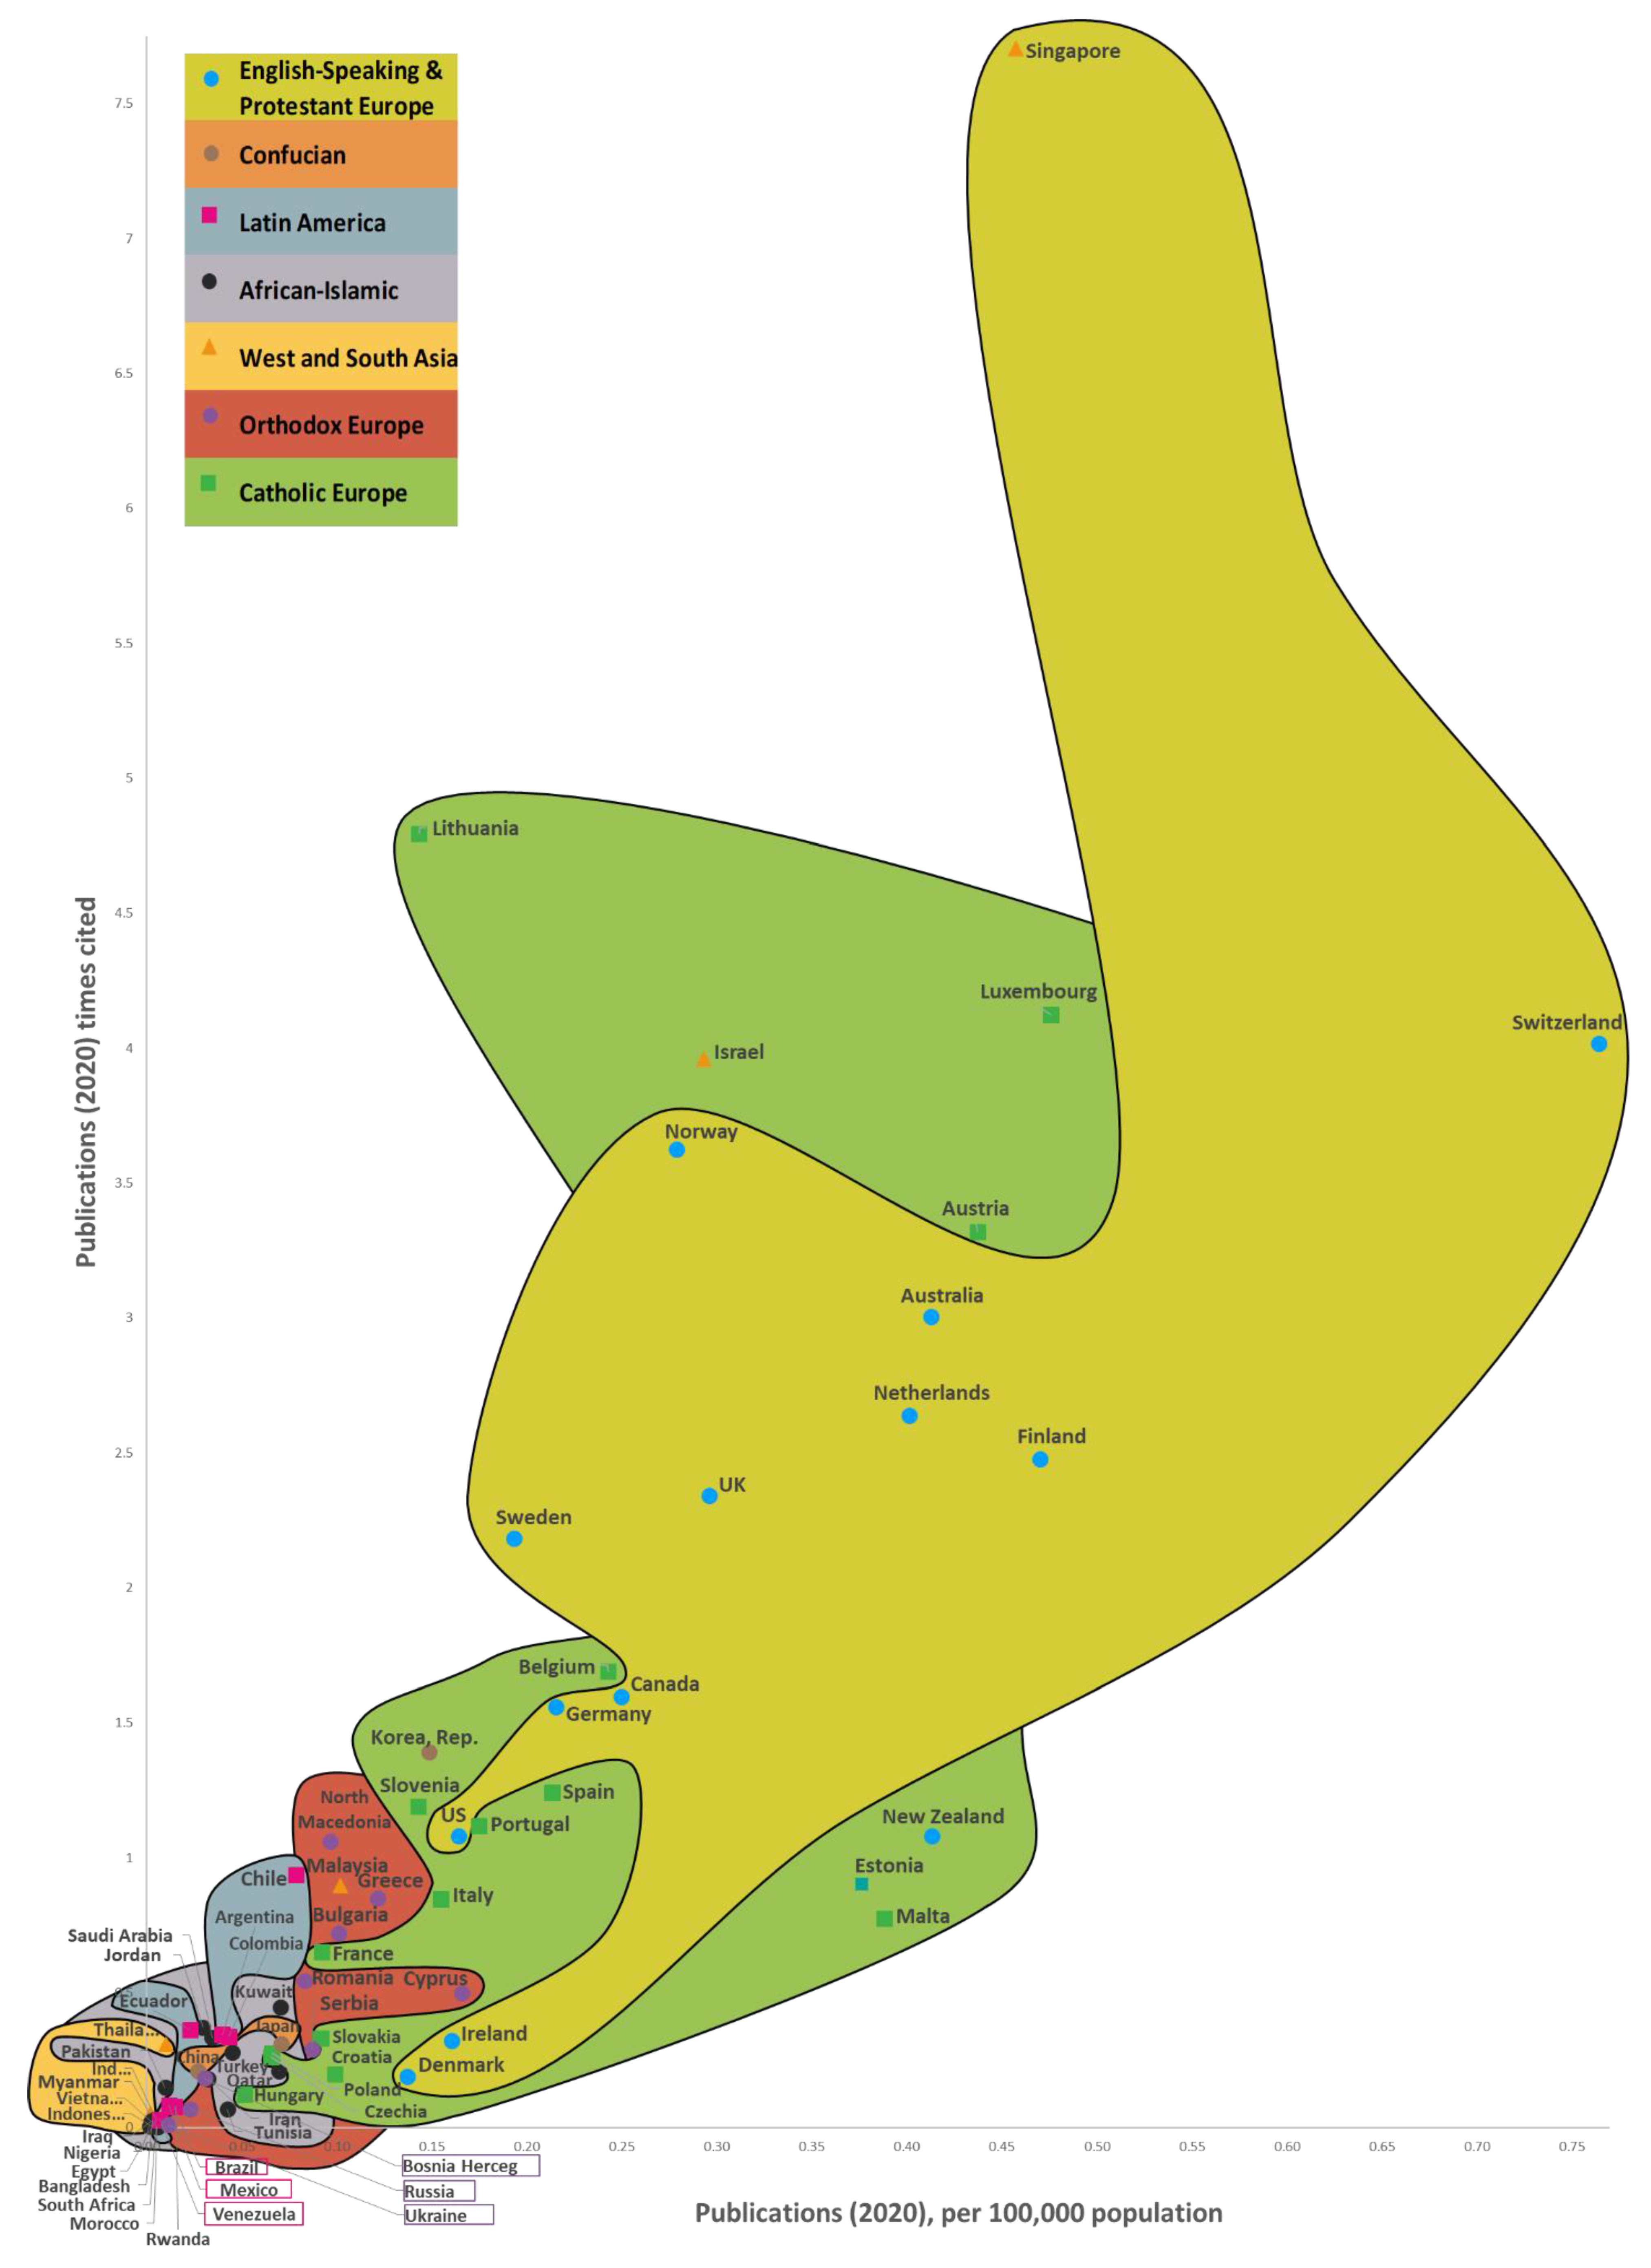
| Methods | Author(s) | Description |
|---|---|---|
| Electroencephalography (EEG) | [111,253,254,255,256,257,258,259,260,261,262,263,264,265,266] | EEGs capture brainwave variations, using recorded amplitudes to monitor mental states that include alpha waves (relaxation), beta waves (wakefulness), delta waves (sleep), and theta waves (calmness) [255]. An EEG signal comprises five brain waves and measuring the activity of certain brain areas can reveal the state of the subject’s cortical activation. Each wave is characterized by different amplitudes and frequencies, and corresponds to distinct cognitive states [265]. |
| Magnetoencephalography (MEG) | [111,253,254,255,256,259,260,267] | Using magnetic potentials, an MEG records brain activity at the scalp level. A helmet with sensitive detectors is placed on the subject’s head to track the signal [255], and the MEG detects the magnetic fields produced by electromagnetic fields [111]. |
| Transcranial Magnetic Stimulation (TMS) (Figure 3) | [111,251,253,255,258,260,267] | TMS modulates the activity of certain brain areas located 1–2 cm below the skull, without reaching the neocortex, using magnetic induction [255]. When TMS is used, short electromagnetic impulses are applied at the scalp level. This instrument can stimulate or inhibit a particular cortical area [111]. |
| Near Infrared Spectroscopy (NIRS) | [267,268,269] | NIRS measures hemodynamic alterations accompanying brain activation and is a simple bedside technique [269]. NIRS makes use of the near-infrared region of the electromagnetic spectrum (about 700–2500 nm). Measurements are taken of light scattered from the surface of and through a sample, and NIR reflectance spectra can give rapid insight into the properties of a material without altering the sample [268]. |
| Steady-State Topography (SST) | [251,253,255,256,260] | SST can be applied to track high-speed changes and measure the activity of the human brain. This tool is very commonly used in neuromarketing research and cognitive neuroscience [255]. |
| Functional Magnetic Resonance Imaging (fMRI) (Figure 4) | [111,251,253,254,255,256,258,259,260,261,263,264,266,267] | fMRI is suitable for use within neuromarketing studies, as brain activity can be measured in subjects performing certain tasks or experiencing marketing stimuli. It allows for the observation of deep brain structures, and hence can reveal patterns [255]. fMRI can also measure increases in oxygen levels in the blood flow to the brain and can detect the active cortical regions [111]. |
| Positron Emission Tomography (PET) (Figure 4) | [111,251,253,254,256,259,260,261,267] | The subject is injected with a radioactive substance, and the flow of the substance is then measured. Significant increases in the flow are seen in activated areas [111]. |
| Diffusion Tensor Imaging (DTI) (Figure 5) | [267,270,271] | This is an MRI-based neuroimaging technique that allows the user to estimate the location, anisotropy and orientation of the brain’s white matter tracts [271]. DTI makes it possible to visualize and characterize white matter fasciculi in two and three dimensions [270]. |
| Technique | Author(s) | Description |
|---|---|---|
| Physical/Physiological Features | ||
| Eye Tracking (ET) (Figure 6) | [111,251,253,254,255,256,257,258,259,260,261,264,265,266,267] | ET determines the areas at which the subject is looking and for how long, and also tracks the movement of the subject’s eyes and changes in pupil dilation while the subject looks at stimuli. With this technique, behavior and cognition can be studied without measuring brain activity [255]. By measuring eye movements and visual attention, an eye tracker determines the point of regard [265]. |
| Blinking | [261,264,293] | Eye blinking forms the basis of the new biometric emotions identifier proposed by Abo-Zahhad et al. [293]. These authors outline where eye blinking signals come from and give an overview of the features of the EOG signals from which the eye blinking waveform is extracted. |
| Iris characteristics | User-oriented examinations were applied to find the relationships between personality and three common iris characteristics: pigment dots, crypts, and contraction furrows [294]. Dark-eyed individuals typically have higher scores for neuroticism and extraversion [295], sociability [296], and ease of emotional arousal [297]. | |
| Facial Action Coding (FC)/Facial Expression Analysis Surveys (Figure 7) | [253,254,255,256,257,258,260,261,263,264,265,298] | FC uses a video camera to track micro-expressions that correspond to certain subconscious reactions. The activity of the facial muscles is tracked [255]. Scientists and practitioners have developed various open data datasets (KaoKore Dataset, CelebFaces At-tributes Dataset, etc.) and applied elicitation techniques (gamification, virtual reality) in practice. |
| Facial Electromyography (fEMG) (Figure 8) | [251,253,254,255,256,259,260,261,262,263,298,299] | fEMG is used in measuring and evaluating the physiological properties of facial muscles [255]. |
| Odor | [300] | This a method of emotion recognition based on an individual’s odor [300]. An emotional mood, for example a period of depression, may affect body odor [301]. |
| Keystroke dynamics and mouse movements (Figure 9) | [302] | AFFECT states can be determined by how a person moves a computer mouse while sitting at a computer. |
| Skin Conductance (SC)/Galvanometer or Galvanic Skin Response (GSR) | [111,251,253,255,256,258,260,261,262,264,265,267] | SC is highly correlated with the rate of perspiration, and is often linked to stress as well as to the processes happening in the nervous system [261]. SC methods measure arousal based on tiny changes in conductance that occur when something activates the autonomic nervous system [255]. The sympathetic branch of the autonomic nervous system controls the skin’s sweat glands, and the activity of the glands determines the galvanic skin response [265]. |
| Heart rate (HR)/Electrocardiogram (ECG) | [19,111,251,256,261,303] | An ECG is used to measure the electrical activity of the heart [261]. An ECG relies on cardiac electrical activity and measures the electrical impulses that travel through the heart with each beat, causing the heart muscle to pump blood. In ECGs of a normal heartbeat, the timing of the lower and top chambers of the heart is charted [303]. |
| Respiratory Rate Assessment (RRA) | [111,261,304] | Respiratory rate, one of fundamental vital signs, is sensitive to various pathological situations (clinical deterioration, pneumonia, adverse cardiac events, etc.), as well as stressors [304]. |
| Skin temperature (SKT) | [305] | SKT data can be used to measure the thermal responses of human skin. SKT depends on the complex relationship between blood perfusion in the skin layers, heat exchange with the environment, and the central warmer regions of the skin [305] |
| Photoplethysmography (PPG) or Blood volume pulse (BVP) | [305] | Changes in the amplitudes of PPG signals are related to the level of tension in a human being. PPG is a simple, non-invasive method of taking measurements of the cardiac synchronous changes in the blood volume [305]. |
| Trapezium electromyogram | [306] | EMG is a technique that can be used to evaluate and record the electrical activity generated by skeletal muscle [306], for example the trapezius muscle [307]. |
| Neurotransmitter (NT) | [251,308] | Brain neurotransmitters are particular chemical substances that act as messengers in chemical synaptic transmissions and can transmit emotive information. They have excitability and inhibitive abilities [308]. |
| Voice/Speech/Voice Pitch Analysis (VPA) | [263,267,300,309,310] | This is a method of emotion recognition that relies on the person’s voice. |
| Implicit Association Test (IAT) | [255,264,311] | IAT measures individual behavior and experience by assessing the reaction times of subjects to determine their inner attitudes. The subjects are given two cognitive tasks, and measurements are taken of the speed at which they associate two distinct concepts (brands, advertisements, etc.) with two distinct assessed features. IATs can be used to identify hierarchies of products by means of comparisons [255]. |
| Mouse Tracking (MT) | [257,312] | Recognition of a user’s emotions is possible based on their mouse movements. Users can be classified by extracting features from raw data on mouse movements and employing complex machine learning techniques (e.g., a support vector machine (SVM)) and basic machine learning techniques (e.g., k-nearest neighbor) [312]. |
| Signature (Figure 9) | [298,299,300,309] | Emotions can be identified by their handwriting style, and in particular their signature. |
| Gait (Figure 9) | [298,299,300,309] | This method allows for emotions recognition based on a person’s walking style or gait [300]. |
| Lip Movement | [299] | Lip movement measurements are a recently developed form of biometric emotions recognition that is very similar to the way a deaf person determines what is being said by tracking lip movements [299]. |
| Gesture | [298,309] | Gesture recognition is used to identify emotions rather than a person, and gestures are grouped into certain categories [298]. |
| Keystroke/Typing Recognition (Figure 9) | [169,300] | In this method, the unique characteristics of a person’s typing style are used for emotions identification purposes [300]. |
| Stimulus | AFFECT | Methods | Reference |
|---|---|---|---|
| Recording of dances, video | Anger, fear, grief, and joy | GSR, eye movement (Figure 6) | [334] |
| Neurophysiological research from 2009 to 2016 | Overview of the existing works in emotion | EEG | [335] |
| Affective stimuli | Surprise, disgust, anger, fear, happiness, and sadness | EEG | [336] |
| The visual stimuli, black and white photographs of 10 different models | Happy, sad | MEG | [337] |
| 20 face actors, each displaying happy, neutral, and fearful facial expressions | Happy, neutral, fearful | MEG | [338] |
| Task-irrelevant emotional and neutral pictures | Pleasant, unpleasant | TMS | [339] |
| A subset of music videos from the Dataset for Emotions Analysis using Physiological signals (DEAP) dataset | Valence, arousal | fNIRS, EEG | [340] |
| Emotional faces for the emotion perception test | Pleasant, unpleasant, neutral | fMRI | [341] |
| - | Stress | PET | [342] |
| Video | Happiness, sadness, disgust, anxiety, pleasant, unpleasant, neutral | PET | [343] |
| Facial Emotion Selection Test (FEST) | Positive, negative | DTI | [344] |
| Real time biometric-emotional data collection from depersonalized passersby | Neutral, happiness, sadness, surprised, anger, scared, valence, arousal, disgust, interest, confusion, boredom | Emotional, Affective and Biometrical States Analytics of the Built Environment Method | [345] |
| Real time data collection | Happy, sad, angry, surprised, scared, disgusted, valence, arousal | Method of an Affective Analytics of Demonstration Sites | [346] |
| Scanning a human-centered built environment, real time data collection | Sadness, disgust Happiness, anger, fear surprise, boredom, neutral, arousal, valence, confusion, and interest | Affect-Based Built Environment Video Analytics | [347] |
| Remote real time data | Happiness, arousal, valence | Video Neuro-advertising Method | [93,348] |
| Smelling strips | Happy, radiant, well-being, soothed, energized, romantic, sophisticated, sensual, adventurous, comforted, amused, interested, nostalgic, revitalized, self-confident, surprised, free, desirable, daring, excited | IRT | [349] |
| Text | Positive and negative valence | Eye tracking (ET) | [350] |
| 21 video fragments | High/low arousal, high/moderate/low valence | Eye tracking (ET) | [351] |
| Crypts | Feelings, tendermindedness, warmth, trust and positive emotions | Iris | [294] |
| The simulation environment | Wellness/malaise, relaxation/tension, fatigue/excitement | Retina | [352] |
| Colors | Surprise, Happiness, Disgust, Anger, Sadness and Fear | Blinking, heart rate | [353] |
| HSV color space | Fear, disgust, surprise, joy, anticipation, sadness, anger, trust | Blinking | [354] |
| Review of existing novel facial expression recognition systems | Anger, disgust, fear, happiness, sadness, surprise and neutral | Facial expression recognition | [355] |
| Destination promotional videos | Pleasure, arousal | Skin conductance, facial electromyography | [355] |
| Games scenario between a human user and a 3D humanoid agent | Arousal, valence, fear, frustrated, relaxed, joyful, excited | Electromyography, skin conductance | [356] |
| Dramatic film | Real-time emotion estimation | EEG, Heart Rate, Galvanic Skin Response | [357] |
| Emotional state of a driver while in an automobile | Happy, anger | Electrocardiogram (ECG) | [358] |
| Music | Pleasure, unpleasure | Heart and respiratory rates | [359] |
| Trier Social Stress Test | Stress, relax | Respiratory rate and heart rate | [360] |
| Voice- and speech-pattern analysis | Normal, angry, panic | Voice, speech | [361] |
| Implicit anxiety-related self-concept | Shame, guilt proneness, anxiety, anger-hostility | Implicit Association Test | [362] |
| Case studies | Self-control, happiness, anger, fear, sadness, surprise, and anxiety | Mouse Tracking | [302] |
| Academic study website | Neutral, positive, negative | Mouse Tracking | [363] |
| Motor improvisation task | Joy, sadness, and a neutral control emotion | Signature | [364] |
| - | Neutral, joy, anger, sadness | Gait | [365] |
| Text | Neutral, joy, surprise, fear, anger, disgust, sadness | Lip Movement | [366] |
| Dataset | Anger, disgust, fear, happiness, sadness, and surprise | Keystroke dynamics | [367] |
| Recall of past emotional life episodes | Valence, arousal | EEG | [368] |
| Physiological emotional database for real participants | Valence, arousal | Peripheral signals, EEG | [369] |
| Data from wearable sensors on subject’s skin | High/neutral/low arousal and valence | ECG, EEG, electromyography (EMG) | [370] |
| Real time heartbeat rate and skin conductance | High/low arousal and valence | GSR, temperature, breathing rate, blood pressure, EEG | [371] |
| Multimedia contents based on IPTV, mobile social network service, and blog service | Pleasant, unpleasant | GSR, skin temperature, heart rate | [372] |
| Stress stimuli | High/low valence, high/low arousal | GSR, heart rate, ECG | [373] |
| CCD-capture human face, measure user’s physiological data | Pleasant, unpleasant | GSR, photoplethysmogram (PPG), skin temperature | [374] |
| Music videos | High/low arousal, high/low valence | EEG | [375] |
| Detect the current mood of subjects | High/low arousal, high/low valence | EEG | [376] |
| DEAP database | Joy, fear, sadness, relaxation | EEG, back-propagation neural network | [377] |
| Hjorth features, statistics features, high order crossing features | Happy, calm, sad, scared | EEG, CNN, LSTM recurrent neural networks | [378] |
| Thirty film clips | Serenity, hope, joy, awe, love, gratitude, amusement, interest, pride, inspiration | EEG | [379] |
| Transcendental meditation | Ecstasy | EEG | [380] |
| Ultimatum game | Acceptance | EEG | [381] |
| Driving a car equipped | Trust | EEG, GSR | [382] |
| 12 prototypes that were designed based on the framework of diachronic opposite emotions | Amazement, happiness | EEG, SD tests | [383] |
| Audio-visual emotion database | Pleasure, irritation, sorrow, amazement, disgust, and panic | - | [384] |
| Sleep measures | Grief | EEG | [385] |
| Real episodes from subjects’ lives | Grief, anger | EEG | [386] |
| Virtual environment consisting of three types of cues | Pensiveness relaxation, non-arousal, stress | EEG | [387] |
| Patient with dramatic, episodic, seizure-related rage and violence | Rage and aggression | Video-EEG recording | [388] |
| DEAP database | Rage | EEG, multiclass-common spatial patterns | [389] |
| Brainstem auditory evoked potentials | Rage and self-injurious behavior | EEG, brainstem evoked potentials (BAEPs) | [390] |
| Acoustic annoyance | Annoyance | EEG | [391] |
| 70 dBA white noise and pure tones at 160 Hz, 500 Hz and 4000 Hz | Annoyance | EEG | [392] |
| 30 pictures from International Affective Picture System | Neutral, joy, sadness anger, surprise, valence (positive and negative), contempt, fear, disgust | EEG | [393] |
| Movie clips | Anger, fear, anxiety, disgust, contempt, joy, happiness | EEG | [394] |
| Emotional factor | Aggressiveness | EEG | [395] |
| Buss–Durkee questionnaire | Aggressiveness | EEG | [396,397] |
| Reward anticipation | Anticipation | EEG | [398] |
| Structured Clinical Interview for DSM-IV | Anticipation | EEG, fMRI | [399] |
| DEAP database | High/low valence and arousal | EEG | [400,401,402,403,404,405] |
| Reading and reflection task about Muslims | Disapproval | EEG, ANOVA | [406] |
| Simulated train driving | Fatigue and distraction | EEG, Multi-type feature extraction, CatB-FS algorithm | [407] |
| Faces (the participant’s own face, the face of a stranger, and a celebrity’s face) | Admiration | EEG, 18-Items Narcissistic Admiration and Rivalry Questionnaire | [408] |
| Presentation of 12 virtual agents | Acceptance | EEG and the virtual agent’s acceptance questionnaire (VAAQ) | [409] |
| English prosocial and opposite antisocial words in a sentence | Approval and disapproval | EEG, ANOVA | [410] |
| Data from Facebook comments | Enjoyment (peace and ecstasy), sadness (disappointment and despair), fear (anxiety and terror), anger (annoyance and fury), disgust (dislike and loathing) surprise, other (neutral) | Natural language processing (NLP); convolutional neural network (CNN) and long short-term memory (LSTM); Random Forest and support vector machine (SVM), standard Vietnamese social media emotion corpus (UIT-VSMEC) | [411] |
| Video clips | Pride, love, amusement, joy, inspiration, gratitude, awe, serenity, interest, hope | fNIRS | [412] |
| User’s interaction with a web page | Arousal/valence anxiety and aggressiveness | Facial expressions, Facial Action Coding System, specialized questionnaires | [413] |
| An investment game that uses artificial agents | Trust | EEG | [285] |
| Simulated autonomous system | Trust | EEG and GSR | [382] |
| The iCV-MEFED dataset. For each subject in the iCV-MEFED dataset, five sample images were captured. | Neutral, angry, contempt, happy, happily surprised, surprisingly fearful, surprised | Facial emotion recognition (Figure 7), CNN; Inception-V3 network | [414] |
| Dynamic emotional facial expressions were generated by using FACSGen | Contempt, disgust, sadness, neutral | ANOVA, Participants completed emotion scales | [415] |
| Film clips | Pride, love, amusement, joy, inspiration, gratitude, awe, serenity, interest, hope | EEG, multidimensional scaling (MDS), intra-class correlation coefficients (ICCs) | [379] |
| Simulated driving system | Vigilance | EEG and forehead electrooculogram (EOG), eye tracking (Figure 6) | [416] |
| DEAP dataset | Optimism, pessimism, calm | EEG, CNN | [166] |
| Music | Relaxing-calm, sad-lonely, amazed-surprised, quiet-still, angry-fearful, happy-pleased | Binary relevance (BR), label powerset (LP), random k-label sets (RAKEL), SVM | [417] |
| Music | Happiness, love, anger and sadness | EEG, SVM, Multi-Layer Perceptron (MLP), and K-nearest Neighbor (K-NN) | [418] |
| Three sets of pictures | Anticipation | Facial emotions (Figure 7), action observation network (AON), two-alternative forced-choice procedure, Reaction times (RT), ANOVA | [419] |
| Individuals enacted aggressive actions, angry facial expressions and other non-aggressive emotional gestures | Aggressive actions and anger | Kinect infrared sensor camera: hand movement, body posture, head gesture, face (Figure 9), and speech. SVM and the rule-based features | [420] |
| Images of faces from the Ekman and Friesen series of Pictures of Facial Affect | Grief | Facial Expression of Emotion Test (Figure 7) | [421] |
| Music | Soothing, engaging, annoying and boring | FBS fusion of three-channel forehead biosignals, ECG | [422] |
| Films | Amusement, anger, grief, and fear | Fingertip blood oxygen saturation (OXY), GSR, HR | [423] |
| Polish emotional database, database consists of 12 emotional states | Rage, anger, annoyance, grief, sadness, pensiveness, ecstasy, joy, serenity, terror, fear, apprehension | Speech, KNN Algorithm | [424] |
| Video | Nonverbal behaviors signaling dominance and submissiveness | Implicit association test, body language, MANOVA | [425] |
| Music | High/low valence, high/low arousal | EMG, EEG, HRV, GSR | [426] |
| The external auditory canal is warmed or cooled with water or air | High and low arousal | Electrodermal activity (EDA), HRV, activity tracker, EMG, SKT | [427] |
| After-image experiments, direct visual observation, photography of the eyes, recording of the corneal reflex | High/low valence, high/low arousal | GSR, EMG | [428] |
| Assessment of emotional states experienced by racing drivers | Sadness, fear, anger, surprise, happiness, and disgust | ECG, EMG, respiratory rate, GSR | [429] |
| Dataset of standardized facial expressions | Happiness, sadness, anger, disgust, fear, and surprise | Facial Action Coding (FC) | [430] |
| Neighbor sounds | Arousal, valence | fEMG, heart rate (HR), electrodermal activity (EDA) | [431] |
| Audio visual stimuli | Joy, sadness, anger, fear | ECG | [432] |
| Playing with the infant to elicit laughter | Joy | Skin temperature (SKT) | [433] |
| Two different kinds of video inducing happiness and sadness | Happiness, sadness | Photoplethysmography (PPG), skin temperature (SKT) | [434] |
| International Affecting Picture System (IAPS) pictures | Joy, sadness, fear, disgust, neutrality, amusement | Electromyogram signal (EMG), respiratory volume (RV), skin temperature (SKT), skin conductance (SKC), blood volume pulse (BVP), heart rate (HR) | [435] |
| Movie and music video clips | Arousal, valence | Electrooculogram (EOG), electrocardiogram (EEG) trapezium electromyogram (EMG) | [436] |
| Audio/visual | Anger, happiness, sadness, pleasure | GSR, EMG, respiratory rate, ECG | [437] |
| Descriptive Statistics | Descriptive Statistics of 2 Models Dependent Variables | |
|---|---|---|
| Publications—Country Success | Times Cited—Country Success | |
| Model 1 (CSPN) | Model 2 (CSPC) | |
| Mean | 0.1354 | 0.9279 |
| Median | 0.0785 | 0.3297 |
| Maximum | 0.7642 | 7.7034 |
| Minimum | 0.0015 | 0.0000 |
| Standard Deviation | 0.1557 | 1.3893 |
| Skewness | 1.5533 | 2.4316 |
| Kurtosis | 5.3614 | 9.8641 |
| Observations | 166 | 165 |
| Independent Variables | Dependent Variables | |
|---|---|---|
| Publications—Country Success | Times Cited—Country Success | |
| Model 1 (CSPN) | Model 2 (CSPC) | |
| GDP per capita | 0.7725 *** (1.2062) | 0.6368 *** (7.1524) |
| GDP per capita in PPP | 0.6975 *** (8.4298) | 0.6467 *** (7.3418) |
| Ease of doing business ranking | −0.4821 *** (−4.7652) | −0.4390 *** (−4.2317) |
| Corruption perceptions index | 0.7624 *** (1.5319) | 0.6341 *** (7.1014) |
| Human development index | 0.6717 *** (7.8530) | 0.5347 *** (5.4799) |
| Global gender gap | 0.4797 *** (4.7348) | 0.3354 *** (3.0834) |
| Happiness index | 0.7037 *** (8.5774) | 0.5315 *** (5.4340) |
| Environmental performance index | 0.6939 *** (8.3444) | 0.5166 *** (5.2256) |
| Freedom and control | −0.5808 *** (−6.1782) | −0.3832 *** (−3.5932) |
| Economic freedom | 0.6535 *** (7.4765) | 0.5801 *** (6.1681) |
| Democracy Index | 0.6227 *** (6.8912) | 0.4429 *** (4.2777) |
| Unemployment rate | −0.1860 (−1.6398) | −0.1642 (−1.4412) |
| Healthy life expectancy | 0.6312 *** (7.0471) | 0.5194 *** (5.2635) |
| Fragile state index | −0.7229 *** (−9.0606) | −0.5405 *** (−5.5634) |
| Economic decline index | −0.6358 *** (−7.1339) | −0.5597 *** (−5.8487) |
| Descriptive Statistics | Descriptive Statistics of 2 Models | |
|---|---|---|
| Publications—Country Success | Times Cited—Country Success | |
| Model 1 (CSPN) | Model 2 (CSPC) | |
| Pearson’s correlation coefficient (|r|) | 0.6272 | 0.5142 |
| Coefficient of determination (R2) | 0.6943 | 0.5114 |
| Adjusted R2 | 0.6191 | 0.3912 |
| Standard deviation | 0.1557 | 1.3693 |
| p values (probability level) | 0.0000 | 0.0000 |
| F | 9.2356 | 4.2570 |
| Independent Variables | Standardized Beta Coefficient Values of the Dependent Variables | ||
|---|---|---|---|
| Publications—Country Success | Times Cited—Country Success | ||
| Model 1 (CSPN) | Model 2 (CSPC) | ||
| 1 | GDP per capita | 0.7735 ** | −0.0853 |
| 2 | GDP per capita in PPP | −0.5123 * | 0.5304 * |
| 3 | Ease of doing business ranking | 0.2535 | 0.1599 |
| 4 | Corruption perceptions index | 0.2392 | 0.3633 |
| 5 | Human development index | 0.1697 | −0.1836 |
| 6 | Global gender gap | −0.0228 | 0.0703 |
| 7 | Happiness index | 0.0800 | −0.0916 |
| 8 | Environmental performance index | −0.0601 **/ | 0.1819 |
| 9 | Freedom and control | −0.0299 | 0.0846 |
| 10 | Economic freedom | 0.4558 | 0.3239 |
| 11 | Democracy Index | −0.1524 | 0.0577 |
| 12 | Unemployment rate | 0.0353 | 0.0552 |
| 13 | Healthy life expectancy | 0.0047 | 0.0696 |
| 14 | Fragile state index | −0.0008 | 0.0246 |
| 15 | Economic decline index | 0.0147 | −0.0301 |
| Publications—Country Success | Times Cited—Country Success |
|---|---|
| Model 1 (CSPN) | Model 2 (CSPC) |
| When a country’s success increases by 1%, the indicator improves by | |
| 1.962% | 2.101% |
| The 17 independent variables explain the dependent variable under analysis by | |
| 89.5% | 54.0% |
| Tool | Benefits | Limitations |
|---|---|---|
| Electroencephalography (EEG) | Can be used to measure rapid changes in neural activity by the millisecond [588] Minimally invasive and/or commercial research packages are available [588] Participants can move around and benefit from enriched/social environments [588] Uses portable instruments and natural environments; there is long tradition of well-controlled experiments; measurement processes requiring several hours are possible in practice [589] | It is difficult to pinpoint neural signals from particular brain areas (poor spatial resolution) [588] Measurements from structures deep within the brain (e.g., nucleus accumbens) are not possible [588] Published studies on biometrics based on this signal have used high-cost medical equipment [590] Subjects have reported discomfort since it is necessary to apply scalp neck gel to improve conduction between electrodes [590] |
| Functional magnetic resonance imaging (fMRI) | Has the ability to observe activity in small structures [588] Differentiates signal from neighboring areas [588] Measurements of the whole brain are possible [588] | Physically restrictive; participants lie on their back in the scanner and cannot move around [588] Expensive, and equipment is in high demand [588] Equipment cannot be removed from the laboratory; the sequence of the activities is difficult to monitor [589] |
| MEG (magnetoencephalography) | Some MEG study protocols are quite well suited for design studies; there is a long tradition of well-controlled experiments based on EEG; optimal space-time-resolution [589] | Equipment cannot be removed from the laboratory; the location of existing brain activity is relatively difficult to determine [589] |
| Electrocardiogram (ECG) | Highly reliable source providing precise features of the electrical and physiological activity taking place with an individual; high performance has been noted in prior research on this signal [591]; it can easily be fused with other signals [592] | One of the great difficulties listed in the literature is a lack of user acceptance, as its implementation at the physical level makes it fairly uncomfortable [593]; body posture can also affect cardiac signals [594] |
| MRI (magnetic resonance imaging) [589] | Good for studies comparing groups of people | Equipment cannot be removed from the laboratory |
| PET (positron emission tomography) [589] | Good for comparing groups of people or natural tasks | Radioactive tracer is injected into participants; equipment cannot be removed from the laboratory |
| Eye tracking [588] | Offers strong nuanced data on visual attention and gaze pathways, and can be integrated with pupillometry | Does not measure inferences, the valence of the response, thoughts, or emotions |
| Iris [595] | Unique data; input is stable throughout lifetime; non-intrusive | Large data template; images are frequently improperly focused; single-source; high cost |
| NIRS (near-infrared spectroscopy) [589] | Uses portable instruments and natural environments; some NIRS study protocols are well suited for design studies; measurement processes requiring several hours are possible in practice | Difficulties in determining the location of brain activity; few groups are using NIRS for cognitive studies as yet |
| Transcranial magnetic stimulation (TMS/tDCS) [588] | Can be used to show causality | Limited to investigating the function of brain surface areas Can generally only lessen (TMS/tDCS) or increase (tDCS) neural activity in a general sense; cannot test for specific levels of activity or influence specific circuits |
| Forehead electrooculogram (EOG) | These signals are low cost, and are not invasive [596] | Electrodes used for the acquisition of the signals can present instability to eye flicker [597]; signals are highly affected by noises in the immediate vicinity [596] |
| Skin conductance response (SCR), heart rate, pupil dilation [588] | Simple; well validated Unobtrusive equipment; allows for more natural interactions with the environment | Cannot distinguish between positive and negative arousal |
| Lips [598] | Easy acquisition and lip characteristics; it is possible to extract the outline even if the person has a beard or a moustache | An image of the lips cannot be acquired when they are moving |
| Facial electromyography (fEMG), facial affective coding [599] | This is a precise and sensitive method for measuring emotional expression Unlike self-reports, fEMG does not depend on language and does not require cognitive effort or memory Yields large amounts of data and is continuous and scalable (hence more credible) Dynamic tracking of emotional (potentially unconscious) responses to ongoing stimuli/information Can measure facial muscle activities for the sake of balancing weakly evocative emotional stimuli Less intrusive than other physiological measures such as fMRI and EEG Automatic facial encoding software/algorithms are available | The technique is intrusive and may alter natural expression The number of muscles that can be triggered is limited by how many electrodes can be attached to the face Requires electrodes to be directly attached to the face (in a lab) Certain medicines that act on the nervous system, such as muscle relaxants and anticholinergics, can impact the final electromyography (EMG) result |
| Gait | Convenient and non-intrusive (2D); subjects can be evaluated covertly, without their knowledge [595] | During the assessment stage, light affects the results; clothing may affect detection [46] Data may alter throughout a lifetime (injuries, training, footwear); specialist personnel required for data processing; large data template [595] |
| Body motion [595] | Unique and various sources of data, small template size | Time consuming; subject must cooperate with reader; specialist personnel required for data processing |
| Universality | Uniqueness or Distinctiveness | Permanence | Collectability | Performance | Acceptability | Circumvention | |
|---|---|---|---|---|---|---|---|
| Iris/pupil | High [141,602,603,604,605,606] | High [141,602,603,604,605,606] | High [141,602,603,604,605,606] | Medium [141,602,603,604,605,606] | High [141,602,603,604,605,606] | Low [141,602,604,605,606] Medium [603] | High [141,602] Low [603,604,605,606] |
| Face | High [141,602,603,604,605,606] | Low [141,602,604,605,606] Medium [603] | Medium [141,602,603,604,605,606] | High [141,602,603,604,605,606] | Low [141,602,603,604,605,606] | High [141,602,603,604,605,606] | Low [141,602] High [603,604,605,606] |
| Odor | High [602,603,604,605,606] | High [602,603,604,605,606] | High [602,603,604,605,606] | Low [602,603,604,605,606] | High [602,603] Low [604,605,606] | Low [602] Medium [603,604,605,606] | Low [602,603,604,605,606] |
| Keystroke dynamics and mouse movements, Mouse Tracking | Low [141,602,604,605,606] | Low [141,602,604,605,606] | Low [141,602,604,605,606] | Medium [141,602,604,605,606] | Low [141,602,604,605,606] | Medium [141,602,604,605,606] | Medium [141,602,604,605,606] |
| Skin temperature -thermogram | High [141,604,605,606] | High [141,604,605,606] | Low [141,604,605,606] | High [141,604,605,606] | Medium [141,604,605,606] | High [141,604,605,606] | High [141] Low [604,605,606] |
| Voice/Speech/Voice Pitch Analysis (VPA) | Medium [141,602,604,605,606] | Low [141,602,604,605,606] | Low [141,602,604,605,606] | Medium [141,602,604,605,606] | Low [141,602,604,605,606] | High [141,602,604,605,606] | Low [141,602] High [604,605,606] |
| Signature | Low [141,602,603,604,605,606] | Low [141,602,603,604,605,606] | Low [141,602,603,604,605,606] | High [141,602,603,604,605,606] | Low [141,602,604,605,606] Medium [606] | High [141,602,603,604,605,606] | Low [141,602] High [603,604,605,606] |
| Gait | Medium [602,604,605,606] High [603] | Low [141,604,605,606] Medium [603] | Low [141,604,605,606] Medium [603] | High [602,603,604,605,606] | Low [602,603,604,605,606] | High [602,604,605,606] Medium [603] | Medium [602,603,604,605,606] |
| Easy of Use | Error Incidence | Accuracy | User Acceptance | Long Term Stability | Cost | Size of Template | Security | Socially Introduced | Social Acceptability | Popularity | Speed | |
|---|---|---|---|---|---|---|---|---|---|---|---|---|
| Eye Tracking (ET) | 0.5°–1° [607] | Low-High [608] | ||||||||||
| Iris/pupil | Medium [602,603,609] | Lighting [602,609] Lighting, glasses [603] | Very High [602,609] High [320,603,610,611] | Medium [602,609] | High [602,609,610] Medium [320,603] | High [320,603,611] | Small [320] | Medium [320] High [603] Very high [609] | 1995 [603] | Medium-Low [610,611] | Medium [603] | Medium [603] |
| Face | Medium [602,609] High [603] | Lighting, age glasses, hair [602,603,609] | High [602,609] Low [320,602] Medium-Low [610,611] | Medium [602,609] | Medium [602,609] Low [320,602] | High [320] Medium [602,610,611] | Large [320] | Low [320] Medium [602,610,611] | 2000 [603] | High [610,611] | High [603] | Medium [603] |
| Keystroke dynamics and mouse movements, Mouse Tracking | Low [602] | Device, weather [602] | Low [602] | Low [602] | Medium [602] | Low [602] | 2005 [603] | Low [603] | Medium [603] | |||
| Voice/Speech/Voice Pitch Analysis (VPA) | High [602,603,609] | Noise, colds [602,603,609] | High [602,609] Low [320,603] Medium [610,611] | High [602,609] | Medium [602,603,609] Low [320] | Medium [320,610,611] Low [603] | Small [320] | Low [320] High [603] Medium [609] | 1998 [603] | High [610,611] | High [603] | High [603] |
| Signature | High [602,603,609] | Changing signature [602,603,609] | High [602,609] Medium [320,603] Low [610,611] | High [602] Very High [609] | Medium [602,609] Low [320,603] | Low [320] Medium [603,610,611] | Medium [320] | Low [320] High [603] Medium [609] | 1970 [603] | High [610,611] | High [603] | High [603] |
| Gait | Medium [610] | Medium [610] | Low [610] | |||||||||
| Lip Movement | Medium [603] | Medium [603] | Medium [603] | Small [603] | High [603] | |||||||
| Gesture | Low [612] |
| FAR | FRR | CER | FTE | |
|---|---|---|---|---|
| Iris/pupil | 0.94% [603] 0.0001–0.94 [613] 2.4649% [614] | 0.99% [603] 0.99–0.91 [613] 2.4614% [614] | 0.01% [603] | 0.50% [603] |
| Face | 1% [603] 16% [614] | 10% [603] 16% [614] | 3.1% [615] | |
| Keystroke dynamics and mouse movements, Mouse Tracking | 7% [603] 0.01% [614] | 0.10% [603] 4% [614] | 1.80% [603] | |
| Voice/Speech/Voice Pitch Analysis (VPA) | 2% [603,613] 7% [614] | 10% [603,613] 7% [614] | 6% [603] | 0.5% [615] |
Publisher’s Note: MDPI stays neutral with regard to jurisdictional claims in published maps and institutional affiliations. |
© 2022 by the authors. Licensee MDPI, Basel, Switzerland. This article is an open access article distributed under the terms and conditions of the Creative Commons Attribution (CC BY) license (https://creativecommons.org/licenses/by/4.0/).
Share and Cite
Kaklauskas, A.; Abraham, A.; Ubarte, I.; Kliukas, R.; Luksaite, V.; Binkyte-Veliene, A.; Vetloviene, I.; Kaklauskiene, L. A Review of AI Cloud and Edge Sensors, Methods, and Applications for the Recognition of Emotional, Affective and Physiological States. Sensors 2022, 22, 7824. https://doi.org/10.3390/s22207824
Kaklauskas A, Abraham A, Ubarte I, Kliukas R, Luksaite V, Binkyte-Veliene A, Vetloviene I, Kaklauskiene L. A Review of AI Cloud and Edge Sensors, Methods, and Applications for the Recognition of Emotional, Affective and Physiological States. Sensors. 2022; 22(20):7824. https://doi.org/10.3390/s22207824
Chicago/Turabian StyleKaklauskas, Arturas, Ajith Abraham, Ieva Ubarte, Romualdas Kliukas, Vaida Luksaite, Arune Binkyte-Veliene, Ingrida Vetloviene, and Loreta Kaklauskiene. 2022. "A Review of AI Cloud and Edge Sensors, Methods, and Applications for the Recognition of Emotional, Affective and Physiological States" Sensors 22, no. 20: 7824. https://doi.org/10.3390/s22207824
APA StyleKaklauskas, A., Abraham, A., Ubarte, I., Kliukas, R., Luksaite, V., Binkyte-Veliene, A., Vetloviene, I., & Kaklauskiene, L. (2022). A Review of AI Cloud and Edge Sensors, Methods, and Applications for the Recognition of Emotional, Affective and Physiological States. Sensors, 22(20), 7824. https://doi.org/10.3390/s22207824