Article

Novel Electrochemical Sensors Based on L-Proline Assisted LDH for H2O2 Determination in Healthy and Diabetic Urine

by
Mauro Tomassetti
1,2,*,
Riccardo Pezzilli
3,*,
Giuseppe Prestopino
3,
Corrado Di Natale
1 and
Pier Gianni Medaglia
3
1
Department of Electronic Engineering, University of Rome ‘‘Tor Vergata’’, Viale del Politecnico 1, 00133 Rome, Italy
2
Department of Chemistry, University of Rome “La Sapienza”, P.le A. Moro 5, 00185 Rome, Italy
3
Department of Industrial Engineering, University of Rome ‘‘Tor Vergata’’, Viale del Politecnico 1, 00133 Rome, Italy
*
Authors to whom correspondence should be addressed.
Sensors 2022, 22(19), 7159; https://doi.org/10.3390/s22197159
Submission received: 20 July 2022 / Revised: 12 September 2022 / Accepted: 17 September 2022 / Published: 21 September 2022

Abstract

:
In this paper, a novel non-enzymatic modified glassy carbon (GC) sensor, of the (GC-Agpaste)-catalytic proline-assisted LDH type, for H2O2 determination was fabricated, studied, characterized and employed to determine the hydrogen peroxide content in healthy and diabetic human urine. LDH (whose composition can be schematized as [ZnIIAlIII (OH)2]+ NO3·nH2O) is glued to glassy carbon by means of silver paste, while proline, which increases the catalytic properties of LDH, is used free in solution in the phosphate buffer. A voltametric survey was first conducted to ascertain the positive effect induced by the presence of proline, i.e., the increase of sensor sensitivity. Then a deep study of the new three-electrode amperometric proline-assisted LDH sensor, whose working electrode was of the same type as the one used to perform the cyclic voltammetry, was carried out, working at first in static air, then in a nitrogen atmosphere. Possible interferences from various substances, both oxidants and antioxidants, were also investigated. Lastly, the new amperometric sensor was successfully used to determine the H2O2 level in human urine from both healthy and diabetic subjects. The effect of proline in enhancing the properties of the sensor system was also investigated. The limit of detection (LOD) of the new catalytic sensor was of the order of 0.15 mmol L−1, working in air, and of 0.05 µmol L−1, working in nitrogen atmosphere.

Graphical Abstract

1. Introduction

The determination of hydrogen peroxide is of considerable importance in chemistry, since H2O2 is present in numerous real matrices, such as several pharmaceutical disinfectant preparations [1], is used in the treatment of organic waste and industrial stream [2], in the agro-food industry [2] (especially in the dairy industry [3]), and it is also contained in many cosmetic products [4]. In more recent times, the importance of H2O2 has also been recognized in the biomedical field; in fact, it is believed that H2O2 plays a very important role both in cell proliferation and death and in the transduction of intracellular signals [5,6]. Therefore, a high H2O2 level in biological systems is associated with oxidative stress and neurodegenerative disorders [7], so much so that the endogenous hydrogen peroxide efflux in living cells deserves to be evaluated as a biomarker for cancer diagnostics [8]. Hence, the need to develop very sensitive methods of H2O2 determination in biological fluids such as plasma and urine and even in living cells [9] has gained increasing attention. Colorimetric [10,11], spectrophotometric [12,13,14], enzymatic [15,16], and chemiluminescent [17] methods for hydrogen peroxide determination are well known and widely used. However, electrochemical methods are often preferred, since they are generally faster, direct, and less expensive [18,19,20]. It should also be noted that in most of the above-mentioned applications, very sensitive analysis routes featuring very low detection limits are required; non-invasiveness, practicality, and possibly low cost are also desired. Among these, the electroenzymatic methods [21,22] are the most used, since they are generally selective, as well as sensitive and specific. However, electroenzymatic methods, like those based on enzymatic biosensors, as well as all enzymatic methods, are generally quite expensive and their response is often not very stable, especially if used for long periods without the enzyme being properly stored. They also require a good immobilization of the enzyme on a special support, which complicates practical use. For these reasons, the development of non-enzymatic electrocatalytic platforms for the determination of H2O2 has been very dynamic in recent years, mainly based on nanomaterials of noble metals such as silver, gold, or platinum [23,24,25,26,27,28]. Electrocatalytic sensors based on metals such as copper, iron, manganese, or their oxides [29], or on silver oxides [23] have also been developed. Recent research efforts to obtain new types of electrocatalytic sensors, responsive, for example, to H2O2, have led to the introduction of atomically thick metal multicomponent active supports. Among them, the so-called layered double hydroxides (LDHs), a class of inorganic materials with layered structure, have proven to be very useful and suitable for the development of electrocatalytic sensors [30,31,32,33]. In this regard, we recently published [34] the development of a glassy carbon (GC-Agpaste)-LDH-catalase enzyme biosensor and a non-enzymatic amperometric glassy carbon sensor of the same type, for the determination of hydrogen peroxide, both based on layered double hydroxide of the [ZnIIAlIII (OH)2]+ NO3 · nH2O type. The former, being a biosensor, naturally resulted in a greater sensitivity than the latter, in fact limits of detection (LOD) of 0.2 mmol L−1 and of 1.0 mmol L−1 were found, respectively. In a subsequent work, in order to overcome some practical issues in the measurement of real samples containing H2O2, a second type of enzymatic biosensor was also developed [35], again based on LDH and catalase, but using a Clark-type electrode rather than a GC electrochemical transducer. Despite the good results already obtained with the previously reported [34] enzymatic (GC-Agpaste)-LDH-catalase biosensor (linearity range 0.2–160 mmol L−1), the present work conversely deals with the possibility of significantly improving the performance of the more-simple (GC-Agpaste)-LDH non-enzymatic sensor. In fact, recent reports on non-enzymatic electrocatalytic sensors, usually based on nanocomposites, report outstanding performance in detecting hydrogen peroxide [36,37,38,39,40]. Among these, the ones that most impressed us are those sensors that used LDH [32,36,37,40] or make use of L-proline [38,39,41]. We therefore tested whether the response of our previous catalytic non-enzymatic sensor, not yet studied in depth [34], a glassy carbon-modified by LDH, the latter glued on the GC by means of silver paste, could be significantly improved by the presence of L-proline in solution. Indeed, the preliminary results have been very positive; in the present paper we studied this amperometric sensor thoroughly, also applying it to the determination of hydrogen peroxide in real matrices (human urines).

2. Materials and Methods

2.1. Materials

Zinc nitrate hexahydrate (Zn (NO3)2 · 6 H2O) and aluminium nitrate nonahydrate (Al (NO3)3 · 9 H2O), L-proline (BioUltra, 99.5%), potassium permanganate (ACS), iron (III) chloride, glucose monohydrate, L(+)-ascorbic acid, and folic acid were supplied by Sigma-Aldrich (Steinheim, Germany). Sodium hydroxide and 0.1 mol L−1 pH 7 phosphate buffer solution (PBS) were from Fisher Scientific (Loughborough, UK), the uric acid and potassium chloride from Fluka BioChemika (Buchs, Switzerland), and the sodium nitrite and sodium nitrate (analytical grade) from Carlo Erba (Milan, Italy). Silver paste was also used (Agar Scientific, Stansted Essex, England, UK, 60% solid silver in 4-methylpentan-2-one).

2.2. LDH Preparation and Characterization

In our previously published works [34,35], hydrothermal growth [42], a mild method, was used to obtain the [ZnIIAlIII (OH)2]+ NO3·nH2O LDH, hereinafter referred to as (Zn-Al-NO3, see Figure S1). This method was chosen over several other synthesis routes, for example the simple coprecipitation method [43], the sol-gel technique [44], or the fabrication of different LDH compounds through anion exchange reactions or calcination-reconstruction methods [45,46], since it was considered a “green method” [47,48]. In this work, the coprecipitation method was used for the synthesis of LDH. This choice was the most convenient for practical reasons; indeed, the hydrothermal growth method previously used [41,46] does not have a very high synthesis yield compared to the coprecipitation method [43]. For this reason, in the present work, we opted for the latter method.
For this purpose, to obtain LDH of the type (Zn-Al-NO3), 50 mmol L−1 of aluminium nitrate and 150 mmol L−1 of zinc nitrate were dissolved in 200 mL of distilled and deionized water and then the solution was adjusted to pH 10 with NaOH in a closed container; the latter was placed in an oven at 90 °C for 12 h. The precipitate, i.e., LDH, was centrifuged and washed repeatedly with ethanol and deionized water, then dried at 45 °C and stored at room temperature.
The structural characterization of the product obtained was carried out by X-ray diffraction (XRD). A RIGAKU Geigerflex θ–2θ Bragg–Brentano diffractometer equipped with a Cu target (λCu Kα = 1.5418 Å), refurbished with a goniometer control system by DFP Technologies, and equipped with a Cyberstar scintillation detector was used. In Figure S2, the XRD pattern of the LDH, prepared by coprecipitation, is compared with that of the LDH previously obtained by means of the hydrothermal grown process [34]. A perfect superimposition of the two XRD spectra can be clearly observed, indicating the same layered structure of the two raw materials.

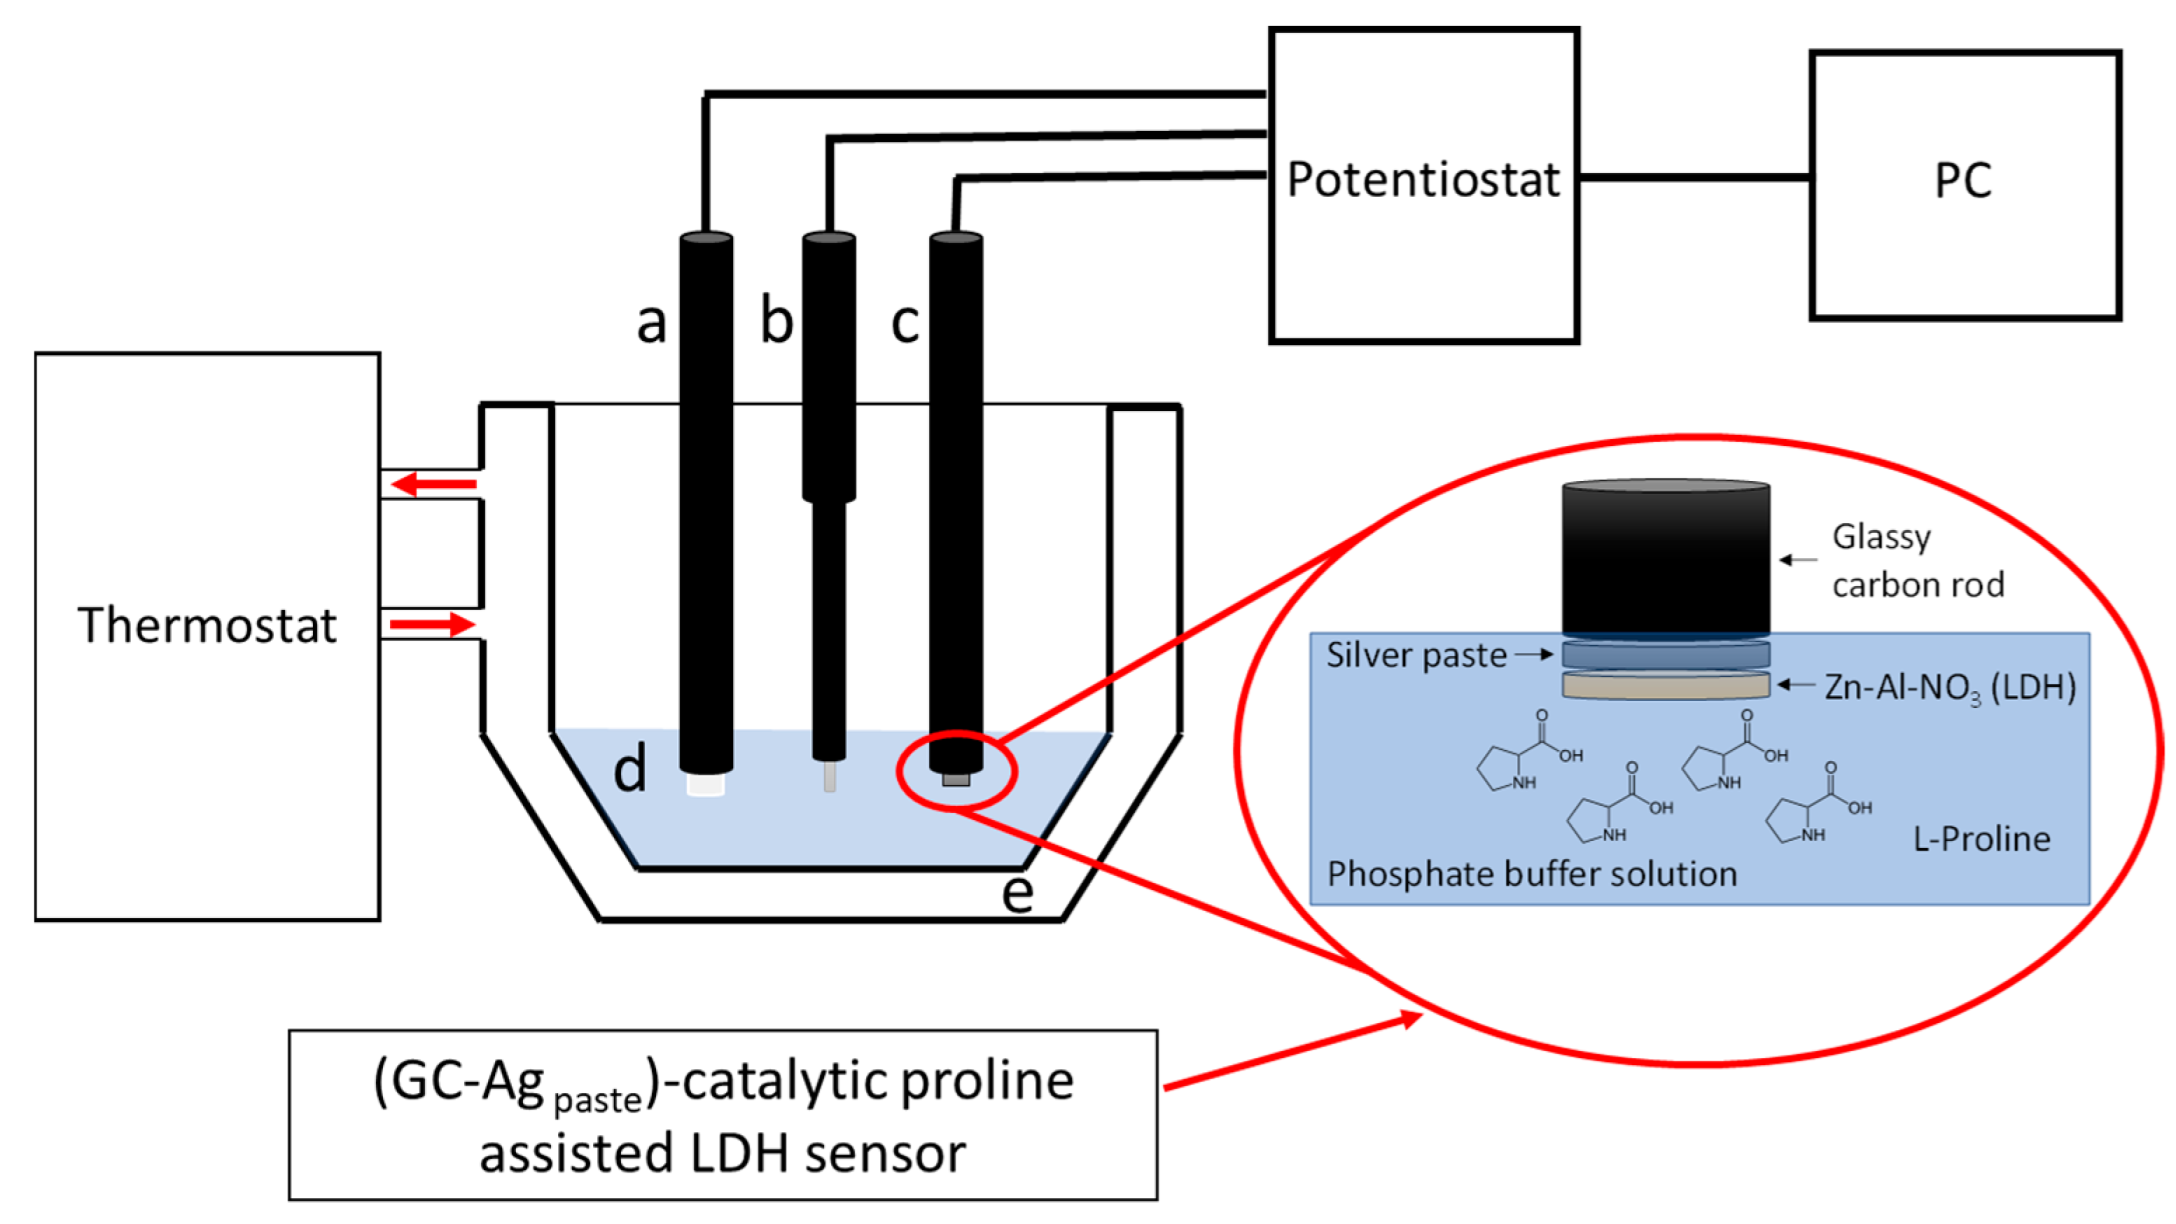
2.3. Sensor Preparation

The GC electrodes were modified according to the same format used in our previous work [34]. A schematic of the modified electrode is shown in Figure S3A. First, the surface head of the GC cylindrical rod (0.5 cm in diameter) was polished with sandpaper, rinsed with deionized water and ethanol, and finally dried. Then, 15 mg of (Zn-Al-NO3) LDH, gently homogenized, was glued on the GC electrode surface, which was previously smeared with a very thin coat of silver paste glue. Finally, the cylindrical head of the LDH-modified GC electrode was gently screwed to the end of the electrode stem.
In the Figure S3B, a schematic of the (GC-Agpaste)-catalytic proline-assisted LDH electrode, used in the present paper, is reported for comparison.

2.4. Electrochemical Apparatus and Experimental Measurements

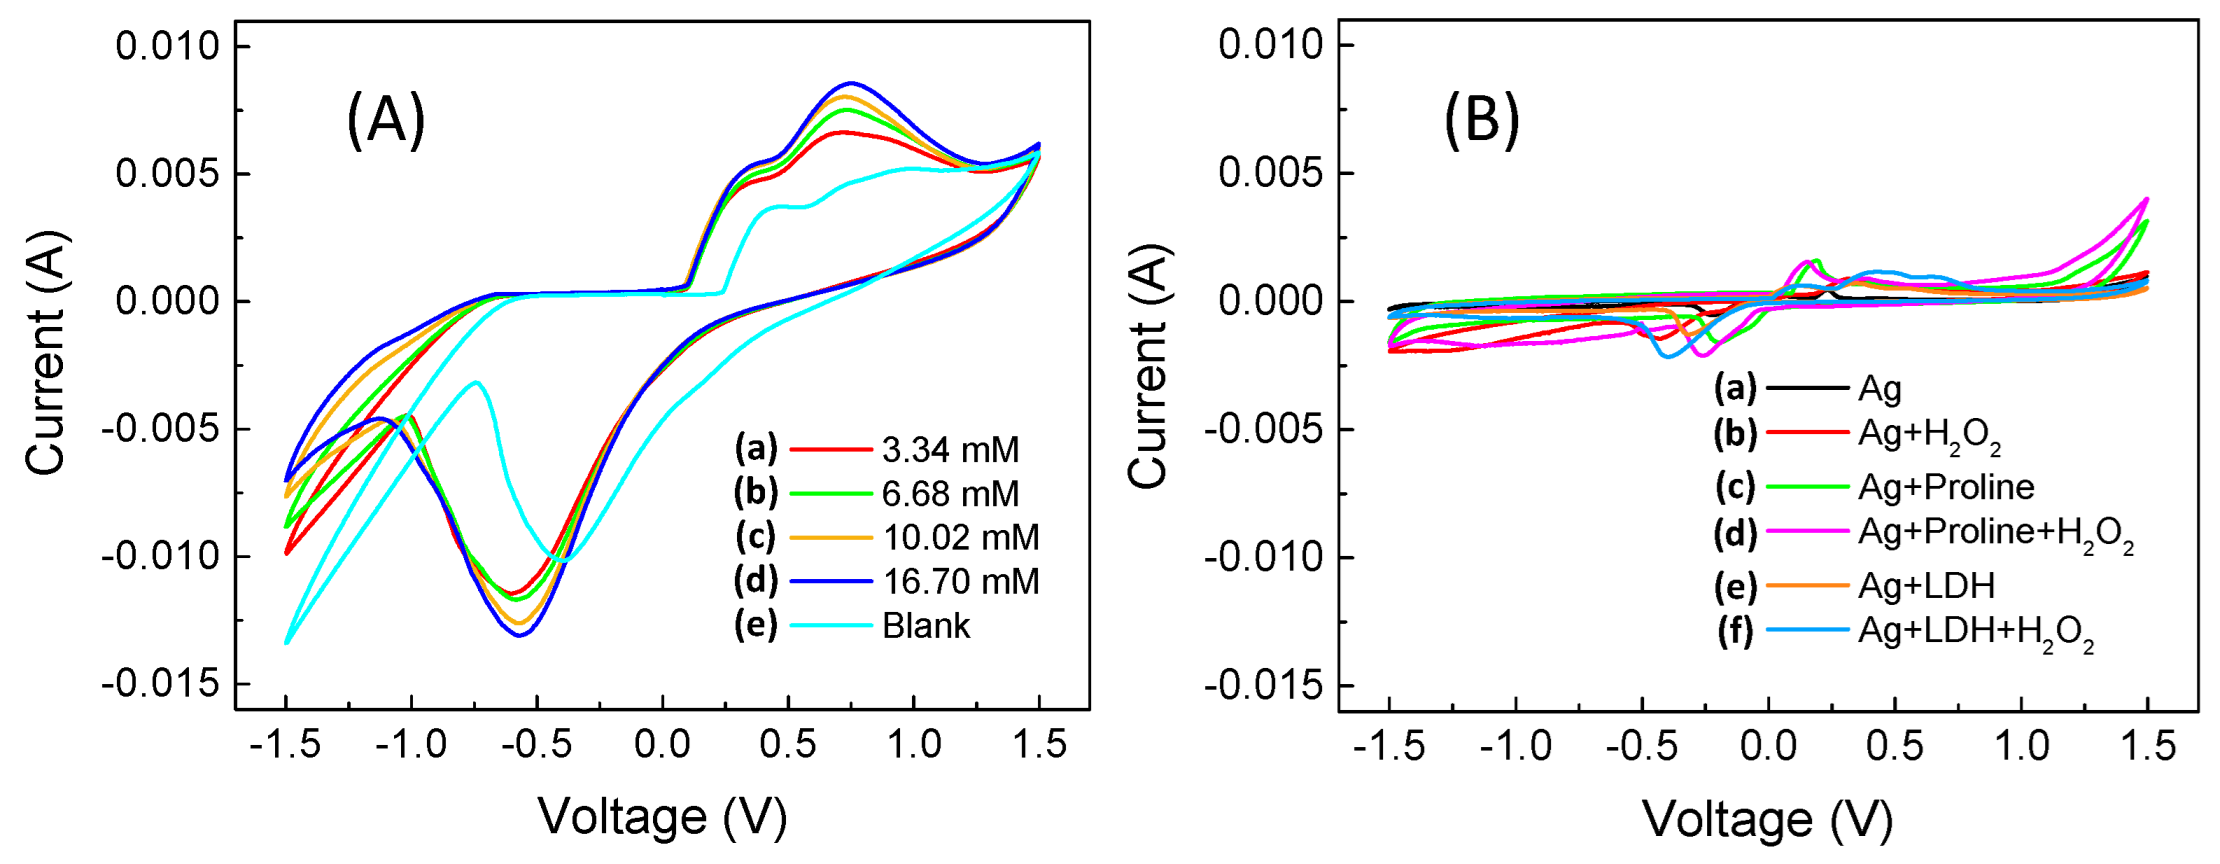
2.4.1. Cyclic Voltammetry

All cyclic voltammetric measurements (CVs) were made from −1.5 V to +1.5 V with a scan rate of 40 mV s−1 using a VersaSTAT3 Potentiostat (AMETEK Scientific Instruments, Princeton, NJ, USA), a glass cell (thermostated at 25 °C), and three electrodes, namely, the working electrode (i.e., the modified GC electrode), a platinum counter electrode, and a reference electrode of Ag/AgCl/Cl. The three electrodes were dipped in 40 mL of 0.1 mol L−1, pH 7, phosphate buffer, 50 mmol L−1 in KCl and 20 mmol L−1 in L-Proline. The trends of the CV curves and the related blanks were recorded up to a final concentration of hydrogen peroxide equal to 3.34 mmol L−1. The voltammetric calibration curves were obtained by reading the current peak at −0.58 V vs. Ag/AgCl/Cl, i.e., practically at the same potential identified by Zhao et al. [38], by adding different volumes (20–200 µL) of 10% H2O2 solution.

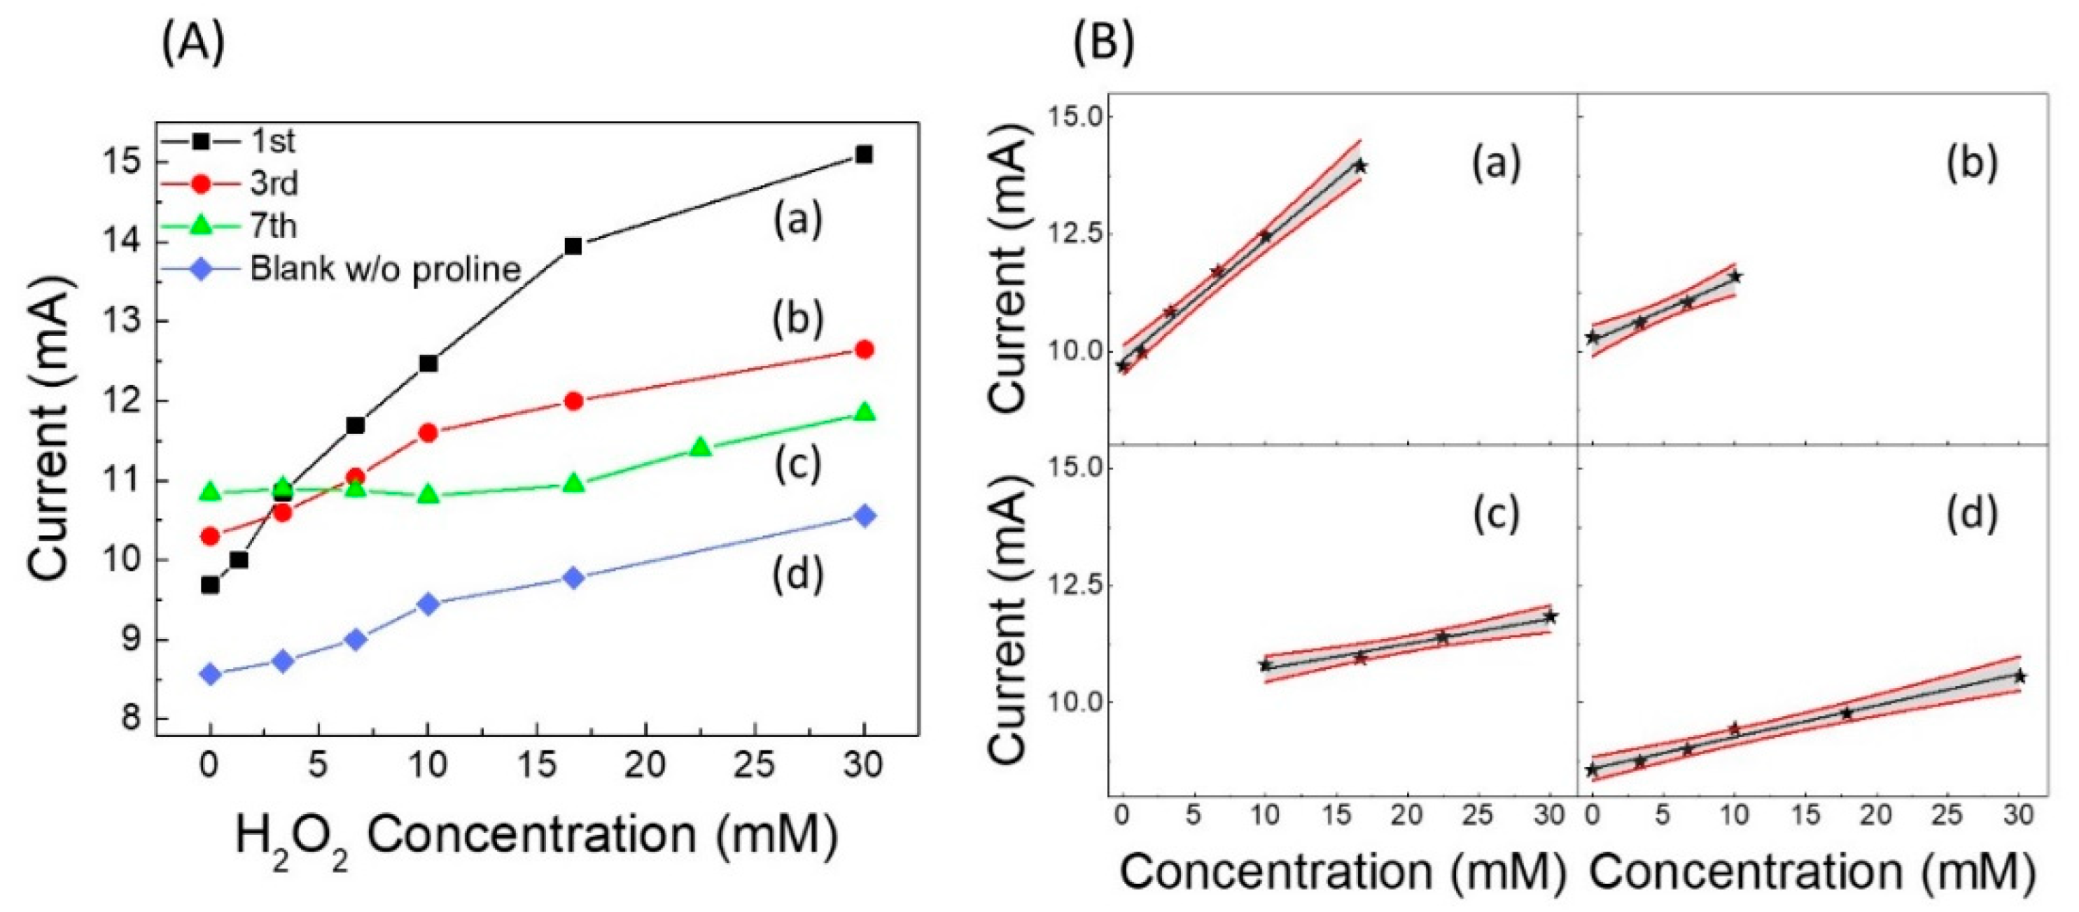
2.4.2. Amperometric Measurements

Amperometric experiments were carried out under the same conditions as the CV measurements using the same apparatus and the same three-electrode system, but under stirring (i.e., using a magnetic stirrer and a fly). In constructing the calibration curves, the change in volume after each addition of the hydrogen peroxide solution was taken into account, even though the volume variations were minimal.
Before performing amperometric measurements, the current response of the catalytic sensor was allowed to stabilize, with the electrode dipped in buffer solution for at least 5 min under gently stirring at a constant anode–cathode voltage difference equal to −0.58 V. After that, the calibration curves were collected by adding, time by time, subsequent fixed volumes (i.e., 150–200 µL) of 3% standard H2O2 aqueous solution, and observing as the current intensity varied immediately after each addition due to the immobilized LDH which catalysed the following reaction:
2 H 2 O 2 LDH   Catalyst   O 2 + 2 H 2 O
The produced oxygen was immediately reduced at the cathode of the GC-modified electrode according to Reaction (2):
O 2 + 4 H + + 4 e 2 H 2 O
causing the variation of the current in the external circuit which was recorded once the steady state was reached after each addition.
The possible interfering substances were also tested, following the same experimental format used to test the response to standard H2O2 solutions, by comparing the sensor response in the absence and in the presence of each of the tested interferents contained in solution at the same concentration as H2O2.
The same measurements were also performed under a nitrogen stream according to the same protocol explained above. In this case a special thermostated sealed cell was employed inside which a nitrogen atmosphere was maintained, instead of air, after the sample itself was deprived of dissolved oxygen by bubbling nitrogen until saturation.
The application of the standard addition method was performed, using the standard additions of hydrogen peroxide solutions, operating in matrix (healthy or diabetic urine), in practice with the same format described above.

2.4.3. Real Sample Analysis

The analyses of urine samples (donated by two subjects), recognized by the health authority as healthy and suffering from diabetes, respectively, were conducted with the same amperometric methods described above. However, in this case, the calibrations were carried out “in matrix”, using the following format. The three electrodes were initially immersed in 20 mL of the usual phosphate buffer, KCl, and proline solution, under stirring. After the current was stabilized, the first current reading was taken. Then, 20 mL of the urine sample was quickly added, and, after new stabilization, the second current reading was taken. Finally, successive additions were made, time by time, of 50 µL of 0.3% H2O2 standard solution, reading the current variations after each new addition.
The H2O2 concentration in the sample was calculated both with the linear interpolation method of the standard calibration curve built in matrix [37] and with the Gran’s plot method [49,50]. Obviously, the effective concentration of H2O2 present in the urine sample was found by doubling the concentration obtained with these two methods, since in our measurements the initial concentration of the 20 mL of sample was halved in the 40 mL of the final solution analysed; also in this case, the variations in the volume of the solution after each addition of hydrogen peroxide was taken into account, although they were minimal.

2.4.4. Clark Catalytic LDH Amperometric Sensor ·Preparation and Measurements·

To better clarify the effect of proline and verify where it actually positively acted on the used (GC-Agpaste)-catalytic proline-assisted LDH—that is, on Ag, on LDH, or both—a modified Clark-type amperometric sensor very similar to the one described in our previous work [35] was also fabricated but without using, of course, any enzyme. To this end, 15 mg of the synthesized (Zn-Al-NO3) LDH and 30 mg of L-proline were placed in the center of a damp dialysis membrane (D-9777, Sigma-Aldrich) and then gently homogenized after adding two drops (about 10 µ L) of pH 7 and 0.1 mol L−1 phosphate buffer. Lastly, the dialysis membrane containing the LDH and proline was gently stretched at the end of a Clark electrode using a small rubber O-ring, so that the LDH and proline remained rinsed between the dialysis and the gas permeable membranes. The cathode was a cylindrical platinum bar (1.0 mm in diameter) biased at −0.6 V with respect to the anode. The latter was a small cylindrical tube (5.65 mm in diameter) made of Ag/AgCl/Cl, concentric to the cathode and separated from it by a plastic insulator. Anode and cathode were enclosed in a stainless-steel case (12 mm in diameter) closed at one end by a gas-permeable membrane (BO5279B from YSI incorporated, Yellow Spring Instrument, Yellow Springs, OH, USA), which was stretched and fastened with a rubber O-ring. The inner tube was filled with KCl 0.05 mol L−1 solution. The amperometric measurements were performed in a glass cell thermostated at 25 °C, under stirring. The tip of the assembled electrode was then dipped in 20 mL of 0.1 mol L−1 phosphate buffer, in the glass cell, after applying a constant (Pt) cathode–anode voltage of −0.6 V. The sensor response was allowed to stabilize for about 20 min, thereby allowing the buffer solution to permeate the dialysis membrane, solubilizing the proline rinsed between the two membranes. After that, a calibration curve was built by adding 50 µL of 3% by weight hydrogen peroxide standard solution each time. A current variation in the external circuit was observed after each addition, owing to the immobilized LDH catalysed the same reaction (1) reported above. The produced oxygen, after crossing the gas-permeable membrane, was immediately reduced at the cathode of the Clark electrode, causing the prompt variation of the output current. Also in this case, the volume changes after each addition were considered when determining the calibration curves. A “blank” calibration curve was also constructed by assembling the sensor as described above, but without using the proline rinsed between the two membranes, in order to evaluate the extent of the possible catalytic action of LDH alone. The same experience was then repeated, intercalating silver paste between the two membranes and building the same calibration curves, with and without proline.

3. Results and Discussion

LDH compounds exhibit a certain catalytic property towards H2O2 as reported in the literature [34,35,36,37,40]; accordingly, as already mentioned in the Introduction, our research group has recently built [34] a simple catalytic sensor, working on the basis of Reaction (1) in Section 2.4.2, which made it possible to build an amperometric electrode, which was recently described by us using this kind of LDH compound: [ZnIIAlIII (OH)2]+ NO3·nH2O [34]. In fact, the oxygen produced by the catalytic reaction was reduced to the GC cathode, according to Reaction (2) in Section 2.4.2.
This previously published non-enzymatic catalytic amperometric system [34], from the analytical point of view, showed a LOD (limit of detection) of about 1.0 mmol L−1, a linearity range between about 145 and 1195 mmol L−1, and a rather modest calibration sensitivity approximately equal to 0.001 mA/mmol L−1. However, H. Heli et al. [36] studied a three-electrode amperometric non-enzymatic system for the determination of H2O2 based on a modified working electrode of CP/MWCNTs/CoAl-LDH, where CP (carbon paste) and MWCNTs (multiwall carbon nanotubes), with a LOD of 0.005 mmol L−1, therefore using a sensor little more complex than our previous sensor, i.e., [two electrodes and simple (GC-Agpaste)-LDH, Figure S3A], but not that different, which seems however to have very good performance, superior to that of our sensor (with a LOC of the order of 0.1 mmol L−1). Xu et al. [40] described a gold NP (nano particle) amperometric sensor, modified using a CoMn-LDH, which showed a LOD of 0.06 µmol L−1. Furthermore, Asif et al. [37] studied and built three-electrode non-enzymatic sensors for the determination of H2O2, both voltammetric and amperometric, based on a GC electrode modified with Fe3O4NSs/CuAl-LDH nanohybrids (where Fe3O4NSs = iron oxide-based nanospheres). This system showed a linear range as broad as eight orders of magnitude and a LOD even of the order of nanomoles.
These reports clearly demonstrate that LDH alone exhibits considerable catalytic properties, obviously dependent on the metal ions contained in the crystal structure and on the type of transducer electrode it interacts with. However, another very important aspect, already reported in the literature [37] but very current, according to a recent article by F. Zhao et al. [38], is the effect of some substances, in particular proline, present in solution as such or electropolymerized on the transducer, which seems to greatly increase the sensitivity of electrochemical sensors (voltammetric and amperometric) of the modified GC or CP type. Among the examples proposed in the literature, the following sensors can be cited: one that describes a GC modified with electropolymerized proline [38] for the determination of H2O2, or those concerning CPs modified with ordered mesoporous carbon (OMC) and proline assisted for the determination of different oestrogens [41] or, more specifically, estriol [39]. In particular, the article published on the determination of hydrogen peroxide [38], concerning a non-enzymatic sensor of the GC-AgNPs-proline (also named “L-proline-assisted silver nanoparticles”) type was extremely interesting for our purposes; that is, the sensor based on Ag (or Ag2O) nanoparticles coated with proline, obtained through a process of cyclic voltammetry in the presence of proline, AgNO3, and KNO3 in solution, and so electrodeposited on a GC transducer. In fact, this modified amperometric sensor showed a linearity range, towards H2O2, between 0.0001 and 5.15 mmol L−1 and an LOD of about 0.05 µmol L−1, extremely interesting for a non-enzymatic electrocatalytic sensor aimed at the determination of hydrogen peroxide. These highly positive performances seem to be attributed both to the very extensive surface of the Ag nanoparticles and to the metal itself (silver) due to its high conductivity and excellent catalytic activity toward H2O2, therefore presenting one of the more suitable catalytic materials for H2O2 sensors’ assembly [23]. However, in the article [38], it seems that these excellent performances are largely due to the presence of proline, although its function is not yet completely clear (in this regard also see what is reported later in this article, at the end of the paragraph “Results and Discussion”). Reflecting on these important results reported in the literature, we observed that our previously built non-enzymatic sensor [34], consisting of LDH glued to a GC transducer using silver paste (which, with prolonged exposure to the buffer solution, becomes very similar to a surface of porous silver), was not very different from that of GC-AgNPs used in the article published by F. Zhao et al. [38]. We therefore hypothesized that, even in our case, using meantime a three-electrode system and above all a sensor built according to the scheme, (GC-Agpaste)-catalytic proline-assisted LDH, its catalytic properties towards H2O2 could be significantly increased, thanks to the presence of proline. However, these are properties that the sensor, at least in part, already possesses thanks to the presence of the LDH immobilized on it [36,37,40], although these catalytic properties seem to vary, even significantly, based on the type of LDH used. Therefore, in the present research we have experimented with three-electrode systems for the determination of hydrogen peroxide, both voltammetric and amperometric, based on non-enzymatic (GC-Agpaste)-catalytic proline-assisted LDH sensors. The experimental results, reported below, certainly very positive, seem to fully support the above hypothesis, especially as regards the importance exercised by proline, which seems to increase the catalytic properties of our system.
Inspired by such important results, and since F. Zhao et al. [38] showed that, in a voltammetric three-electrode system using electropolymerization and cyclic voltammetry between −0.8V and 1.5V in PBS, Ag nanoparticles, and proline on glassy carbon electrode, there is an increase in sensitivity towards hydrogen peroxide due to the proline coating of Ag nanoparticles, we carried out similar CV measurements in PBS containing proline using our previously built (GC-Agpaste)-LDH sensor [34] for the determination of H2O2 (Figure 1).
The measured cyclic voltammetric curves are shown in Figure 2A, while the “blank” voltammetric curves are reported in Figure 2B using the same scales from Figure 2A.
In the interval in which we performed the cyclic voltammetry (Figure 2A,B), we are not aware that there are any redox phenomena related specifically to proline (also based on what is reported in the literature). Meanwhile, as regards LDH, the peaks observed in the cathodic section of the voltammograms in both Figure 2A,B, are those relating to the formation of metal hydroxides, Zn(OH)42− and Zn(OH)3, and so on [51,52], see Tomassetti et al. [34], which can be recognized on the basis of the not very intense hump at around 0.4 V. In addition, in Figure 2B we observe the oxidation processes of silver around 0.2 V (reported in the literature [38] at around 0.25 V) and silver reduction (highlighted in the literature [38] at around −0.2 V, but which, in our voltammograms, we observe at −0.35 V). As regards the role of both proline and LDH, it is only that of increasing the intensity of the redox peaks, which actually has greater importance to this research, i.e., the oxygen reduction peak at −0.57 V and the oxidation peak of hydrogen peroxide at +0.7 V (see Figure 2A).
After having optimized the quantity of proline to be used, which was found to be 20 mmol L−1 (see Figure S4), we built a calibration curve vs. the increasing concentration of H2O2 [curve (a) in Figure 3A] by means of cyclic voltammetry carried out in presence of a fixed concentration of proline (20 mmol L−1) in phosphate buffer at pH 7 and 50 mmol L−1 in KCl, reading the current peak at −0.58 V. Comparing this curve with the analogous “blank” curve built on the first day in the absence of proline in solution [see “blank” curve, i.e., curve (d) in Figure 3A], a significant increase in the calibration sensitivity is observed. Similar calibration curves were also built in the days following the sensor assembly, recording the sensor response for about a week. Obviously, a fresh solution containing proline was prepared each day, and the sensor was rinsed with water and stored in air at the end of measurement period. The calibration curves on the third and seventh day are also reported in Figure 3A [curves (b) and (c), respectively]. Figure 3B shows the corresponding calibration straight-lines of curves in Figure 3A, with the relative confidence intervals, and in Figure S5A,B, the bar-charts of the slope and linearity range values are displayed, respectively.
Finally, in Table 1 the equation of the straight line constructed using CV on the first day and that of the blank curve are summarized.
Since the CVs (see Figure 2A) clearly showed a positive effect due to the presence of proline, we also tested its effect on amperometric measurements vs. H2O2. In this case, as previously specified, the measurements were performed under stirring. A schematic representation of the experimental setup is displayed in Figure S6A. Several of the measured amperometric calibration curves, recorded on the first day up to approximately three weeks and including the “blank” curve, are reported in Figure 4A. The working electrode was biased at −0.58 V vs. the reference electrode and dipped in the PBS containing proline (20 mmol L−1). Respective straight-lines and their confidence intervals are shown in Figure S7A–E. The straight-line relative to the blank curve without proline in PBS recorded on the first day (ω) and the calibration straight-line (λ) recorded on 21st day using a fresh buffer solution, but without any new addition of proline, are also shown in Figure 4B.
Interestingly, it can be seen that after three weeks of repeated use, during which the catalytic sensor was regularly polarized at −0.58 V and immersed in the freshly prepared 20 mmol L−1 solution of proline each time, the fabricated sensor still provided a good catalytic response towards H2O2. However, it is interesting to note that a not-negligible response was also achieved even if the measurement was carried out without the usual addition of proline in solution, i.e., with the same sensor used in previous measurements immersed only in phosphate buffer and KCl solution.
These results can be explained by looking to the values of the straight-line slopes reported in Figure 4C. Indeed, up to about the 11th day from the preparation, the slope tends to decrease slowly, probably because the modest organic part of the Agpaste, weakly contained on the pristine silver paste, solubilizes or disperses in solution, and therefore, some small granules of LDH tend to detach from the sensor, while the layer of the silver paste, originally opaque, becomes more and more spongy and brighter. Afterwards, the slope tends to increase, at least until the 21st day of use, reaching a value even higher than that of the 1st day. This happens because, to this point, the sensor is affected both by the concentration of proline added to solution each time and by the proline which remains attached to the sensor after each amperometric experiment, continuing to interact with the remaining LDH, that no longer detaches from the silver paste. As a matter of fact, it is widely reported in the literature that many amino acids can interact very well with various types of LDH [45,53], to the point of being permanently immobilized on them. It was also shown [37] that by carrying out cyclic voltammetry in solutions containing proline and AgNO3, the proline attached to nanoparticles or other surfaces made of silver, probably by electro-polymerization. As far as our experiments are concerned, by repeatedly immersing our sensor, biased at −0.58 V, in a PBS and KCl solution containing 20 mmol L−1 proline under magnetic stirring, a non-negligible amount of proline remained reasonably fixed on the sensor, which in fact acted as a good catalyst towards hydrogen peroxide even without further additions of free proline in solution.
The possibility of interference for our catalytic (GC-Agpaste)-proline-assisted LDH amperometric sensor was investigated by studying its selectivity in the presence of different antioxidant substances and of some highly oxidizing species present in solution. The results were compared with the selectivity observed for the enzymatic and non-enzymatic sensors of the same type, but not proline assisted, previously studied by us [34], as summarized in Table 2. The proline-assisted LDH sensor does not suffer from any interference from the different antioxidant substances studied, such as glucose, uric acid, folic acid, nitrite ion, and even by ascorbic acid, while it naturally suffers from the presence of strong oxidants such as nitrate, Fe (III), or permanganate, in the same way or, in some cases, even slightly less (see the case of nitrate), compared to previous non-proline-assisted sensors [34].
Finally, as already mentioned, the most interesting determinations of hydrogen peroxide are those achievable in real samples containing very small concentrations of H2O2, so we wondered if it was possible to further increase the sensitivity of our proline-assisted LDH catalytic sensor and, at the same time, also decrease the value of its limit of detection. In this regard, purging the solution with an inert gas such as nitrogen or argon was demonstrated to be beneficial as it reduced the interference of the oxygen contained in air when sensing the oxygen resulting from hydrogen peroxide oxidation reaction [54,55,56]. Indeed, under deoxygenated conditions, the lowest detectable signal is that effectively due to the reduction of oxygen, only resulting from the catalytic oxidation of H2O2 (see Reactions (1) and (2) reported above in the Introduction section) and not by the reduction of oxygen coming from the air and dissolved in solution. We therefore decided to repeat the construction of a calibration curve with our (GC-Agpaste)-proline-assisted LDH sensor, using a sealed thermostated cell under a nitrogen stream as schematized in Figure S6B.
In Figure S8, a raw amperometric calibration curve obtained in PBS solution containing proline, under static air (with 21% of oxygen) (Figure S8A), is compared with that obtained by operating in the same solution deoxygenated by N2 (Figure S8B). The two respective calibration curves are displayed in Figure 5A. A significant difference in the calibration sensitivity between the two operating conditions can be clearly observed, as previously shown in Figure 4C, where the slope values of the two straight lines obtained at first day of the lifetime of our sensor operated in air (black bar 1) or under nitrogen (white dotted bar, framed 1) are reported, respectively.
Interestingly, as shown in the inset of Figure 5A, two linearity ranges (Figure 5B,C) were found by the sensor operating in deoxygenated solution, the first one being at very low concentrations (0.05 to 0.22 µmol L−1), and the second one at higher concentrations (0.0012 to 23.3 mmol L−1). This behavior in which the linearity of the response to H2O2 is generally divided into at least two different ranges is well known when operating with catalytic sensors for H2O2 under a nitrogen stream [37,38].
In Table 3, straight-lines equations and best analytical data (with analytical method validation) and data comparison between the present work and from our previous study [34] are summarized. For comparison, data from some of the other main studies concerning catalytic sensors for H2O2 recently reported on in the literature and found by other authors are also tabulated in Table S3 [37,38,57,58,59,60] in the Supplementary Materials.
Given the improved performance under a nitrogen stream, it was thus possible to use our catalytic (GC-Agpaste)-proline-assisted LDH sensor for a difficult application in real samples [37,61,62], i.e., the determination of the level of H2O2 present in human urine, both from a healthy subject and from a diabetic subject. Due to the very low concentrations of hydrogen peroxide contained in these biological matrices, the determinations were performed by constructing calibration curves “in matrix”, then calculating the contained H2O2 values, applying both the regression equation method [37] and the Gran’s plot method [49,50]. The results are shown in Figure 6a,b for the healthy and the diabetic subjects, respectively. The calculations by Gran’s plot method are displayed in the insets. The obtained data are also summarized in Table 4, which includes results from three works reported in the literature [37,61,62] for similar samples from human subjects with the two different health conditions. It is worth noting that, as expected, the level of H2O2 in the diabetic subject is always greater than (about double) that found in the healthy subject.
Looking to the values reported in Table 4, it is also possible to evaluate the accuracy of the proposed method by comparing our hydrogen peroxide data with the values reported in the literature relating to healthy or diabetic patients. It can be observed that the order of magnitude of the values found by us it is practically coincident with that of the data available in the literature.
A further estimation of the accuracy of the method was achieved by applying the “standard addition” method “in matrix”, even though, as is known, the application of this method provides information that is necessary but not entirely sufficient to establish the accuracy of a method (see Table 5). From the results it can regardless be observed that the percentage recoveries were always between 95.1% and 99.8%; therefore the percentage recoveries are certainly satisfactory.
Based on our findings, the presence of proline clearly improves the response of the catalytic sensor. Naturally, we wondered what the mechanism was thanks to which the proline improves the response of the sensor, both by significantly increasing the calibration sensitivity and by lowering the LOD value. In this regard, the literature does not report very concordant opinions and is therefore not entirely convincing. Further difficulties in interpreting the different points of view of different authors derive from the fact that some have developed their methods based on the voltammetric oxidation peaks of H2O2 and others on the reduction of oxygen. The only authors who dwell long enough on the subject are F. Zhao et al. [38], who built a GC sensor on which Ag nanoparticles coated with proline were electrodeposited. According to these authors, the role of proline would, in practice, simply be that of “slowing” the oxidation of Ag0 and the “superior properties” of their sensor should be attributed above all to the stabilizing effect of L-proline which disadvantages the reoxidation of the metallic silver to the silver oxide, slowing the formation of silver oxides, as well as assisting the formation of silver nanoparticles highly dispersed on the GC surface. Since these authors do not use any type of LDH in the construction of their sensor, they therefore attribute all of the positive effects of proline to the interaction between it and the surface of the silver nanoparticles. Additionally, M.L. Charitra et al. [39], who proposed a catalytic sensor for estriol, claim that polyproline would modify the response of their CP transducer, enhancing the electrochemical oxidation of the estriol. Instead, L. Xu et al. [40], who, for the operation of their H2O2 sensor do not use proline but gold nanoparticles on a transducer modified with LDH containing cobalt and manganese ions, observe a “catalytic current” relative to the voltammetric “oxidation” peak of H2O2 much higher than in the case in which the same transducer was not modified by LDH. M. Asif et al. [37], who used LDH containing copper and aluminium ions, in contact with nanospheres of iron oxides, to build their sensor for H2O2—that is, without the use of proline—nevertheless managed to reach an extraordinary LOD value of the order of nmol L−1 and highlight the benefits of using LDH. H. Heli et al. [36], who do not use proline for their H2O2 sensor based on a modified CP transducer with multiwall carbon nanotubes in contact with LDH-based cobalt and aluminium, argue that LDH catalyses both the electrooxidation of hydrogen peroxide and the electroreduction process. Therefore, according to these authors, it is LDH above all that exerts highly positive action, strongly increasing the catalytic current. In the light of these quite different points of view, we have also tried to understand whether the effect of proline, which, as experimentally found, significantly increases the sensitivity of our catalytic amperometric and voltammetric sensors, consists of only a positive cleaning effect that stabilizes metallic silver, or whether there are other effects through which it intervenes, for example, facilitating the mechanisms of electron transfer [37], typical of the metal ions contained in LDH.
To obtain some experimental feedback in this regard, we fabricated a Clark-type gaseous diffusion amperometric electrode, whose schematic diagram is shown in Figure 7A, very similar to the one we built in a previous work [35], but of course non-enzymatic.
In order to separately investigate the role of proline, LDH, and silver paste on the overall catalytic response, calibration curves for H2O2 were built with the transducer being modified by placing between the gas-permeable membrane and the dialysis membrane a mixture of LDH (Zn-Al-NO3) and proline (the same quantity contained in 20 mmol L−1 of PBS solution), or, alternatively, LDH alone or silver paste and proline, or silver paste alone, always operating in PBS solution. In Figure 7B it can be observed that the constructed amperometric straight line obtained using LDH assisted by proline has a much higher slope value than that obtained by operating using LDH without proline. Proline therefore significantly increases the sensitivity of the LDH-based sensor towards H2O2, even without the addition of silver paste, so that any cleaning effect of the Ag0 cannot occur. On the other hand, the silver alone, coming from the silver paste, does not exert by itself a consistent catalytic activity, and the effect of proline addition to the silver paste is almost negligible, showing both these calibration curves to have a very low slope. All this leads to the conclusion that, at least in our case, LDH is essential to improve the performance of the sensor and that proline plays a highly positive role in the presence of LDH, probably facilitating the electronic transfer processes through the metal ions contained in the LDH.

4. Conclusions

In the present research, we demonstrated that by operating with a non-enzymatic (GC-Agpaste)-LDH catalytic amperometric sensor with proline assistance the calibration sensitivity is increased up to about 30 times. The presence of proline clearly increased the catalytic activity of LDH rather than that of the silver coming from the silver paste spread on the GC transducer. It was also observed that, by operating under a nitrogen atmosphere instead of under static air, the LOD of the method can be significantly lowered, from 0.15 mmol L−1 to 0.05 µmol L−1. Furthermore, we observed that the sensor was affected only by the possible interference of very strong oxidizing species, rarely present in real samples, while it is not affected at all by the most common antioxidant substances found in real samples. Lastly, the fabricated (GC-Agpaste) proline-assisted LDH catalytic amperometric sensor, thanks to the great sensitivity towards hydrogen peroxide and to the very low sensitivity to interfering species, could be advantageously used for the analysis of H2O2 in real samples, for instance biological fluids such as human urine samples, since it was capable of distinguishing between samples coming from healthy subjects from those belonging to diabetic patients. This sensor is therefore an effective alternative to similar enzymatic biosensors, more delicate and complex, but ultimately certainly more expensive.

Supplementary Materials

The following supporting information can be downloaded at: https://www.mdpi.com/article/10.3390/s22197159/s1, Figure S1: LDH structure that we used in this research; Figure S2: X-ray diffraction patterns of LDH grown by the coprecipitation method and LDH grown by hydrothermal method; Figure S3: Comparison of our (GC-Agpaste)-LDH non enzymatic sensor previously built and the new (GC-Agpaste)-proline assisted LDH non enzymatic sensor; Figure S4: Optimization of proline concentration; Figure S5: Slope and linearity range as a function of lifetime; Figure S6: Three electrodes amperometric systems working in static air and under nitrogen stream; Figure S7: Straight-lines and confidence intervals as a function of lifetime of the non-enzymatic catalytic (GC-Agpaste)-proline assisted LDH amperometric sensor; Figure S8: Raw amperometric calibration curves of non-enzymatic catalytic (GC-Agpaste)-proline assisted LDH sensor in static air and under nitrogen stream; Table S3: Analytical results from some main recent works, reported in literature, concerning sensors of the same type.

Author Contributions

Conceptualization, M.T.; Data curation, R.P.; Investigation, R.P.; Methodology, M.T. and G.P.; Resources, P.G.M.; Supervision, C.D.N. and P.G.M.; Writing—original draft, M.T.; Writing—review & editing, R.P. and G.P. All authors have read and agreed to the published version of the manuscript.

Funding

This research received no external funding.

Informed Consent Statement

Informed consent was obtained from all subjects involved in the study.

Acknowledgments

This work was logistically supported by University of Rome “Tor Vergata”.

Conflicts of Interest

The authors declare no conflict of interest.

References

  1. United States Pharmacopeia. Hydrogen Peroxide Concentrate; USP Monographs; United States Pharmacopeia (USP-NF): Rockville, MA, USA, 2022. [Google Scholar] [CrossRef]
  2. Perathoner, S.; Centi, G. Wet Hydrogen Peroxide Catalytic Oxidation (WHPCO) of Organic Waste in Agro-Food and Industrial Streams. Top. Catal. 2005, 33, 207–224. [Google Scholar] [CrossRef]
  3. Abbas, M.E.; Luo, W.; Zhu, L.; Zou, J.; Tang, H. Fluorometric Determination of Hydrogen Peroxide in Milk by Using a Fenton Reaction System. Food Chem. 2010, 120, 327–331. [Google Scholar] [CrossRef]
  4. Pereira, T.D.S.; de Oliveira, G.C.M.; Santos, F.A.; Raymundo-Pereira, P.A.; Oliveira, O.N.; Janegitz, B.C. Use of Zein Microspheres to Anchor Carbon Black and Hemoglobin in Electrochemical Biosensors to Detect Hydrogen Peroxide in Cosmetic Products, Food and Biological Fluids. Talanta 2019, 194, 737–744. [Google Scholar] [CrossRef] [PubMed]
  5. Ai, F.; Chen, H.; Zhang, S.-H.; Liu, S.-Y.; Wei, F.; Dong, X.-Y.; Cheng, J.-K.; Huang, W.-H. Real-Time Monitoring of Oxidative Burst from Single Plant Protoplasts Using Microelectrochemical Sensors Modified by Platinum Nanoparticles. Anal. Chem. 2009, 81, 8453–8458. [Google Scholar] [CrossRef] [PubMed]
  6. Maji, S.K.; Sreejith, S.; Mandal, A.K.; Ma, X.; Zhao, Y. Immobilizing Gold Nanoparticles in Mesoporous Silica Covered Reduced Graphene Oxide: A Hybrid Material for Cancer Cell Detection through Hydrogen Peroxide Sensing. ACS Appl. Mater. Interfaces 2014, 6, 13648–13656. [Google Scholar] [CrossRef] [PubMed]
  7. Yu, C.; Wang, L.; Li, W.; Zhu, C.; Bao, N.; Gu, H. Detection of Cellular H2O2 in Living Cells Based on Horseradish Peroxidase at the Interface of Au Nanoparticles Decorated Graphene Oxide. Sens. Actuators B Chem. 2015, 211, 17–24. [Google Scholar] [CrossRef]
  8. Xi, J.; Xie, C.; Zhang, Y.; Wang, L.; Xiao, J.; Duan, X.; Ren, J.; Xiao, F.; Wang, S. Pd Nanoparticles Decorated N-Doped Graphene Quantum Dots@N-Doped Carbon Hollow Nanospheres with High Electrochemical Sensing Performance in Cancer Detection. ACS Appl. Mater. Interfaces 2016, 8, 22563–22573. [Google Scholar] [CrossRef]
  9. Chang, M.C.Y.; Pralle, A.; Isacoff, E.Y.; Chang, C.J. A Selective, Cell-Permeable Optical Probe for Hydrogen Peroxide in Living Cells. J. Am. Chem. Soc. 2004, 126, 15392–15393. [Google Scholar] [CrossRef]
  10. Üzer, A.; Durmazel, S.; Erçağ, E.; Apak, R. Determination of Hydrogen Peroxide and Triacetone Triperoxide (TATP) with a Silver Nanoparticles—Based Turn-on Colorimetric Sensor. Sens. Actuators B Chem. 2017, 247, 98–107. [Google Scholar] [CrossRef]
  11. Nitinaivinij, K.; Parnklang, T.; Thammacharoen, C.; Ekgasit, S.; Wongravee, K. Colorimetric Determination of Hydrogen Peroxide by Morphological Decomposition of Silver Nanoprisms Coupled with Chromaticity Analysis. Anal. Methods 2014, 6, 9816–9824. [Google Scholar] [CrossRef]
  12. Hsu, C.-C.; Lo, Y.-R.; Lin, Y.-C.; Shi, Y.-C.; Li, P.-L. A Spectrometric Method for Hydrogen Peroxide Concentration Measurement with a Reusable and Cost-Efficient Sensor. Sensors 2015, 15, 25716–25729. [Google Scholar] [CrossRef] [PubMed]
  13. Zhang, K. Stopped-Flow Spectrophotometric Determination of Hydrogen Peroxide with Hemoglobin as Catalyst. Talanta 2000, 51, 179–186. [Google Scholar] [CrossRef]
  14. Hoshino, M.; Kamino, S.; Doi, M.; Takada, S.; Mitani, S.; Yanagihara, R.; Asano, M.; Yamaguchi, T.; Fujita, Y. Spectrophotometric Determination of Hydrogen Peroxide with Osmium(VIII) and m-Carboxyphenylfluorone. Spectrochim. Acta. A Mol. Biomol. Spectrosc. 2014, 117, 814–816. [Google Scholar] [CrossRef]
  15. Frew, J.E.; Jones, P.; Scholes, G. Spectrophotometric Determination of Hydrogen Peroxide and Organic Hydropheroxides at Low Concentrations in Aqueous Solution. Anal. Chim. Acta 1983, 155, 139–150. [Google Scholar] [CrossRef]
  16. Zhu, M.; Huang, X.; Liu, L.; Shen, H. Spectrophotometric Determination of Hydrogen Peroxide by Using the Cleavage of Eriochrome Black T in the Presence of Peroxidase. Talanta 1997, 44, 1407–1412. [Google Scholar] [CrossRef]
  17. Sheng, Y.; Yang, H.; Wang, Y.; Han, L.; Zhao, Y.; Fan, A. Silver Nanoclusters-Catalyzed Luminol Chemiluminescence for Hydrogen Peroxide and Uric Acid Detection. Talanta 2017, 166, 268–274. [Google Scholar] [CrossRef]
  18. Chen, W.; Cai, S.; Ren, Q.-Q.; Wen, W.; Zhao, Y.-D. Recent Advances in Electrochemical Sensing for Hydrogen Peroxide: A Review. Analyst 2012, 137, 49–58. [Google Scholar] [CrossRef] [PubMed]
  19. Gulaboski, R.; Mirčeski, V.; Kappl, R.; Hoth, M.; Bozem, M. Review—Quantification of Hydrogen Peroxide by Electrochemical Methods and Electron Spin Resonance Spectroscopy. J. Electrochem. Soc. 2019, 166, G82–G101. [Google Scholar] [CrossRef]
  20. He, J.; Zhou, W.; Sunarso, J.; Xu, X.; Zhong, Y.; Shao, Z.; Chen, X.; Zhu, H. 3D Ordered Macroporous SmCoO3 Perovskite for Highly Active and Selective Hydrogen Peroxide Detection. Electrochim. Acta 2018, 260, 372–383. [Google Scholar] [CrossRef]
  21. Li, C.; Zhang, H.; Wu, P.; Gong, Z.; Xu, G.; Cai, C. Electrochemical Detection of Extracellular Hydrogen Peroxide Released from RAW 264.7 Murine Macrophage Cells Based on Horseradish Peroxidase–Hydroxyapatite Nanohybrids. Analyst 2011, 136, 1116–1123. [Google Scholar] [CrossRef]
  22. Wu, P.; Cai, Z.; Chen, J.; Zhang, H.; Cai, C. Electrochemical Measurement of the Flux of Hydrogen Peroxide Releasing from RAW 264.7 Macrophage Cells Based on Enzyme-Attapulgite Clay Nanohybrids. Biosens. Bioelectron. 2011, 26, 4012–4017. [Google Scholar] [CrossRef] [PubMed]
  23. Nair, A.K.; Sukumaran Nair, K.M.; Thomas, S.; Rouxel, D.; Alwarappan, S.; Kalarikkal, N. In Situ Synthesis of Silver Nanospheres, Nanocubes, and Nanowires over Boron-Doped Graphene Sheets for Surface-Enhanced Raman Scattering Application and Enzyme-Free Detection of Hydrogen Peroxide. Langmuir 2018, 34, 13603–13614. [Google Scholar] [CrossRef] [PubMed]
  24. Gabriel, J.S.; Gonzaga, V.A.M.; Poli, A.L.; Schmitt, C.C. Photochemical Synthesis of Silver Nanoparticles on Chitosans/Montmorillonite Nanocomposite Films and Antibacterial Activity. Carbohydr. Polym. 2017, 171, 202–210. [Google Scholar] [CrossRef]
  25. Shi, L.; Layani, M.; Cai, X.; Zhao, H.; Magdassi, S.; Lan, M. An Inkjet Printed Ag Electrode Fabricated on Plastic Substrate with a Chemical Sintering Approach for the Electrochemical Sensing of Hydrogen Peroxide. Sens. Actuators B Chem. 2018, 256, 938–945. [Google Scholar] [CrossRef]
  26. He, G.-C.; Dong, X.-Z.; Liu, J.; Lu, H.; Zhao, Z.-S. Investigate the Electrical and Thermal Properties of the Low Temperature Resistant Silver Nanowire Fabricated by Two-Beam Laser Technique. Appl. Surf. Sci. 2018, 439, 96–100. [Google Scholar] [CrossRef]
  27. Yang, X.; Ouyang, Y.; Wu, F.; Hu, Y.; Ji, Y.; Wu, Z. Size Controllable Preparation of Gold Nanoparticles Loading on Graphene Sheets@cerium Oxide Nanocomposites Modified Gold Electrode for Nonenzymatic Hydrogen Peroxide Detection. Sens. Actuators B Chem. 2017, 238, 40–47. [Google Scholar] [CrossRef]
  28. Sun, Y.; He, K.; Zhang, Z.; Zhou, A.; Duan, H. Real-Time Electrochemical Detection of Hydrogen Peroxide Secretion in Live Cells by Pt Nanoparticles Decorated Graphene–Carbon Nanotube Hybrid Paper Electrode. Biosens. Bioelectron. 2015, 68, 358–364. [Google Scholar] [CrossRef] [PubMed]
  29. Ganesan, R.; Lee, J.S. Tungsten Carbide Microspheres as a Noble-Metal-Economic Electrocatalyst for Methanol Oxidation. Angew. Chem. Int. Ed. 2005, 44, 6557–6560. [Google Scholar] [CrossRef]
  30. Fan, G.; Li, F.; Evans, D.G.; Duan, X. Catalytic Applications of Layered Double Hydroxides: Recent Advances and Perspectives. Chem. Soc. Rev. 2014, 43, 7040–7066. [Google Scholar] [CrossRef]
  31. Feng, J.; He, Y.; Liu, Y.; Du, Y.; Li, D. Supported Catalysts Based on Layered Double Hydroxides for Catalytic Oxidation and Hydrogenation: General Functionality and Promising Application Prospects. Chem. Soc. Rev. 2015, 44, 5291–5319. [Google Scholar] [CrossRef]
  32. Asif, M.; Aziz, A.; Dao, A.Q.; Hakeem, A.; Wang, H.; Dong, S.; Zhang, G.; Xiao, F.; Liu, H. Real-Time Tracking of Hydrogen Peroxide Secreted by Live Cells Using MnO2 Nanoparticles Intercalated Layered Doubled Hydroxide Nanohybrids. Anal. Chim. Acta 2015, 898, 34–41. [Google Scholar] [CrossRef] [PubMed]
  33. Arrabito, G.; Pezzilli, R.; Prestopino, G.; Medaglia, P.G. Layered Double Hydroxides in Bioinspired Nanotechnology. Crystals 2020, 10, 602. [Google Scholar] [CrossRef]
  34. Tomassetti, M.; Pezzilli, R.; Prestopino, G.; Di Natale, C.; Medaglia, P.G. Fabrication and Characterization of a Layered Double Hydroxide Based Catalase Biosensor and a Catalytic Sensor for Hydrogen Peroxide Determination. Microchem. J. 2021, 170, 106700. [Google Scholar] [CrossRef]
  35. Tomassetti, M.; Pezzilli, R.; Prestopino, G.; Di Biagio, F.; Di Natale, C.; Medaglia, P.G. A New Clark-Type Layered Double Hydroxides-Enzyme Biosensor for H2O2 Determination in Highly Diluted Real Matrices: Milk and Cosmetics. Processes 2021, 9, 1878. [Google Scholar] [CrossRef]
  36. Heli, H.; Pishahang, J.; Amiri, H.B. Synthesis of Hexagonal CoAl-Layered Double Hydroxide Nanoshales/Carbon Nanotubes Composite for the Non-Enzymatic Detection of Hydrogen Peroxide. J. Electroanal. Chem. 2016, 768, 134–144. [Google Scholar] [CrossRef]
  37. Asif, M.; Liu, H.; Aziz, A.; Wang, H.; Wang, Z.; Ajmal, M.; Xiao, F.; Liu, H. Core-Shell Iron Oxide-Layered Double Hydroxide: High Electrochemical Sensing Performance of H 2 O 2 Biomarker in Live Cancer Cells with Plasma Therapeutics. Biosens. Bioelectron. 2017, 97, 352–359. [Google Scholar] [CrossRef] [PubMed]
  38. Zhao, F.; Zhou, M.; Wang, L.; Huang, Z.; Chu, Y. One-Step Voltammetric Deposition of l-Proline Assisted Silver Nanoparticles Modified Glassy Carbon Electrode for Electrochemical Detection of Hydrogen Peroxide. J. Electroanal. Chem. 2019, 833, 205–212. [Google Scholar] [CrossRef]
  39. Charithra, M.M.; Manjunatha, J.G. Poly (l-Proline) Modified Carbon Paste Electrode as the Voltammetric Sensor for the Detection of Estriol and Its Simultaneous Determination with Folic and Ascorbic Acid. Mater. Sci. Energy Technol. 2019, 2, 365–371. [Google Scholar] [CrossRef]
  40. Xu, L.; Lian, M.; Chen, X.; Lu, Y.; Yang, W. Amperometric Sensing of Hydrogen Peroxide via an ITO Electrode Modified with Gold Nanoparticles Electrodeposited on a CoMn-Layered Double Hydroxide. Microchim. Acta 2017, 184, 3989–3996. [Google Scholar] [CrossRef]
  41. Luo, L.; Li, F.; Zhu, L.; Ding, Y.; Deng, D. Electrochemical Sensing Platform of Natural Estrogens Based on the Poly(l-Proline)-Ordered Mesoporous Carbon Composite Modified Glassy Carbon Electrode. Sens. Actuators B Chem. 2013, 187, 78–83. [Google Scholar] [CrossRef]
  42. Guo, X.; Zhang, F.; Evans, D.G.; Duan, X. Layered Double Hydroxide Films: Synthesis, Properties and Applications. Chem. Commun. 2010, 46, 5197. [Google Scholar] [CrossRef] [PubMed]
  43. Boclair, J.W.; Braterman, P.S. Layered Double Hydroxide Stability. 1. Relative Stabilities of Layered Double Hydroxides and Their Simple Counterparts. Chem. Mater. 1999, 11, 298–302. [Google Scholar] [CrossRef] [PubMed]
  44. Lopez, T.; Bosch, P.; Ramos, E.; Gomez, R.; Novaro, O.; Acosta, D.; Figueras, F. Synthesis and Characterization of Sol−Gel Hydrotalcites. Structure and Texture. Langmuir 1996, 12, 189–192. [Google Scholar] [CrossRef]
  45. Laipan, M.; Xiang, L.; Yu, J.; Martin, B.R.; Zhu, R.; Zhu, J.; He, H.; Clearfield, A.; Sun, L. Layered Intercalation Compounds: Mechanisms, New Methodologies, and Advanced Applications. Prog. Mater. Sci. 2020, 109, 100631. [Google Scholar] [CrossRef]
  46. Forano, C.; Hibino, T.; Leroux, F.; Taviot-Guého, C. Layered Double Hydroxides. In Handbook of Clay Science; Bergaya, F., Theng, B.K.G., Lagaly, G., Eds.; Developments in Clay Science; Elsevier: Amsterdam, The Netherlands, 2006; Chapter 13.1; Volume 1, pp. 1021–1095. [Google Scholar]
  47. Prestopino, G.; Arrabito, G.; Generosi, A.; Mattoccia, A.; Paci, B.; Perez, G.; Verona-Rinati, G.; Medaglia, P.G. Emerging Switchable Ultraviolet Photoluminescence in Dehydrated Zn/Al Layered Double Hydroxide Nanoplatelets. Sci. Rep. 2019, 9, 11498. [Google Scholar] [CrossRef]
  48. Polese, D.; Mattoccia, A.; Giorgi, F.; Pazzini, L.; Di Giamberardino, L.; Fortunato, G.; Medaglia, P.G. A Phenomenological Investigation on Chlorine Intercalated Layered Double Hydroxides Used as Room Temperature Gas Sensors. J. Alloys Compd. 2017, 692, 915–922. [Google Scholar] [CrossRef]
  49. Moody, G.J.; Thomas, J.D.R. Selective Ion-Sensitive Electrodes. Sel. Annu. Rev. Anal. Sci. 1973, 3, 59. [Google Scholar] [CrossRef]
  50. Mascini, M. Uses of Known Addition, Gran’s Plots and the Related Methods with Ion-Selective Electrodes. In Ion-Selective Electrode Reviews; Elsevier: Amsterdam, The Netherlands, 1981; Volume 2, pp. 17–71. ISBN 978-0-08-028434-7. [Google Scholar]
  51. Fan, X.; Yang, Z.; Wen, R.; Yang, B.; Long, W. The Application of Zn–Al-Hydrotalcite as a Novel Anodic Material for Ni–Zn Secondary Cells. J. Power Sources 2013, 224, 80–85. [Google Scholar] [CrossRef]
  52. Yuan, J.; Xu, S.; Zeng, H.-Y.; Cao, X.; Dan Pan, A.; Xiao, G.-F.; Ding, P.-X. Hydrogen Peroxide Biosensor Based on Chitosan/2D Layered Double Hydroxide Composite for the Determination of H2O2. Bioelectrochemistry 2018, 123, 94–102. [Google Scholar] [CrossRef]
  53. Nakayama, H.; Wada, N.; Tsuhako, M. Intercalation of Amino Acids and Peptides into Mg–Al Layered Double Hydroxide by Reconstruction Method. Int. J. Pharm. 2004, 269, 469–478. [Google Scholar] [CrossRef]
  54. Amine, A.; Mohammadi, H. Amperometry. In Reference Module in Chemistry, Molecular Sciences and Chemical Engineering; Elsevier: Amsterdam, The Netherlands, 2018; p. B9780124095472142000. ISBN 978-0-12-409547-2. [Google Scholar]
  55. Tang, D.; Xia, B.; Zhang, Y. Direct Electrochemistry and Electrocatalysis of Hemoglobin in a Multilayer {nanogold/PDDA}n Inorganic–Organic Hybrid Film. Microchim. Acta 2008, 160, 367–374. [Google Scholar] [CrossRef]
  56. Gu, Y.; Chen, C.-C. Eliminating the Interference of Oxygen for Sensing Hydrogen Peroxide with the Polyaniline Modified Electrode. Sensors 2008, 8, 8237–8247. [Google Scholar] [CrossRef] [PubMed]
  57. Yang, Z.; Tjiu, W.W.; Fan, W.; Liu, T. Electrodepositing Ag Nanodendrites on Layered Double Hydroxides Modified Glassy Carbon Electrode: Novel Hierarchical Structure for Hydrogen Peroxide Detection. Electrochim. Acta 2013, 90, 400–407. [Google Scholar] [CrossRef]
  58. Wang, Q.; Zheng, J. Electrodeposition of Silver Nanoparticles on a Zinc Oxide Film: Improvement of Amperometric Sensing Sensitivity and Stability for Hydrogen Peroxide Determination. Microchim. Acta 2010, 169, 361–365. [Google Scholar] [CrossRef]
  59. Qi, C.; Zheng, J. Novel Nonenzymatic Hydrogen Peroxide Sensor Based on Fe3O4/PPy/Ag Nanocomposites. J. Electroanal. Chem. 2015, 747, 53–58. [Google Scholar] [CrossRef]
  60. Jahanbakhshi, M.; Habibi, B. A Novel and Facile Synthesis of Carbon Quantum Dots via Salep Hydrothermal Treatment as the Silver Nanoparticles Support: Application to Electroanalytical Determination of H2O2 in Fetal Bovine Serum. Biosens. Bioelectron. 2016, 81, 143–150. [Google Scholar] [CrossRef]
  61. Wang, D.-H.; Ogino, K.; Sato, Y.; Sakano, N.; Kubo, M.; Takemoto, K.; Masatomi, C. Urinary Hydrogen Peroxide as Biomarker. In General Methods in Biomarker Research and their Applications; Preedy, V.R., Patel, V.B., Eds.; Springer Netherlands: Dordrecht, The Netherlands, 2014; pp. 1–15. ISBN 978-94-007-7740-8. [Google Scholar]
  62. Banerjee, D.; Jacob, J.; Kunjamma, G.; Madhusoodanan, U.K.; Ghosh, S. Measurement of Urinary Hydrogen Peroxide by FOX-1 Method in Conjunction with Catalase in Diabetes Mellitus—A Sensitive and Specific Approach. Clin. Chim. Acta 2004, 350, 233–236. [Google Scholar] [CrossRef]
Figure 1. Three-electrode voltammetric system used in the present research: (a) counter electrode, (b) reference electrode, (c) working electrode, (d) proline in PBS, and (e) thermostated electrochemical cell. In the insert a schematic representation of the sensor (GC-Agpaste)-catalytic proline-assisted LDH is shown.
Sensors 22 07159 g001
Figure 2. Cyclic voltammograms from −1.5 V to +1.5 V with a scan rate 40 mV s−1 (A) obtained using the sensor (GC-Agpaste)-catalytic proline-assisted LDH (with 20 mmol L−1 proline in solution), with H2O2 in phosphate buffer with final concentration of (a) 3.34, (b) 6.68, (c) 10.02, (d) 16.70 mmol L−1, and (e) without H2O2 in buffer solution. (B) “CV Blanks” obtained using (a) GC-Agpaste, (b) GC-Agpaste in 3.34 mmol L−1 of H2O2, (c) GC-Agpaste and proline (20 mmol L−1), (d) GC-Agpaste and proline (20 mmol L−1) in 3.34 mmol L−1 of H2O2, (e) GC-Agpaste -LDH, and (f) GC-Agpaste-LDH in 3.34 mmol L−1 of H2O2.
Sensors 22 07159 g002
Figure 3. (A): (a–c) calibration curves vs. H2O2 concentration as a function of lifetime (about a week), reading the current peak at −0.58 V, and (d) “blank” curve without proline. (B) Calibration straight-lines (black) and confidence limits (red) at the (a) 1st day, (b) 3rd day, (c) 7th day, and (d) blank without proline. Each point (i.e., star symbol) is the mean of at least three determinations.
Sensors 22 07159 g003
Figure 4. Non-enzymatic catalytic (GC-Agpaste)-proline-assisted LDH amperometric sensor. (A) Calibration curves as a function of lifetime including the “blank” curve recorded on the first day. (B) Comparison among calibration curves obtained on the (e) 21st day, (λ) 21st day without proline addition in solution, using the same sensor, and (ω) blank, recorded on the first day. Each point is the mean of at least three determinations. (C) Bar chart of straight-line slopes as a function of lifetime. Dotted bar indicates the slope of the calibration curve recorded on the first day under nitrogen stream, whereas 21* (i.e., the slope of λ curve) is that on the 21st day without new addition proline in solution.
Sensors 22 07159 g004
Figure 5. (A) Amperometric calibration curves of non-enzymatic (GC-Agpaste)-catalytic proline-assisted LDH sensor under static air and under N2 stream from 0.05 to 20,000 µmol L−1 of hydrogen peroxide; in the inset from about 0.05 to 40 µmol L−1. (B,C) straight lines and confidence intervals at low and at high concentration ranges of hydrogen peroxide, respectively, for the proline-assisted LDH sensor operated under N2 stream. Current straight lines obtained by subsequent additions of 150–200 µL of 3 × 10⁻⁵ % H2O2 water solution (B) and of 3 % H2O2 water solution (C).
Sensors 22 07159 g005
Figure 6. Measurement of H2O2 concentration in urine samples from (a) healthy and (b) diabetic subjects. Experimental calibration curves and confidence intervals are built in matrix and hydrogen peroxide concentrations are found by using the linear regression method and Gran’s plot method (in the insets). Each point (black filled circles) represents the mean of at least three repeated determinations. Black star symbols and dotted lines represent the experimental application of the regression equation method. In the insets, coloured star symbols represent the experimental application of the Gran’s plot method.
Sensors 22 07159 g006
Figure 7. (A) Schematic of the non-enzymatic catalytic Clark-type proline-assisted (or non-assisted) LDH amperometric sensor and (B) straight line calibration curve vs. H2O2 concentration obtained using Clark sensor with () proline-assisted LDH, () LDH without proline, () proline-assisted silver paste, and () silver paste without proline.
Sensors 22 07159 g007
Table 1. CV method validation: main analytical data and straight-line equations of the calibration curves at the 1st day and blank curve.
Linear Regression
(y = mA; x = mM)
Linearity Range
(mM)
R2LOD
(mM)
RSD %
1st dayy = (0.256 ± 0.0130)∙x + (9.819 ± 0.1110)0–170.98990.52.25
blanky = (0.0676 ± 0.00460)∙x + (8.597 ± 0.0680)0–300.98220.52.25
Table 2. Interferences in hydrogen peroxide determination expressed as the percentage response variation to H2O2 using the non-enzymatic catalytic (GC-Agpaste)-proline-assisted LDH amperometric sensor and comparison with those observed in the previously developed enzymatic or simply catalytic (GC-Agpaste)-LDH sensors [34]. Each added interfering species had a final concentration in solution equal to that of hydrogen peroxide.
Non Enzymatic Catalytic (GC-Agpaste)-Proline Assisted LDH SensorEnzymatic or Catalytic (GC-Agpaste)-LDH Sensors (Not Proline Assisted) [34]
Glucose0%-
Uric acid0%-
Ascorbic acid≈0%−5.6%
Sodium nitrite0%−1%
Sodium nitrate+1%+3%
Fe3+≈+30%+32%
Potassium permanganate+440%+1300%
Table 3. Analytical method validation. Straight-line equations and best analytical data of the sensor studied in the present paper and in our previous study [34].
Best Analytical data of GC-LDH-Catalase Enzymatic biosensor studied in previous work and method validation
Linear RegressionLinearity Range (mM)R2LOD (mM)LOQ (mM)RSD%Response time (s)Lifetime (days)Ref
y = (10.09 ± 0.29) x + (115.1 ± 29.1)0.25–1580.99760.20.60.58.575[34]
(y = μA; x = mM)
Best Analytical data of non-enzymatic catalytic LDH sensor studied in previous work and method validation
Linear RegressionLinearity Range (mM)R2LOD (mM)LOQ (mM)RSD%Response time (s)Lifetime (days)Ref
y = (0.9662 ± 0.0109) x + (−102.6 ± 8.85)144.5–1195.20.9986131.817.568[34]
(y = μA; x = mM)
Best Analytical data of non-enzymatic catalytic proline assisted LDH sensor studied in this work and method validation
(operating under static air)
Linear RegressionLinearity Range (mM)R2LOD (mM)LOQ (mM)RSD%Response time (s)Lifetime (days)Ref
y = (27.407 ± 0.450) x + (83.466 ± 8.713)0.3–33.40.99810.150.357≥21This work
(y = μA; x = mM)
Best Analytical data of non-enzymatic catalytic proline assisted LDH sensor studied in this work and method validation
(operating under nitrogen—low concentration range)
Linear RegressionLinearity Range (mM)R2LOD (mM)LOQ (mM)RSD%Response time (s)Lifetime (days)Ref
y = (30874.1 ± 3685.7) x + (15.12 ± 1.17)0.00005–0.000220.95610.000050.0001510>3This work
(y = μA; x = mM)0.05–0.22 (µM) 0.05 (µM)0.1 (µM)
Best Analytical data of non-enzymatic catalytic proline assisted LDH sensor studied in this work and method validation
(operating under nitrogen—high concentration range)
Linear RegressionLinearity Range (mM)R2LOD (mM)LOQ (mM)RSD%Response time (s)Lifetime (days)Ref
y = (102.9 ± 1.2) x + (66.9 ± 16.3)0.012–23.30.99950.0050.012.510>3This work
(y = μA; x = mM)
Table 4. Experimental values of hydrogen peroxide concentration found in fresh human urine from healthy and diabetic subjects, determined in this work under nitrogen atmosphere, comparing them with those present in three works reported in the literature.
Exp. Values
[µM]
Found by Regression Equation Method
(This Work)
Exp. Values
[µM]
Found by Gran’s plot Method
(This Work)
Exp. Values
[µM]
Reported in Literature
[61,62]
Exp. Values
[µM]
Reported in Literature
[37]
Healthy subject30.0 ± 1.0021.0 ± 1.3020 ± 1.435.4
Diabetic subject80.0 ± 4.0064.0 ± 4.2042 ± 0.72“higher than healthy”
Table 5. Experimental percentage recovery for hydrogen peroxide addition in healthy and diabetic urine samples. The reported found and added concentration values are the final ones obtained after dilution of the solution.
SampleFound Concentration in Urine Sample (µM)H2O2 Additions (µM)Found + Added Nominal Value (µM)Experimental Value (µM)Δ (%) (RSD% = 0.7)Percent Recovery (RSD% = 0.7)
Healthy15.096.0111.0105.6−4.995.1
Healthy15.0318.0333.0328.0−1.598.5
Diabetic40.071.0111.0110.2−0.799.3
Diabetic40.0293.5333.5332.8−0.299.8
Publisher’s Note: MDPI stays neutral with regard to jurisdictional claims in published maps and institutional affiliations.

