1. Introduction
The fingerprint is a biometric modality deployed mainly for human identification. Fingerprint recognition systems have several practical applications, including access control and criminal investigation [
1].
Most available fingerprint systems compare data captured from the same sensor, where matching algorithms are designed to work on data obtained from a single sensor for enrollment and verification. Thus, the ability of these algorithms to work on data collected from multiple sensors is limited. It is known as the fingerprint sensor interoperability problem or the cross-sensor problem. In legacy databases, billions of fingerprints have been collected from different sensors based on diverse technologies. Every time the sensor of choice is changed, the re-enrollment of persons is a costly and substantial task. Moreover, due to the improvement in fingerprint sensors and the need to apply fingerprint recognition in devices such as those linked to the Internet of Things (IoT), the demand is high for an efficient fingerprint matching algorithm that can recognize fingerprints captured using different sensors. Therefore, the algorithms for the sensor interoperability problem, which improve the biometric system’s ability to adapt to data obtained from several sensors, are highly needed and will significantly impact system usability [
2].
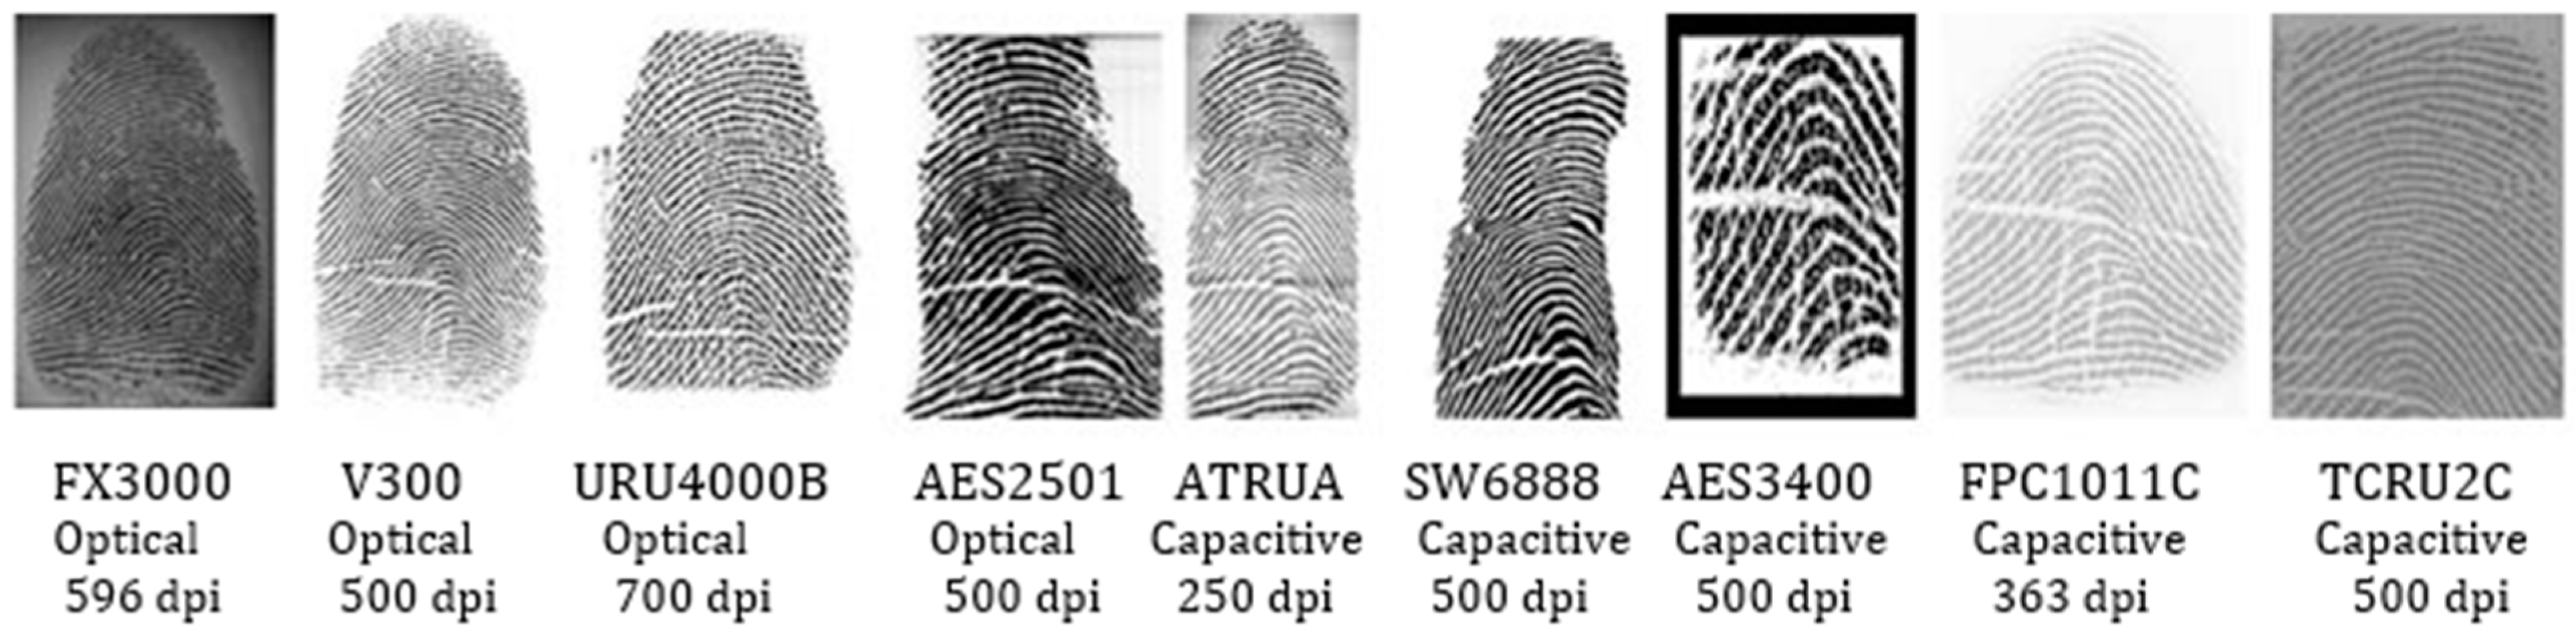
The quality of fingerprints varies based on the sensor types used for capturing the fingerprint, even if the same sensing technology is employed (e.g., optical or capacitive). Additionally, the corresponding sets of features have high variability, which cannot be analyzed easily by a matching algorithm for accurate decisions. An example is shown in
Figure 1, which shows the fingerprint of the same finger captured by nine different sensors [
3].
Differences in sensor technology and interaction type can cause significant variations in the quality of fingerprints. Thus, a considerable drop in the performance of the existing fingerprint recognition systems has been reported when different sensors are used for identification [
2].
Moreover, the performance of cross-sensor matching algorithms is affected because of the variations in ridge patterns caused by the various types of noises and artifacts due to the difference in sensor technologies, as shown in
Figure 1. There is a real need to enhance fingerprint images. However, this is challenging because fingerprints captured using various sensors include several kinds of texture patterns and noises [
4].
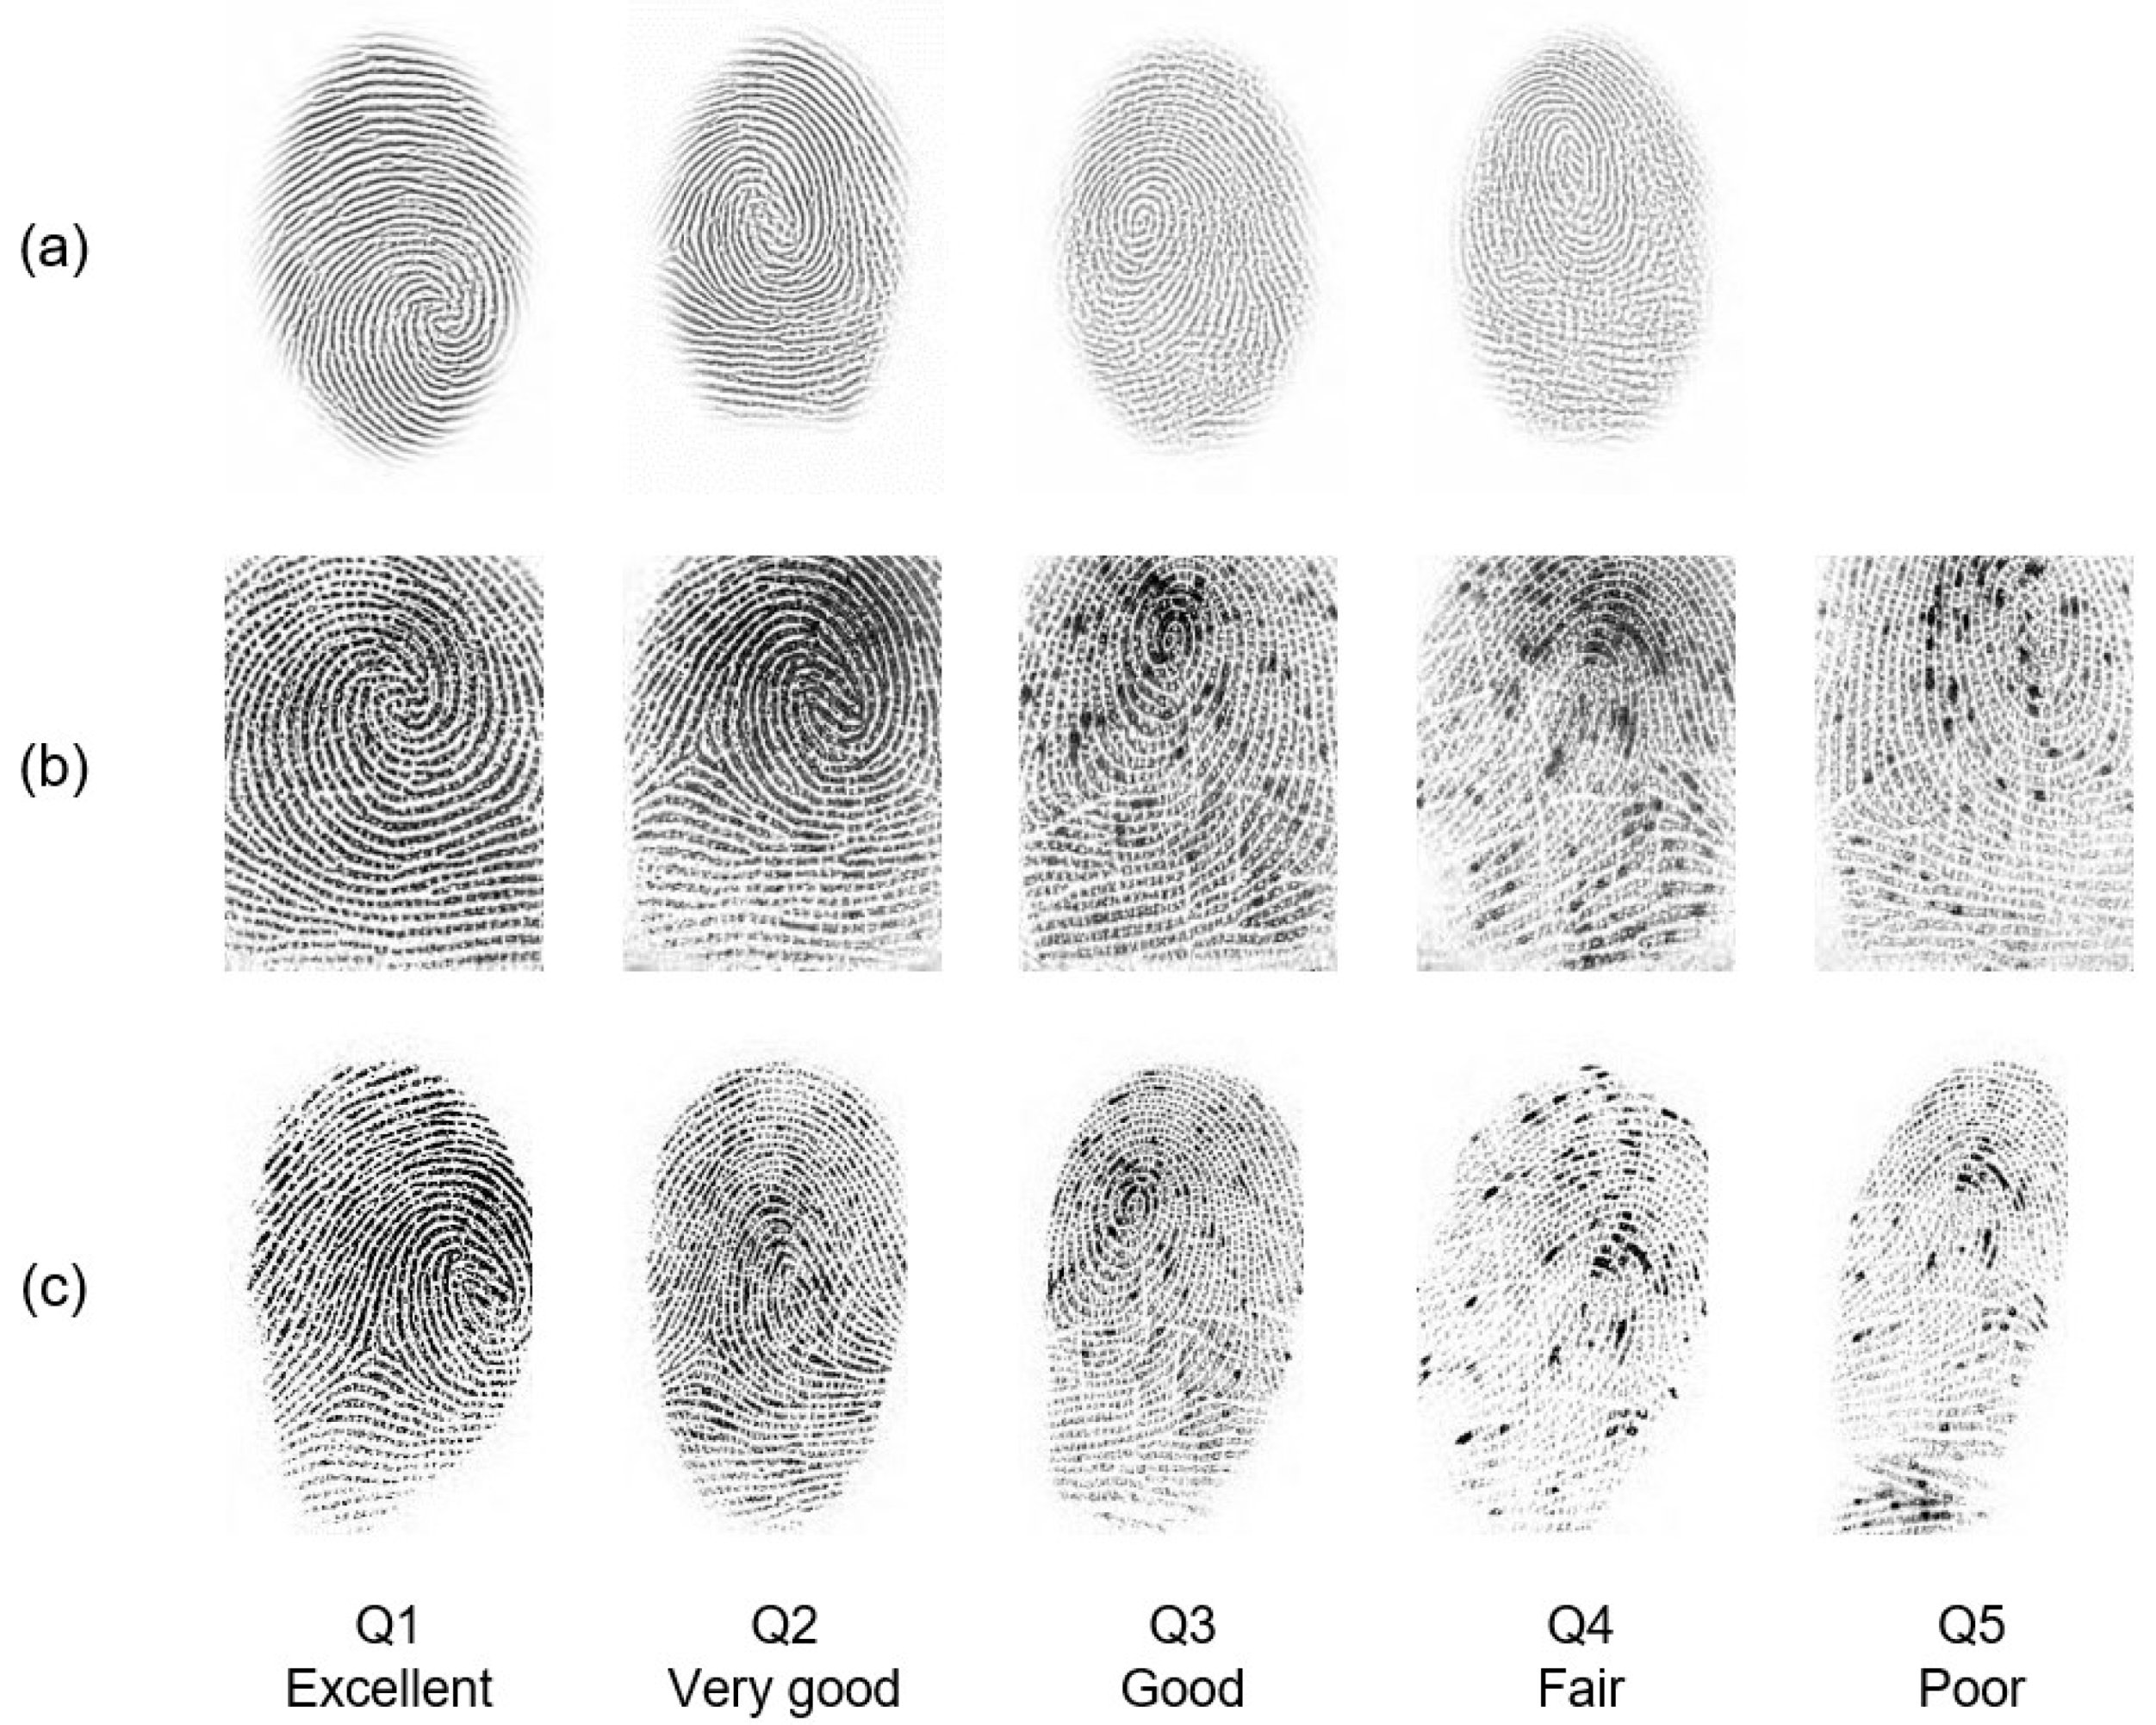
A sample including a set of impressions taken from the MOLF dataset [
5] is presented in
Figure 2. These impressions were categorized into three subsets: DB1 comprises the flat dap (10) fingerprints captured by the Lumidigm Venus sensor; DB2 contains the fingerprints of the same fingers captured by the Secugen HamsterIV sensor; and DB3 consists of the dap fingerprints captured by CrossMatch L-Scan patrol sensor. Their quality was measured using the NFIQ (NBIS Fingerprint Image Quality) tool [
6]. It is an open-source minutiae-based quality evaluation algorithm that provides a quality value {1, 2, 3, 4, 5}, with 1 representing the best quality and 5 denoting the worst one. Each row within the set stands for fingerprints captured by the same sensor. Each column, in turn, represents the same level of quality, in which the first column is excellent while the last column is poor. It can be noticed that DB1 has no images of the poor class. In addition, most of the ridge pattern information is unclear in the impressions belonging to classes poor and fair in DB2 and DB3.
In this paper, we present an efficient enhancement solution for the cross-sensor fingerprint problem. Specifically, motivated by the outstanding performance of deep learning-based techniques in various computer vision tasks such as image enhancement [
7,
8]. We designed an image-to-image mapping function
that receives a low-quality fingerprint and generates a high-quality one. We model
using Convolutional Neural Networks (CNN) based on encoder–decoder architecture. The learning of this kind of CNN is a challenging problem. Thus, we trained our method using two types of learning approaches i.e., the conventional end-to-end approach and using the adversarial learning (using a conditional GAN framework).
Adversarial learning generates fingerprints of higher quality than those produced by conventional learning, as demonstrated by comparing the outputs of the two methods using two frequent metrics: NFIQ and SSIM.
Our method was evaluated on two benchmark public datasets, FingerPass and MOLF. The results indicate that fingerprints are enhanced to higher quality regardless of the sensor type used.
To the best of our knowledge, this is the first work dealing with the problem of cross-sensor fingerprint enhancement using deep learning. Our contributions in this paper can be summarized as follow:
We formulated the cross-sensor fingerprint enhancement problem as an image-to-image transformation problem and designed it using a CNN model with an encoder–decoder architecture that takes a low-quality fingerprint and produces an enhanced fingerprint. We trained the proposed CNN model using two different approaches: conventional learning and adversarial learning.
Motivated by the success of adversarial learning in modeling image-to-image transformation [
9], we learned the proposed image-to-image transformation (the CNN model) using a conditional GAN framework, where the proposed CNN model plays the role of a generator.
To preserve the ridge patterns in the fingerprints, we incorporated the edge loss function [
10] and
L1 loss [
9] into the adversarial loss [
11]. This resulted in good quality enhanced fingerprints regardless of the type of sensor used to capture the fingerprints.
For comprehensive evaluation of a fingerprint enhancement algorithm, we proposed a new metric called Fingerprint Quality Enhancement Index (FQEI). This metric yields a value between 1 and −1, where 1 represents the best enhancement and −1 represents the worst degradation.
The rest of this paper is structured as follows.
Section 2 reviews previous enhancement methods, while
Section 3 describes in detail the proposed method.
Section 4 presents the training and testing stages of our model, while
Section 5 gives details of the experiments.
Section 6 discusses our results. Finally,
Section 7 concludes the conducted work and suggests some directions for future work.
2. Related Work
In the last decade, various studies have been conducted to study the effect of reliable fingerprint enhancement for solving the matching problem assuming that the same sensor was used both for enrollment and verification.
A common technique is the HONG method proposed by Hong et al. [
12], where fingerprints are enhanced using a bank of Gabor filters, which are adjusted to the orientation of the local ridges. Another state-of-the-art method is the CHIK method, which was proposed by Chikkerur et al. [
13], where fingerprints are enhanced using the short-time Fourier transform (STFT). In this method, each fingerprint is initially divided into small overlapping windows, and the STFT is applied to each window. Next, the block energy, ridge orientation, and ridge frequency are estimated using the Fourier spectrum, and then contextual filtering is applied for fingerprint enhancement.
Other enhancement techniques focus on using off-line images, such as the latent fingerprint technique [
14]. Researchers proposed an approach that employed a CNN model to predict ridge direction from a set of pre-trained ridge patterns. In [
7], a direct end-to-end enhancement approach was proposed using the FingerNet architecture. This method relied on the use of a CNN within an encoder–decoder scheme. In [
8], the authors employed a convolutional auto-encoder neural network to enhance the missing ridge pattern. A similar work was proposed in [
15], where a method based on de-convolutional auto-encoders was developed to match sensor-scan and inked fingerprints.
All previous works have focused on using conventional learning only in the enhancement process, where CNNs learn to minimize the loss function. This process, however, requires a lot of manual effort. In contrast, the flexibility provided by Generative Adversarial Networks (GANs), which apply adversarial learning, allows for optimizing the objective function of the problem more effectively. It initially determines a single high-level goal, such as producing indistinguishable fake images from real images, and then learns to achieve such a goal automatically using a suitable loss function [
9]. In the JOSHI method [
16], a conditional GAN model was proposed based on an image-to-image translation to reconstruct the ridge structure of latent fingerprints. As discussed above, most previous enhancement methods have focused on matching latent fingerprints left unintentionally at a crime scene. Unlike previous methods, which deal with latent fingerprints, the proposed method addresses the problem of enhancing cross-sensor fingerprints. The problem of cross-sensor enhancement has been addressed in a few studies only. In [
4,
17], an adaptive histogram equalization method was proposed to enhance the contrast of contactless fingerprint ridges and valleys. To date, these are the only published studies concerning cross-sensor enhancement. No previous studies have addressed the cross-sensor enhancement problem using deep learning techniques.
3. Proposed Method
A critical issue when designing an effective cross-sensor fingerprint enhancement is preserving valleys, ridges, and other fingerprint features, such as minutiae. In view of this, we introduce a new method for cross-sensor fingerprint enhancement.
3.1. Problem Formulation
Fingerprint enhancement can be expressed as an image-to-image transformation problem. It aims to learn a mapping, denoted by
, which transforms an input fingerprint
to an enhanced fingerprint
. This implies finding a mapping
such that
, where
represents the transformation parameters. A critical question in this context is how to model the mapping function
. From a practical standpoint, the application of both deep learning and CNNs has shown promising performance in pattern recognition problems, as indicated in various studies [
4,
14,
15]. This, in turn, motivated us to model
using a CNN model. The learning method typically employed in CNNs is conventional learning, which is based on an objective function that minimizes the loss function between ground truth and the predicted labels. However, regardless of whether the learning process is automatic, several studies have sought to design more effective loss functions [
9].
Another efficient learning approach is based on the Generative Adversarial Networks (GANs) framework. The learning method applied in GANs is adversarial learning, which is based on a min-max game and includes a specific loss function, where one agent tries to maximize while the other one tries to minimize [
11].
3.2. The Design of Mapping Function
The design of the mapping function (
) is a challenging problem since the captured fingerprints by different sensors have different texture patterns and noise [
4]. The desired mapping must be developed to enhance fingerprints by preserving the underlying fingerprint features and removing possible corruption and noise. To address these issues and effectively learn
, two learning frameworks were investigated: conventional learning and adversarial learning.
3.2.1. Conventional Learning Framework (One-Net)
In this case,
was designed using a CNN model following an encoder–decoder architecture [
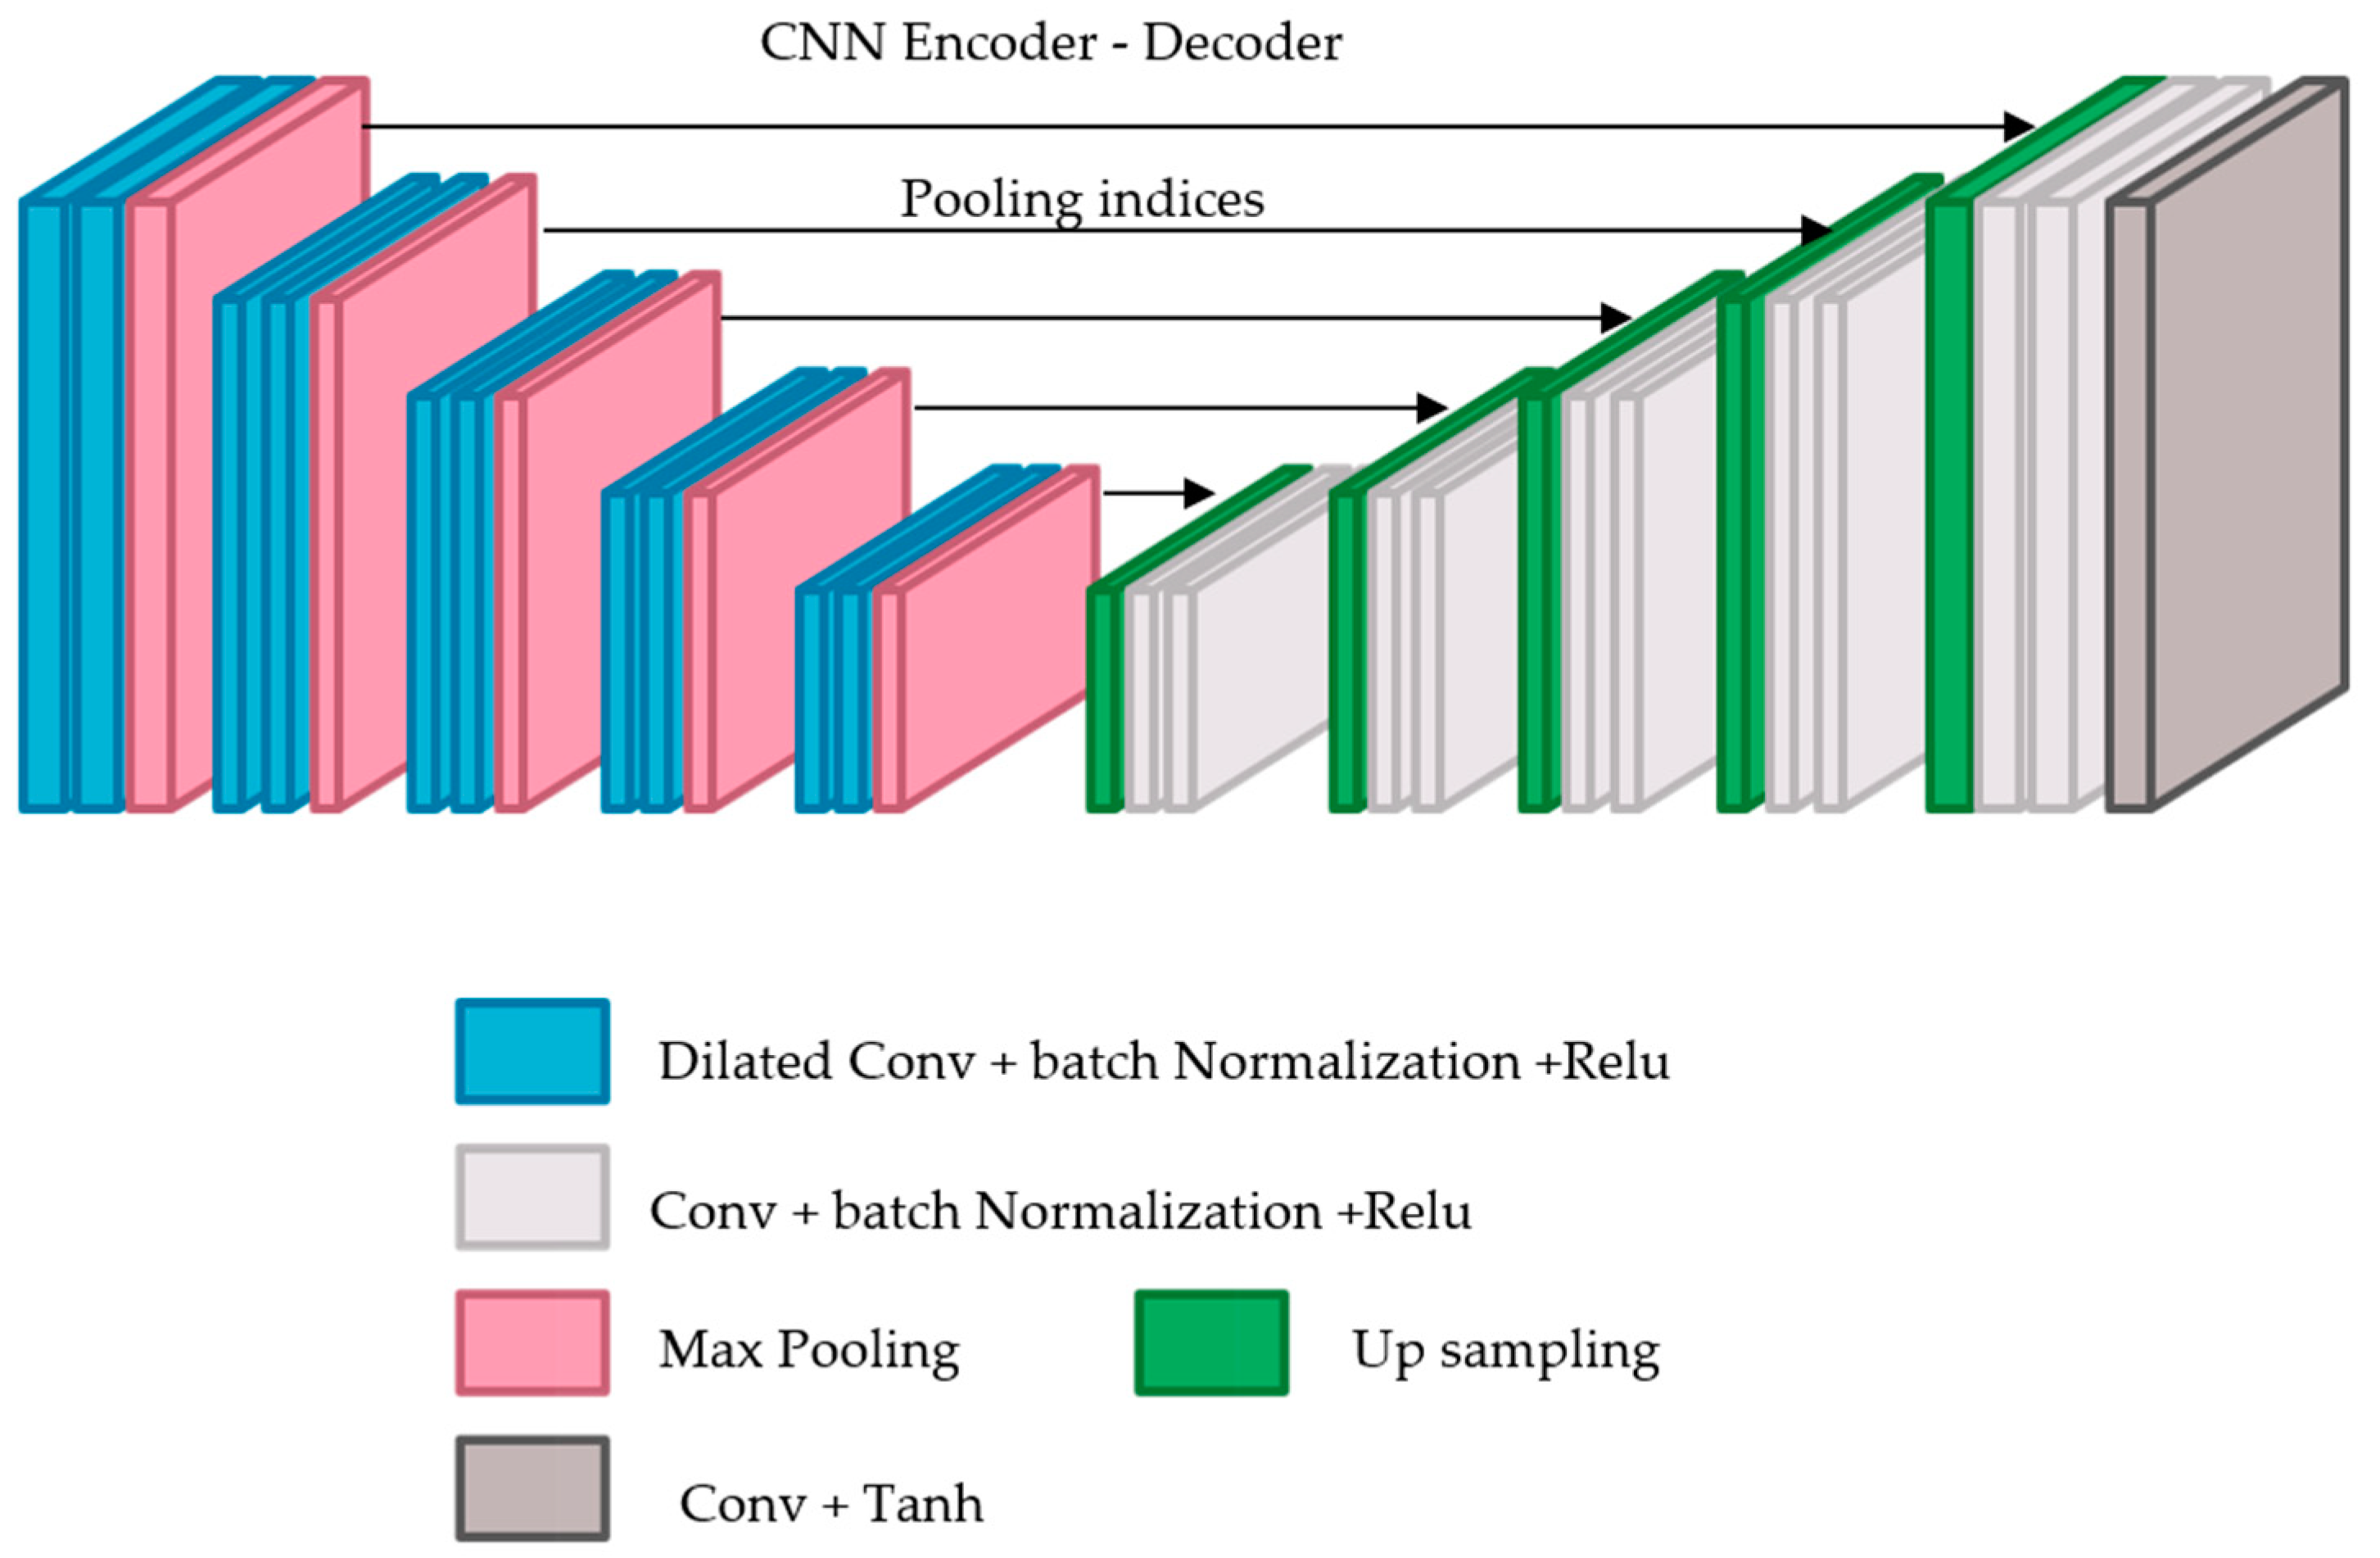
18]. It takes a low-quality fingerprint as input and produces a high-quality one as output. This architecture minimizes the loss between the target images and the predicted ones. This architecture was adopted from SegNet [
19] with some modifications. SegNet comprises two networks: an encoder and a corresponding decoder, followed by a final pixel-wise classification layer.
SegNet has five encoders and corresponding five decoders. All the encoders include two consecutive layers and max pooling layers. Each convolutional layer consists of 64 filters with size 3 × 3, 1 padding and stride of 1 followed by batch normalization (BN) layer and then element-wise rectified linear non-linearity (ReLU). After that, 2 × 2 max pooling layer, with a stride of 2, is applied where the related max pooling indices (locations) are saved.
Each corresponding decoder up-samples its input using the recalled max-pooling indices using a 2 × 2 max unpooling layer with a stride of 2. Then, it convolves the input using two consecutive convolutional layers. Each convolutional layer contains 64 filters of size 3 × 3 and a stride of 1 followed by a batch normalization layer, then a ReLU layer. The final output is then fed into a multi-class soft-max classifier to compute class probabilities for each pixel independently.
This model has been specifically designed for segmentation purposes. However, since our goal is different and focuses on the enhancement task, the SegNet model was modified to fit the task of interest by receiving a low-quality, 300 × 300 × 1 fingerprint and generating a same-size fingerprint with higher quality. Both the Softmax layer and the pixel-wise classification layer were removed. Since the target task is to produce a same-size fingerprint with a higher quality, a convolution layer with one filter of size 3 × 3, was also added, as shown in
Figure 3.
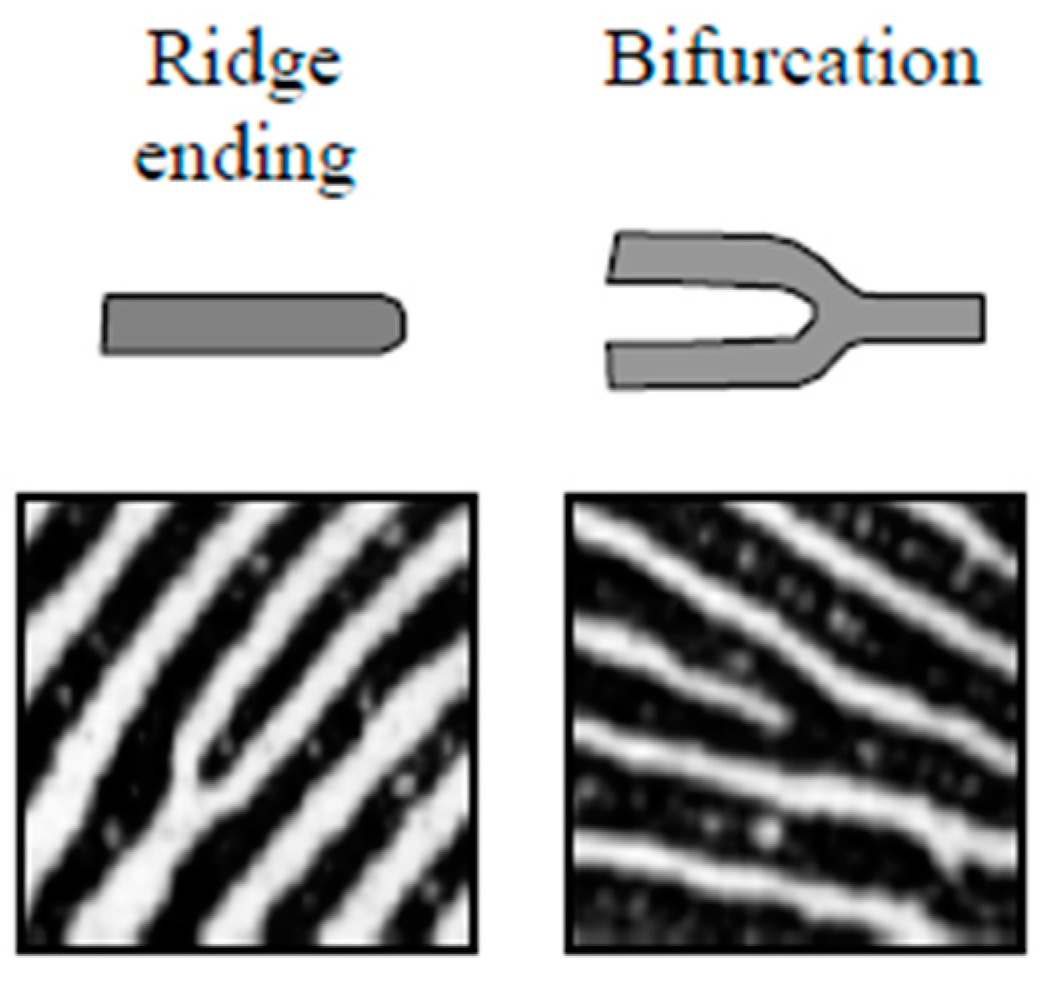
The preservation of small and thin details is essential for fingerprint matching since they play an important role in determining the identity of each subject. Some of these details are the minutiae points formed mainly by ridge bifurcations and ridge endings. The ridge bifurcations are those points where ridges are divided into two ridges, whereas the ridge endings are those points where ridges end. The extraction of minutiae points is a difficult task in low-quality fingerprint images [
1], see
Figure 4.
These small details should be considered when designing the target model. Convolutional networks are deployed to gradually reduce the image resolution until it is represented via tiny feature maps, where the spatial structure is not yet visible. However, this spatial acuity loss may restrict fingerprint enhancement. This issue can be addressed by dilated convolutions that can increase the output feature maps resolution without decreasing the individual neurons’ receptive field. Thus, a second modification introduced to the SegNet model is adding dilated convolutions.
Generally, dilated convolution is a convolution having a wider kernel that is generated based on repeatedly adding spaces among the kernel elements [
20]. Therefore, each convolution layer in the encoder was substituted by a dilated convolution layer using a different dilation factor in the range: 1, 1, 2, 2, 4, 4, 8, 8, 16, and 16. Our results illustrate that dilated convolution is appropriate for fingerprint enhancement since it enlarges the receptive field with no coverage or resolution loss.
In the decoder network, each decoder up-samples its input feature map(s) by deploying the memorized max-pooling indices related to its corresponding encoder’s feature map(s). It should be noted that there is no conducted learning within the up-sampling stage. SegNet uses the max pooling indices to up-sample the feature map(s) and convolves them with a trainable decoder filter bank. Next, batch normalization is applied to each map. Subsequently, the high dimensional feature representation at the final decoder output is fed to a convolutional layer followed by a Tanh layer as shown in
Table 1.
3.2.2. The Adversarial Learning Framework (Two-Net)
This type of learning is based on the conditional generative adversarial network (cGAN) framework [
9]. The cGAN framework consists of a generator and a discriminator. The role of the generator is to produce a transformed image from the input one. The discriminator determines if the input image is real or fake. In the training stage, both the generator and discriminator conduct a min-max game. For this task,
plays the role of the generator, which is to produce a high-quality fingerprint (
) from a low-quality one (
). The enhanced high-quality fingerprint must have a clear ridge structure to preserve the valleys, ridges, and further fingerprint features, such as minutiae points. The discriminator differentiates real fingerprints from the generated ones, which helps to learn
.
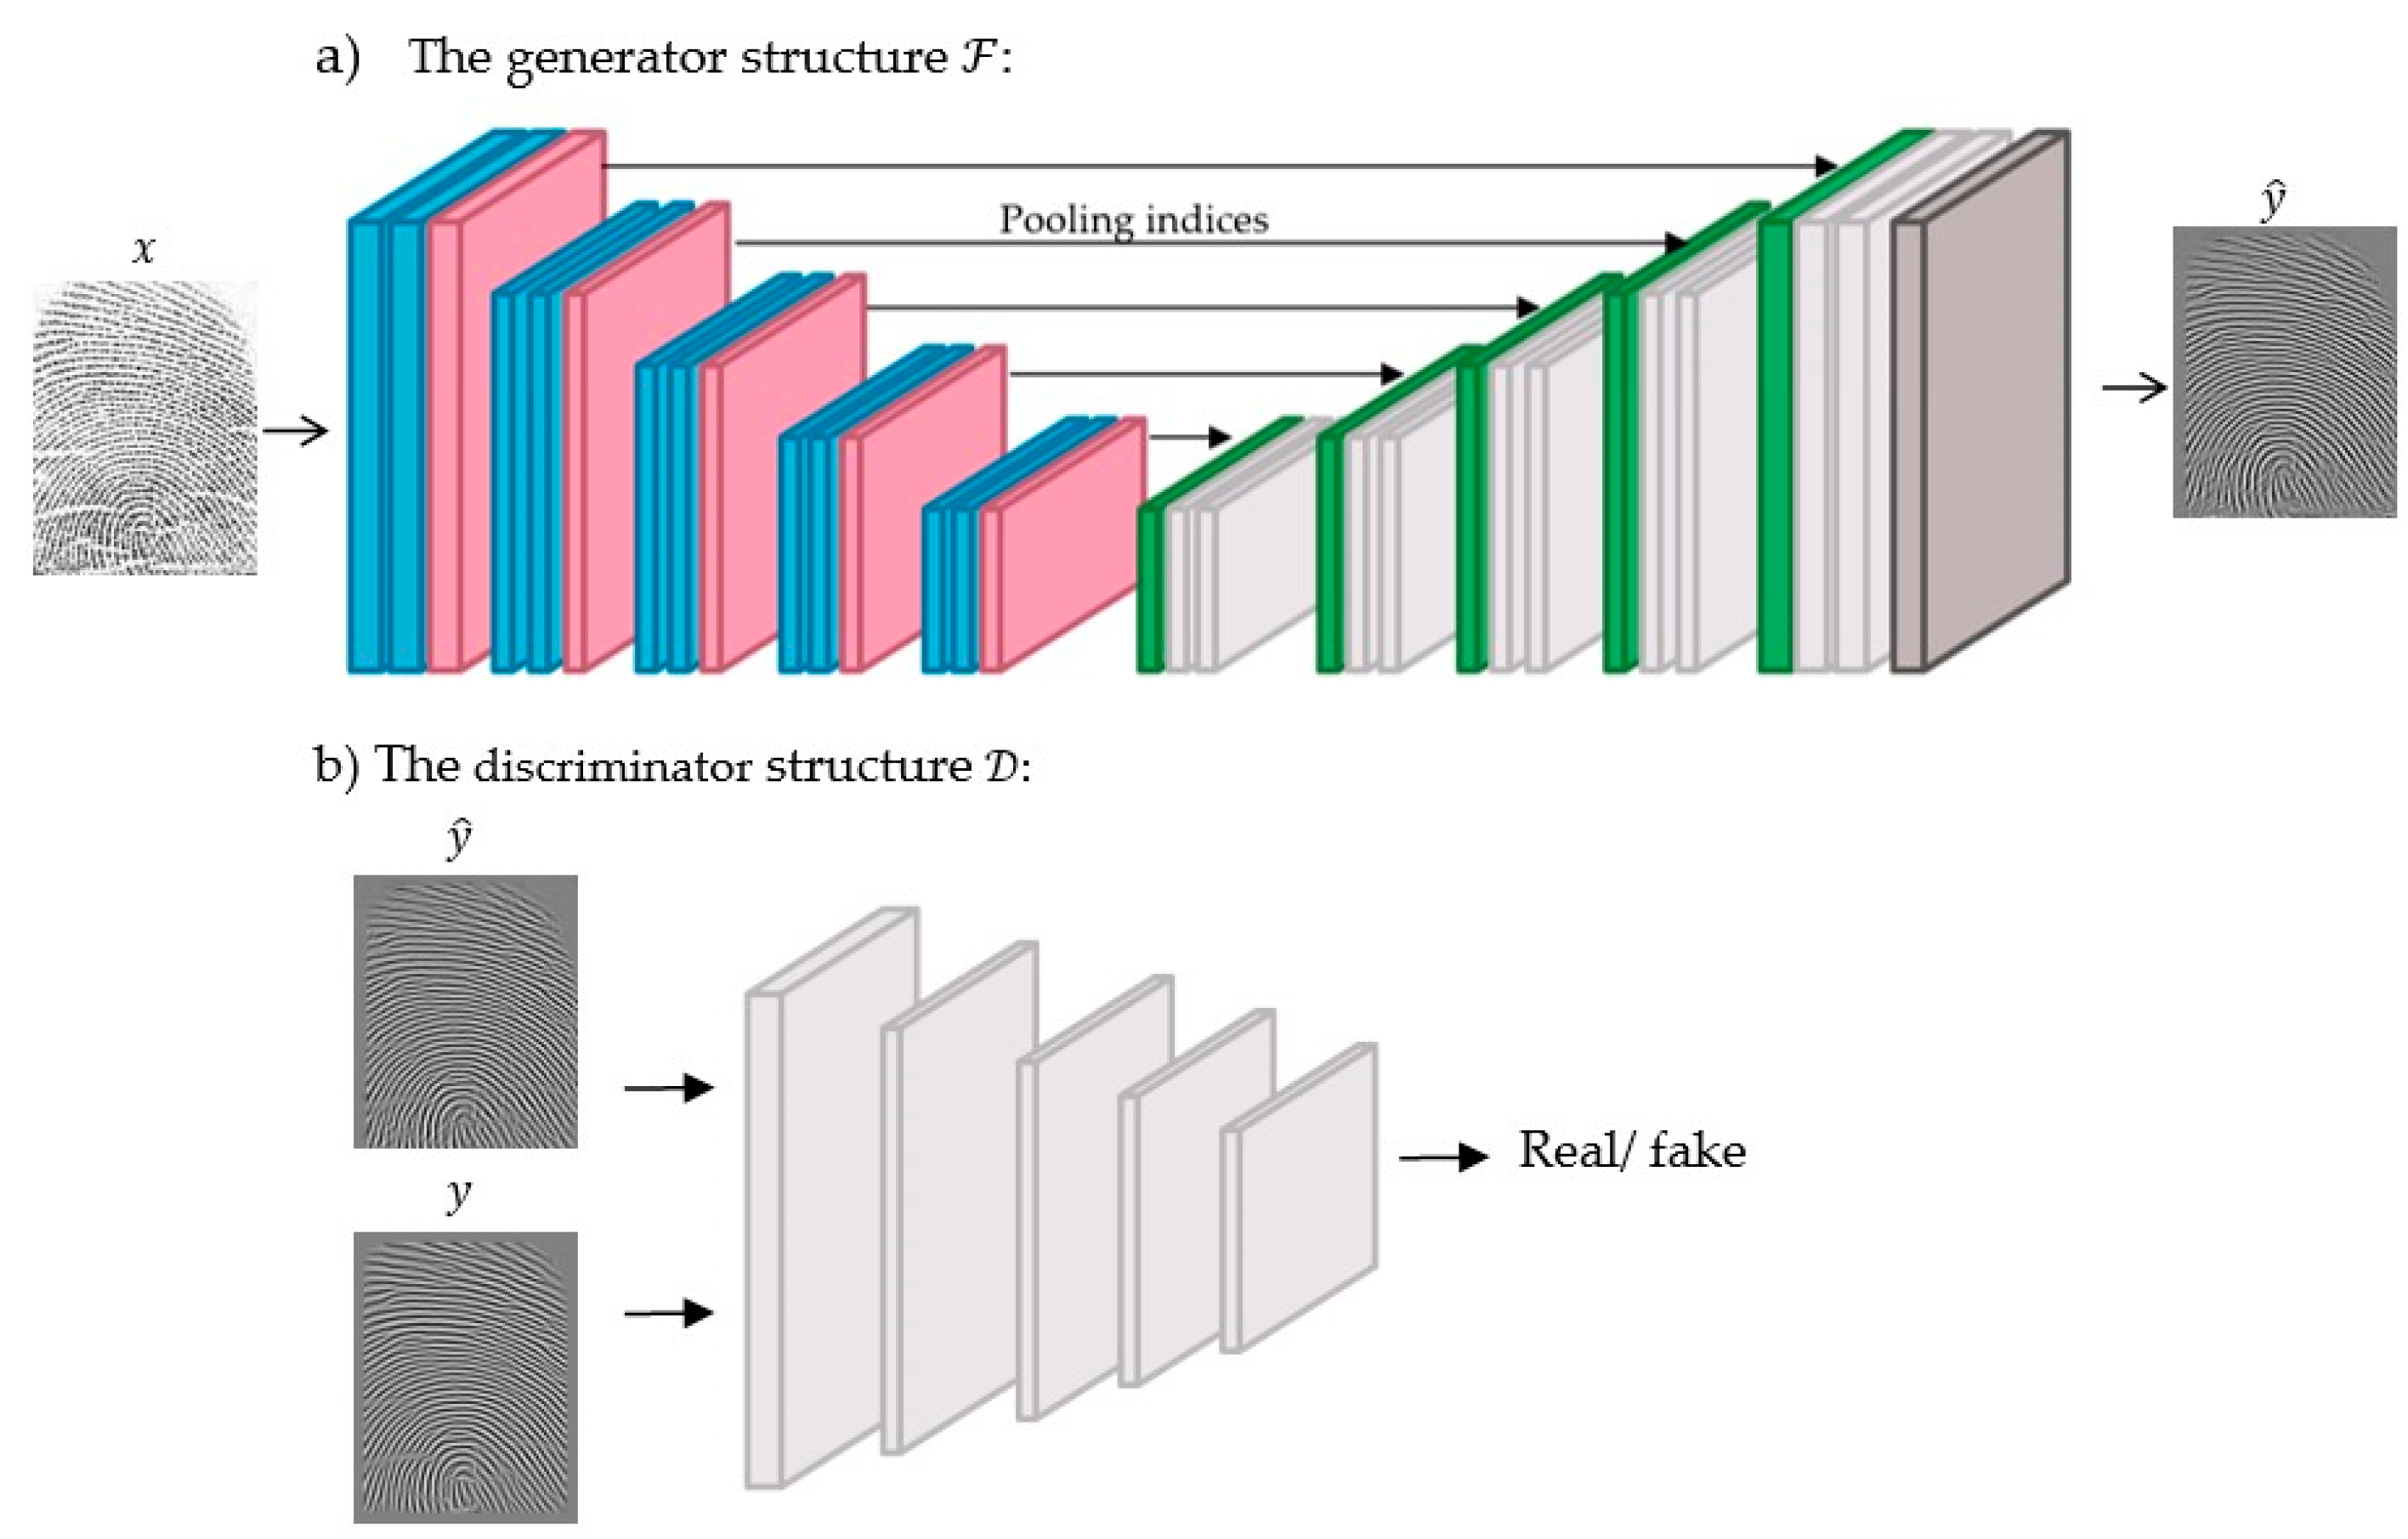
To effectively learn
via the cGANs framework, it is considered a generator that generates an enhanced image
from an input image
. To model
a dilated SegNet is deployed since both the input and output are images with the same size 300 × 300 × 1, as explained in the first framework. The discriminator
is modeled using a patch GAN discriminator that was adopted from the paper [
9]. The first convolution layer Conv contains 64 filters, stride 2, depth of 2, followed by a Leaky ReLU layer. The second Conv consists of 128 filters, stride 2, and the third contains 256 filters of stride 2; the fourth Conv contains 512 filters, stride 2; each of these layers is followed by a batch normalization layer and the Leaky ReLU. The last layer is a Conv layer consisting of one filter and stride of 1. All these Conv layers contain filters of size 4, as illustrated in
Figure 5.
3.3. Loss Functions and the Learning of
For the first framework,
is learned through conventional learning based on taking a low-quality fingerprint
and producing a high-quality one. This model minimizes the gradient difference between the generated fingerprint and the ground truth
. We used two loss functions:
L1 loss [
9] and Edge Loss [
10].
The first loss used is the
distance that is expressed as follows:
An ideal fingerprint image has valleys and ridges that flow in a locally regular direction. In this case, the detection of ridges is straightforward, and minutiae can be accurately located within the image. Nevertheless, skin conditions (e.g., dry/wet, bruises, and cuts), improper finger pressure, and sensor noise significantly impact fingerprint image quality.
Therefore, the edge loss function is added to improve the fingerprint ridge structures by calculating the edge direction. For this, the ridge pattern of the generated fingerprint and the corresponding ground truth fingerprint are initially computed, and then the loss is used to update the parameters of
. The edge loss is denoted as
and can be expressed as follows:
where
represents the Laplacian of Gaussian operator,
denotes the ground truth fingerprint (high quality), and
denotes the enhanced image. The parameter with constant
empirically set to
as used in [
10]. This loss is used to preserve edge features useful for improving ridge patterns.
In the second framework,
learning is inspired by the method [
9]. Both
and
are learned using adversarial learning. The training dataset includes pairs of poor- and high-quality fingerprints. Such pairs are expressed as
, in which
stands for the poor-quality fingerprint image, while
stands for the corresponding high-quality one (ground truth).
A fingerprint
is fed into
, which then maps it to an enhanced version
. The channel-wise concatenation between the pairs
and
is then fed into
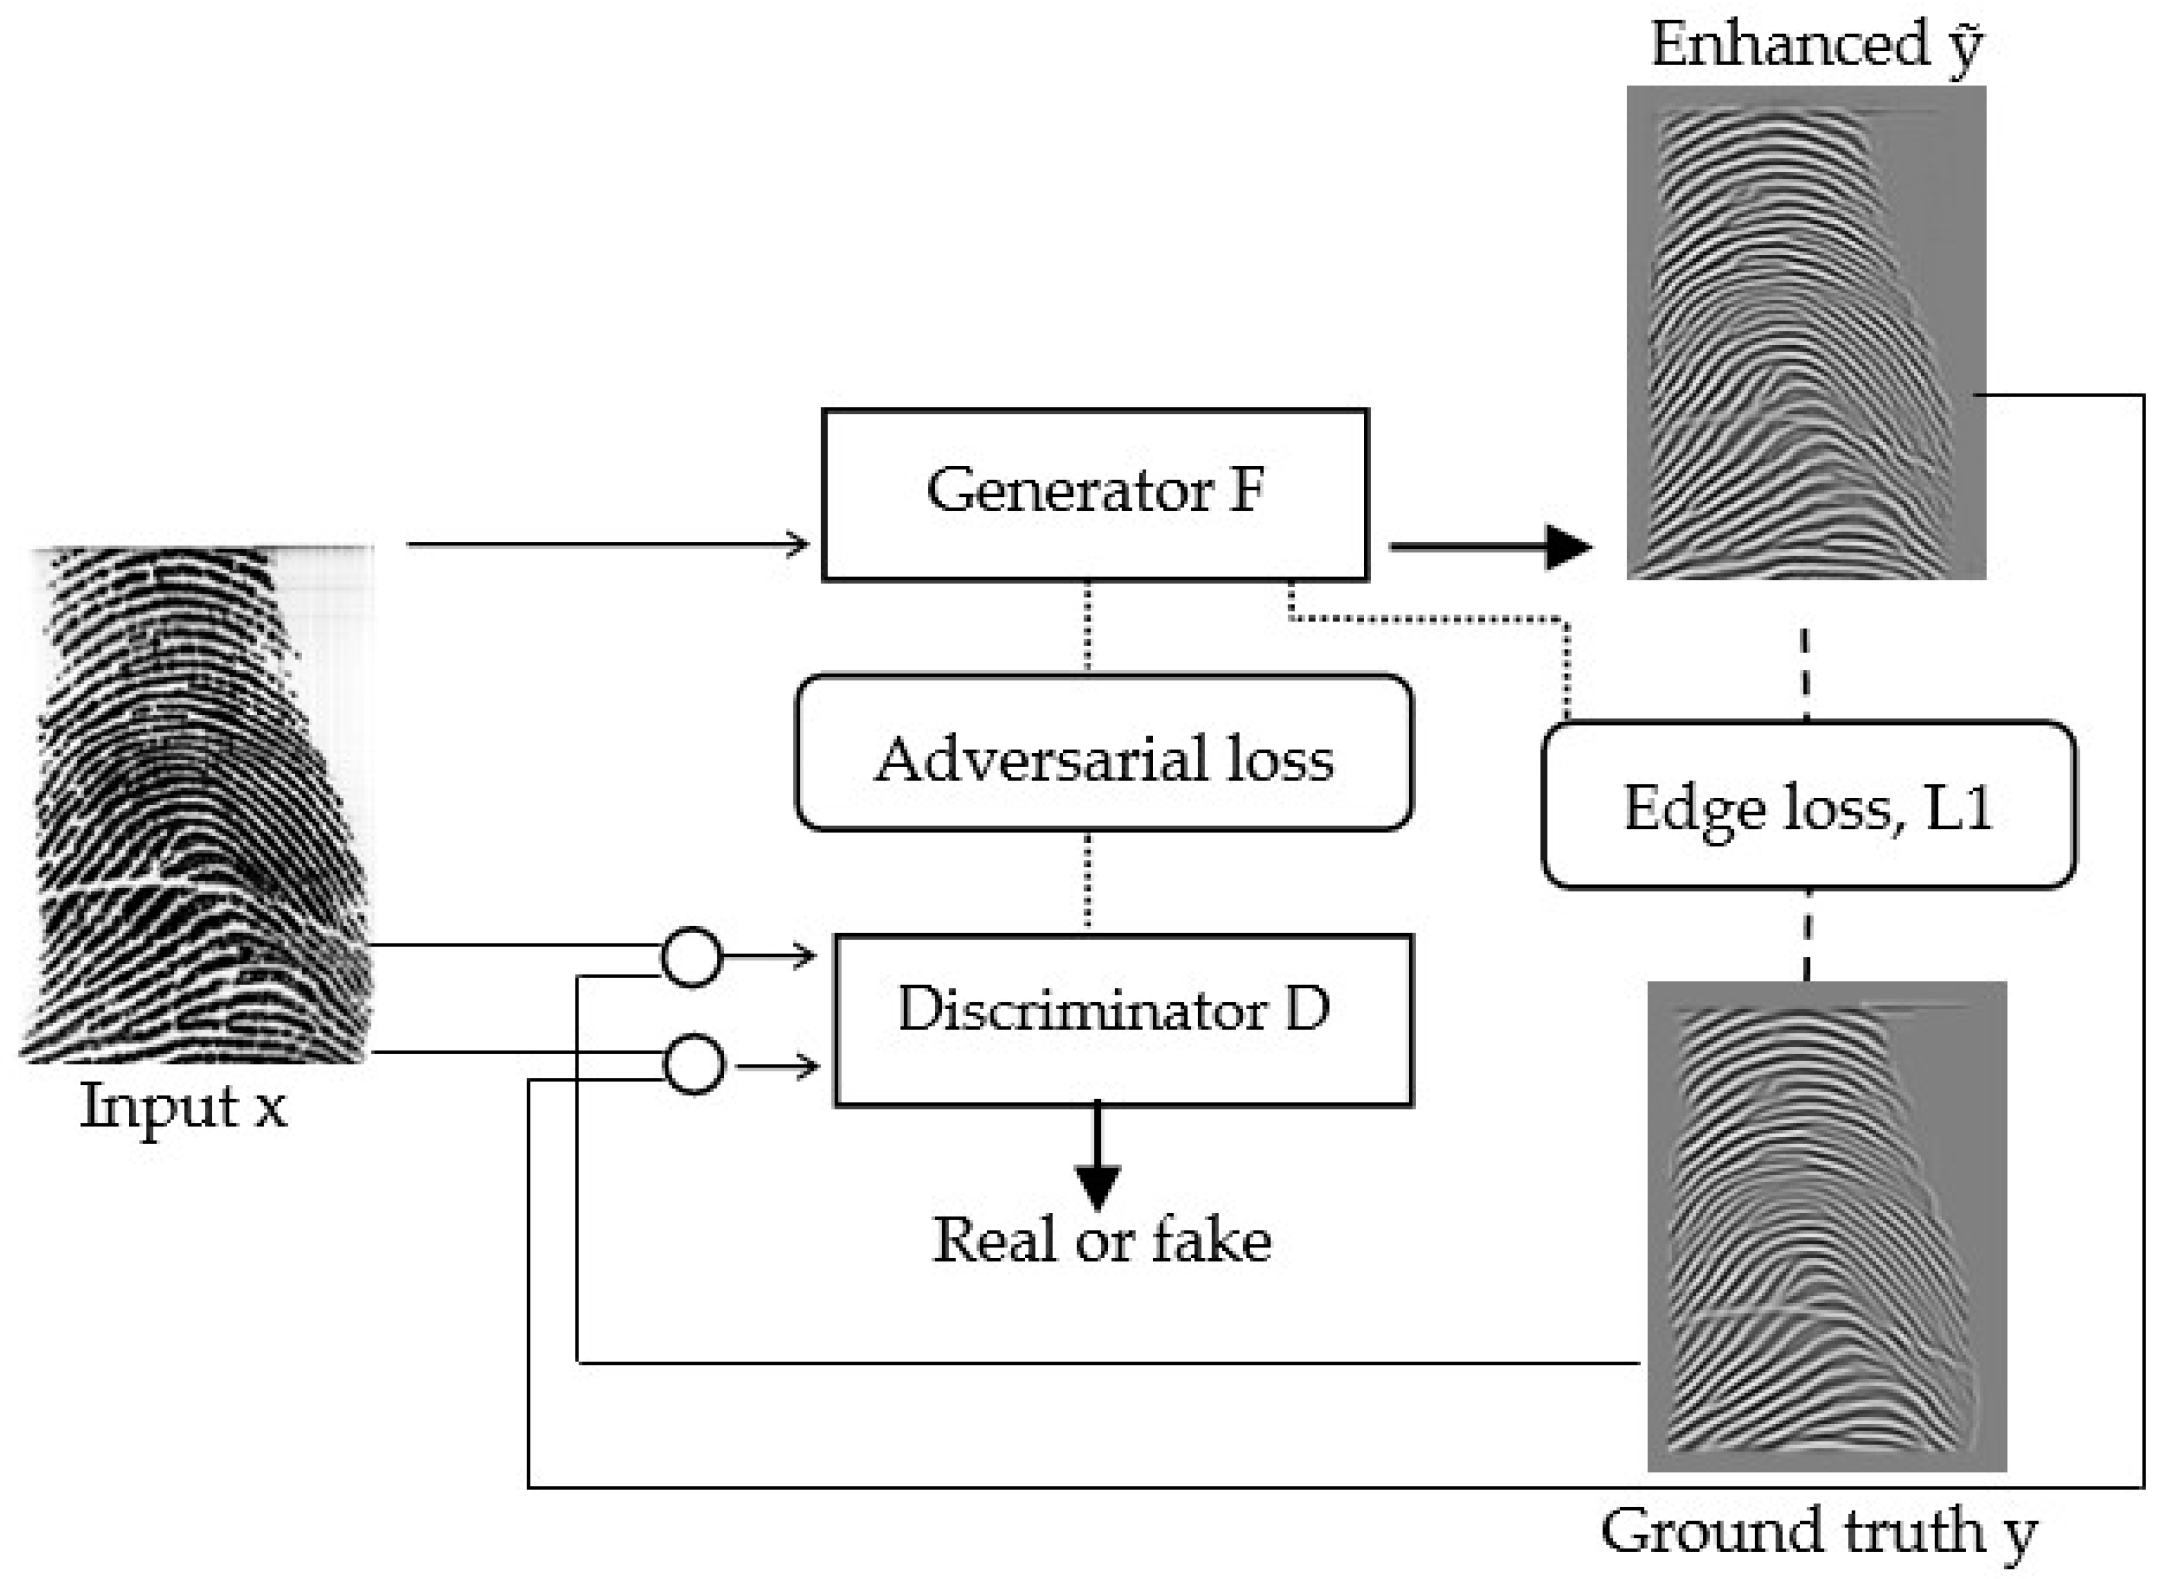
to classify them as real or generated fingerprints. The discriminator ensures that the generator effectively learns to preserve ridge structures of the generated enhanced fingerprints. The adversarial loss is given below:
A custom training loop is deployed to train the model using the training dataset, in which the network weights are updated in each iteration. In the training stage, produces a fingerprint that is hard to be classified as synthetic via . In contrast, avoids being misled by and increases the successful discrimination between the original and synthetic fingerprints by reducing the value of the loss function.
We combined the edge loss and
L1 distance with adversarial learning. The final objective function is expressed below:
Figure 6 illustrates the training framework, which learns
to produce an enhanced fingerprint from an input one.
3.4. Assessing the Quality of the Enhancements
Although both NFIQ [
6] and SSIM [
21] are popular and accurate metrics used widely to measure fingerprint quality, they do not offer a comprehensive description of what happens during enhancement. In these metrics, the number of enhanced or degraded images is not considered. A new metric has been designed to comprehensively describe each class’s performance by analyzing the NFIQ results.
Fingerprint Quality Enhancement Index (FQEI)
The detail of the new metric for assessing the enhancement potential of an algorithm is given in the following paragraphs. A fingerprint can be assigned to one of five quality levels, i.e.,
Q1: excellent,
Q2: very good,
Q3: good,
Q4: fair, or
Q5: poor, based on the scores obtained from the NFIQ tool [
6]. Using the quality levels of fingerprints before and after enhancement, we compute the Quality Confusion Matrix (QCM) as shown in
Table 2, where
Qjj is the number of images with original quality Q
j have been enhanced to quality
.
To quantify the enhancement quality, each
Qjj in QCM is scaled according to the corresponding coefficient
wij in the weight quality matrix (WQM), shown in
Table 3.
In WQM, (i) wii = 0 because there is no enhancement in the quality level of the fingerprints, (ii) wij (i < j) is 1, 2, 3, or 4 depending on enhancement levels, e.g., in case of Q13, the quality of fingerprints after enhancement goes two levels up from Q3 to Q1, it must be weighted with w13 = 2, (iii) wij (i > j) is −1, −2, −3 or −4 depending on de-enhancement levels.
The enhancement score (
), which quantifies the quality of enhancement of fingerprints that were in a low-quality class before enhancement and assigned to a high-quality class after enhancement, can be expressed using QCM and WQM as follows:
The degradation score (
), which quantifies the quality of de-enhancement of fingerprints that were in a high-quality class before enhancement and assigned to a low-quality class after enhancement, can be expressed using QCM and WQM as follows:
In the ideal case (
scenario, all images are enhanced from low-quality class to excellent class. In other words,
can be represented as a weighted sum of all images, except those of
Q1 quality, using the following formula:
where
Q12 represents images from very good class that enhanced one degree up to be in class excellent, and so on.
However, in the worst-case (
) scenario, all images move from the high-quality class to the poor-quality class, excluding the class poor since its images preserve their class. This means that WS can be expressed as a weighted sum of all images, except those in class poor, using the following formula:
where
represents images from excellent class that degraded four degrees down to be in poor class, and so on.
To measure the enhancement ratio (
ER), the
computed using Equation (6), is divided by
IS computed using Equation (8). Thus, the
ER is expressed as follows:
In contrast, the degradation ratio can be measured by dividing the
by
WS as follows:
The difference between the enhancement ratio and the degradation ratio is computed to determine the degree of enhancement for measuring the performance of an algorithm:
In the ideal case scenario = 1, and it is equal to −1 in the worst-case scenario.
The more the
is close to one, the higher the enhancement is, and vice versa. An illustrative example is provided in the
Appendix A.
5. Experimental Results
In this section, we introduce the metric used to evaluate our results and present the outcome of the conducted experiments.
5.1. Fingerprint Image Quality Analysis
The NFIQ module of NBIS proposed in [
6] was used to analyze the ability of the proposed enhancement algorithm to enhance the quality of cross-sensor fingerprints. The analysis offers a value between 1 and 5, where 1 represents the best quality while 5 represents the worst quality. The score distribution before and after applying the enhancement method was assessed using fingerprints from MOLF and FingerPass datasets to evaluate the performance. The results for MOLF enhancement using adversarial learning are shown in
Table 4.
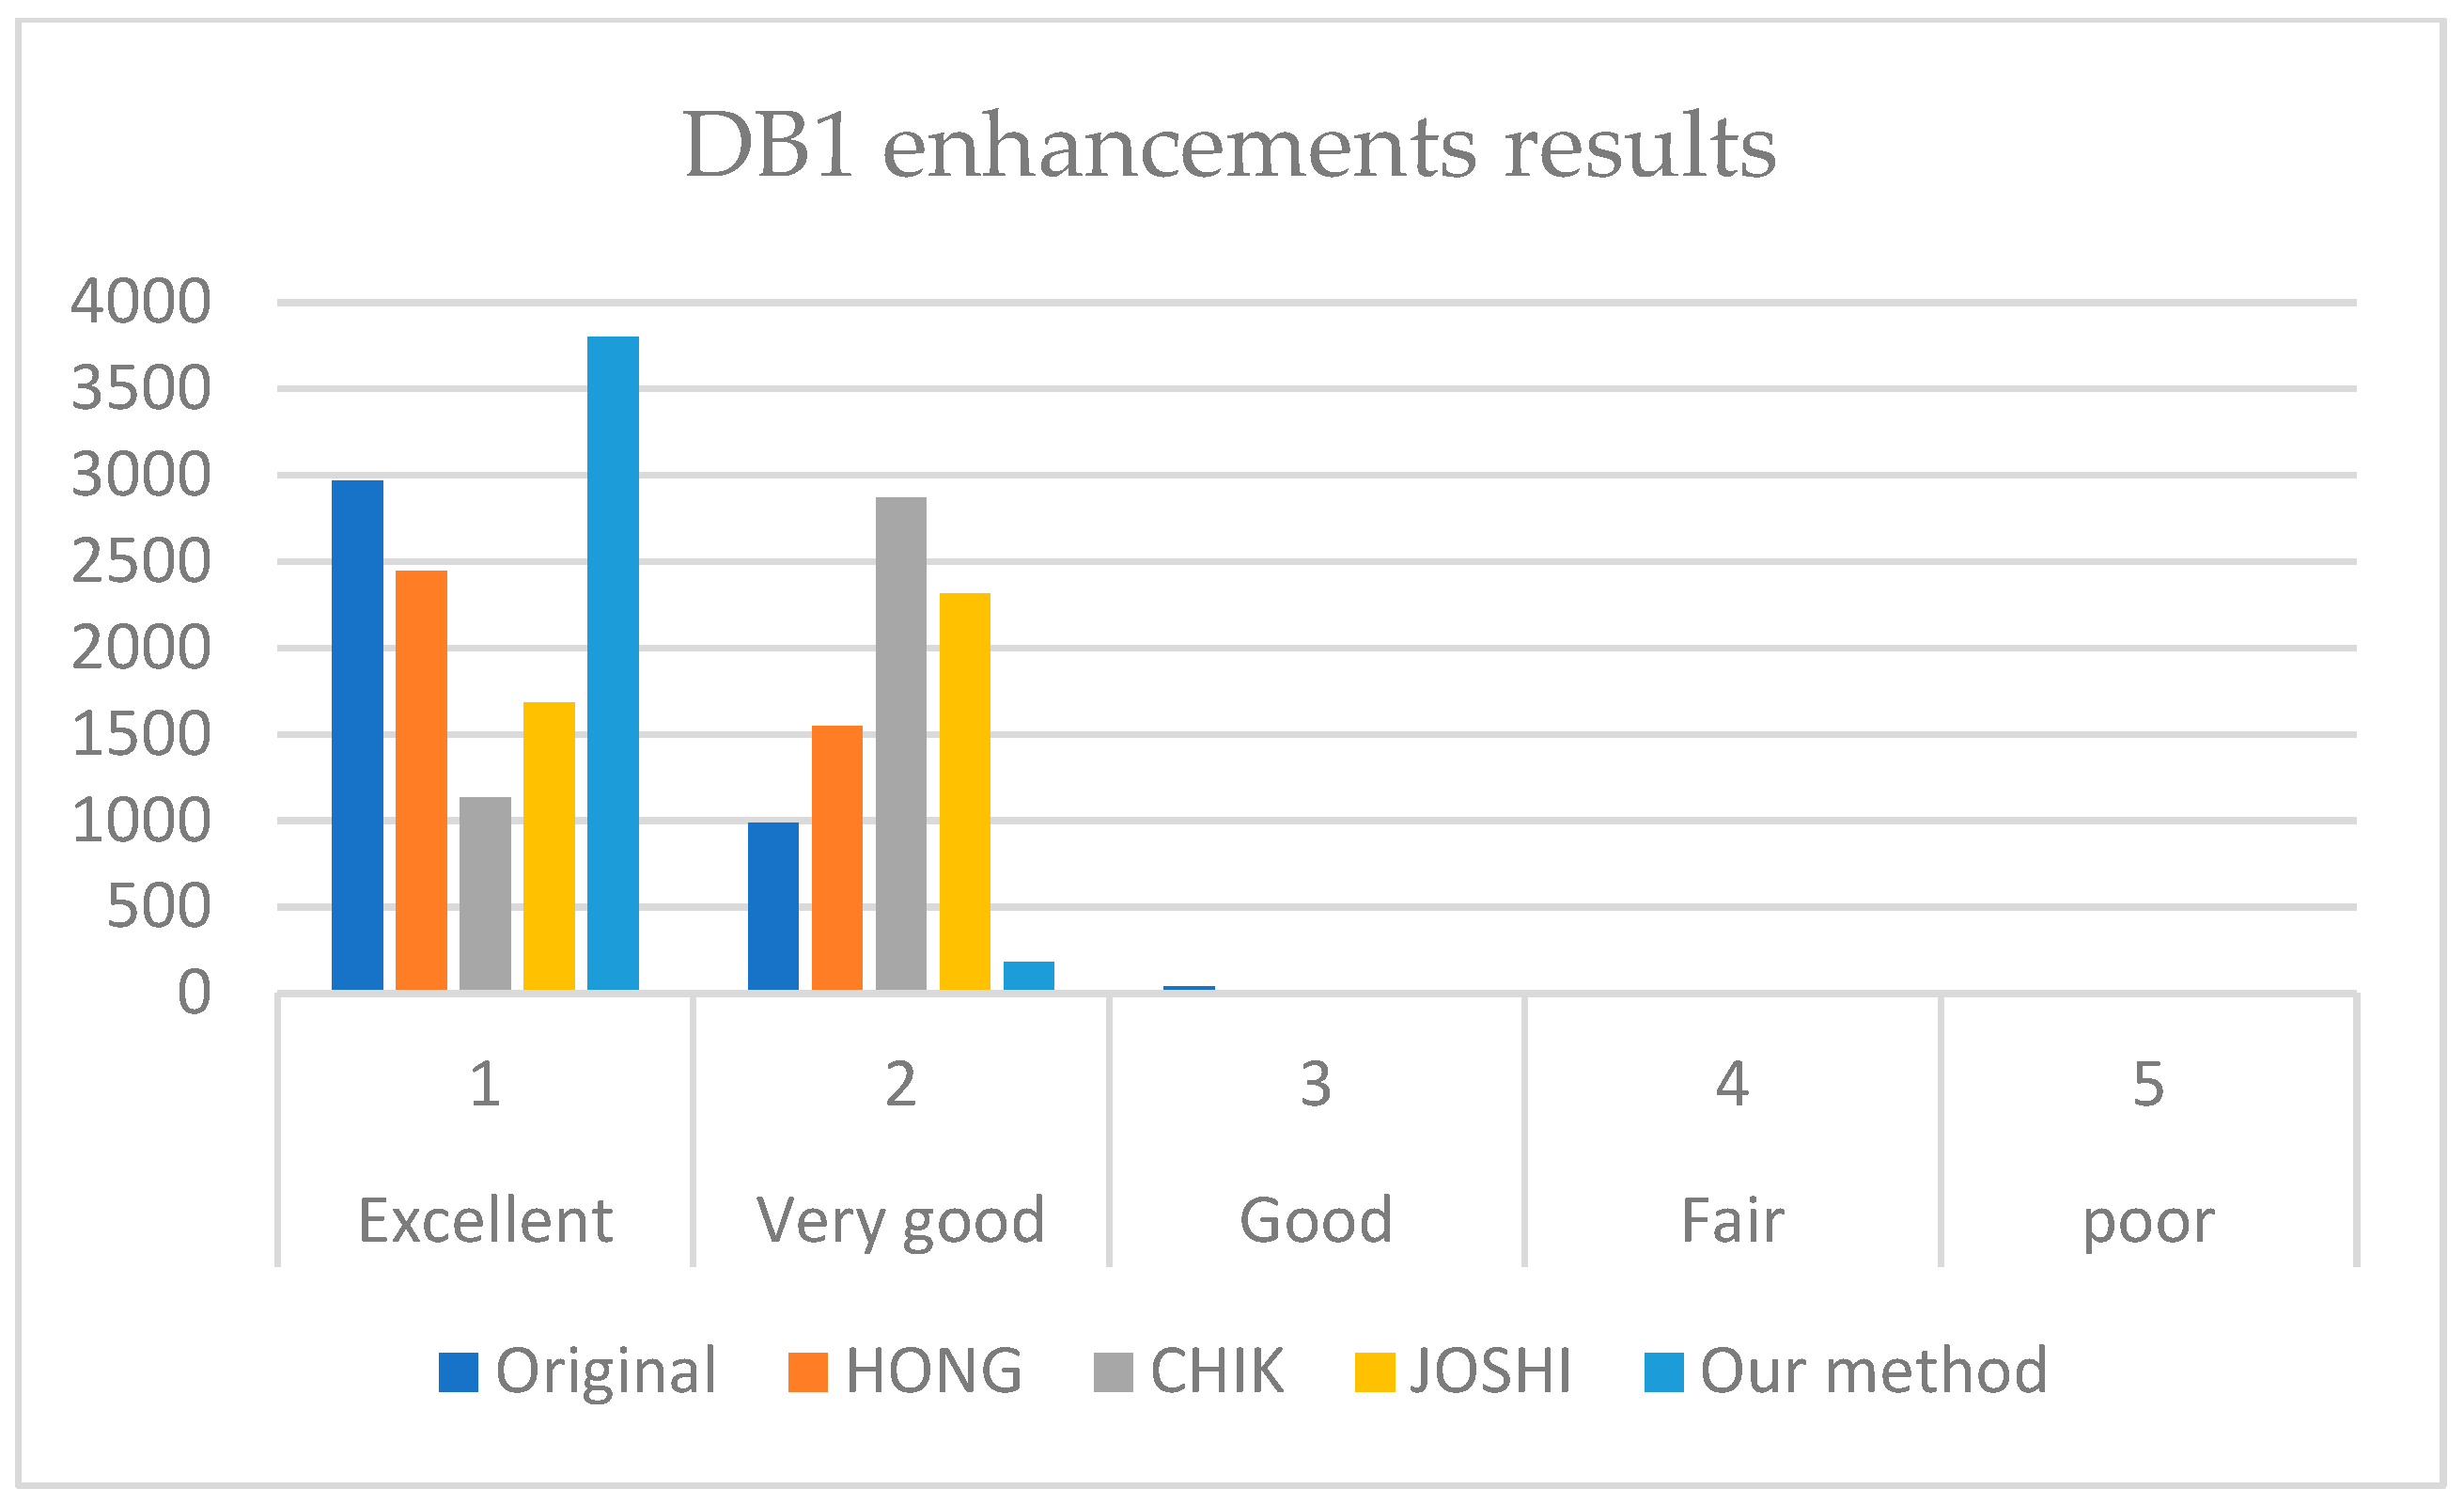
It can be noticed from
Table 4 that all images were enhanced, although different sensors were used to capture them. In DB1, there is a significant image quality enhancement, where 3796 images were enhanced out of 4000 to be in class excellent. The difference here is 204 images, which are enhanced compared to the original images.
Moreover, DB2 shows enhancement in class excellent results from 1340 to 2255 and a noticed reduction in a class fair and poor with 27 and 89 images before and 8 and 4 images after for each class. DB3 shows an increase in class excellent fingerprints by 1285 images and a reduction for all other classes; the number of fingerprints of class poor reduces from 97 to 18 after enhancement.
Two learning methods were applied: namely, conventional learning and adversarial learning. A single network was constructed with a loss function that aims to minimize the distance between the predicted and ground truth to test the impact of conventional learning, as described in
Section 3.1. On the other hand, the impact of adversarial learning was tested using two networks: a generator and a discriminator, as described in
Section 3.2. The results are shown in
Table 5 on MOLF datasets.
It can be noticed from
Table 5 that the experiment based on adversarial learning offered better results than the conventional one, although the same network architecture was used to generate the fingerprints.
Comparison with the State-of-the-Art Method
There are various studies in the field of fingerprint enhancement, for example, the methods proposed in [
7,
8,
14,
15]. Although HONG and CHIK methods are a bit old, their performance is still better than the recent methods for cross-sensor fingerprint enhancement, and, due to this reason, they have been used in recent cross-sensor matching methods [
4,
22,
23,
24,
25,
26]. So, we compared our method with HONG and CHIK methods and a more recent method, i.e., JOSHI method [
16].
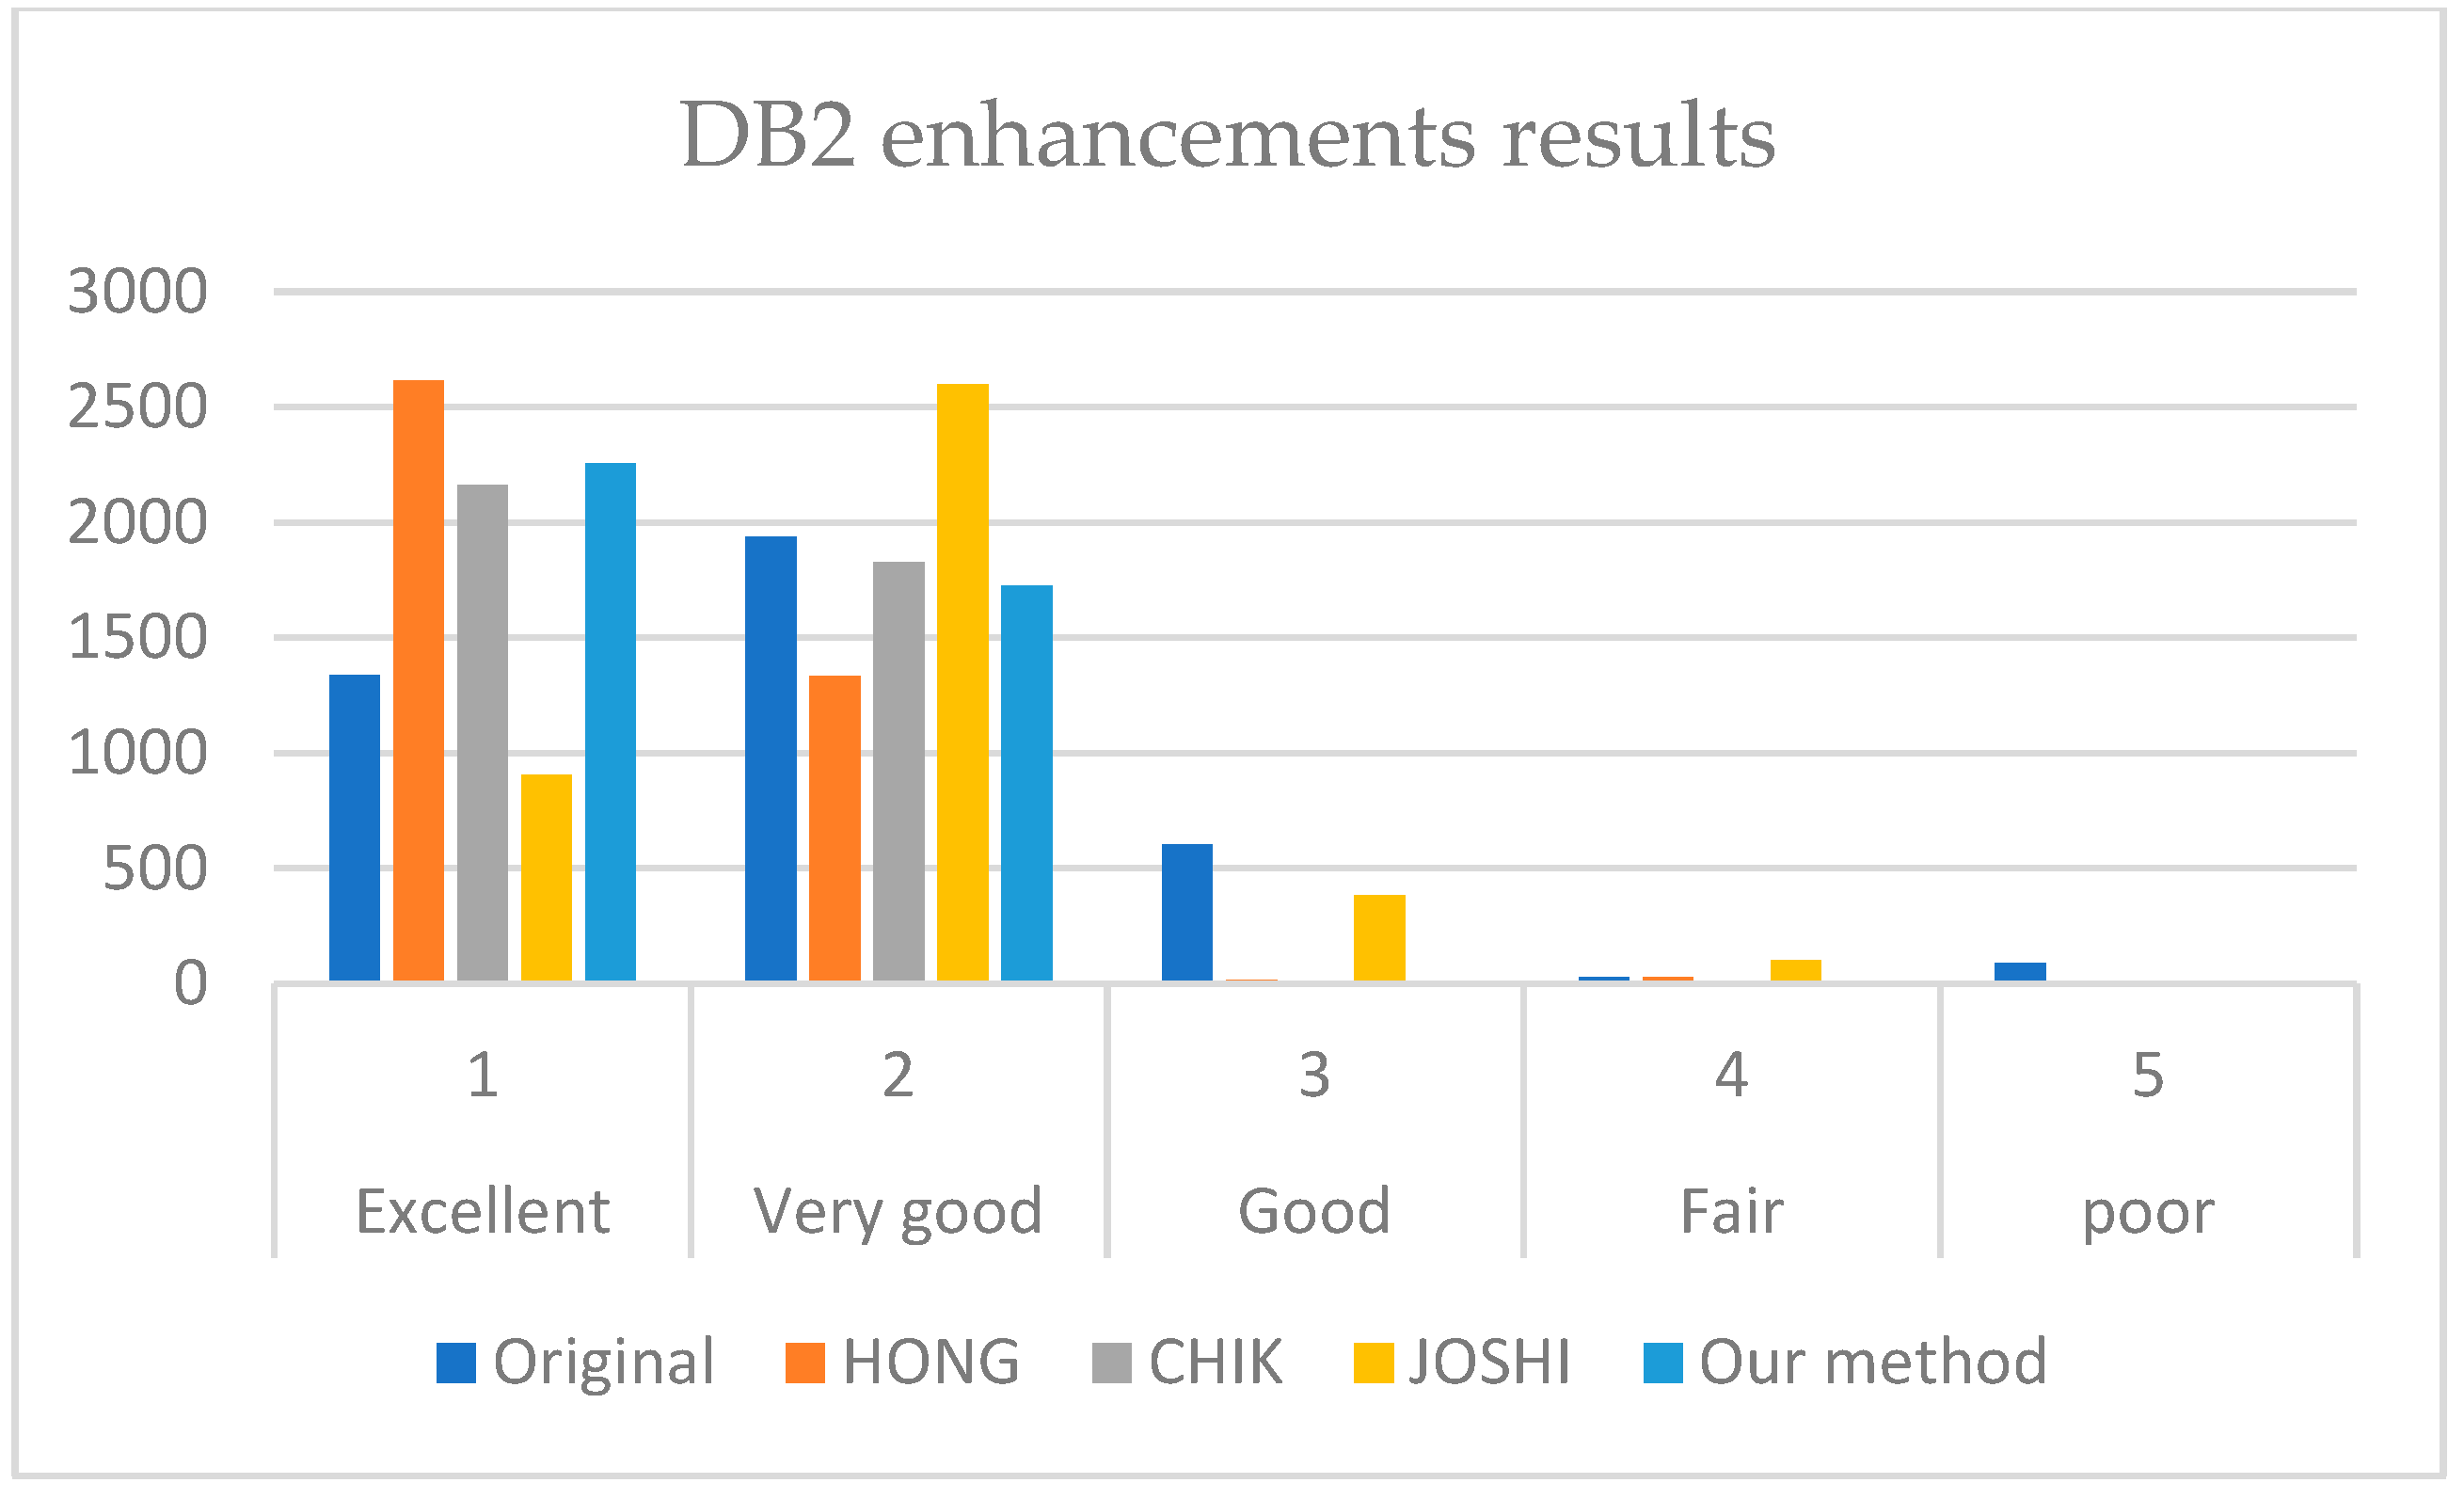
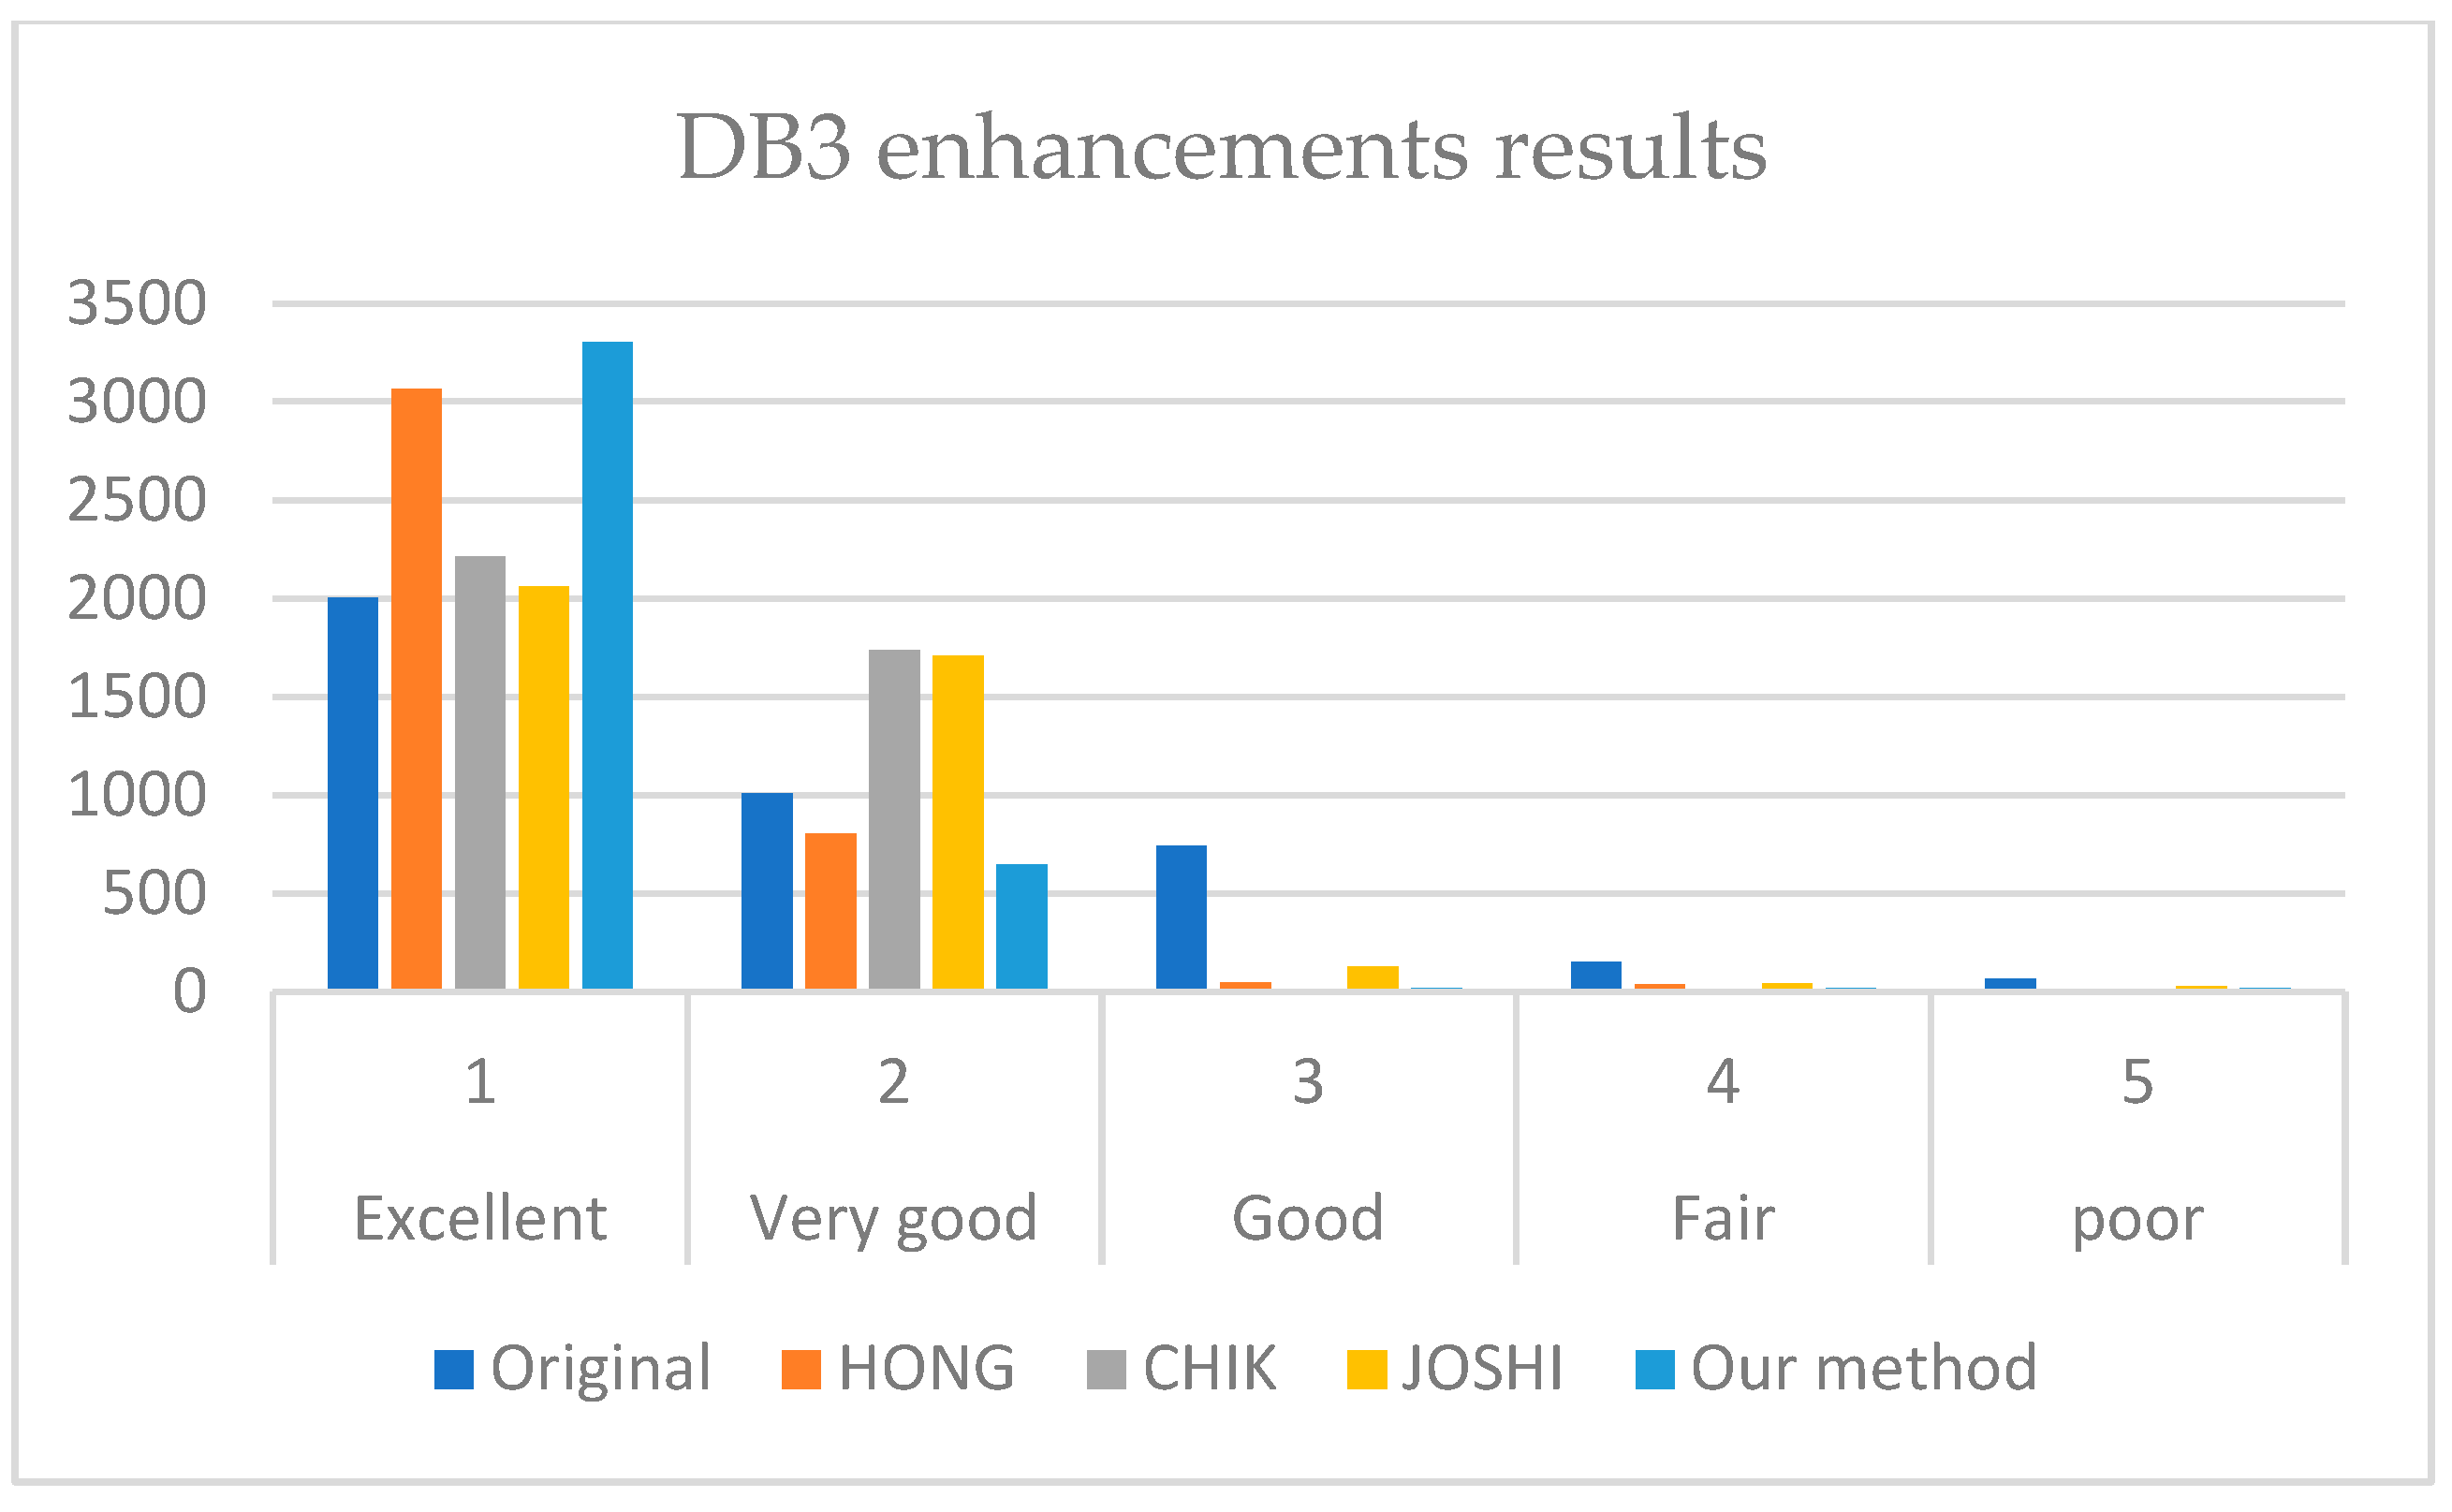
It is revealed from
Figure 7,
Figure 8 and
Figure 9 that our method outperforms HONG and CHIK methods in enhancing fingerprints to class excellent from DB1 and DB3. For DB2, the number of enhanced fingerprints to class excellent by HONG method is slightly higher than that by our method and CHIK.
5.2. Fingerprint Quality Enhancement Index (FQEI)
The FQEI metric was measured using MOLF datasets DB1, DB2, and DB3 by comparing three methods: HONG, CHIK, JOSHI [
16], and our method, where obtained results are provided in
Table 6. It can be clearly noticed that our method outperformed both HONG, CHIK, and JOSHI methods on DB1, DB2, and DB3.
For DB1, the HONG method performance is 0.2581 since the is 348, which is less than the (−808). This means that the number of images above the diagonal is less than the images below the diagonal. The same case is for CHIK performance, where the is 168, while the is −1943 since a large number of fingerprints was degraded from excellent class to very good class. In contrast, our method has a higher enhancement score than the degradation score. Thus, our method outperformed both the HONG and CHIK methods on DB1, DB2, and DB3.
Table 7,
Table 8,
Table 9,
Table 10 and
Table 11 illustrate a comparison between the enhancement results obtained with HONG method, CHIK method, JOSHI method, and our method for FingerPass datasets using NFIQ and our metric FQEI.
From
Table 7 for FingerPass dataset before enhancement, it can be noticed that there are three sensors that have the highest number of images in poor class, including AES3400, ATRUA, and FPC sensors with 1398, 3107, and 2507 images, respectively.
Based on comparing the results of NFIQ for the three methods after enhancement, it can be noticed that our method offered the highest enhancement in these three sensors by extremely reducing it to zero poor images for the first sensor, one poor image for the second sensor and zero poor images for the third sensor. Moreover, it particularly enhanced the number of images in excellent class to more than 8000 images for the first sensors and the URU4000B sensor. In contrast, the HONG method revealed the highest enhancement for AES2501 sensor. There are also two sensors with the highest number of images in the excellent class: the WS and V300 sensors.
The overall results show that our method outperformed mostly in increasing the number of images in the excellent class. The CHIK method usually transforms fingerprints’ quality to excellent and very good classes but with a noticeable reduction in the number of images in excellent class in most sensors. JOSHI method increases the number of poor fingerprints in two sensors: AES3400 and V3000.
In terms of FQEI metric, our method shows the highest results for five out of nine sensors. The results on AES3400, ATRUA, and URU4000B sensors are 0.9149, 0.9388, 0.9707, respectively, which are very close to 1, and hence a very high enhancement performance. However, a negative enhancement was achieved by JOSHI method in two sensors: AES3400 and V3000. On the other hand, CHIK method gave FQEI of −0.0012 for AES3400 sensor, where the minus sign means distortion in images, which can be obviously noticed by comparing it with the confusion matrix results as shown in
Table 12, where most images preserved in good class without enhancement as well as a slight enhancement was revealed from poor class to good class.
5.3. Structural Similarity Index Metric (SSIM)
Fingerprint enhancement algorithms are applied to improve fingerprints without changing the ridge structure. This feature can be assessed by computing the SSIM [
21] on the generated fingerprints using anguli and their related ground truth, due to the lack of databases that include low-quality images and relative high-quality images. In other words, the higher the obtained SSIM value is, the higher the preserved structural similarity between the generated and ground truth is. Moreover, this denotes that the ridge structure is also maintained.
A comparison was conducted for fingerprints that were enhanced using HONG method, CHIK method, and our method. The test datasets contain two thousand synthetic fingerprints generated using anguli [
27]. It is an open-source implementation from the fingerprint generator SFinGe [
28] based on simulating synthetic live fingerprints having similar features, such as real-live fingerprints. Two thousand (2000) synthetic fingerprint images produced by Anguli are used to test the model with pattern types following the normal distribution, including the arch, right loop, left loop, whorl, and double loop. From those images generated using Anguli, other input images with lower quality were generated by adding Gaussian noise with morphological operations and blurring the filtering in the frequency domain.
Both the mean and standard deviation of SSIM were then computed as shown in
Table 13.
The mean of SSIM between the enhanced fingerprint generated using our model and the ground truth is 0.5127. It can be noticed that our method had the highest mean of SSIM, which means that the preservation of ridge patterns is the best in our method.
5.4. Computation Time
The average computation time needed to enhance the URU4000b sensor dataset was computed. All three methods were applied on the same environment (R2021b). The experiment was also applied using a laptop with an Intel Core i7-9750H CPU at 2.60 GHz -2.59 GHz, 32.0 GB RAM, Microsoft Windows 10 in the 64-bit operating system, and an x64-based processor. Our method is faster than HONG, CHIK, and JOSHI [
16] methods as shown in
Table 14.
6. Discussion
The fingerprint sensor interoperability focuses on addressing how the fingerprint-matching system is able to compensate for the differences in the captured fingerprints for the same person by several sensors. The main causes of such variability in fingerprints are the differences in the used capturing technology of sensors, scanning area, sensor resolution, and interaction type.
In practice, each sensor generates its specific type of distortions. Hence, there is a need to enhance captured fingerprints by various sensors. To achieve this, a cross-sensor enhancement method was designed and trained using fingerprints from one sensor, which is the AES2501. On the other hand, this method revealed general enhancement results for other sensors in FingerPass and MOLF datasets. The learning approach considered is the adversarial learning one, which offers better enhancement than the conventional learning one. Moreover, it was found that there was no change in the global flow of ridge patterns within the captured fingerprints by different sensors. This proves its robustness to discrimination. Hence, the edge loss, L1 loss, and adversarial loss function were used as loss functions.
The use of dilation convolution offered better enhancement results than those measured using convolution only. This means that the small fingerprint details, considered important features for determining the identity, such as the minutia point and edges, were preserved. This is clearly illustrated in
Table 15.
Based on comparing the results of our method with those of two state-of-art fingerprint methods: HONG and CHIK and a more recent method i.e., JOSHI method [
16], using two metrics, our method outperformed both of them. However, the NFIQ metric does not offer a precise description for enhancement performance. Therefore, a new metric was designed, called FQEI. This metric gives one result value between 1 and −1 instead of the five classes results as in the NFIQ.
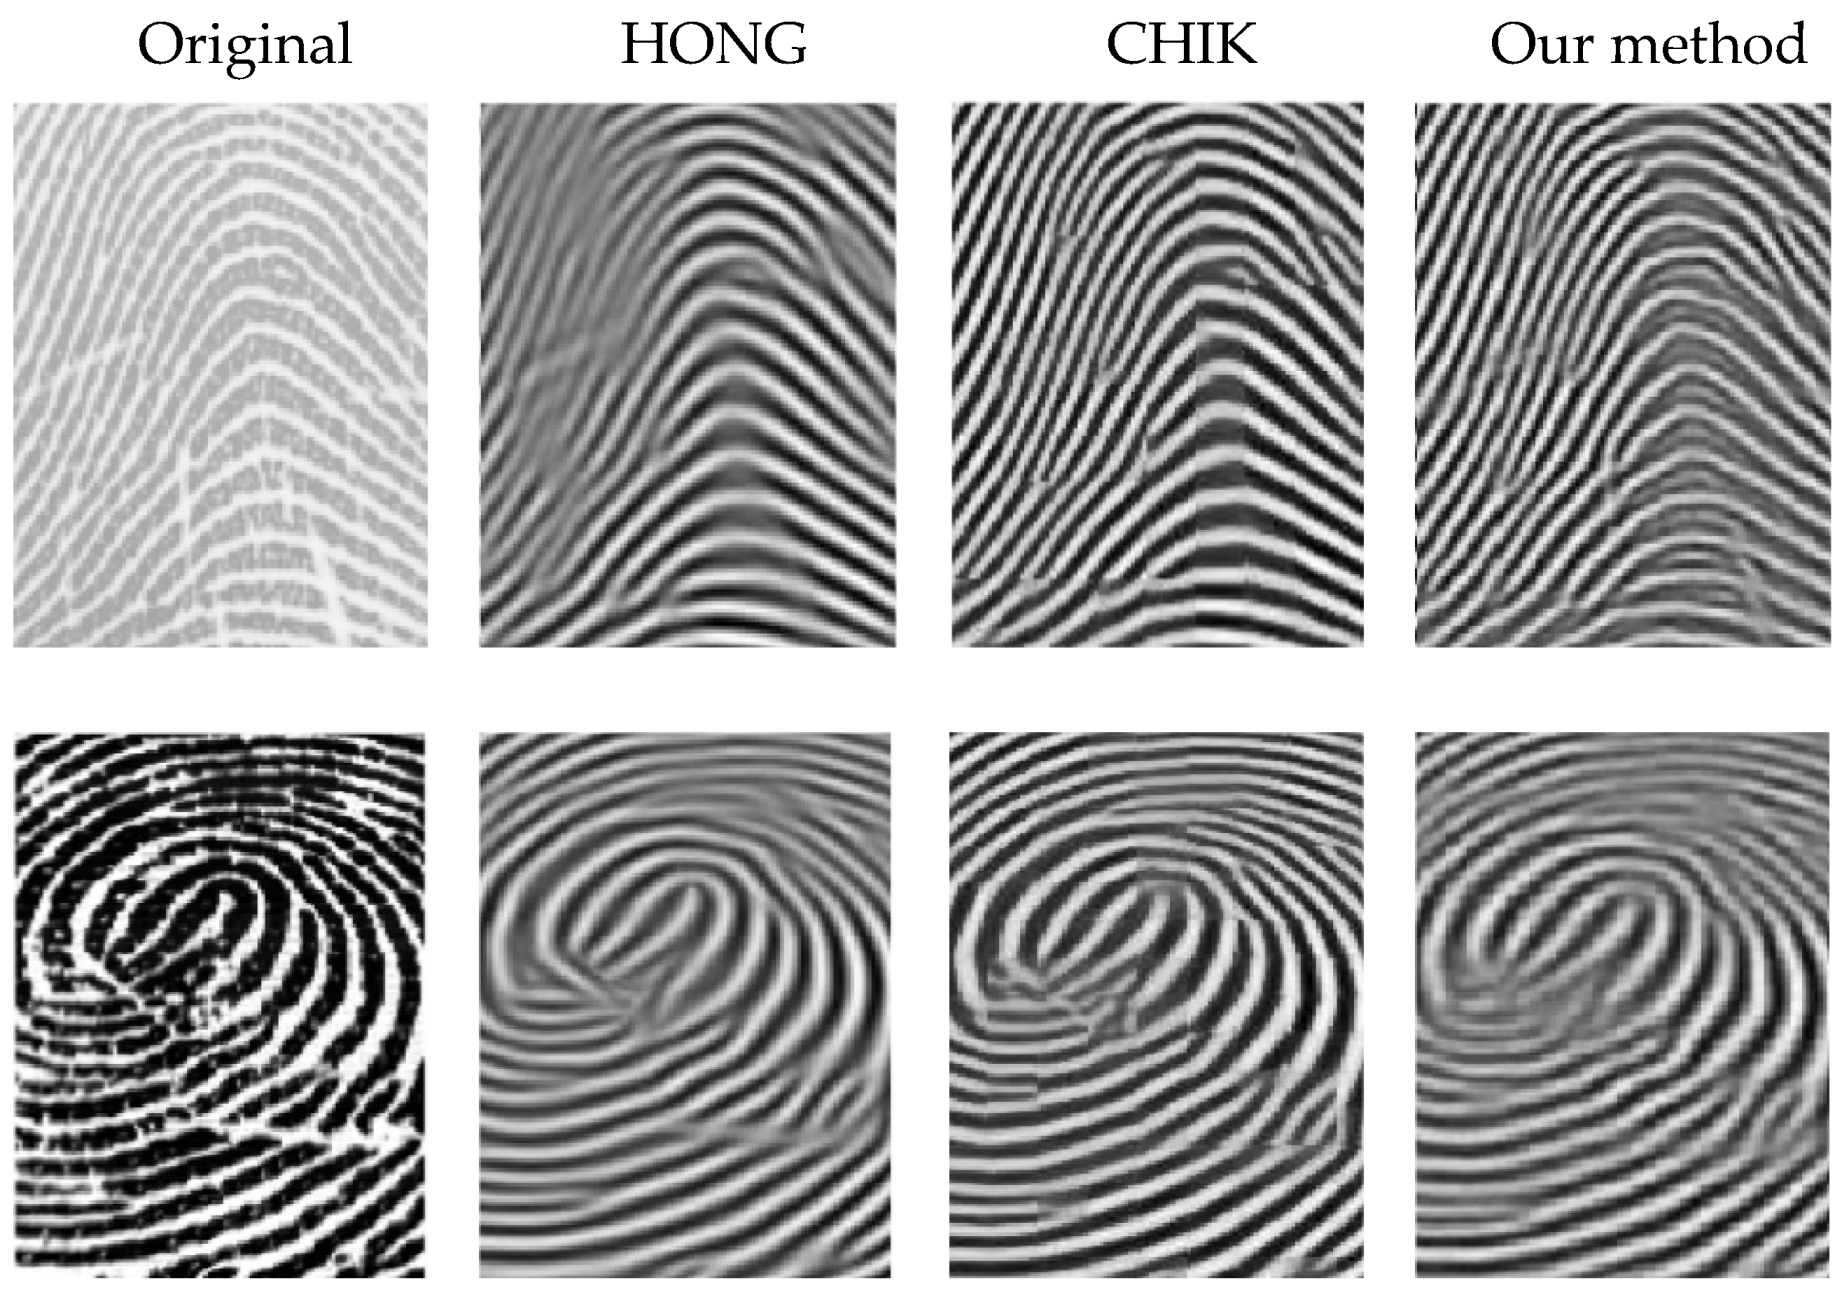
Figure 10 illustrates zoomed-in views of the fingerprints enhanced using the three methods. From the enhanced fingerprints examples shown in
Figure 10, it can be noticed that the smoothed ridges related to the processed fingerprints by the HONG method were more enhanced than those of the CHIK method. On the other hand, our method enhanced fingerprints with preserving their original ridge pattern better than HONG and CHIK.
From
Table 12, it is obvious that our method offers faster enhancement results than those of HONG, CHIK, and JOSHI methods. In other words, the average computation time needed to enhance one fingerprint by the HONG, CHIK, JOSHI, and our method was 0.63, 0.48, 0.38, and 0.087 s, respectively. Thus, our method is 13% faster than HONG method. However, there are two sensors FX3000 and V300 with less results than what was expected since the fingerprint nature is different than the original data.


