
Unsupervised Outlier Detection in IOT Using Deep VAE


Abstract
:1. Introduction
- We devised an unsupervised VAE that can detect abnormality effectively on satellite data.
- We used the VAE from its latent representation to detect correlations between satellite data and identify anomalies.
- We conducted an experimental evaluation to show that the proposed VAE outperforms cutting-edge approaches.
2. Related Work
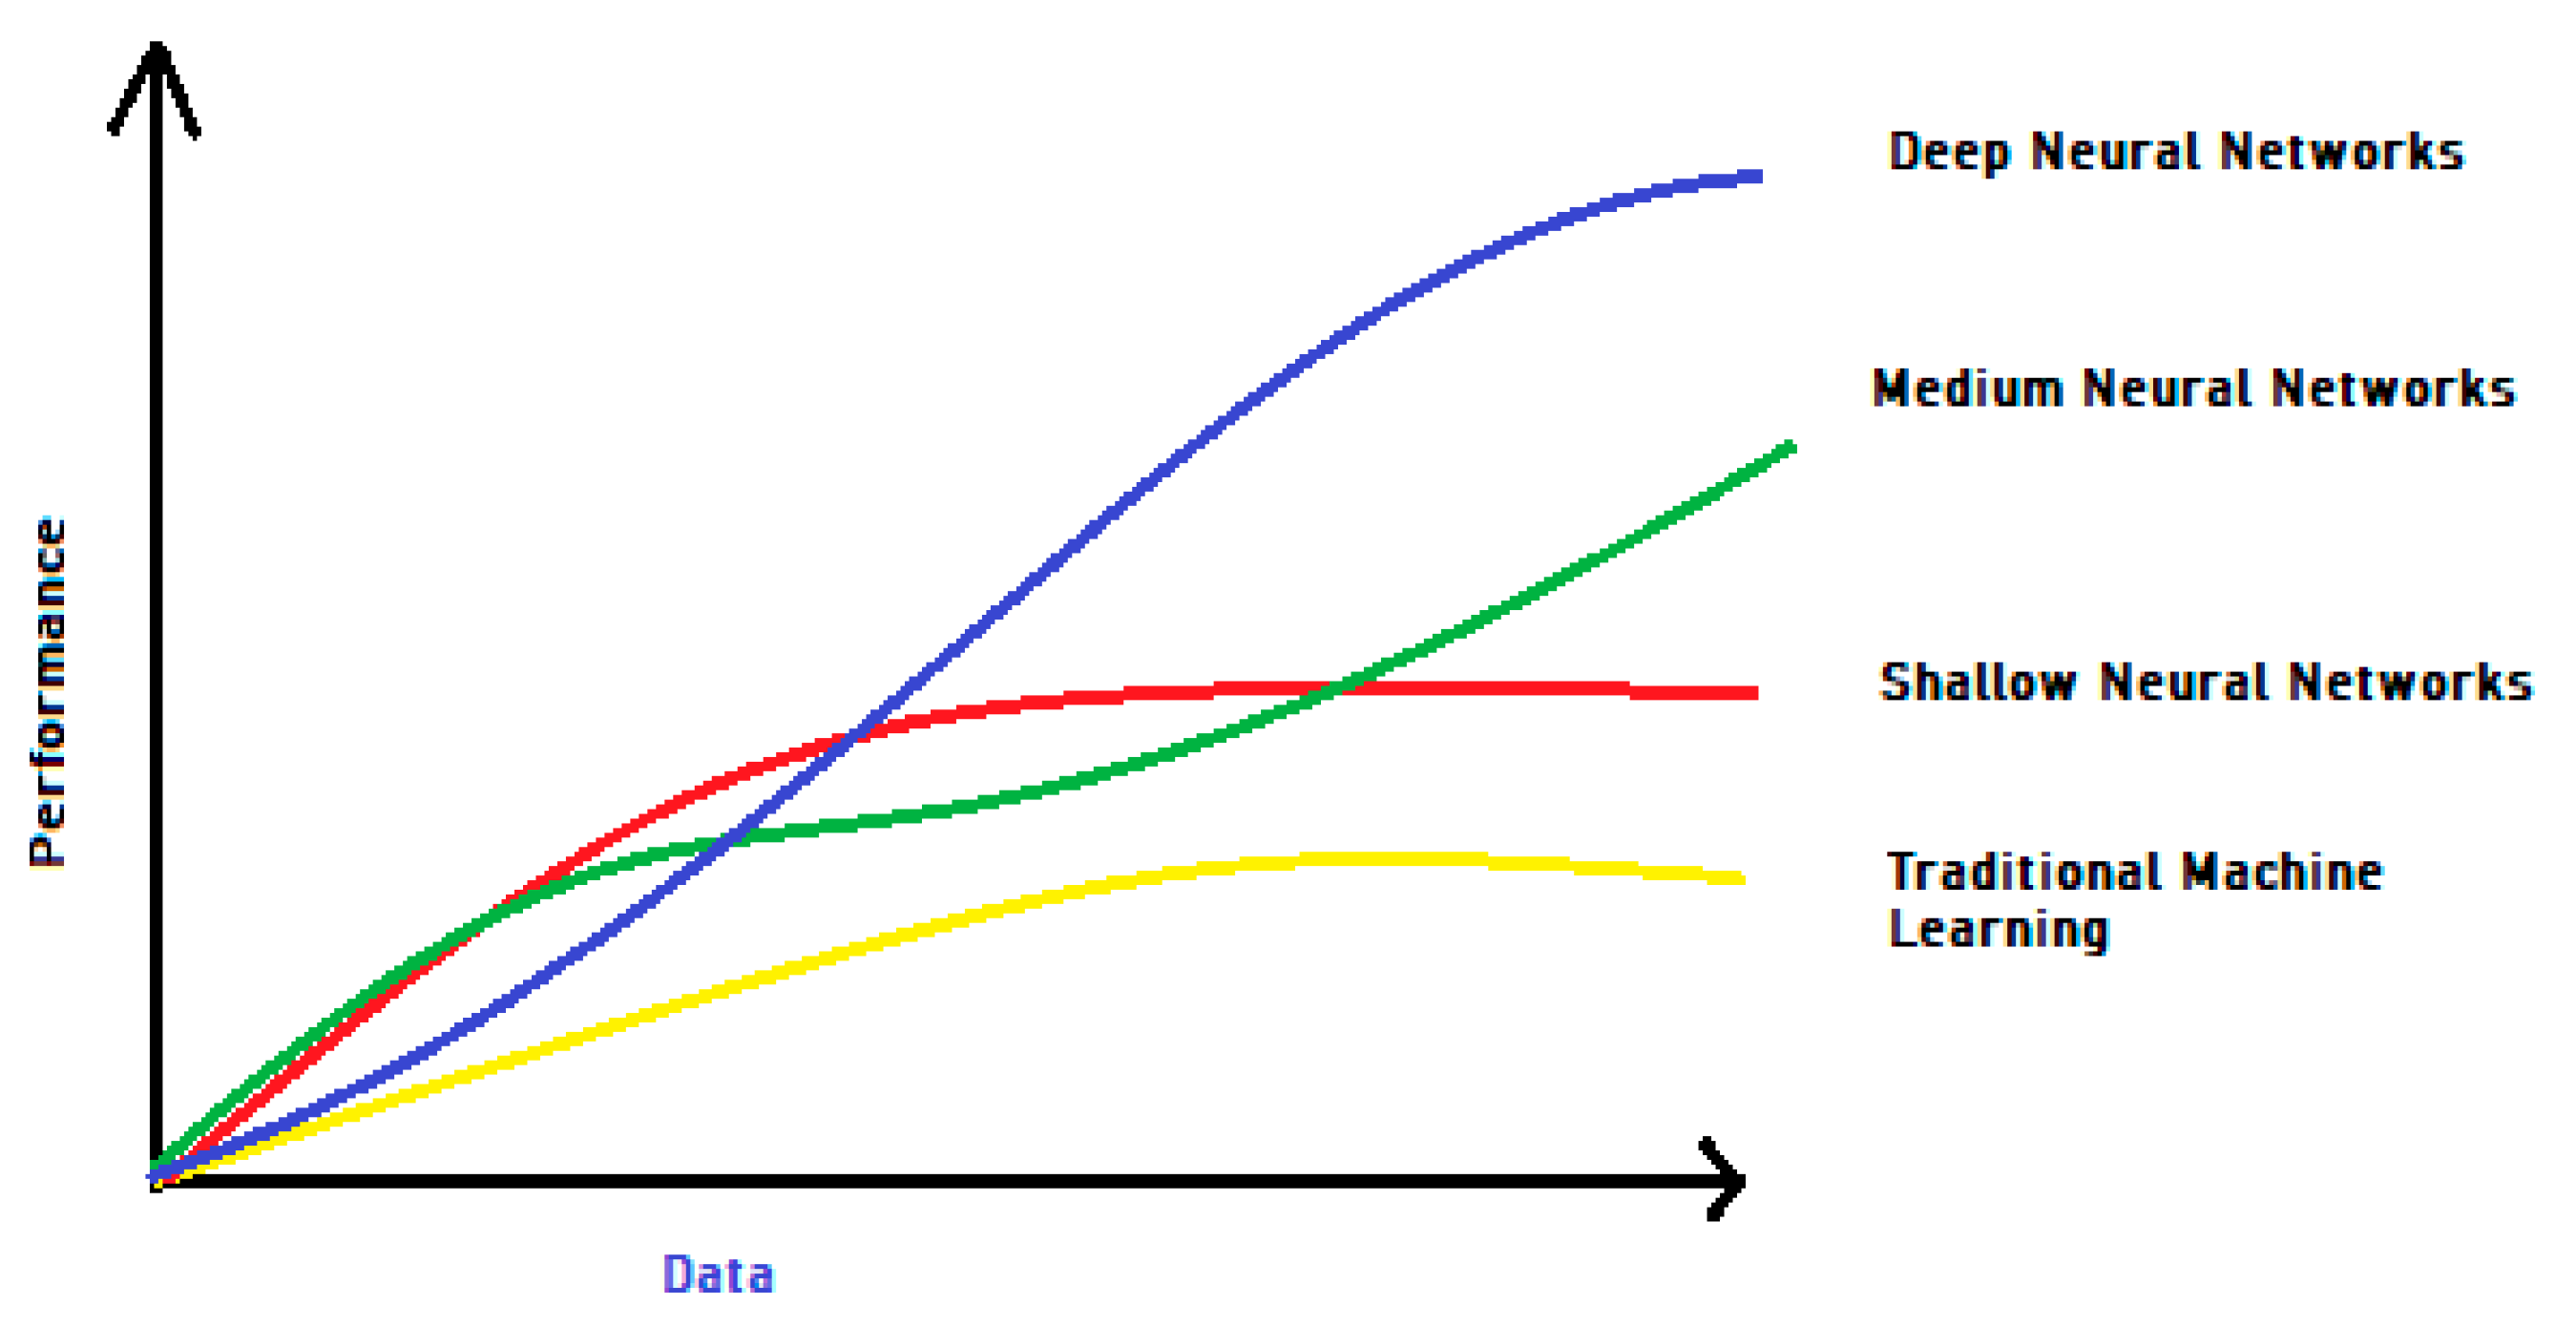
2.1. Deep Learning (DL)
2.2. VAE along with DL Techniques
3. Materials and Methods
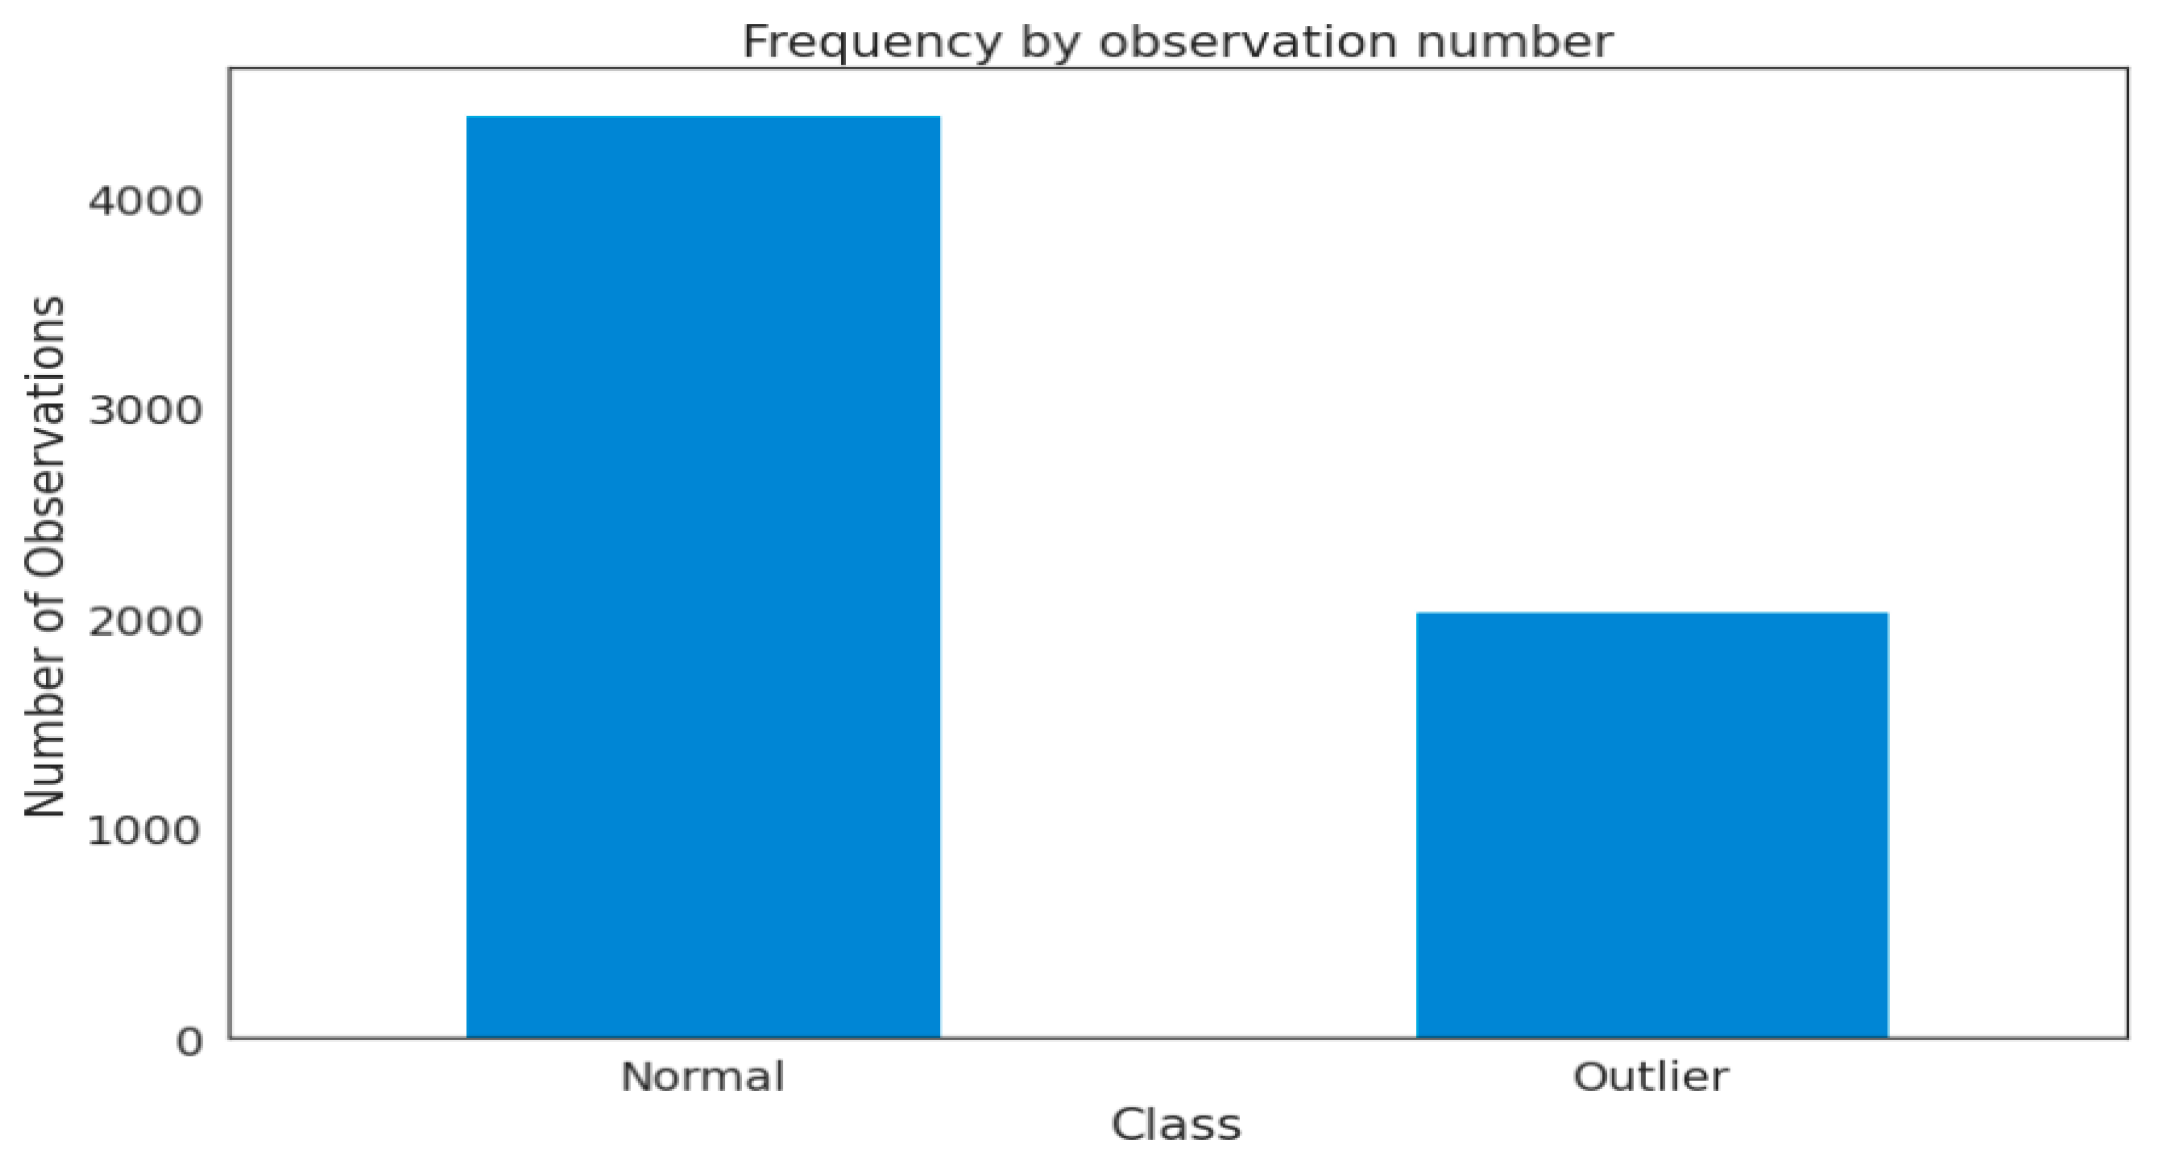
3.1. Dataset Description
3.2. Dataset Pre-Processing
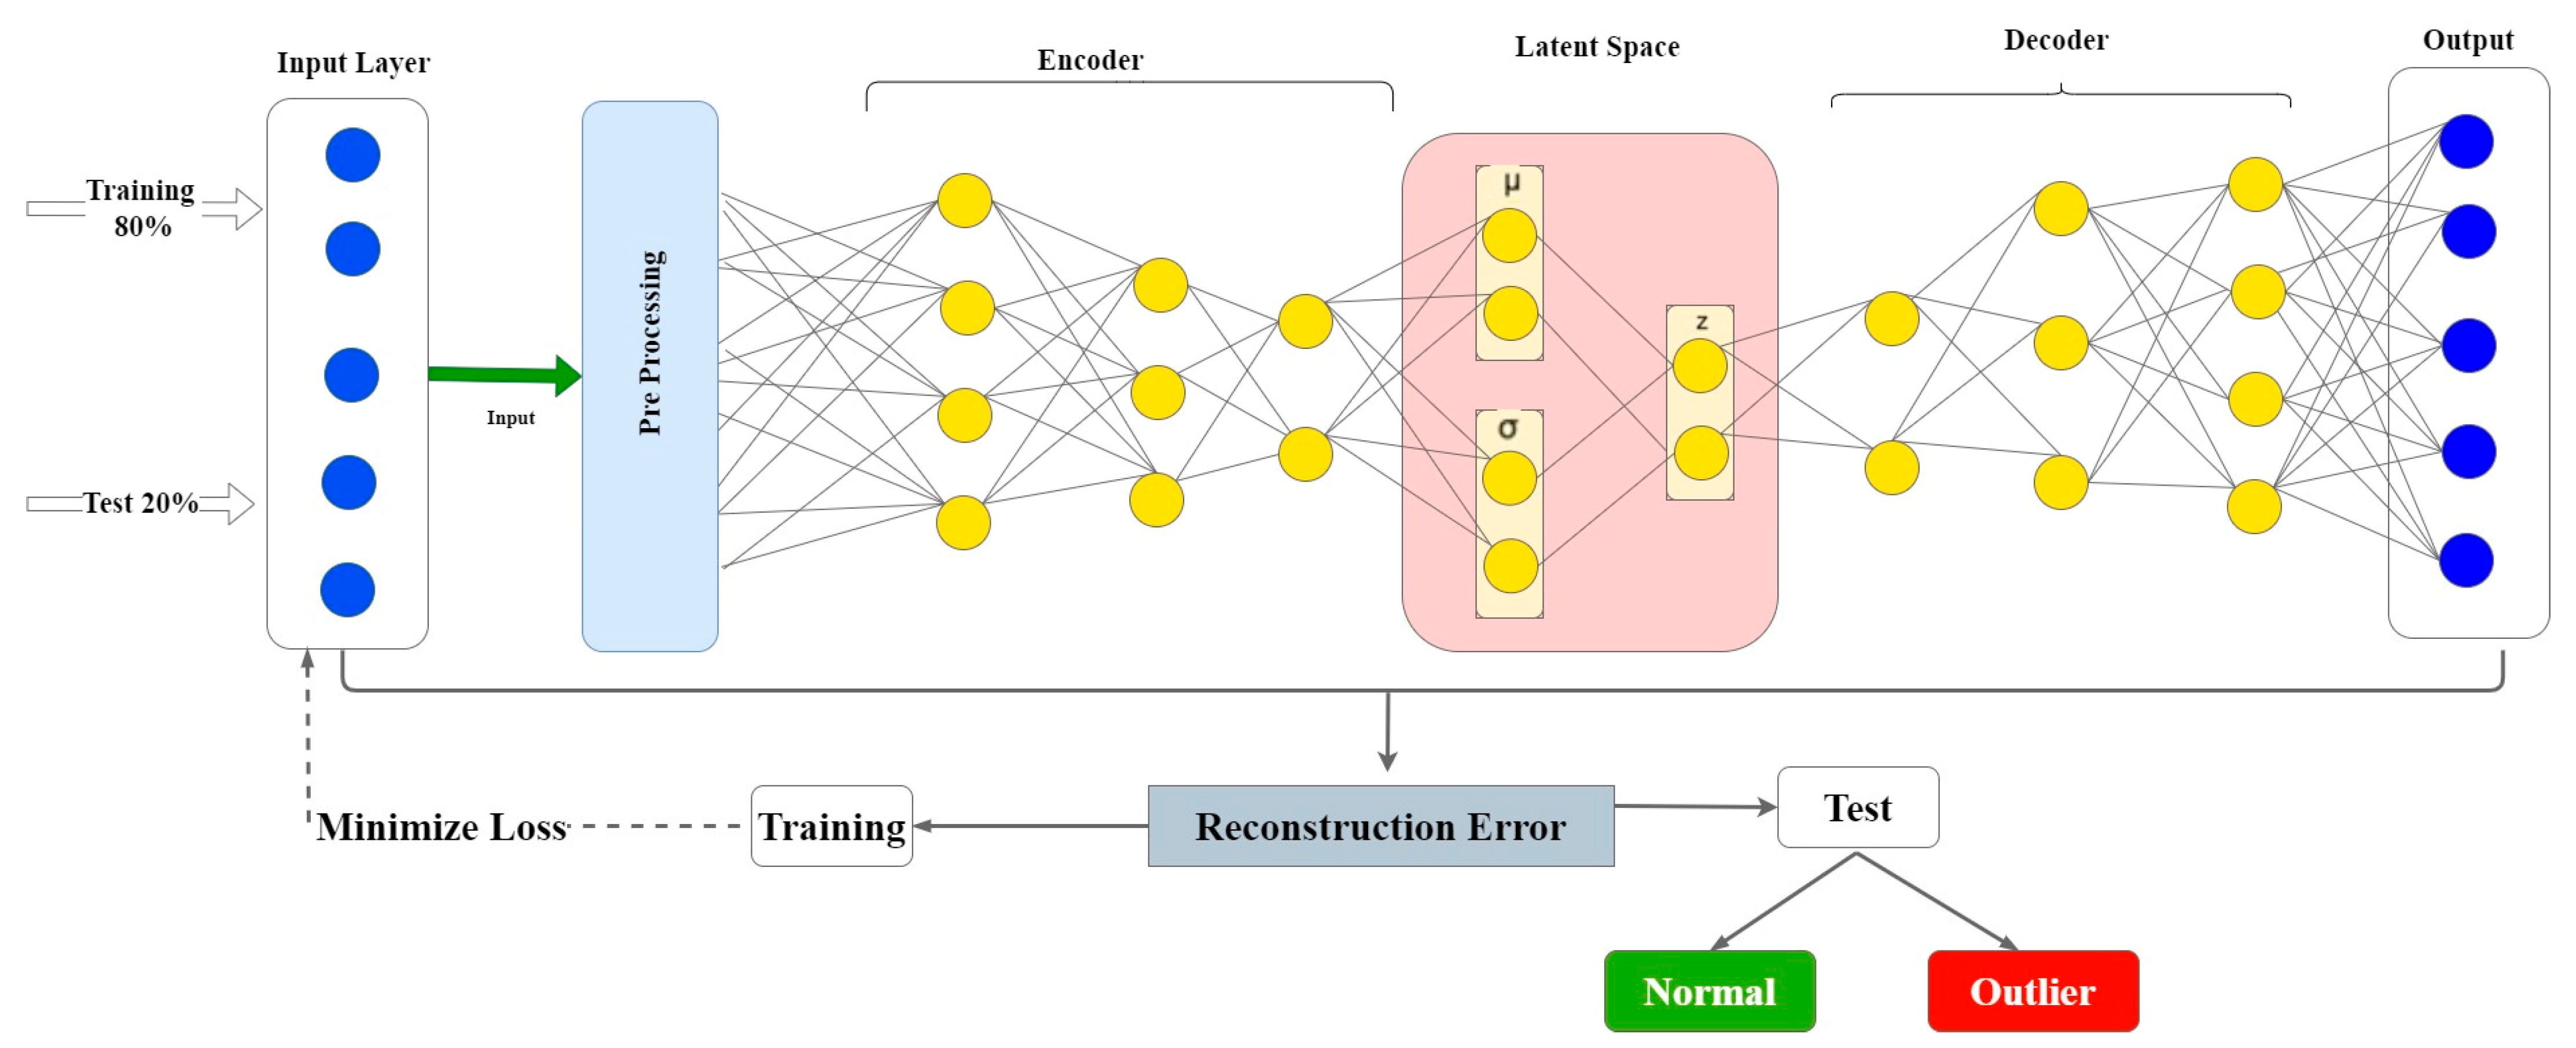
3.3. Variational Auto-Encoder Algorithm
| Algorithm 1 VAE base outlier detector | |
| Input | Normal dataset D |
| Dataset with abnormal d(i) = {1,2,3……N} | |
| A thresh hold value α | |
| Output | Reconstruction probability class labels |
| Steps | ФѲ ← train using VAE with normal dataset D |
| 1. | For loop from k = 1 to N |
| 2. | Calculate |
| 3. | if Reconstruction error (k) > α then |
| outlier ← d(k) | |
| Else | |
| Not outlier ← d(k) | |
| end if | |
| End for | |
3.4. Proposed Framework
4. Experimental Setup
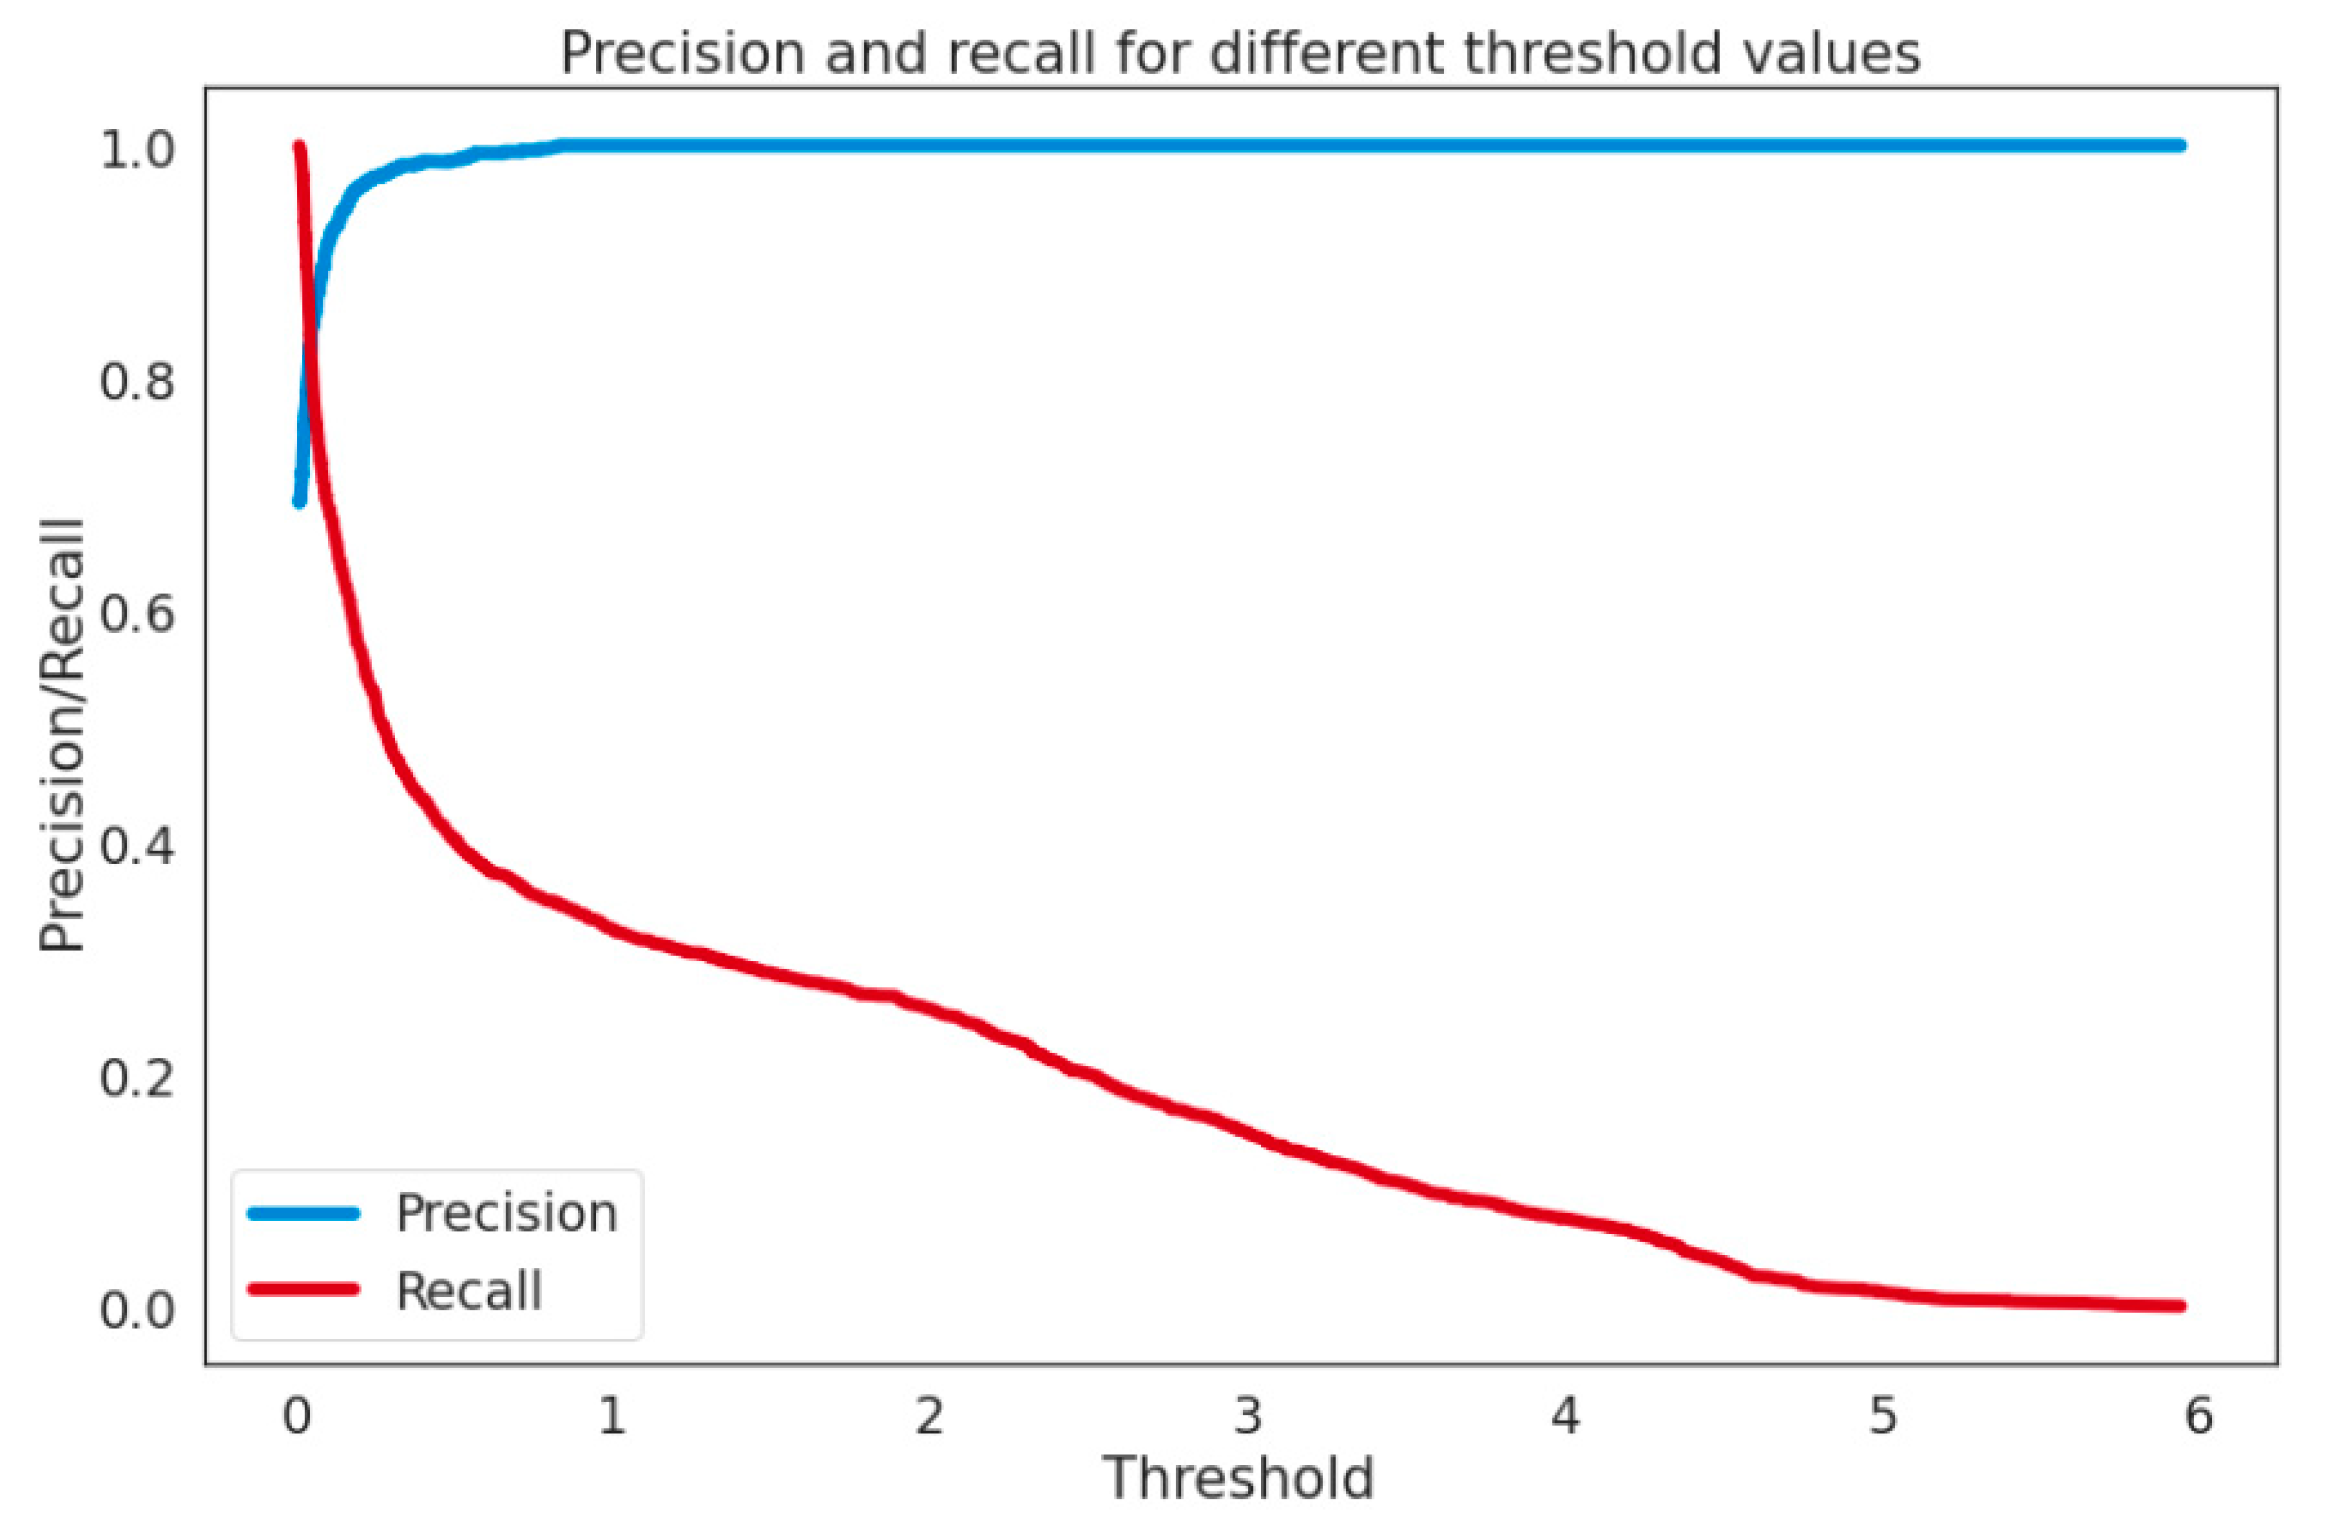
Assessment Methods
5. Discussion
6. Conclusions
Author Contributions
Funding
Institutional Review Board Statement
Informed Consent Statement
Data Availability Statement
Conflicts of Interest
References
- Islam, M.; Rahaman, A. Development of smart healthcare monitoring system in IoT environment. SN Comput. Sci. 2020, 1, 185. [Google Scholar] [CrossRef] [PubMed]
- Moin, S.; Karim, A.; Safdar, Z.; Safdar, K.; Ahmed, E.; Imran, M. Securing IoTs in distributed blockchain: Analysis, requirements and open issues. Futur. Gener. Comput. Syst. 2019, 100, 325–343. [Google Scholar] [CrossRef]
- Smys, S.; Basar, A.; Wang, H. Hybrid intrusion detection system for internet of things (IoT). J. ISMAC 2020, 2, 190–199. [Google Scholar] [CrossRef]
- Cui, L.; Yang, S.; Chen, F.; Ming, Z.; Lu, N.; Qin, J. A survey on application of machine learning for Internet of Things. Int. J. Mach. Learn. Cybern. 2018, 9, 1399–1417. [Google Scholar] [CrossRef]
- Sobin, C.C. A survey on architecture, protocols and challenges in IoT. Wirel. Pers. Commun. 2020, 112, 1383–1429. [Google Scholar] [CrossRef]
- Yadav, E.P.; Mittal, E.A.; Yadav, H. IoT: Challenges and issues in indian perspective. In Proceedings of the 2018 3rd International Conference On Internet of Things: Smart Innovation and Usages (IoT-SIU), Bhimtal, India, 23–24 February 2018; pp. 1–5. [Google Scholar]
- Hamid, B.; Jhanjhi, N.; Humayun, M.; Khan, A.; Alsayat, A. Cyber Security Issues and Challenges for Smart Cities: A survey. In Proceedings of the 2019 13th International Conference on Mathematics, Actuarial Science, Computer Science and Statistics (MACS), Karachi, Pakistan, 14–15 December 2019; pp. 1–7. [Google Scholar]
- Sadeghi, A.-R.; Wachsmann, C.; Waidner, M. Security and privacy challenges in industrial internet of things. In Proceedings of the 2015 52nd ACM/EDAC/IEEE Design Automation Conference (DAC), San Francisco, CA, USA, 8–12 June 2015; pp. 1–6. [Google Scholar]
- Pang, G.; van den Hengel, A.; Shen, C.; Cao, L. Toward Deep Supervised Anomaly Detection: Reinforcement Learning from Partially Labeled Anomaly Data; Association for Computing Machinery: New York, NY, USA, 2021; Volume 1. [Google Scholar]
- Zavrak, S.; Iskefiyeli, M. Anomaly-Based Intrusion Detection from Network Flow Features Using Variational Autoencoder. IEEE Access 2020, 8, 108346–108358. [Google Scholar] [CrossRef]
- Zoppi, T.; Ceccarelli, A.; Capecchi, T.; Bondavalli, A. Unsupervised anomaly detectors to detect intrusions in the current threat landscape. ACM/IMS Trans. Data Sci. 2021, 2, 1–26. [Google Scholar] [CrossRef]
- Fan, C.; Xiao, F.; Zhao, Y.; Wang, J. Analytical investigation of autoencoder-based methods for unsupervised anomaly detection in building energy data. Appl. Energy 2018, 211, 1123–1135. [Google Scholar] [CrossRef]
- Yamanishi, K.; Takeuchi, J.-I.; Williams, G.; Milne, P. On-line unsupervised outlier detection using finite mixtures with discounting learning algorithms. Data Min. Knowl. Discov. 2004, 8, 275–300. [Google Scholar] [CrossRef]
- Yao, R.; Liu, C.; Zhang, L.; Peng, P. Unsupervised anomaly detection using variational auto-encoder based feature extraction. In Proceedings of the 2019 IEEE International Conference on Prognostics and Health Management (ICPHM), San Francisco, CA, USA, 17–20 June 2019. [Google Scholar]
- Nawaz, A.; Awan, A.A.; Ali, T.; Rana, M.R.R. Product’s behaviour recommendations using free text: An aspect based sentiment analysis approach. Cluster Comput. 2020, 23, 1267–1279. [Google Scholar] [CrossRef]
- Shen, B.; Ge, Z. Supervised nonlinear dynamic system for soft sensor application aided by variational auto-encoder. IEEE Trans. Instrum. Meas. 2020, 69, 6132–6142. [Google Scholar] [CrossRef]
- Fan, Y.; Wen, G.; Li, D.; Qiu, S.; Levine, M.D.; Xiao, F. Video anomaly detection and localization via Gaussian Mixture Fully Convolutional Variational Autoencoder. Comput. Vis. Image Underst. 2020, 195, 102920. [Google Scholar] [CrossRef]
- Tahir, S.; Hafeez, Y.; Abbas, M.A.; Nawaz, A.; Hamid, B. Smart Learning Objects Retrieval for E-Learning with Contextual Recommendation based on Collaborative Filtering. Educ. Inf. Technol. 2022, 27, 8631–8668. [Google Scholar] [CrossRef]
- Guo, Y.; Ji, T.; Wang, Q.; Yu, L.; Min, G.; Li, P. Unsupervised Anomaly Detection in IoT Systems for Smart Cities. IEEE Trans. Netw. Sci. Eng. 2020, 7, 2231–2242. [Google Scholar] [CrossRef]
- Nugroho, H.; Susanty, M.; Irawan, A.; Koyimatu, M.; Yunita, A. Fully convolutional variational autoencoder for feature extraction of fire detection system. J. Ilmu Komput. Dan Inf. 2020, 13, 9–15. [Google Scholar] [CrossRef]
- Liang, H.; Song, L.; Wang, J.; Guo, L.; Li, X.; Liang, J. Robust unsupervised anomaly detection via multi-time scale DCGANs with forgetting mechanism for industrial multivariate time series. Neurocomputing 2021, 423, 444–462. [Google Scholar] [CrossRef]
- Ni, F.; Zhang, J.; Noori, M.N. Deep learning for data anomaly detection and data compression of a long-span suspension bridge. Comput. Civ. Infrastruct. Eng. 2020, 35, 685–700. [Google Scholar] [CrossRef]
- Otoum, Y.; Liu, D.; Nayak, A. DL-IDS: A deep learning--based intrusion detection framework for securing IoT. Trans. Emerg. Telecommun. Technol. 2022, 33, e3803. [Google Scholar] [CrossRef]
- Song, H.M.; Woo, J.; Kim, H.K. In-vehicle network intrusion detection using deep convolutional neural network. Veh. Commun. 2020, 21, 100198. [Google Scholar] [CrossRef]
- Zahid, M.; Ahmed, F.; Javaid, N.; Abbasi, R.A.; Zainab Kazmi, H.S.; Javaid, A.; Bilal, M.; Akbar, M.; Ilahi, M. Electricity price and load forecasting using enhanced convolutional neural network and enhanced support vector regression in smart grids. Electronics 2019, 8, 122. [Google Scholar] [CrossRef] [Green Version]
- Caroppo, A.; Leone, A.; Siciliano, P. Comparison between deep learning models and traditional machine learning approaches for facial expression recognition in ageing adults. J. Comput. Sci. Technol. 2020, 35, 1127–1146. [Google Scholar] [CrossRef]
- Chalapathy, R.; Chawla, S. Deep Learning for Anomaly Detection: A Survey. arXiv 2019, arXiv:1901.03407. [Google Scholar]
- Hasan, M.; Choi, J.; Neumann, J.; Roy-Chowdhury, A.K.; Davis, L.S. Learning temporal regularity in video sequences. In Proceedings of the IEEE Conference on Computer Vision and Pattern Recognition, Las Vegas, NV, USA, 27–30 June 2016; pp. 733–742. [Google Scholar]
- Li, Y.; Ma, R.; Jiao, R. A hybrid malicious code detection method based on deep learning. Int. J. Secur. Its Appl. 2015, 9, 205–216. [Google Scholar] [CrossRef]
- Ullah, Z.; Al-Turjman, F.; Mostarda, L.; Gagliardi, R. Applications of Artificial Intelligence and Machine learning in smart cities. Comput. Commun. 2020, 154, 313–323. [Google Scholar] [CrossRef]
- Chen, D.; Wawrzynski, P.; Lv, Z. Cyber security in smart cities: A review of deep learning-based applications and case studies. Sustain. Cities Soc. 2021, 66, 102655. [Google Scholar] [CrossRef]
- Garg, S.; Kaur, K.; Kumar, N.; Rodrigues, J.J.P.C. Hybrid deep-learning-based anomaly detection scheme for suspicious flow detection in SDN: A social multimedia perspective. IEEE Trans. Multimed. 2019, 21, 566–578. [Google Scholar] [CrossRef]
- Deng, X.; Huangfu, F. Collaborative variational deep learning for healthcare recommendation. IEEE Access 2019, 7, 55679–55688. [Google Scholar] [CrossRef]
- Gouda, W.; Almurafeh, M.; Humayun, M.; Jhanjhi, N.Z. Detection of COVID-19 Based on Chest X-rays Using Deep Learning. Healthcare 2022, 10, 343. [Google Scholar] [CrossRef]
- Mansour, R.F.; Escorcia-Gutierrez, J.; Gamarra, M.; Gupta, D.; Castillo, O.; Kumar, S. Unsupervised deep learning based variational autoencoder model for COVID-19 diagnosis and classification. Pattern Recognit. Lett. 2021, 151, 267–274. [Google Scholar] [CrossRef]
- Guo, F.; Xie, R.; Huang, B. A deep learning just-in-time modeling approach for soft sensor based on variational autoencoder. Chemom. Intell. Lab. Syst. 2020, 197, 103922. [Google Scholar] [CrossRef]
- Ionescu, R.T.; Khan, F.S.; Georgescu, M.I.; Shao, L. Object-centric auto-encoders and dummy anomalies for abnormal event detection in video. In Proceedings of the IEEE/CVF Conference on Computer Vision and Pattern Recognition (CVPR), Long Beach, CA, USA, 15–20 June 2019; pp. 7834–7843. [Google Scholar]
- Chen, J.; Sathe, S.; Aggarwal, C.; Turaga, D. Outlier detection with autoencoder ensembles. In Proceedings of the 2017 SIAM International Conference on Data Mining, Houston, TX, USA, 27–29 April 2017; pp. 90–98. [Google Scholar]
- Lu, W.; Cheng, Y.; Xiao, C.; Chang, S.; Huang, S.; Liang, B.; Huang, T. Unsupervised sequential outlier detection with deep architectures. IEEE Trans. Image Process. 2017, 26, 4321–4330. [Google Scholar] [CrossRef] [PubMed]
- Golan, I.; El-Yaniv, R. Deep anomaly detection using geometric transformations. Adv. Neural Inf. Process. Syst. 2018, 31, 9758–9769. [Google Scholar]
- Wang, S.; Zeng, Y.; Liu, X.; Zhu, E.; Yin, J.; Xu, C.; Kloft, M. Effective end-to-end unsupervised outlier detection via inlier priority of discriminative network. Adv. Neural Inf. Process. Syst. 2019, 32, 1–14. [Google Scholar]
- Nguyen, M.-N.; Vien, N.A. Scalable and interpretable one-class svms with deep learning and random fourier features. In Joint European Conference on Machine Learning and Knowledge Discovery in Databases; Springer: Cham, Switzerland, 2018; pp. 157–172. [Google Scholar]
- Zong, B.; Song, Q.; Min, M.R.; Cheng, W.; Lumezanu, C.; Cho, D.; Chen, H. Deep autoencoding gaussian mixture model for unsupervised anomaly detection. In Proceedings of the International Conference on Learning Representations, Vancouver, BC, Canada, 30 April–3 May 2018. [Google Scholar]
- Fan, S.; Shi, C.; Wang, X. Abnormal event detection via heterogeneous information network embedding. In Proceedings of the 27th ACM International Conference on Information and Knowledge Management, Torino Italy, 22–26 October 2018; pp. 1483–1486. [Google Scholar]
- Sabokrou, M.; Khalooei, M.; Fathy, M.; Adeli, E. Adversarially learned one-class classifier for novelty detection. In Proceedings of the IEEE Conference on Computer Vision and Pattern Recognition, Salt Lake City, UT, USA, 18–22 June 2018; pp. 3379–3388. [Google Scholar]
- Zheng, P.; Yuan, S.; Wu, X.; Li, J.; Lu, A. One-class adversarial nets for fraud detection. Proc. AAAI Conf. Artif. Intell. 2019, 33, 1286–1293. [Google Scholar] [CrossRef]
- Zhou, J.; Wang, X.; Yang, C.; Xiong, W. A novel soft sensor modeling approach based on difference-LSTM for complex industrial process. IEEE Trans. Ind. Inform. 2021, 18, 2955–2964. [Google Scholar] [CrossRef]
- Vincent, P.; Larochelle, H.; Lajoie, I.; Bengio, Y.; Manzagol, P.-A.; Bottou, L. Stacked denoising autoencoders: Learning useful representations in a deep network with a local denoising criterion. J. Mach. Learn. Res. 2010, 11, 3371–3408. [Google Scholar]
- Chen, J.; Pi, D.; Wu, Z.; Zhao, X.; Pan, Y.; Zhang, Q. Imbalanced satellite telemetry data anomaly detection model based on Bayesian LSTM. Acta Astronaut. 2021, 180, 232–242. [Google Scholar] [CrossRef]
- Xie, L.; Pi, D.; Zhang, X.; Chen, J.; Luo, Y.; Yu, W. Graph neural network approach for anomaly detection. Meas. J. Int. Meas. Confed. 2021, 180, 109546. [Google Scholar] [CrossRef]
- Shriram, S.; Sivasankar, E. Anomaly Detection on Shuttle data using Unsupervised Learning Techniques. In Proceedings of the 2019 International Conference on Computational Intelligence and Knowledge Economy (ICCIKE), Dubai, United Arab Emirates, 11–12 December 2019; pp. 221–225. [Google Scholar]
- Jiang, H.; Zhang, K.; Wang, J.; Wang, X.; Huang, P. Anomaly detection and identification in satellite telemetry data based on pseudo-period. Appl. Sci. 2020, 10, 103. [Google Scholar] [CrossRef]
- Bawono, A.H.; Bachtiar, F.A. Outlier Detection with Supervised Learning Method. In Proceedings of the 2019 International Conference on Sustainable Information Engineering and Technology (SIET), Lombok, Indonesia, 28–30 September 2019; pp. 306–309. [Google Scholar]
- Niu, Z.; Yu, K.; Wu, X. LSTM-Based VAE-GAN for Time-Series Anomaly Detection. Sensors 2020, 20, 3738. [Google Scholar] [CrossRef]


| Method | Ref. | Data | Objective | Architecture | SUP. |
|---|---|---|---|---|---|
| OADA | [37] | Video | Reconstruction | AE | Semi. |
| RandNet | [38] | Tabular | Reconstruction | AE | Unsup. |
| UODA | [39] | Sequence | Reconstruction | AE&RNN | Semi |
| GT | [40] | Image | Classification | CONV | Semi |
| E3 Outlier | [41] | Image | Classification | CONV | Semi |
| AE-1SVM | [42] | tabular and image | One-class | AE & CONV | Unsup. |
| DAGMM | [43] | Tabular | Clustering | AE & MPL | Unsup. |
| AEHE | [44] | Graph | Anomaly score | AE & MPL | Unsup. |
| ALOCC | [45] | Image | Anomaly score | AE & CNN | Semi |
| OCAN | [46] | Sequence | Anomaly score | LSTM-AE & MLP | Semi |
| Technique | Ref. | Method | Learning Technique | Results |
|---|---|---|---|---|
| MCD-BiLSTM-VAE. | [49] | Deep Learning | unSup | P 0.92, R 0.99, F1 0.94, Acc 0.98 |
| GNN-DTAN | [50] | Neural Network | Unsup | R 0.85, P 0.82, F1 0.83, Acc 0.98 |
| Pseudo-period technique | Machine Learning | Unsup | Acc 0.93 | |
| One class | [51] | Machine Learning | Sup | P 0.78, R 1.0, F1 0.87, AUC 0.95 |
| EML | [52] | Machine Learning | Sup | F1 0.93, Acc 0.98 |
| SLM | [53] | Machine Learning | Unsup | Performance 0.90 |
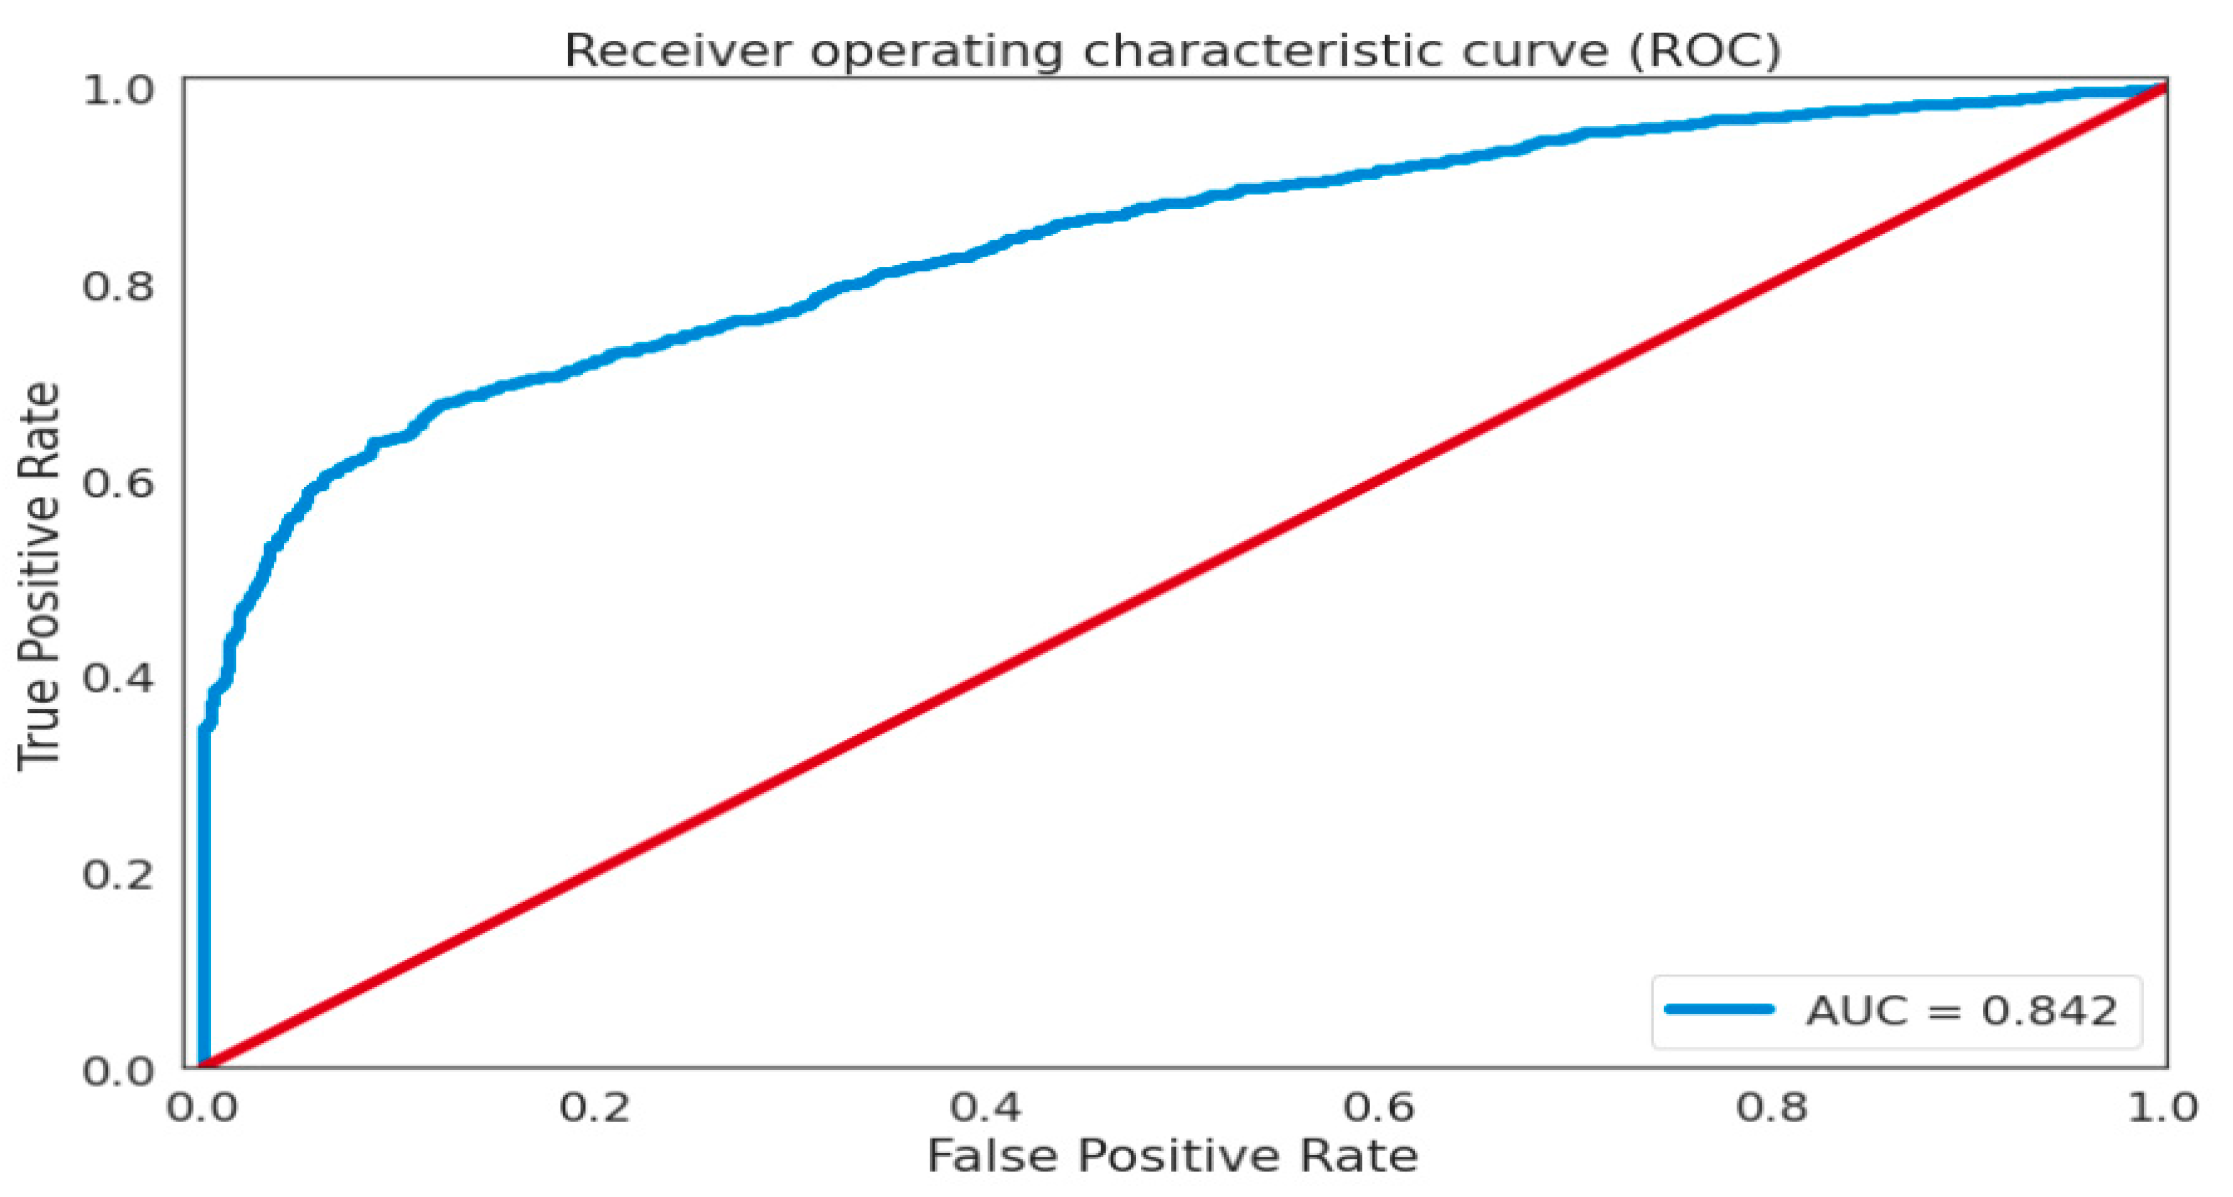
| FC-VAE | Deep Learning | Unsup | AUC ROC 0.842, P 0.897, R 0.706 |
| Technique | Dataset | Learning Technique | Results |
|---|---|---|---|
| VAE-GAN | Time series | UnSup | P 0.76, R 0.5, F1 0.6 |
| FC-VAE | Statlog | UnSup | P 0.897, R 0.706, F1 0.79 |
Publisher’s Note: MDPI stays neutral with regard to jurisdictional claims in published maps and institutional affiliations. |
© 2022 by the authors. Licensee MDPI, Basel, Switzerland. This article is an open access article distributed under the terms and conditions of the Creative Commons Attribution (CC BY) license (https://creativecommons.org/licenses/by/4.0/).
Share and Cite
Gouda, W.; Tahir, S.; Alanazi, S.; Almufareh, M.; Alwakid, G. Unsupervised Outlier Detection in IOT Using Deep VAE. Sensors 2022, 22, 6617. https://doi.org/10.3390/s22176617
Gouda W, Tahir S, Alanazi S, Almufareh M, Alwakid G. Unsupervised Outlier Detection in IOT Using Deep VAE. Sensors. 2022; 22(17):6617. https://doi.org/10.3390/s22176617
Chicago/Turabian StyleGouda, Walaa, Sidra Tahir, Saad Alanazi, Maram Almufareh, and Ghadah Alwakid. 2022. "Unsupervised Outlier Detection in IOT Using Deep VAE" Sensors 22, no. 17: 6617. https://doi.org/10.3390/s22176617
APA StyleGouda, W., Tahir, S., Alanazi, S., Almufareh, M., & Alwakid, G. (2022). Unsupervised Outlier Detection in IOT Using Deep VAE. Sensors, 22(17), 6617. https://doi.org/10.3390/s22176617