
Dimension Reduction of Digital Image Descriptors in Neural Identification of Damaged Malting Barley Grains

 , ,
, ,  , and
, and
Abstract
:1. Introduction
2. Materials and Methods
2.1. Materials
2.2. Methods
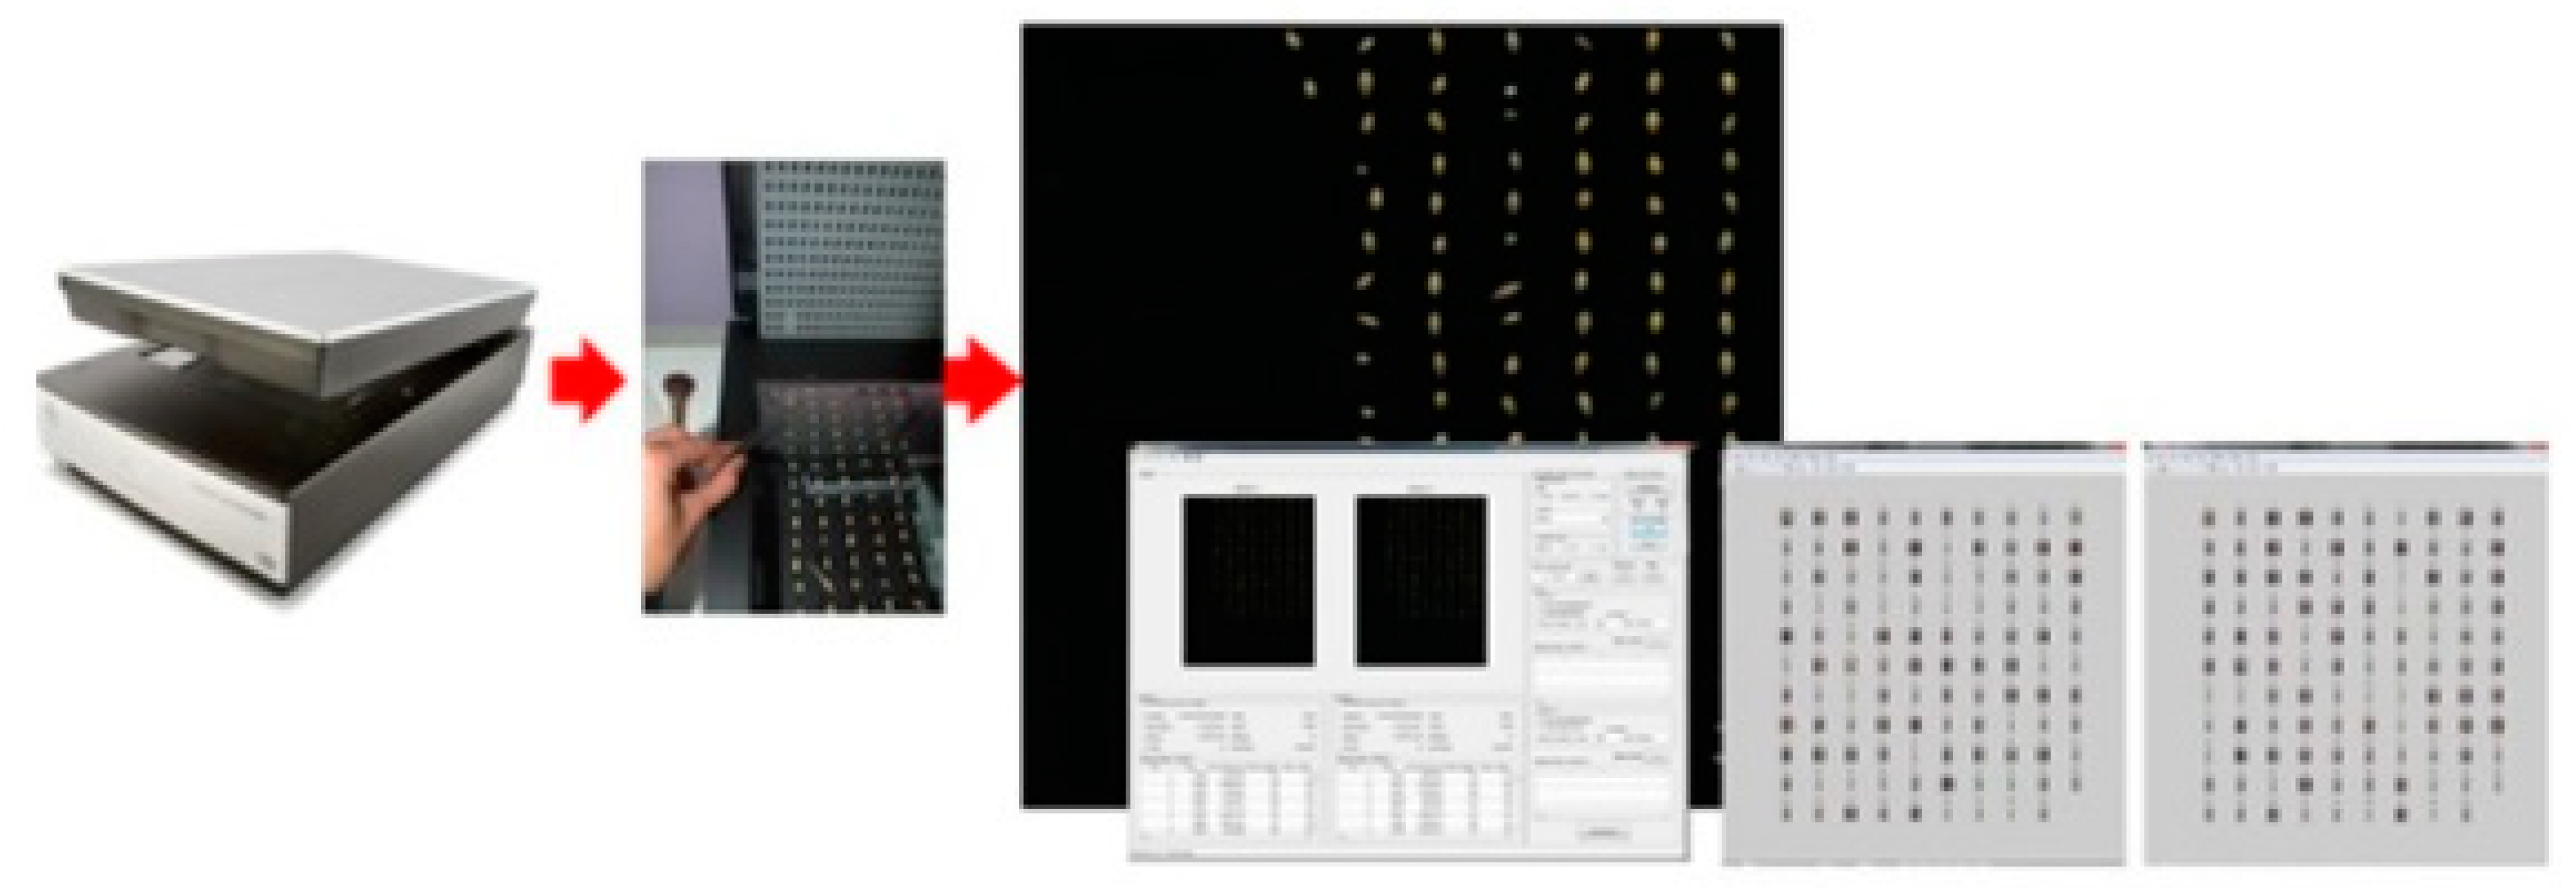
2.2.1. Preparation of Samples, Image Acquisition and Analysis
- -
- A total of 100 g of malting barley was weighted from a 1 kg sample using an electronic balance with an accuracy of 0.001 g,
- -
- Weighted barley samples were sorted by means of a mechanical sorter Sortimat by grain size using 3 sieves of dimensions: 2.2 mm × 25 mm, 2.5 mm × 25 mm and 2.8 mm × 25 mm, and 3 fractions of samples were created: BOJOS 2.2 (218 grains), BOJOS 2.5 (866 grains), and BOJOS 2.8 (1386 grains),
- -
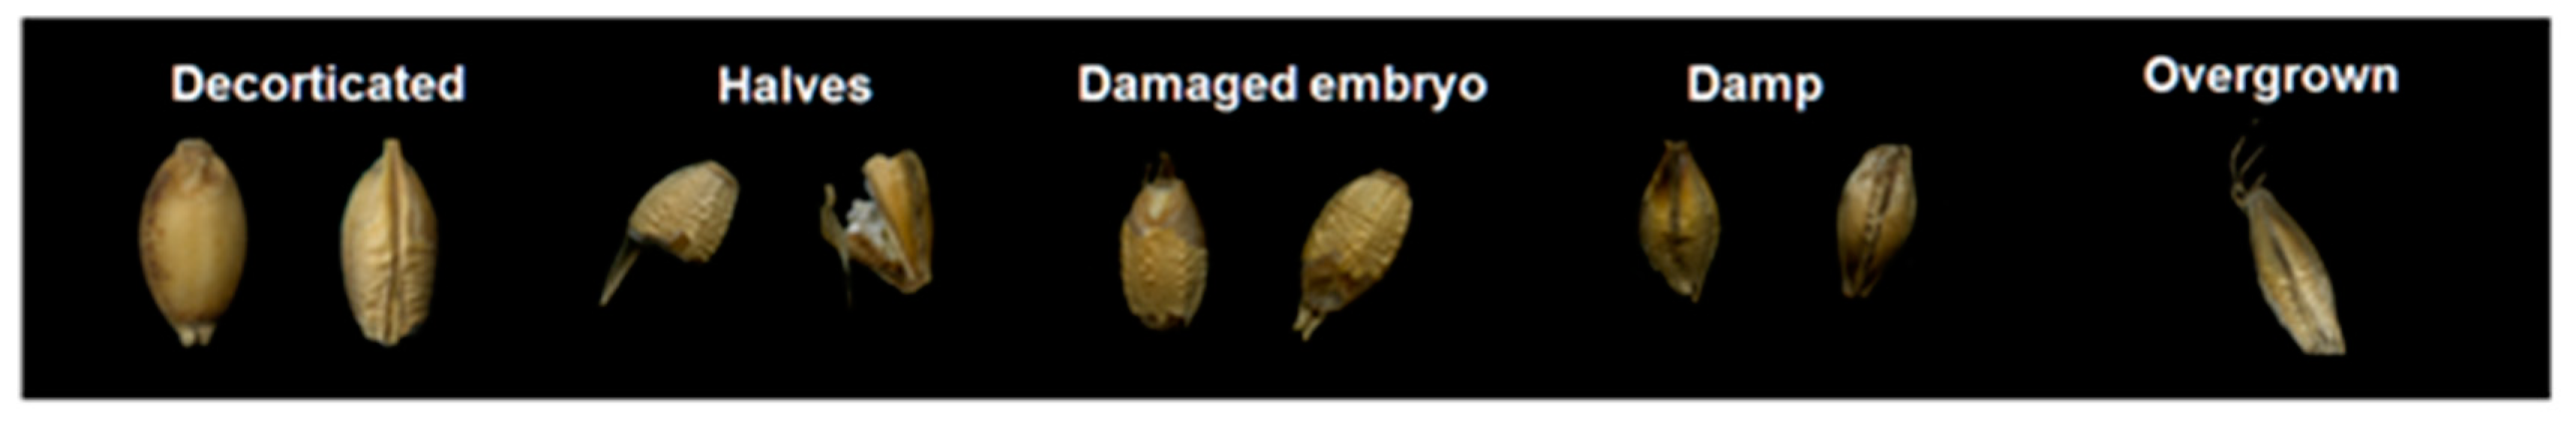
- Basic types of grain damage of BOJOS variety were identified (examples on Figure 2),
- -
- Percentage of damage/contamination in the samples with classification by type of contamination in 3 fractions of BOJOS barley cultivar was calculated (Table 1).
2.2.2. Theoretical Background of the PCA Method
3. Results and Discussion
3.1. Reduction of the Number of Descriptors Using the PCA Approach
3.2. Artificial Neural Networks Modelling
- -
- Decreasing learning coefficient: from η = 0.2 to η = 0.1,
- -
- Momentum factor: α = 0.4.
4. Conclusions
Author Contributions
Funding
Institutional Review Board Statement
Informed Consent Statement
Data Availability Statement
Acknowledgments
Conflicts of Interest
References
- Nogueira, M.S.; Decundo, J.; Martinez, M.; Dieguez, S.N.; Moreyra, F.; Moreno, M.V.; Stenglein, S.A. Natural Contamination with Mycotoxins Produced by Fusarium graminearum and Fusarium poae in Malting Barley in Argentina. Toxins 2018, 10, 78. [Google Scholar] [CrossRef] [PubMed]
- Kumar, D.; Kumar, V.; Verma, R.P.S.; Kharub, A.S.; Sharma, I. Quality Parameter Requirement and Standards for Malt Barley—A Review. Agric. Rev. 2013, 34, 313–317. [Google Scholar] [CrossRef]
- Pallottino, F.; Cimini, A.; Costa, C.; Antonucci, F.; Menesatti, P.; Moresi, M. Bibliometric analysis and mapping of publications on brewing science from 1940 to 2018. J. Inst. Brew. 2020, 126, 394–405. [Google Scholar] [CrossRef]
- Rani, H.; Bharadwaj, R.D. Quality attributes for barley malt: “The backbone of beer”. J. Food Sci. 2021, 86, 3322–3340. [Google Scholar] [CrossRef] [PubMed]
- Tricase, C.; Amicarelli, V.; Lamonaca, E.; Rana, R.L. Economic analysis of the barley market and related uses. In Grasses as Food and Feed, 10; Tabele, Z., Ed.; Intech Open: London, UK, 2018; pp. 25–46. [Google Scholar] [CrossRef]
- Nowakowski, K.; Boniecki, P.; Tomczak, R.Ł.; Raba, B. Identification process of corn and barley kernels damages using neural image analysis. In Proceedings of the Third International Conference on Digital Image Processing (ICDIP 2011), Chengdu, China, 8 July 2011; Volume 8009. [Google Scholar] [CrossRef]
- Beccari, G.; Prodi, A.; Tini, F.; Bonciarelli, U.; Onofri, A.; Oueslati, S.; Limayma, M.; Covarelli, L. Changes in the Fusarium Head Blight Complex of Malting Barley in a Three-Year Field Experiment in Italy. Toxins 2017, 9, 120. [Google Scholar] [CrossRef] [PubMed]
- Arngren, M.; Hansen, P.W.; Eriksen, B.; Larsen, J.; Larsen, R. Analysis of Pregerminated Barley Using Hyperspherical Image Analysis. Agric. Food Chem. 2011, 59, 11385–11394. [Google Scholar] [CrossRef]
- Aznan, A.; Gonzalez Viejo, C.; Pang, A.; Fuentes, S. Computer Vision and Machine LearningAnalysis of Commercial Rice Grains:A Potential Digital Approach forConsumer Perception Studies. Sensors 2021, 21, 6354. [Google Scholar] [CrossRef]
- He, X.; Zhao, T.; Shen, F.; Liu, Q.; Fang, Y.; Hu, Q. Online detection of naturally DON contaminated wheat grains from China using Vis-NIR spectroscopy and computer vision. Biosyst. Eng. 2021, 201, 1–10. [Google Scholar] [CrossRef]
- Velesaca, H.O.; Suárez, P.L.; Mira, R.; Sappa, A.D. Computer vision based food grain classification: A comprehensive survey. Comput. Electron. Agric. 2021, 187, 106287. [Google Scholar] [CrossRef]
- Xu, P.; Yang, R.; Zeng, T.; Zhang, J.; Zhang, Y.; Tan, Q. Varietal classification of maize seeds using computer vision and machine learning techniques. J. Food Process. Eng. 2021, 44, e13846. [Google Scholar] [CrossRef]
- de Medeiros, A.D.; Capobiango, N.P.; da Silva, J.M.; da Silva, L.J.; da Silva, C.B.; dos Santos Dias, D.C.F. Interactive machine learning for soybean seed and seedling quality classification. Sci. Rep. 2020, 10, 11267. [Google Scholar] [CrossRef] [PubMed]
- Pilarska, A.A.; Boniecki, P.; Idzior-Haufa, M.; Maciej Zaborowicz, M.; Pilarski, K.; Przybylak, A.; Piekarska-Boniecka, H. Image Analysis Methods in Classifying Selected Malting Barley Varieties by Neural Modelling. Agriculture 2021, 11, 732. [Google Scholar] [CrossRef]
- Boniecki, P.; Raba, B.; Pilarska, A.A.; Sujak, A.; Zaborowicz, M.; Pilarski, K.; Wojcieszak, D. Neural Reduction of Image Data in Order to Determine the Quality of Malting Barley. Sensors 2021, 21, 5696. [Google Scholar] [CrossRef] [PubMed]
- Stejskal, V.; Vendl, T.; Li, Z.; Aulicky, R. Efficacy of visual evaluation of insect-damaged kernels of malting barley by Sitophilus granarius from various observation perspectives. J. Stored Prod. Res. 2020, 89, 101711. [Google Scholar] [CrossRef]
- Przybył, K.; Zaborowicz, M.; Koszela, K.; Boniecki, P.; Mueller, W.; Raba, B.; Lewicki, A. Organoleptic Damage Classification of Potatoes with the Use of Image Analysis in Production Process. In Proceedings of the Sixth International Conference on Digital Image Processing (ICDIP 2014), Athens, Greece, 16 April 2014; Volume 9159. [Google Scholar] [CrossRef]
- Janczak, D.; Lewicki, A.; Mazur, R.; Boniecki, P.; Dach, J.; Przybył, J.; Pawlak, M.; Pilarski, K.; Czekala, W. The Selected Examples of the Application of Computer Image Analysis in the Assessment of Environmental Quality. In Proceedings of the Fifth International Conference on Digital Image Processing (ICDIP 2013), Beijing, China, 19 July 2013; Volume 8878. [Google Scholar] [CrossRef]
- Szczypiński, P.M.; Klepaczko, A.; Zapotoczny, P. Identifying barley varieties by computer vision. Comput. Electron. Agric. 2015, 110, 1–8. [Google Scholar] [CrossRef]
- Kozłowski, M.; Górecki, P.; Szczypiński, P.M. Varietal classification of barley by convolutional neural networks. Biosyst. Eng. 2019, 184, 155–165. [Google Scholar] [CrossRef]
- Shi, Y.; Patel, Y.; Rostami, B.; Chen, H.; Wu, L.; Yu, Z.; Li, Y. Barley Variety Identification by iPhone Images and Deep Learning. J. Amer. Soc. Brew. Chem. 2022, 80, 215–224. [Google Scholar] [CrossRef]
- Shah, S.A.A.; Luo, H.; Pickupana, P.D.; Ekeze, A.; Sohel, F.; Laga, H.; Li, C.; Paynter, B.; Wang, P. Automatic and fast classification of barley grains from images: A deep learning approach. Smart Agric. Technol. 2022, 2, 100036. [Google Scholar] [CrossRef]
- Ramirez-Paredes, J.-P.; Hernandez-Belmonte, U.-H. Visual quality assessment of malting barley using color, shape and texture descriptors. Comp. Electron. Agric. 2020, 168, 105110. [Google Scholar] [CrossRef]
- Nowakowski, K.; Boniecki, P.; Dach, J. The Identification Of Mechanical Damages Of Kernels. Basis Of Neural Image Analysis. In Proceedings of the 2009 International Conference on Digital Image Processing, Bangkok, Thailand, 7–9 March 2009; pp. 412–415. [Google Scholar] [CrossRef]
- Nowakowski, K.; Boniecki, P.; Tomczak, R.J.; Kujawa, S.; Raba, B. Identification of malting barley varieties using computer image analysis and artificial neural networks. In Proceedings of the Fourth International Conference on Digital Image Processing (ICDIP 2012), Kuala Lumpur, Malaysia, 8 June 2012; Volume 8334. [Google Scholar] [CrossRef]
- Iosa, M.; Benedetti, M.G.; Antonucci, G.; Paolucci, S.; Morone, G. Artificial Neural Network Detects Hip Muscle Forces as Determinant for HarmonicWalking in People after Stroke. Sensors 2022, 22, 1374. [Google Scholar] [CrossRef]
- Zaborowicz, M.; Boniecki, P.; Koszela, K.; Przybyl, J.; Mazur, R.; Kujawa, S.; Pilarski, K. Use of Artificial Neural Networks in the Identification and Classification of Tomatoes. In Proceedings of the Fifth International Conference on Digital Image Processing (ICDIP 2013), Beijing, China, 19 July 2013; Volume 8878. [Google Scholar] [CrossRef]
- Dach, J.; Czekała, W.; Boniecki, P.; Lewicki, A.; Piechota, T. Specialised internet tool for biogas plant modelling and marked analysing. In Proceedings of the 2nd International Conference on Manufacturing and Applied Research, Singapore, 9–10 February 2014; Volume 909. [Google Scholar] [CrossRef]
- Boniecki, P.; Dach, J.; Nowakowski, K.; Jakubek, A. Neural image analysis of maturity stage during composting of sewage sludge. In Proceedings of the International Conference on Digital Image Processing, Bangkok, Thailand, 7–9 March 2009; pp. 200–203. [Google Scholar]
- Boniecki, P. Elements of Neural Modeling in Agriculture; Publishing house of the University of Life Sciences: Poznan, Poland, 2008; pp. 119–122. [Google Scholar]
- Fausett, L. Fundamentals of Neural Networks; Prentice Hall: Hoboken, NJ, USA, 1994. [Google Scholar]
- Bishop, C. Neural Networks for Pattern Recognition; Oxford University Press: New York, NY, USA, 1995. [Google Scholar]
- Pavićević, M.; Popović, T. Forecasting Day-Ahead Electricity Metrics with Artificial Neural Networks. Sensors 2022, 22, 1051. [Google Scholar] [CrossRef] [PubMed]
- Salehuddin, N.F.; Omar, M.B.; Ibrahim, R.; Bingi, K. A Neural Network-Based Model for Predicting Saybolt Color of Petroleum Products. Sensors 2022, 22, 2796. [Google Scholar] [CrossRef] [PubMed]
- Boniecki, P.; Nowakowski, K.; Tomczak, R.; Kujawa, S.; Piekarska-Boniecka, H. The application of the Kohonen neural network in the non-parametric quality-based classification of tomatoes. In Proceedings of the Fourth International Conference on Digital Image Processing (ICDIP 2012), Kuala Lumpur, Malaysia, 8 June 2012; Volume 8334. [Google Scholar] [CrossRef]
- Boniecki, P.; Piekarska-Boniecka, H.; Koszela, K.; Nowakowski, K.; Kujawa, S.; Majewski, A.; Weres, J. Raba, B. Neural identification of selected apple pests. Comput. Electron. Agric. 2015, 110, 9–16. [Google Scholar] [CrossRef]
- Deng, F.; Li, S.-Q.; Zhang, X.-R.; Zhao, L.; Huang, J.-B.; Zhou, C. An Intelligence Method for Recognizing Multiple Defects in Rail. Sensors 2022, 21, 8108. [Google Scholar] [CrossRef] [PubMed]
- Przybylak, A.; Boniecki, P.; Koszela, K.; Ludwiczak, A.; Zaborowicz, M.; Lisiak, D.; Stanisz, M.; Slosarz, P. Estimation of intramuscular level of marbling among Whiteheaded Mutton Sheep lambs. J. Food Eng. 2016, 168, 199–204. [Google Scholar] [CrossRef]
- Zaborowicz, M.; Fojud, A.; Koszela, K.; Mueller, W.; Górna, K.; Okoń, P.; Piekarska-Boniecka, H. Dedicated computer system AOTK for image processing and analysis of horse navicular bone. In Proceedings of the Ninth International Conference on Digital Image Processing (ICDIP 2017), Hong Kong, China, 21 July 2017; Volume 10420. UNSP 1042049. [Google Scholar] [CrossRef]
- Sujak, A.; Jakubas, D.; Kitowski, I.; Zbyryt, A.; Bzoma, S.; Boniecki, P. Identification of factors affecting environment contamination represented by post-hatching eggshells of a common colonial waterbird with usage of artificial neural networks. Sensors 2022, 22, 3723. [Google Scholar] [CrossRef]
- Boniecki, P.; Koszela, K.; Piekarska-Boniecka, H.; Nowakowski, K.; Przybyl, J.; Zaborowicz, M.; Raba, B.; Dach, J. Identification of Selected Apple Pests Based on Selected Graphical Parameters. In Proceedings of the Fifth International Conference on Digital Image Processing (ICDIP 2013), Beijing, China, 19 July 2013; 8878. [Google Scholar] [CrossRef]
- Rao, C.R. Linear Models of Mathematical Statistics; State Publishing House: Poznan, Poland, 1982; pp. 52–66. [Google Scholar]
- Ahmad, Z.; Nguyen, T.-H.; Ahmad, S.; Nguyen, C.D.; Kim, J.-M. Multistage Centrifugal Pump Fault Diagnosis Using Informative Ratio Principal Component Analysis. Sensors 2022, 22, 179. [Google Scholar] [CrossRef]
- Hoyle, A.; Brennan, M.; Pitts, N.; Jackson, G.E.; Hoad, S. Relationship between specific weight of spring barley and malt quality. J. Cereal Sci. 2020, 95, 103006. [Google Scholar] [CrossRef]
- Magliano, P.N.; Prystupa, P.; Gutiérrez-Boem, F.H. Protein content of grains of different size fractions in malting barley. J. Inst. Brew. 2014, 120, 347–352. [Google Scholar] [CrossRef]
- Yu, W.; Tan, X.; Zou, W.; Hu, Z.; Fox, G.P.; Gidley, M.J.; Gilbert, R.G. Relationships between Protein Content, Starch Molecular Structure and Grain Size in Barley. Carbohydr. Polym. 2017, 155, 271–279. [Google Scholar] [CrossRef]
- Postma, L.J.E.O.; van den Herik, H.J.; van der Maaten, L.J. Dimensionality reduction: A comparative review. J. Mach. Learn. Res. 2009, 10, 66–71. [Google Scholar]
- Cheng, D.; Zhao, D.; Zhang, J.; Wei, C.; Tian, D. PCA-Based Denoising Algorithm for Outdoor Lidar Point Cloud Data. Sensors 2021, 21, 3703. [Google Scholar] [CrossRef] [PubMed]
- Ng, S.C. Principal component analysis to reduce dimension on digital image. Procedia Comput. Sci. 2017, 111, 113–119. [Google Scholar] [CrossRef]
- Song, L.; Ma, H.; Wu, M.; Zhou, Z.; Fu, M. A Brief Survey of Dimension Reduction. In Proceedings of the International Conference on Intelligent Science and Big Data Engineering, Lanzhou, China, 18–19 August 2018; Peng, Y., Yu, K., Lu, J., Jiang, X., Eds.; Springer: Cham, Switzerland, 2018. [Google Scholar] [CrossRef]
- Xia, Z.; Chen, Y.; Xu, C. Multiview PCA: A Methodology of Feature Extraction and Dimension Reduction for High-Order Data. IEEE Trans. Cybern. 2021, 1–13. [Google Scholar] [CrossRef] [PubMed]
- Uddin, P.; Mamun, A.; Hossain, A. PCA-based Feature Reduction for Hyperspectral Remote Sensing Image Classification. IETE Techn. Rev. 2021, 38, 377–396. [Google Scholar] [CrossRef]
- Ji, M.; Yuyu, Y. Dimension reduction of image deep feature using PCA. J.Vis. Commun. Image Represent. 2019, 63, 102578. [Google Scholar] [CrossRef]
- Zapotoczny, P.; Zielinska, M.; Nita, Z. Application of image analysis for the varietal classification of barley: Morphological features. J. Cereal Sci. 2008, 48, 104–110. [Google Scholar] [CrossRef]
- Guo, J.; Li, H.; Ning, J.; Han, W.; Zhang, W.; Zhou, Z.-S. Feature Dimension Reduction Using Stacked Sparse Auto-Encoders for Crop Classification with Multi-Temporal, Quad-Pol SAR Data. Remote Sens. 2020, 12, 321. [Google Scholar] [CrossRef]
- Zhou, R.-Q.; Jin, J.-J.; Li, Q.-M.; Su, Z.-Z.; Yu, X.-J.; Tang, Y.; Luo, S.-M.; He, Y.; Li, X.-L. Early Detection of Magnaporthe oryzae-Infected Barley Leaves and Lesion Visualization Based on Hyperspectral Imaging. Front. Plant Sci. 2019, 9, 1962. [Google Scholar] [CrossRef]
- Nielsen, J.P.; Munck, L. Evaluation of malting barley quality using explanatory data analysis. I. Extraction of information from micro-malting data of spring and winter barley. J. Cereal Sci. 2003, 38, 173–180. [Google Scholar] [CrossRef]
- Kozłowski, M.; Szczypiński, P.M. Barley defects identification by convolutional neural networks. In Proceedings of the International Conference on Information Technologies in Biomedicine, Kamień Śląski, Poland, 18–20 June 2019; Springer: Cham, Switzerland, 2019. [Google Scholar] [CrossRef]
- Kociołek, M.; Szczypiński, P.M.; Klepaczko, A. Preprocessing of barley grain images for defect identification. In Proceedings of the 2017 Signal Processing: Algorithms, Architectures, Arrangements, and Applications (SPA), Poznan, Poland, 20–22 September 2017; pp. 365–370. [Google Scholar] [CrossRef]


| Characteristics | Size Fraction | ||
|---|---|---|---|
| 2.2 | 2.5 | 2.8 | |
| No pollution/Good quality grain | 40.27 | 48.04 | 57.09 |
| Mold-infected grain | 49.54 | 40.88 | 35.57 |
| Halves | 4.47 | 2.54 | 0.94 |
| Grain partially/completely dehulled | 1.83 | 6.35 | 3.84 |
| “Rainy weather” (with dark ends) | 3.31 | 1.27 | 2.28 |
| Grain with embryo killed | 0 | 0.69 | 0.25 |
| Sprouted grain | 0 | 0 | 0.03 |
| Grain affected by pests | 0.46 | 0 | 0 |
| Other grains/seeds | 0.12 | 0.23 | 0 |
| Geometric Parameters (12) | Shape Factors (8) | Values of Colour Space Models (15) (RGB) (15) (HSV) | Texture (14) | |
|---|---|---|---|---|
| ‘Area’. ‘Circumference’. ‘Max. height’. ‘Max. width’. ‘Rmax’. ‘Rmin’. ‘OAR’. ‘Circle diameter’. ‘Eccentricity’. ‘Ellipse’. ‘MajorAxisLength’. ‘MinorAxisLength’. ‘Solidity’. | ‘C.Feret’. ‘C.Malinowska’. ‘C.Circularity#1’. ‘C.Circularity#2’. ‘C.Ellipsicity’. ‘C.Blair-Bliss’. ‘C.Haralick’. ‘C.Danielsson’. | ‘R Max’. ‘R Min’. ‘R Mean’. ‘R Median’. ‘R STD’. ‘G Max’. ‘G Min’. ‘G Mean’. ‘G Median’. ‘G STD’. ‘B Max’. ‘B Min’. ‘B Mean’. ‘B Median’. ‘B STD’. | ‘H Max’. ‘H Min’. ‘H Mean’. ‘H Median’. ‘H STD’. ‘S Max’. ‘S Min’. ‘S Mean’. ‘S Median’. ‘S STD’. ‘V Max’. ‘V Min’. ‘V Mean’. ‘V Median’. ‘V STD | ‘MGmean’. ‘MGvar’. ‘MGskew’. ‘MGkurto’. ‘ZeroPercent’. ‘rSRE’. ‘rLRE’. ‘rRLN’. ‘rFIR’. ‘rGLN’. ‘GLCMContrast’. ‘GLCMCorrelation’. ‘GLCMEnergy’. ‘GLCMHomogeneity’. |
| Size Fraction | |||
|---|---|---|---|
| 2.2 | 2.5 | 2.8 | |
| No. main component | Variance [%] | ||
| 1 | 22.03 | 21.59 | 22.97 |
| 2 | 18.54 | 18.10 | 17.20 |
| 3 | 15.88 | 15.34 | 13.59 |
| 4 | 8.69 | 8.30 | 8.26 |
| 5 | 6.80 | 6.85 | 7.40 |
| 6 | 4.35 | 4.94 | 5.95 |
| 7 | 3.63 | 4.10 | 3.77 |
| 8 | 3.32 | 3.08 | 3.06 |
| Fraction | Eight of the Most Important Primary Graphic Descriptors |
|---|---|
| 2.2 | Circumference, GLCMCorrelation, GLCM Homogeneity, R Median, MinorAxisLength, G Min, S Max, V Min |
| 2.5 | Circumference, GLCMContrast, S Mean, MinorAxisLength, S Max, S STD, G Min, V Min |
| 2.8 | Circumference, V Mean, Mgmean, S Median, MinorAxisLength, S STD, G Min, V Min |
| Model | |||
|---|---|---|---|
| RMS Error * | MLP: 8-14-1 | MLP: 8-19-1 | MLP: 8-8-1 |
| RMS (training file) | 0.017233 | 0.010752 | 0.010869 |
| RMS (testing file) | 0.012034 | 0.0105261 | 0.010416 |
| RMS (validation file) | 0.011213 | 0.0108675 | 0.010638 |
| BOJOS | ||||
|---|---|---|---|---|
| Sample | 2.2 | 2.5 | 2.8 | |
| ANN Quality | ||||
| Statistical v. 10 (StatSoft Polska, Cracov, Poland) | MLP: 8-14-1 | MLP: 8-19-1 | MLP: 8-8-1 | |
| ANN structure | 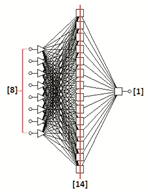 |  |  | |
| Quality of the training file [%] | 85.40 | 92.43 | 91.70 | |
| Quality of the testing file [%] | 83.13 | 94.74 | 95.87 | |
| Quality of the validation file [%] | 82.75 | 92.89 | 94.36 | |
| Learning algorithms used | BPCG—1600 epochs | BPCG—1600 epochs | BPCG—1600 epochs | |
Publisher’s Note: MDPI stays neutral with regard to jurisdictional claims in published maps and institutional affiliations. |
© 2022 by the authors. Licensee MDPI, Basel, Switzerland. This article is an open access article distributed under the terms and conditions of the Creative Commons Attribution (CC BY) license (https://creativecommons.org/licenses/by/4.0/).
Share and Cite
Boniecki, P.; Sujak, A.; Pilarska, A.A.; Piekarska-Boniecka, H.; Wawrzyniak, A.; Raba, B. Dimension Reduction of Digital Image Descriptors in Neural Identification of Damaged Malting Barley Grains. Sensors 2022, 22, 6578. https://doi.org/10.3390/s22176578
Boniecki P, Sujak A, Pilarska AA, Piekarska-Boniecka H, Wawrzyniak A, Raba B. Dimension Reduction of Digital Image Descriptors in Neural Identification of Damaged Malting Barley Grains. Sensors. 2022; 22(17):6578. https://doi.org/10.3390/s22176578
Chicago/Turabian StyleBoniecki, Piotr, Agnieszka Sujak, Agnieszka A. Pilarska, Hanna Piekarska-Boniecka, Agnieszka Wawrzyniak, and Barbara Raba. 2022. "Dimension Reduction of Digital Image Descriptors in Neural Identification of Damaged Malting Barley Grains" Sensors 22, no. 17: 6578. https://doi.org/10.3390/s22176578
APA StyleBoniecki, P., Sujak, A., Pilarska, A. A., Piekarska-Boniecka, H., Wawrzyniak, A., & Raba, B. (2022). Dimension Reduction of Digital Image Descriptors in Neural Identification of Damaged Malting Barley Grains. Sensors, 22(17), 6578. https://doi.org/10.3390/s22176578