
Practical Fast-Response Anodized-Aluminum Pressure-Sensitive Paint Using Chemical Adsorption Luminophore as Optical Unsteady Pressure Sensor


Abstract
1. Introductions
2. Pressure-Sensitive Paint
2.1. Basic Principles of PSP
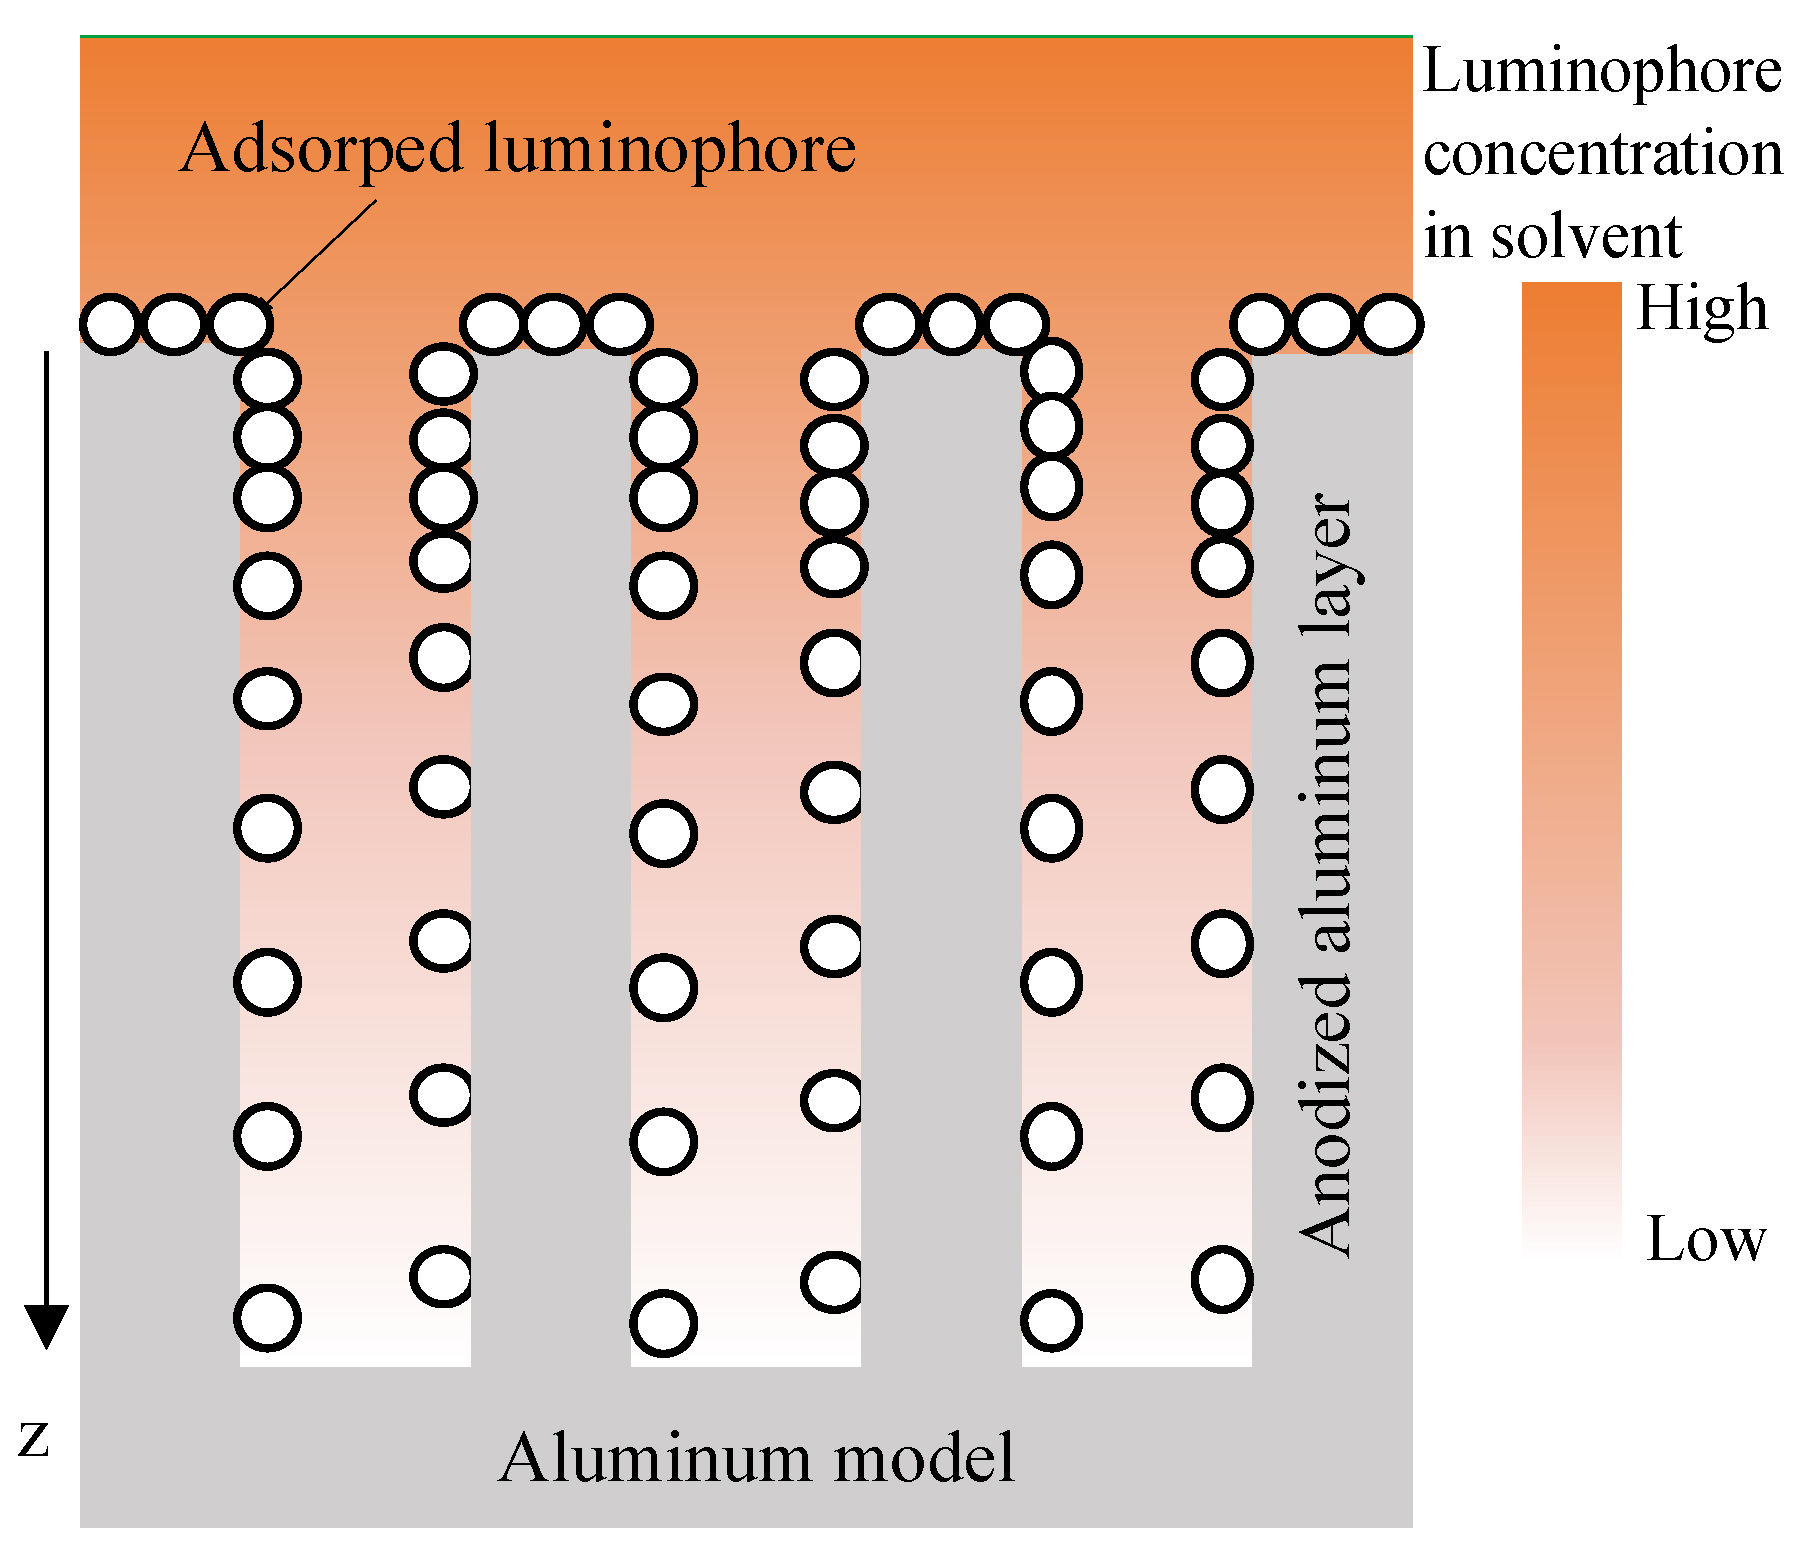
2.2. Anodized-Aluminum Pressure-Sensitive Paint Characteristics
3. Experimental Apparatus
3.1. Materials and Luminophore Solution
- (1)
- Pre-treatmentPure aluminum samples were soaked into 3% sodium hydroxide solution a few minutes. Pure aluminum plates were rinsed with distilled water after the soaking process. Then, the plates were dried in vacuum desiccators for several hours.
- (2)
- AnodizationTwo types of electrolytes, sulfuric acid and phosphoric acid, were used in the anodizing process. The post-treatment process is different for the electrolyte. The samples were anodized with a constant current density of 12.5 mA/cm. The sample was connected to the anode in 1 molar sulfuric acid in 10 or 1 molar phosphoric acid in 30 . After the anodization process, the samples were rinsed with distilled water and dried in vacuum desiccators for several hours in a vacuum desiccator.
- (3)
- Post-treatmentThe anodized samples were soaked into 3% phosphoric acid for 20 min at a constant temperature (20–30 ) in the case of fabrication by using the sulfuric acid electrolyte or 60 min at a constant temperature (20–30 ) in the case of fabrication by using the phosphoric acid electrolyte. Then, the samples were then rinsed with distilled water and dried in vacuum desiccators for several hours.
- (4)
- Luminophore adsorptionThe sample is dipped into the luminophore () solution for 100 s. Then, the sample is quickly rinsed with pure acetone and the inhomogeneous adsorption of luminophore is reduced. Finally, it is dried at least overnight in a vacuum desiccator.
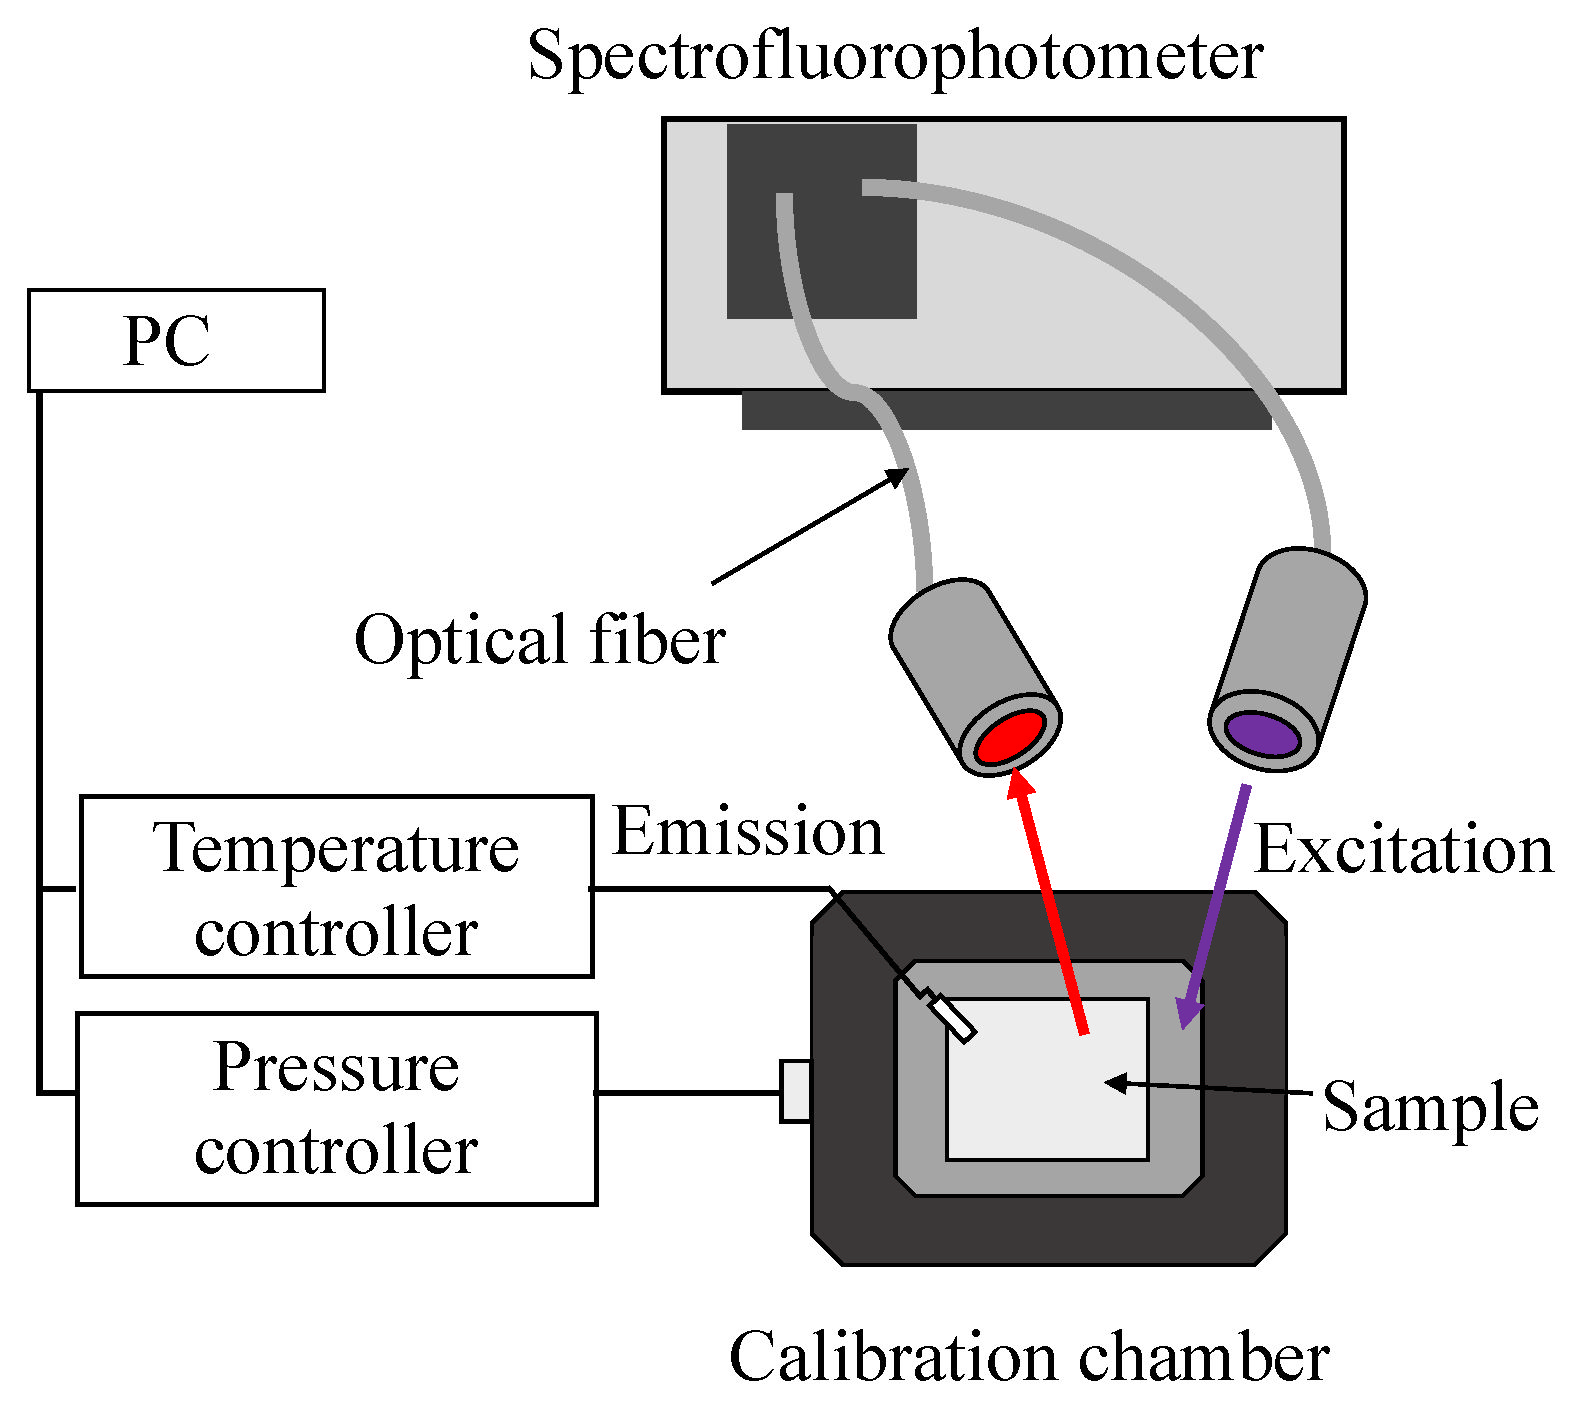
3.2. Fluorescence Spectroscopy
3.3. Static Calibration Chamber
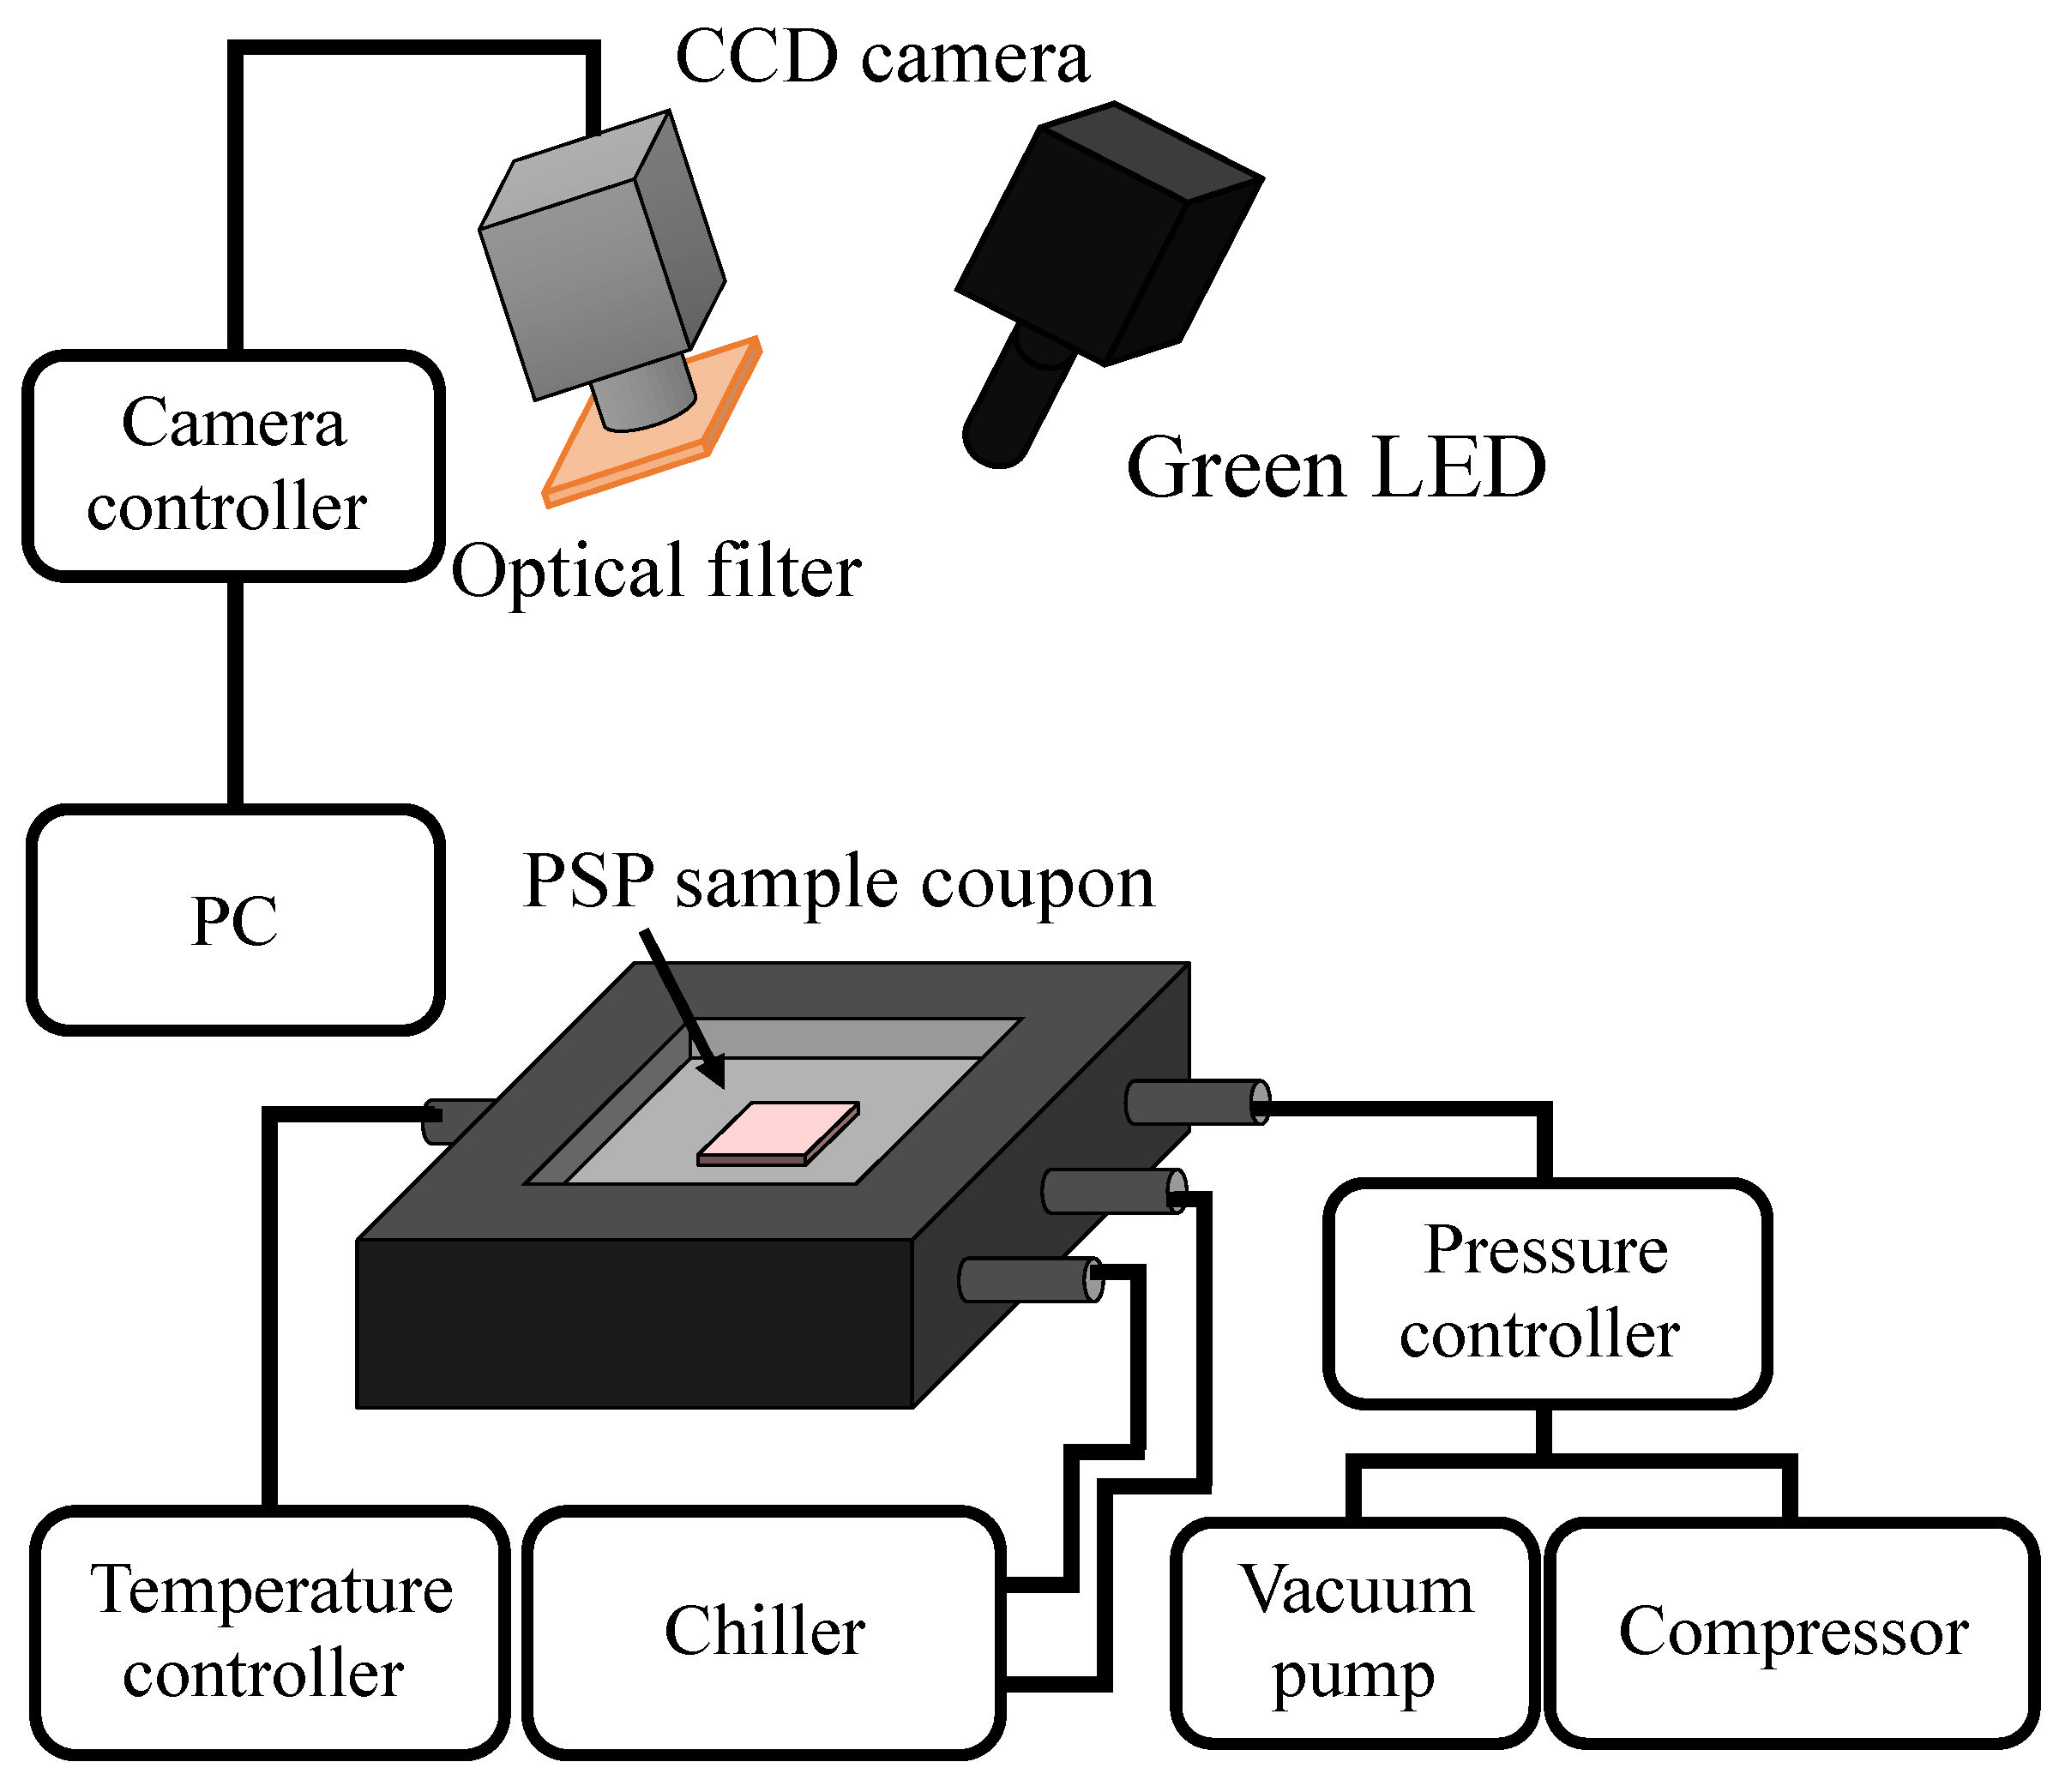
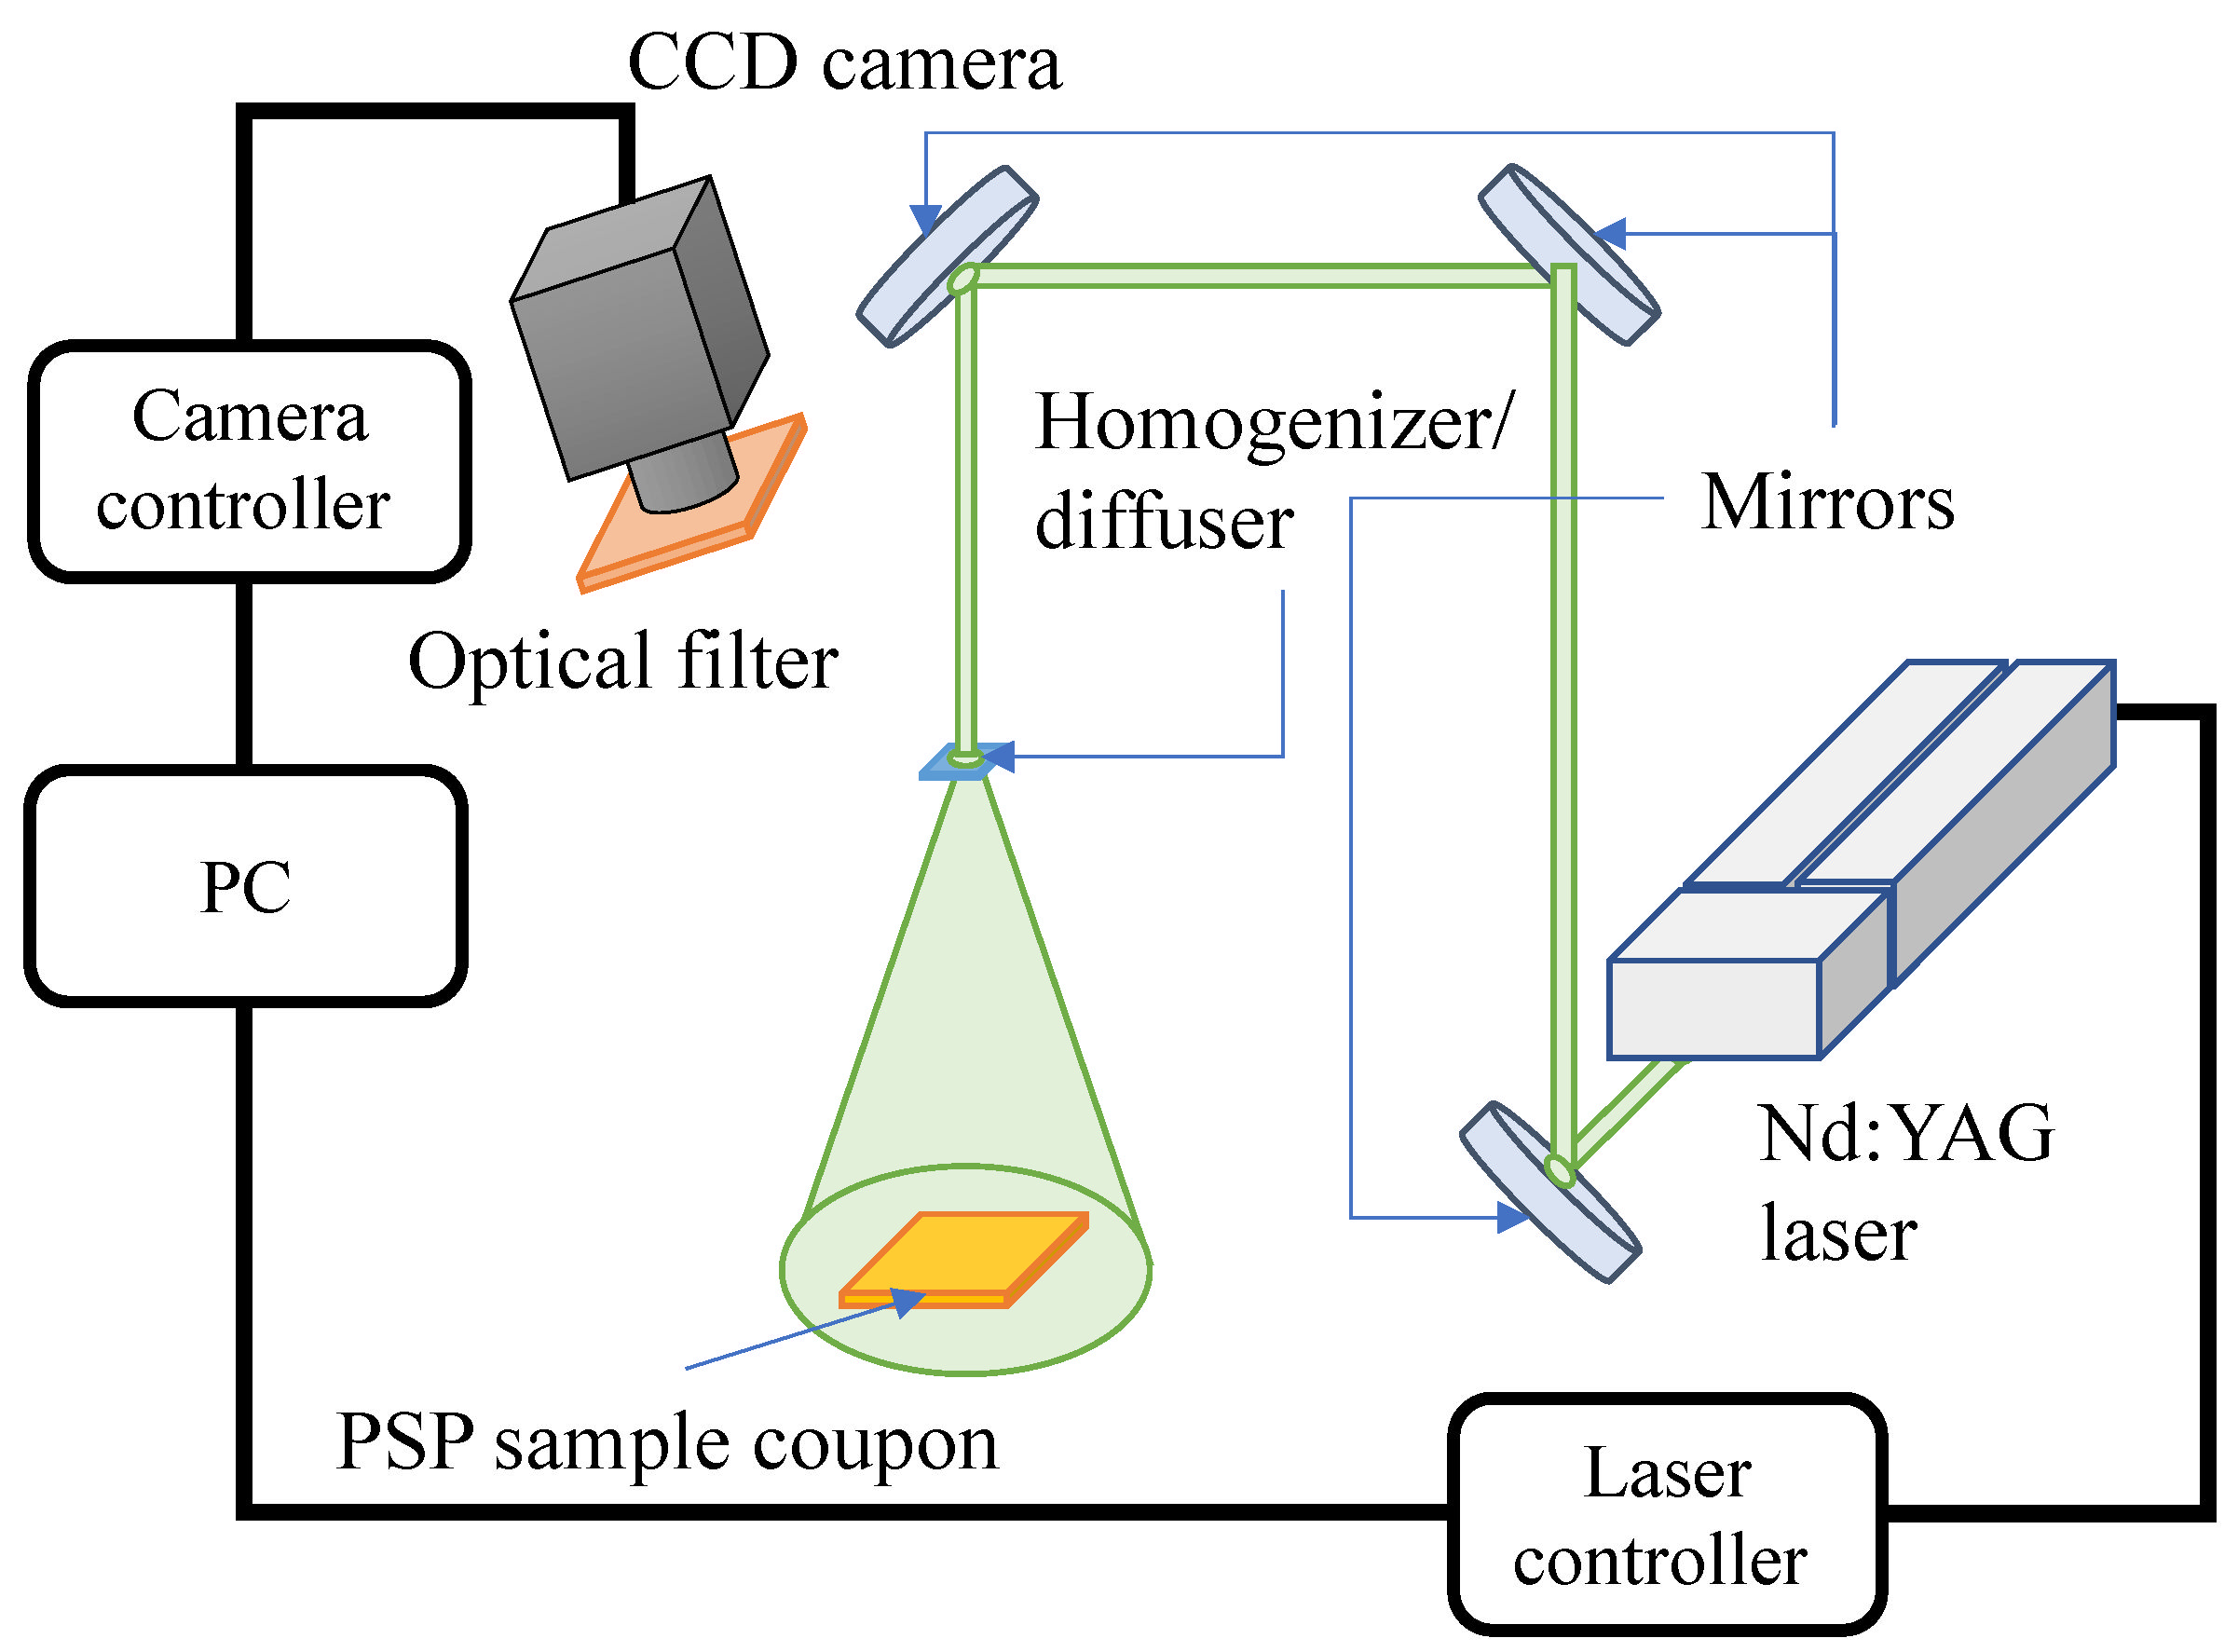
3.4. Laser and Camera for Laser Photodegradation
3.5. Picosecond Laser and Streak Camera
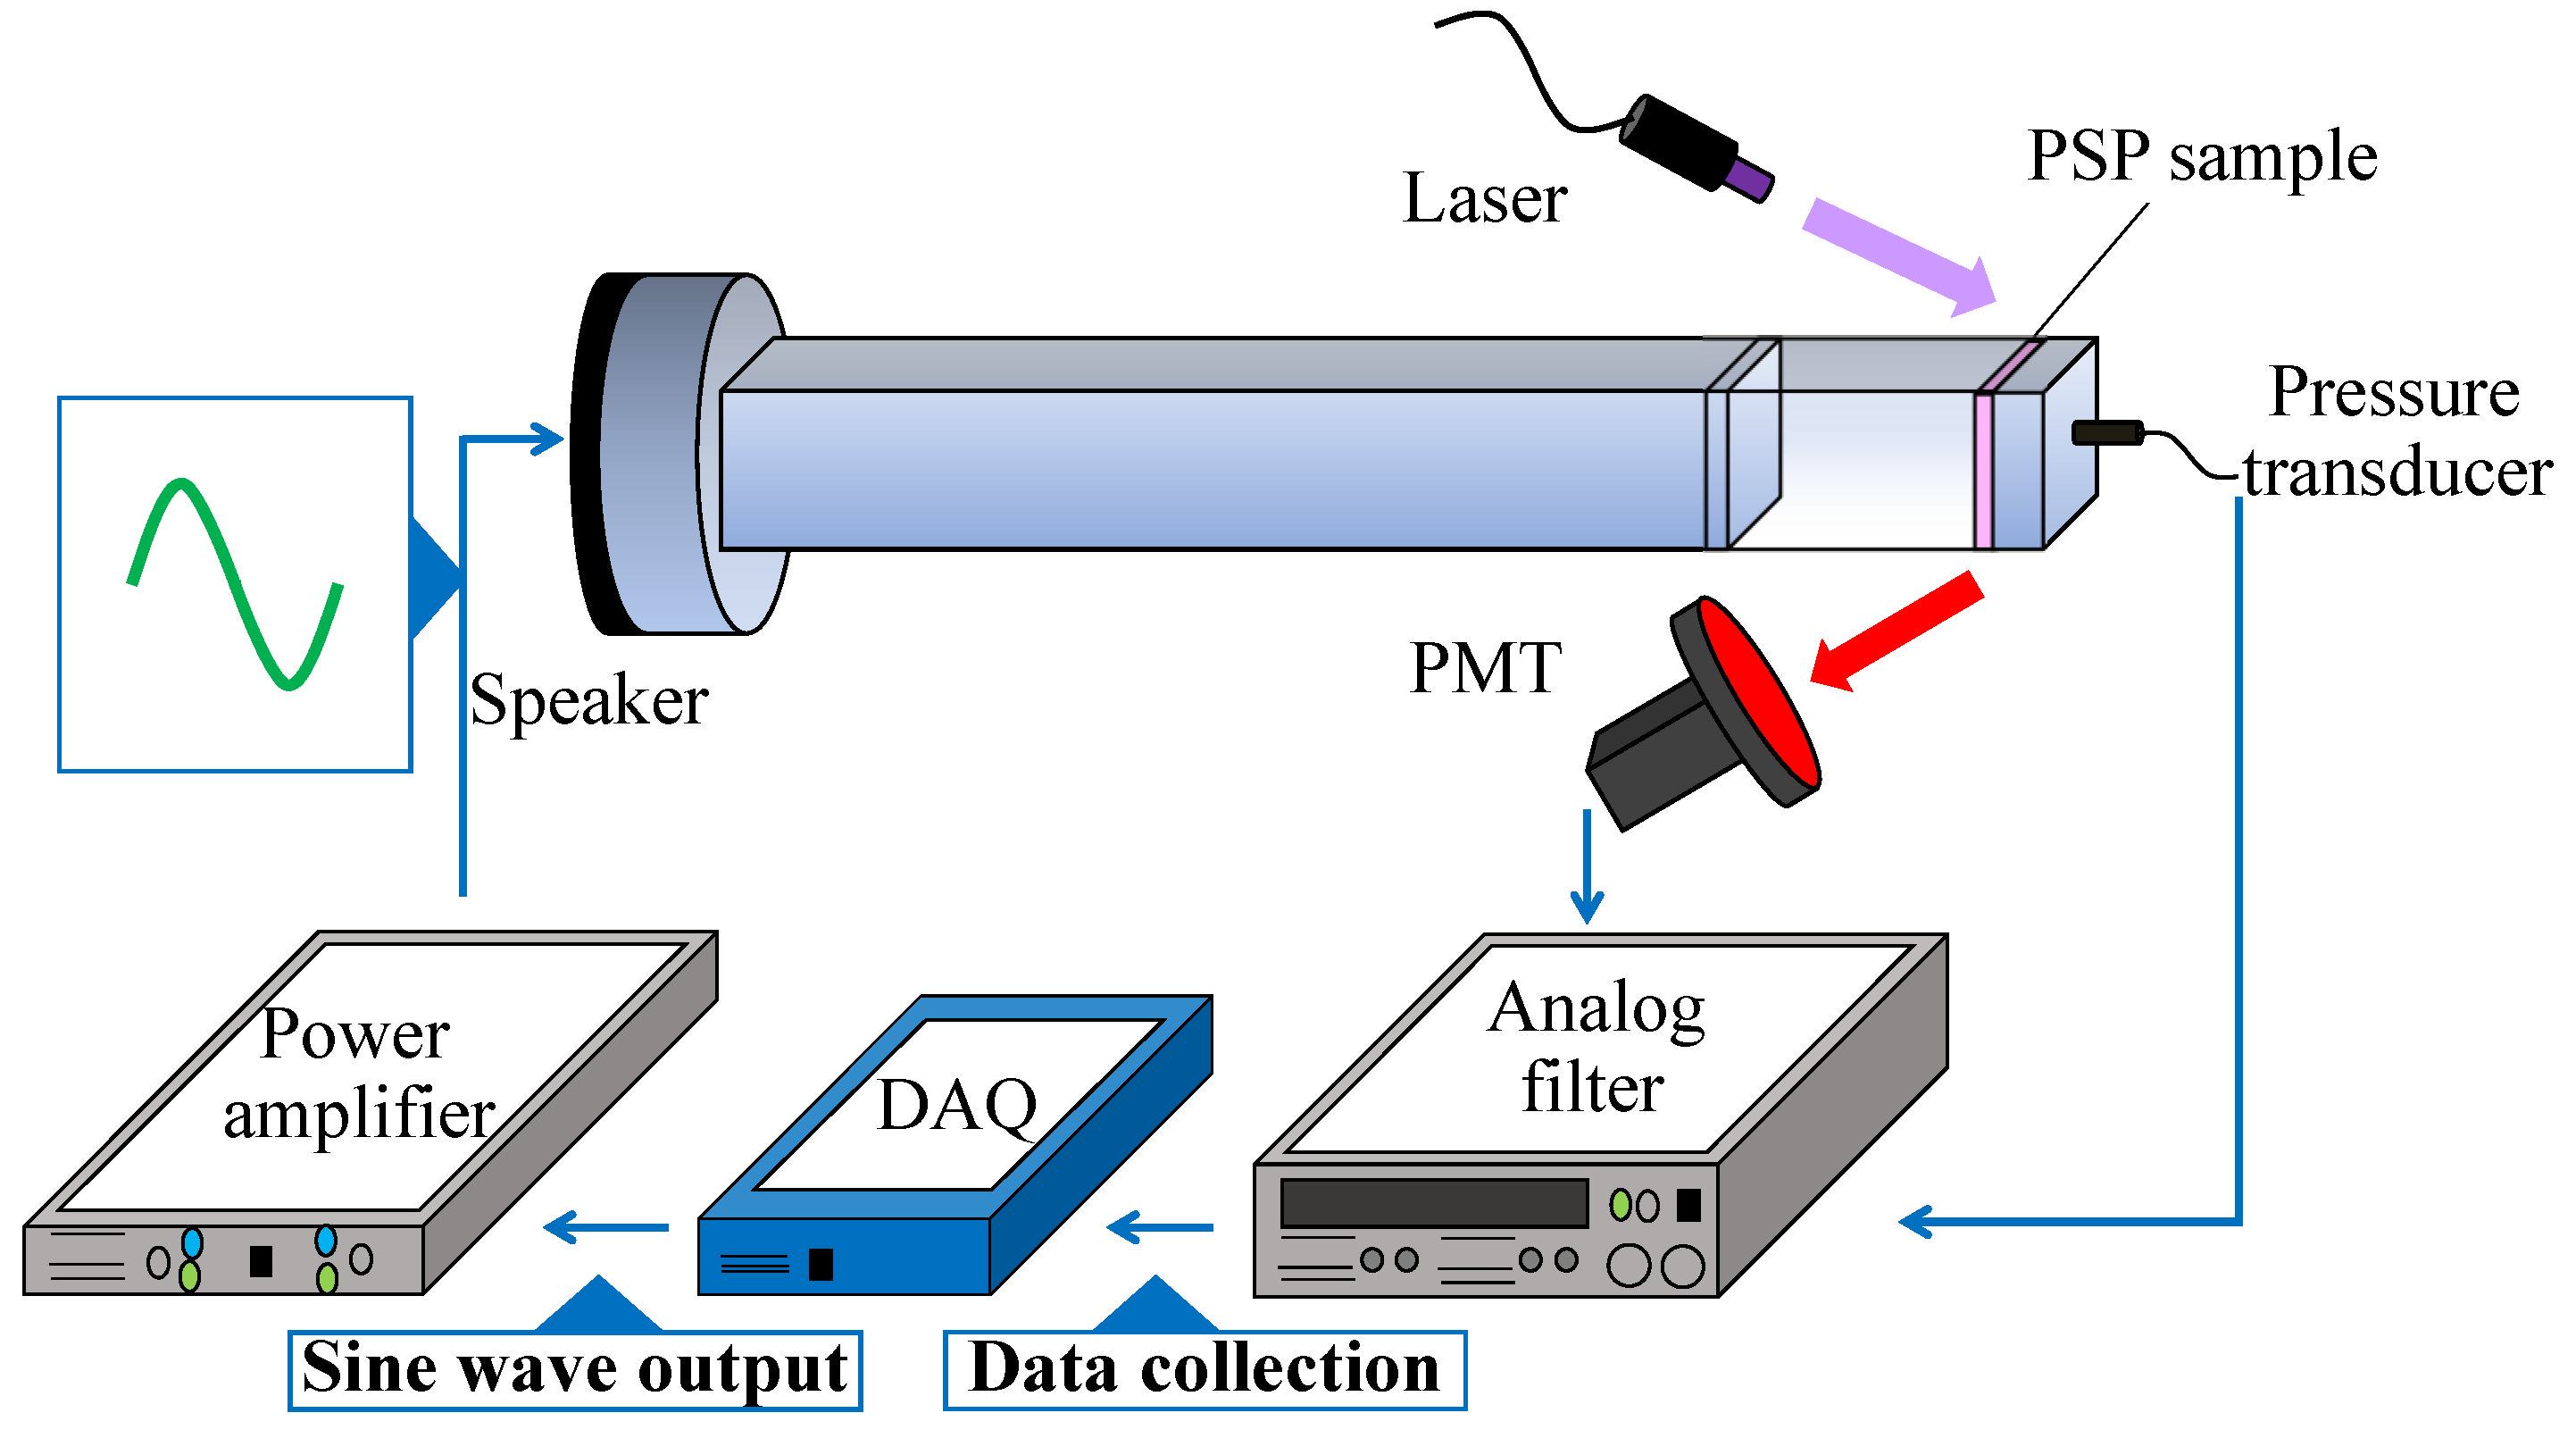
3.6. Resonance Tube
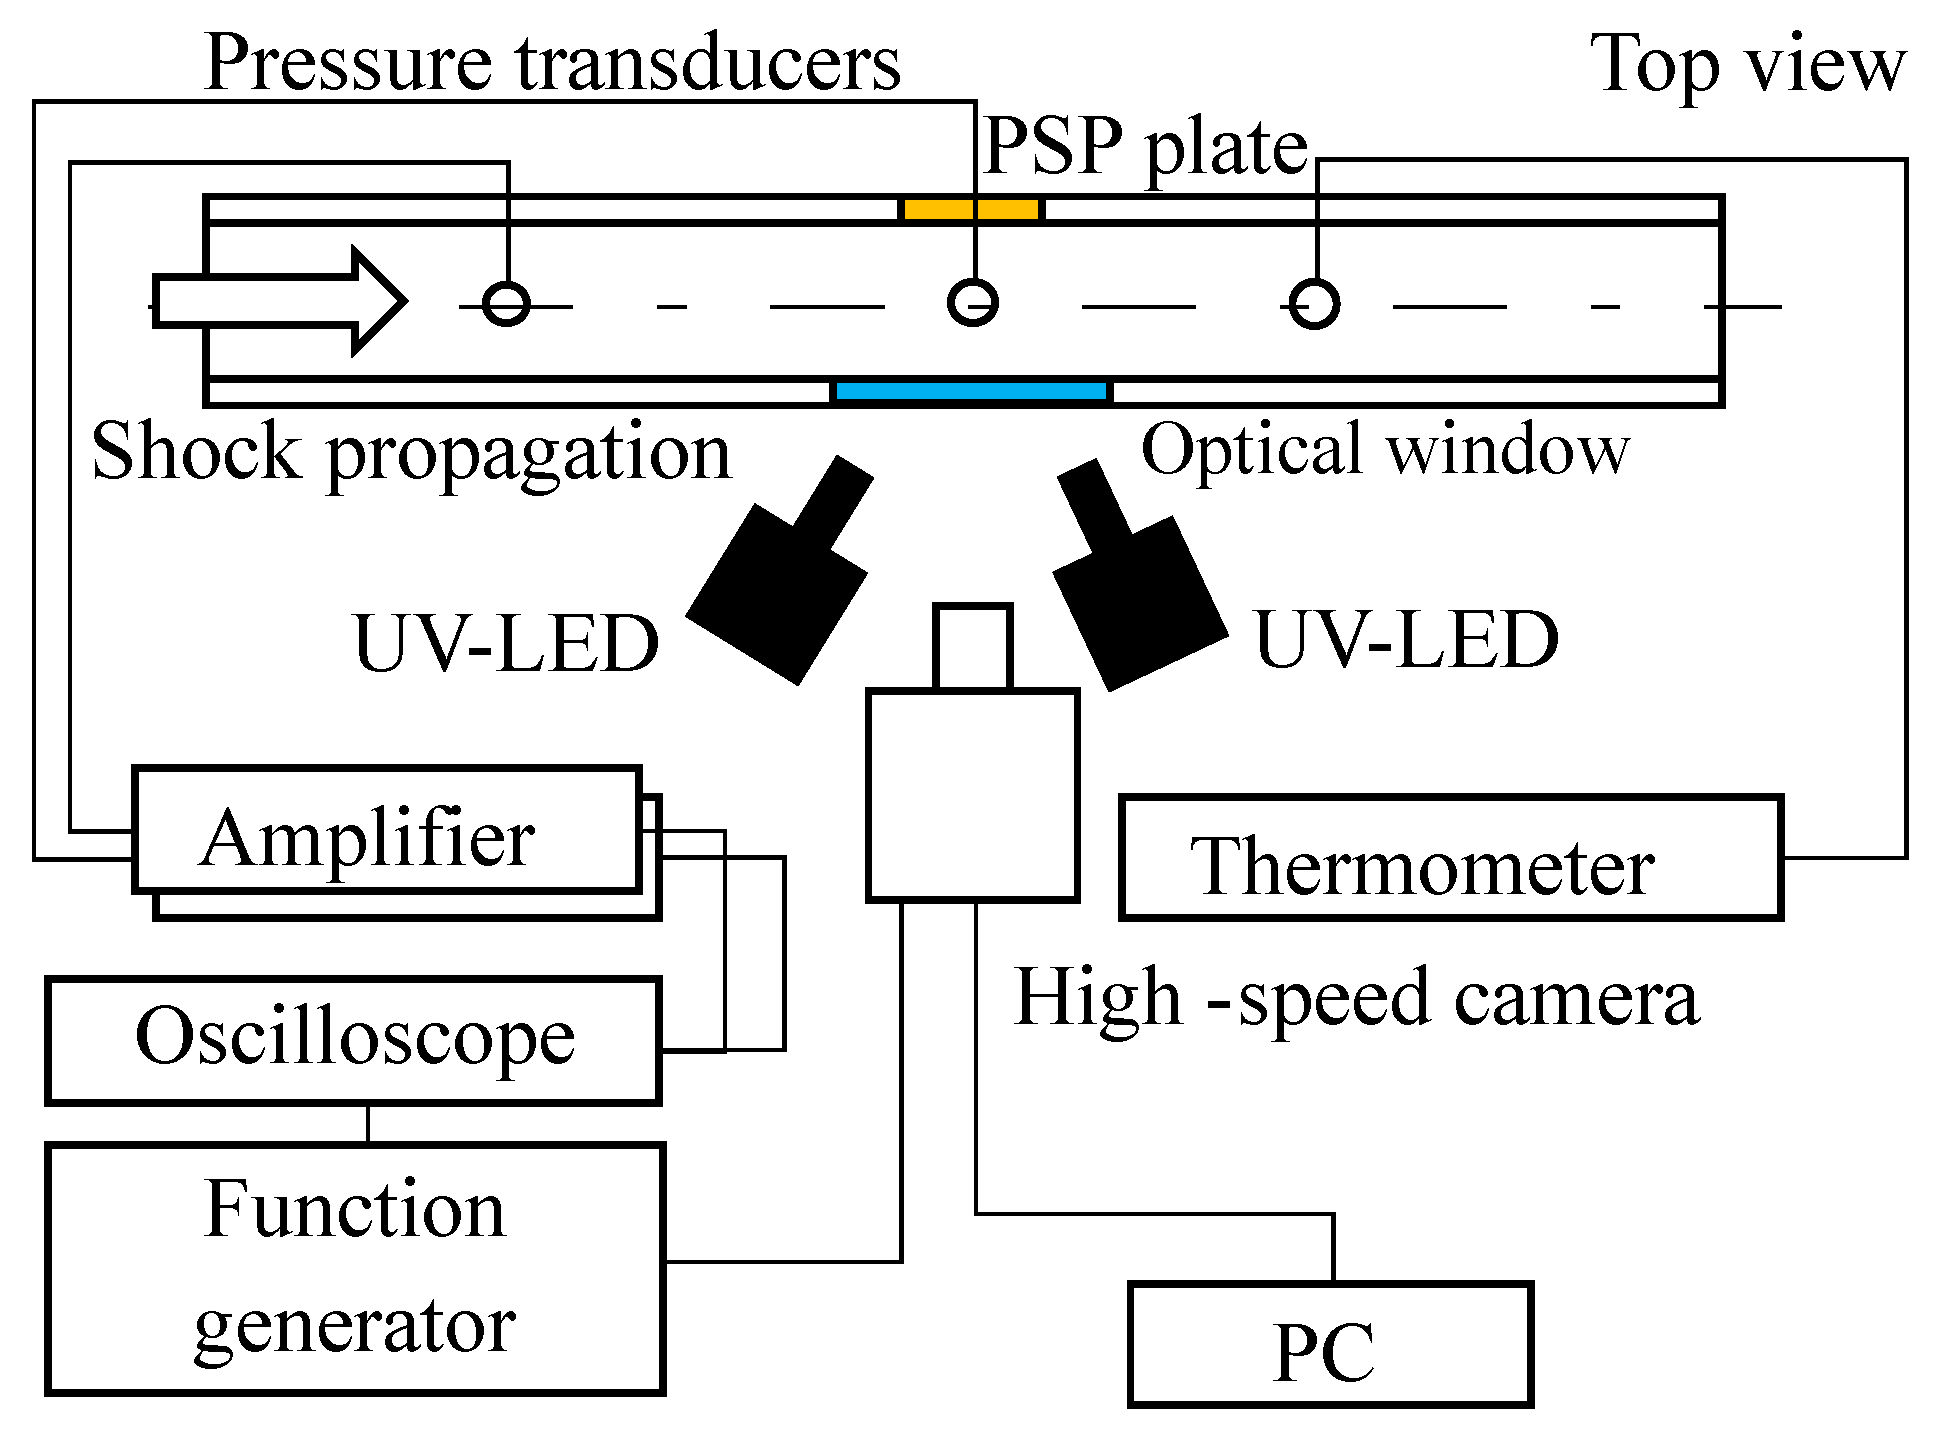
3.7. Shock Tube
4. Results and Discussions
4.1. Static Characteristics
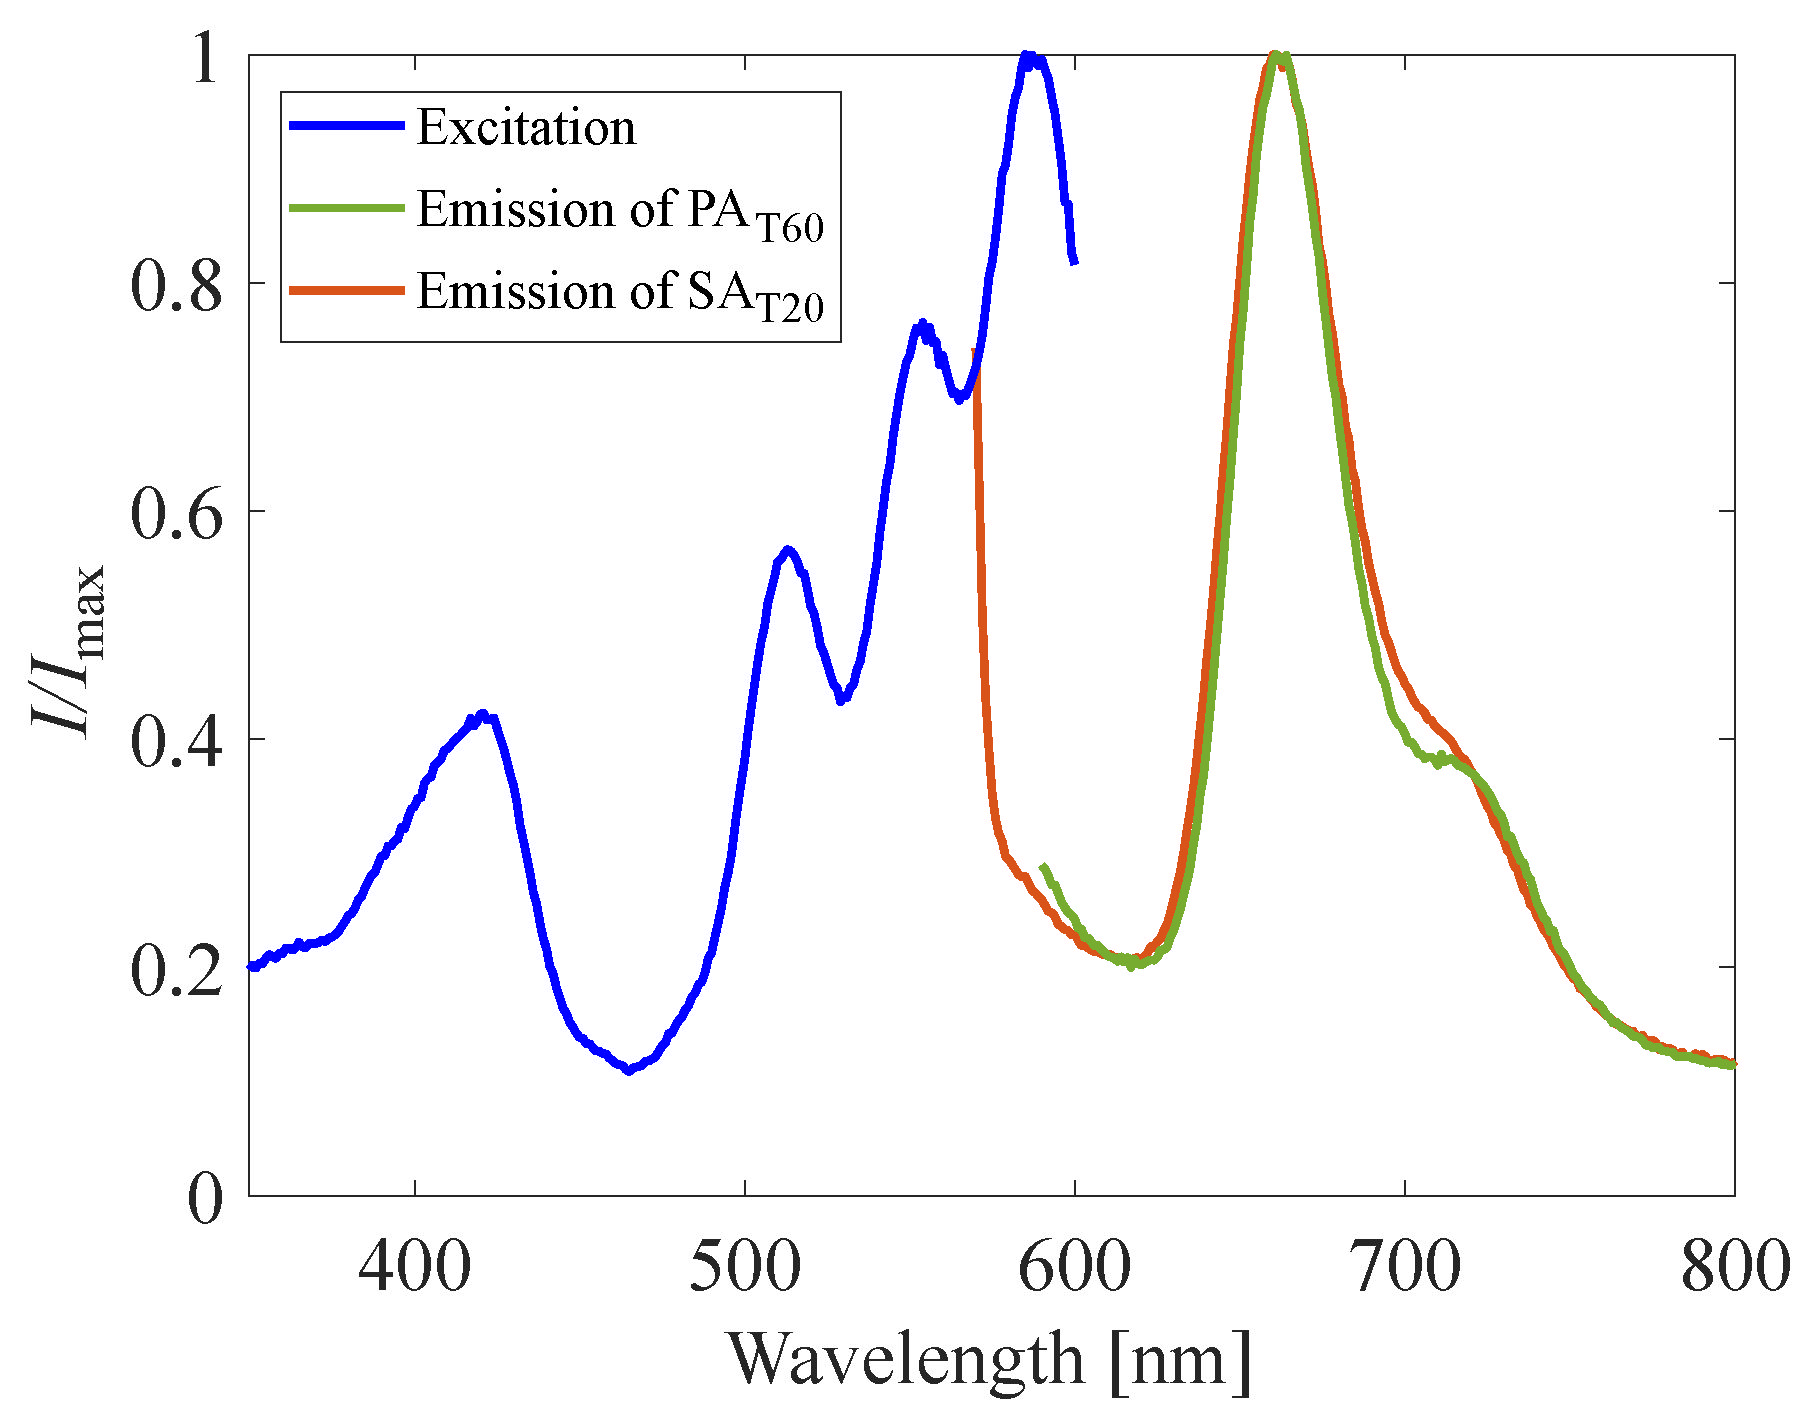
4.1.1. Excitation and Emission Spectrum
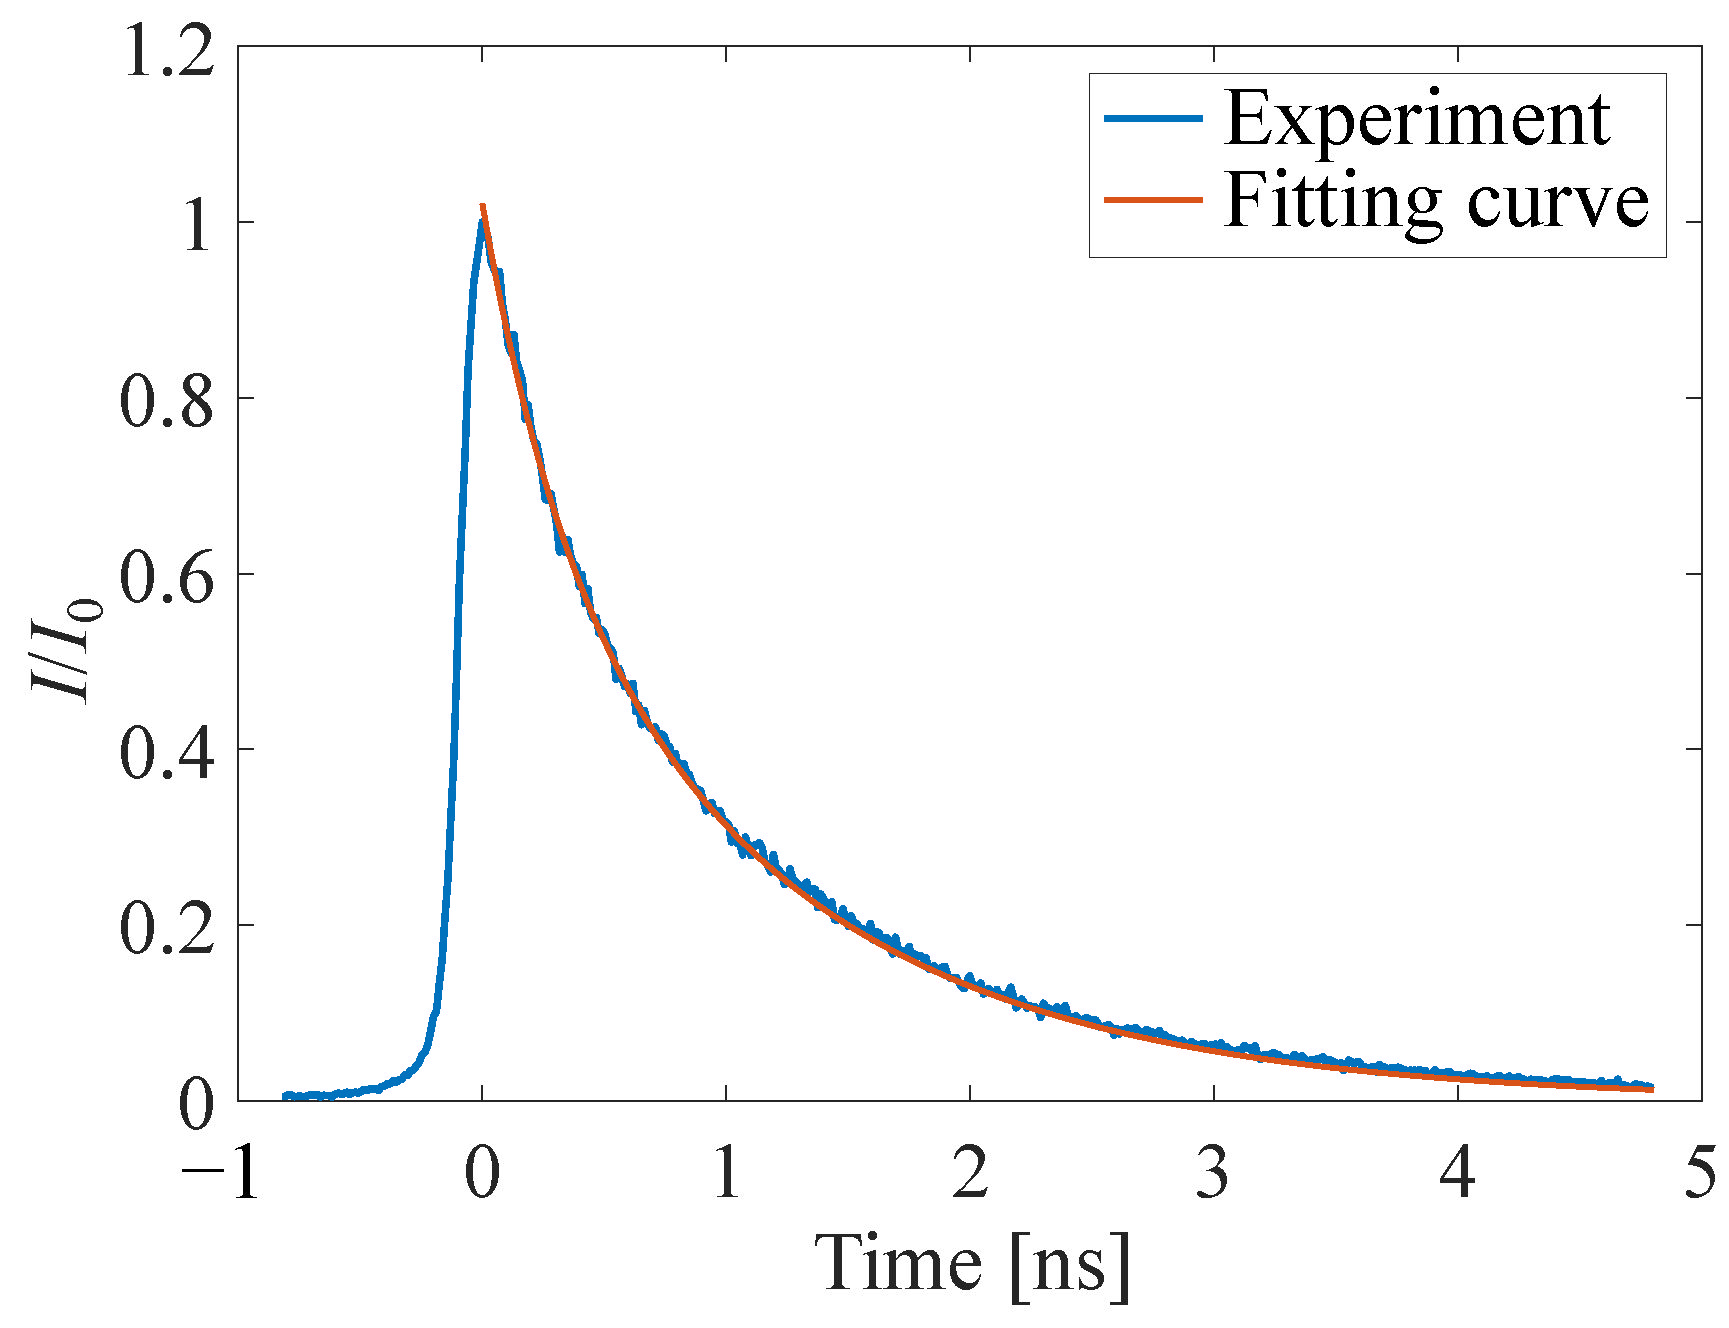
4.1.2. Luminescence Lifetime
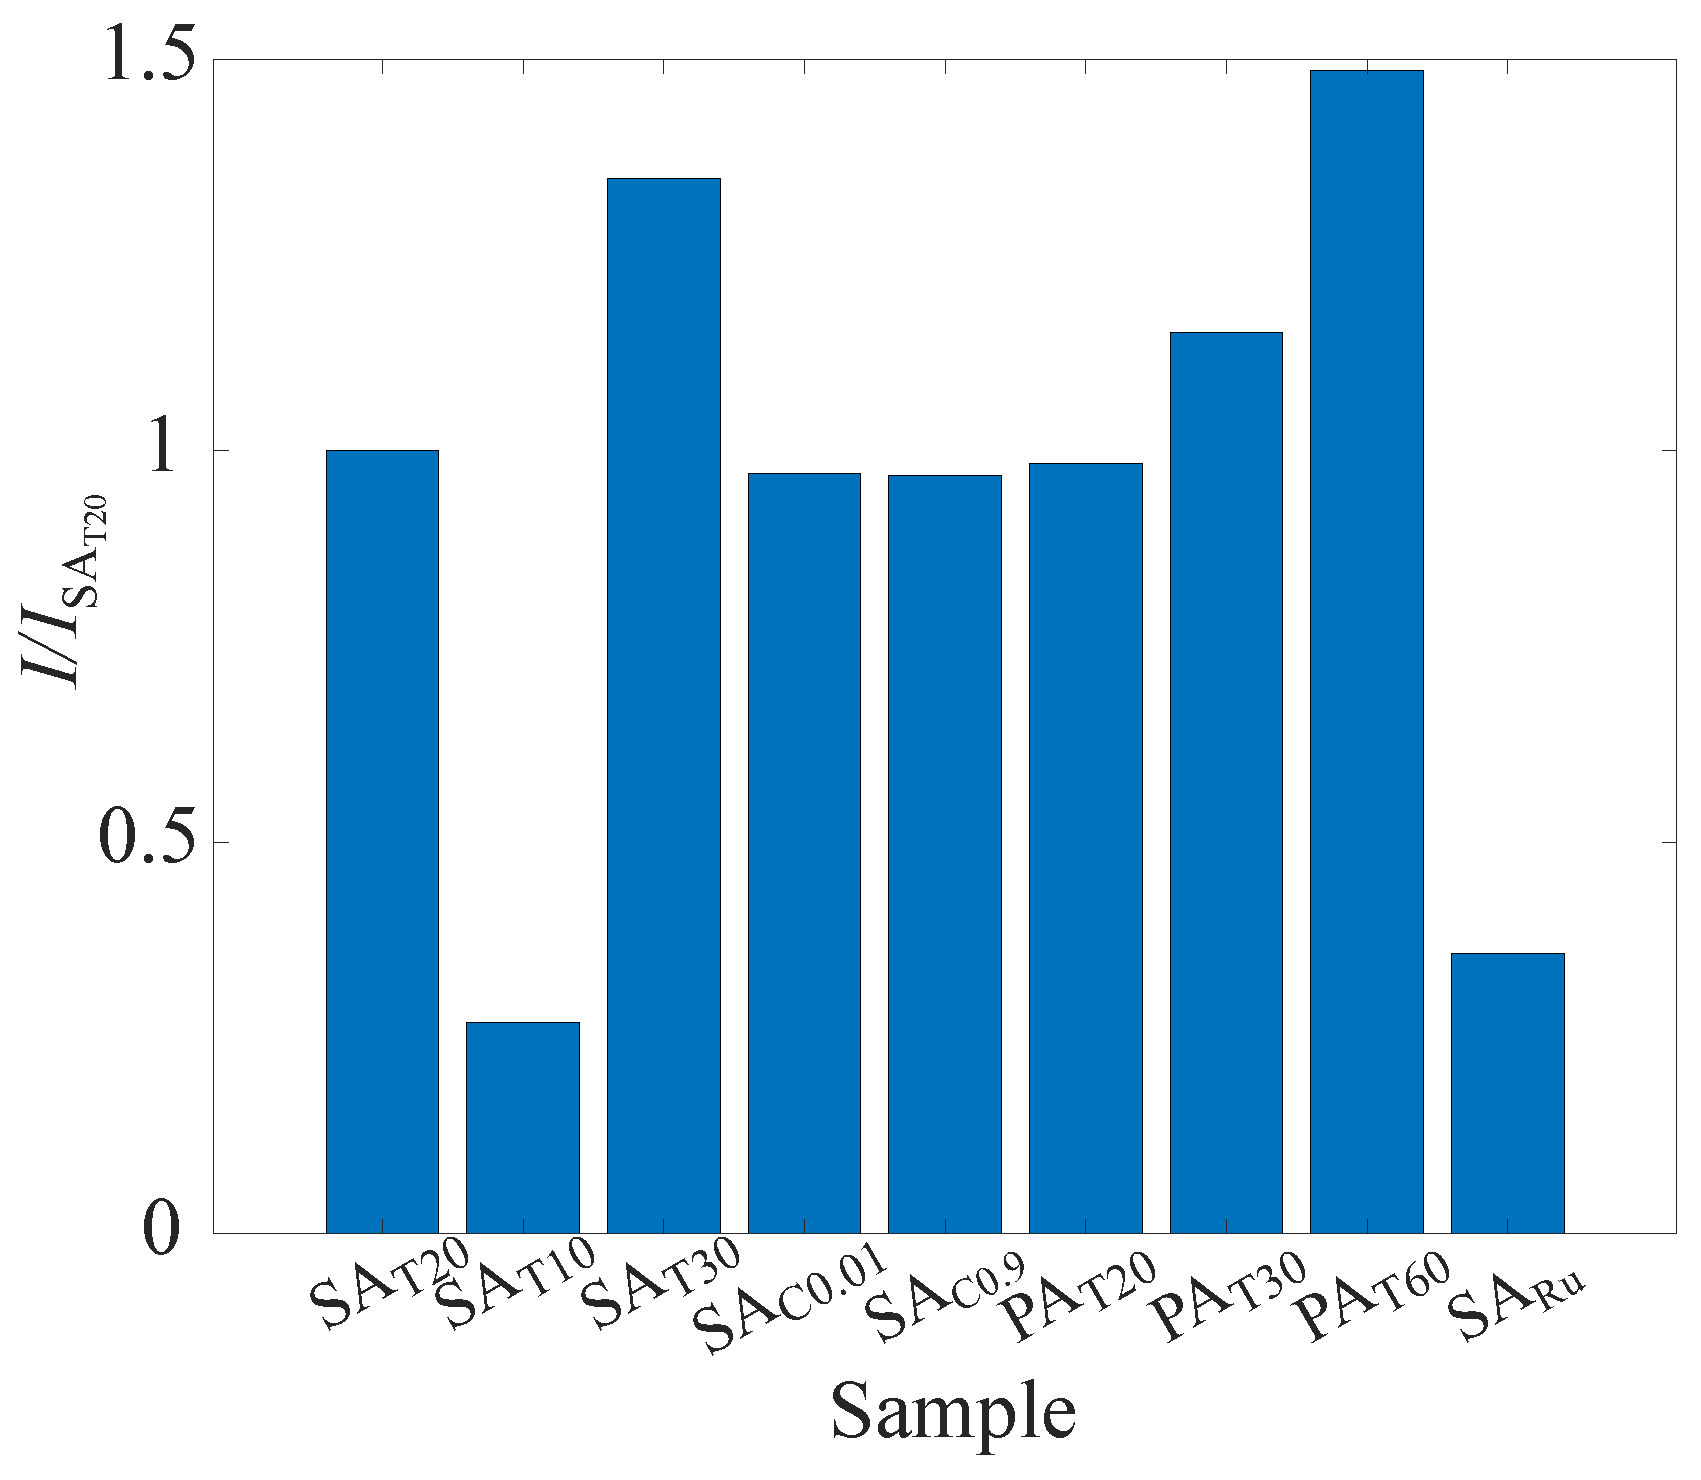
4.1.3. Signal Intensity
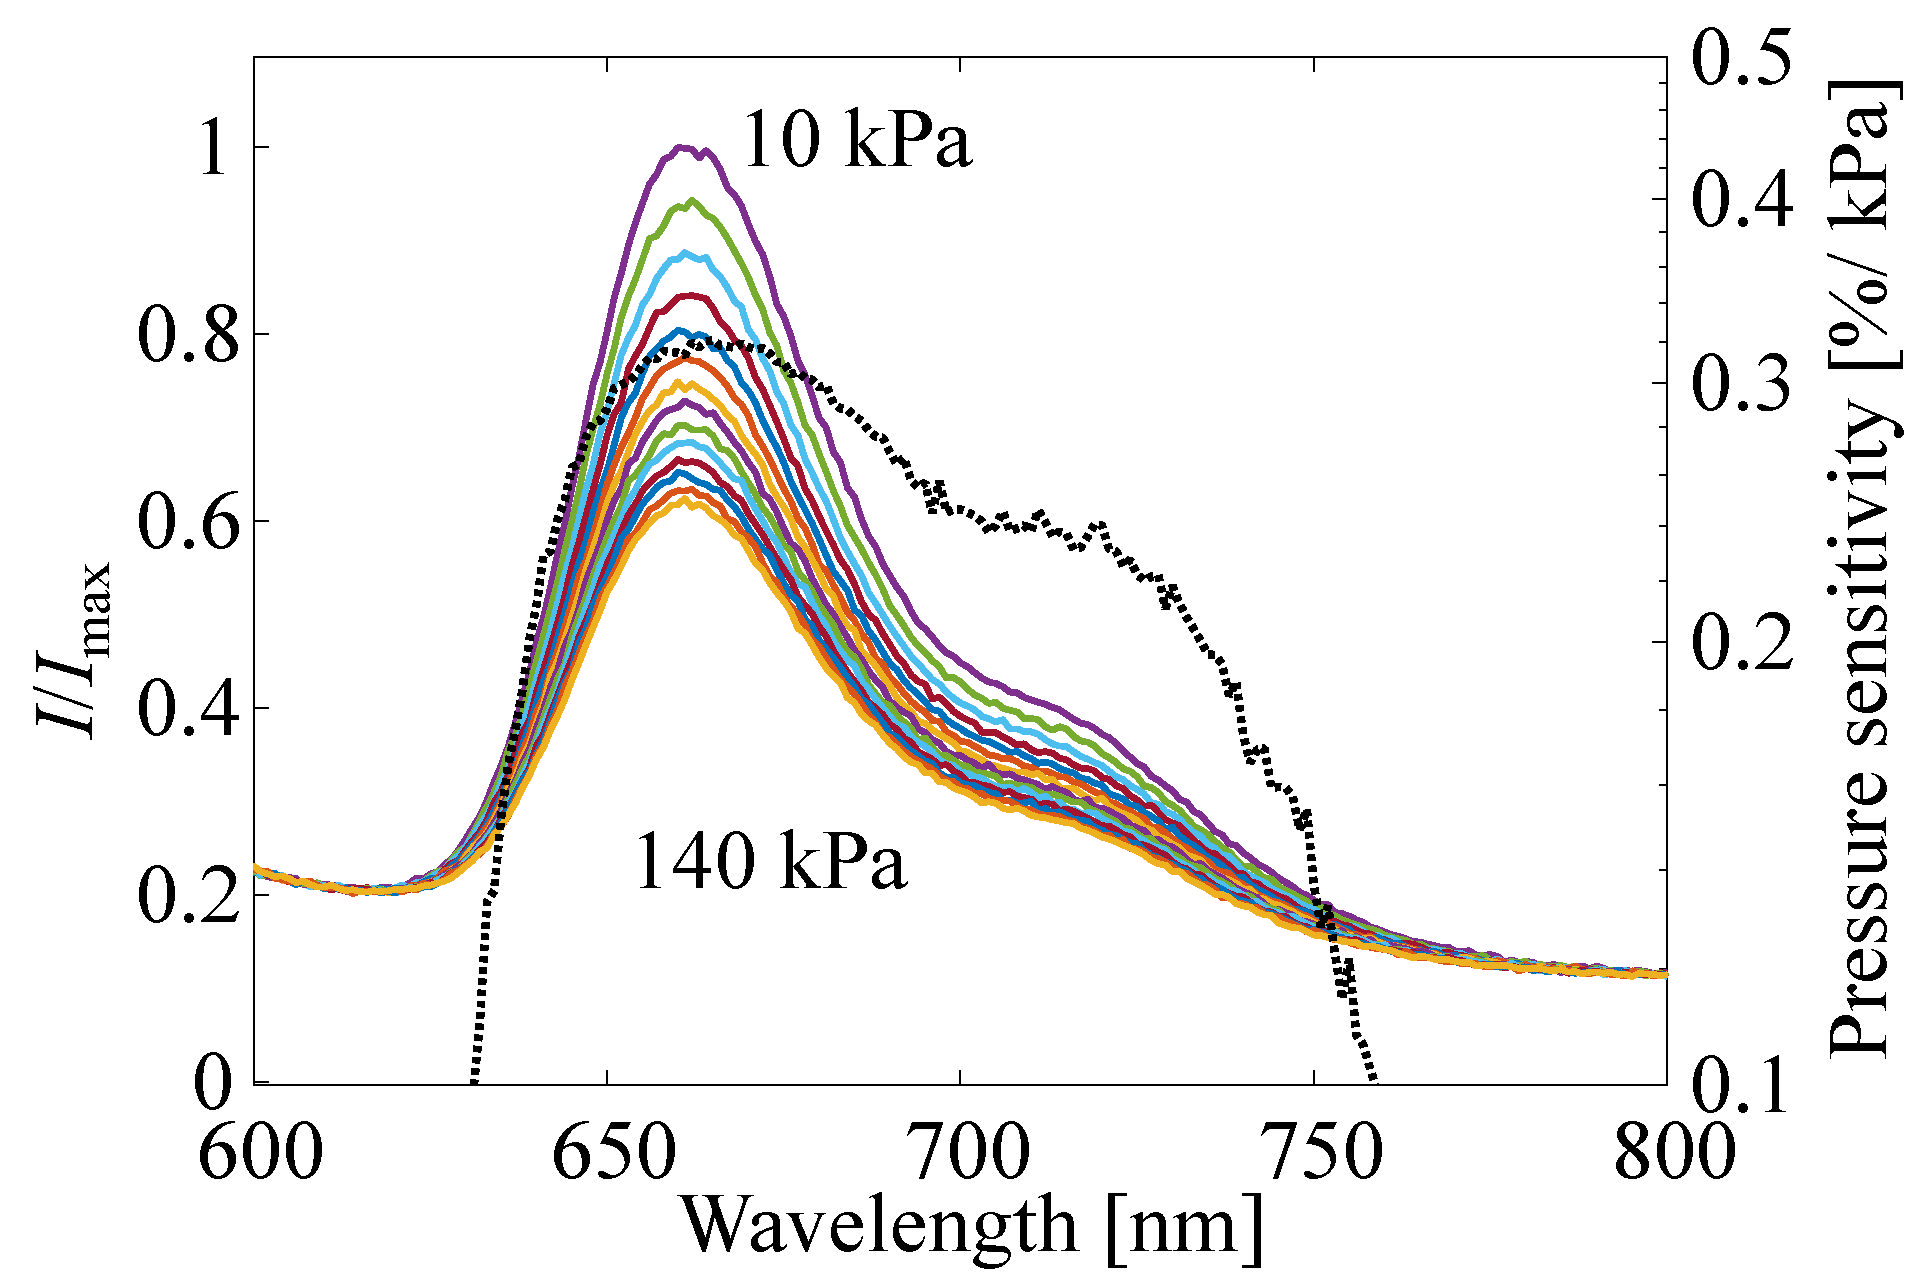
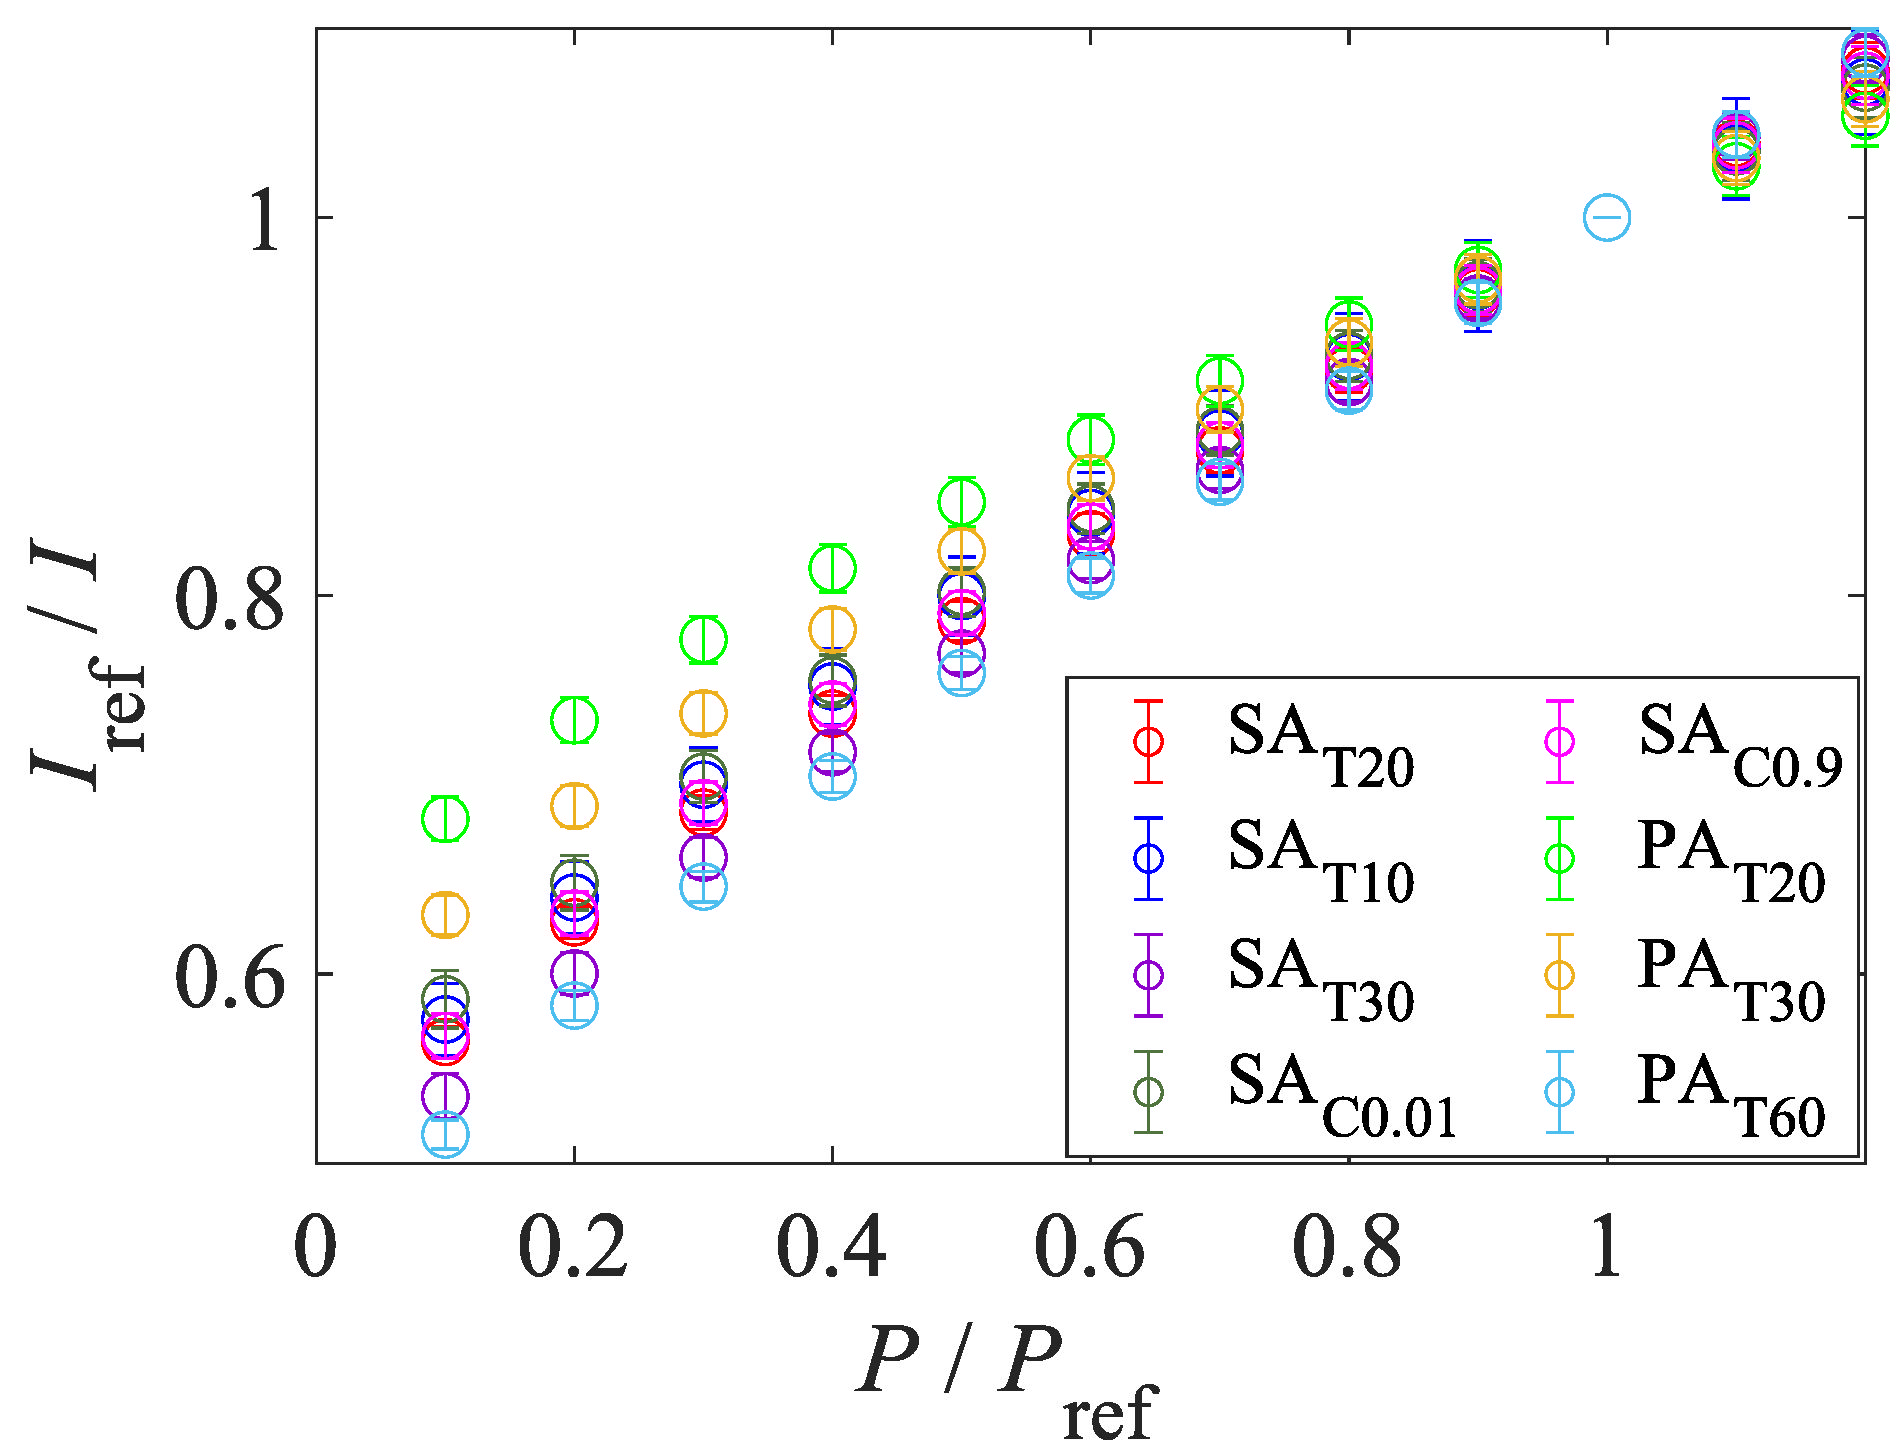
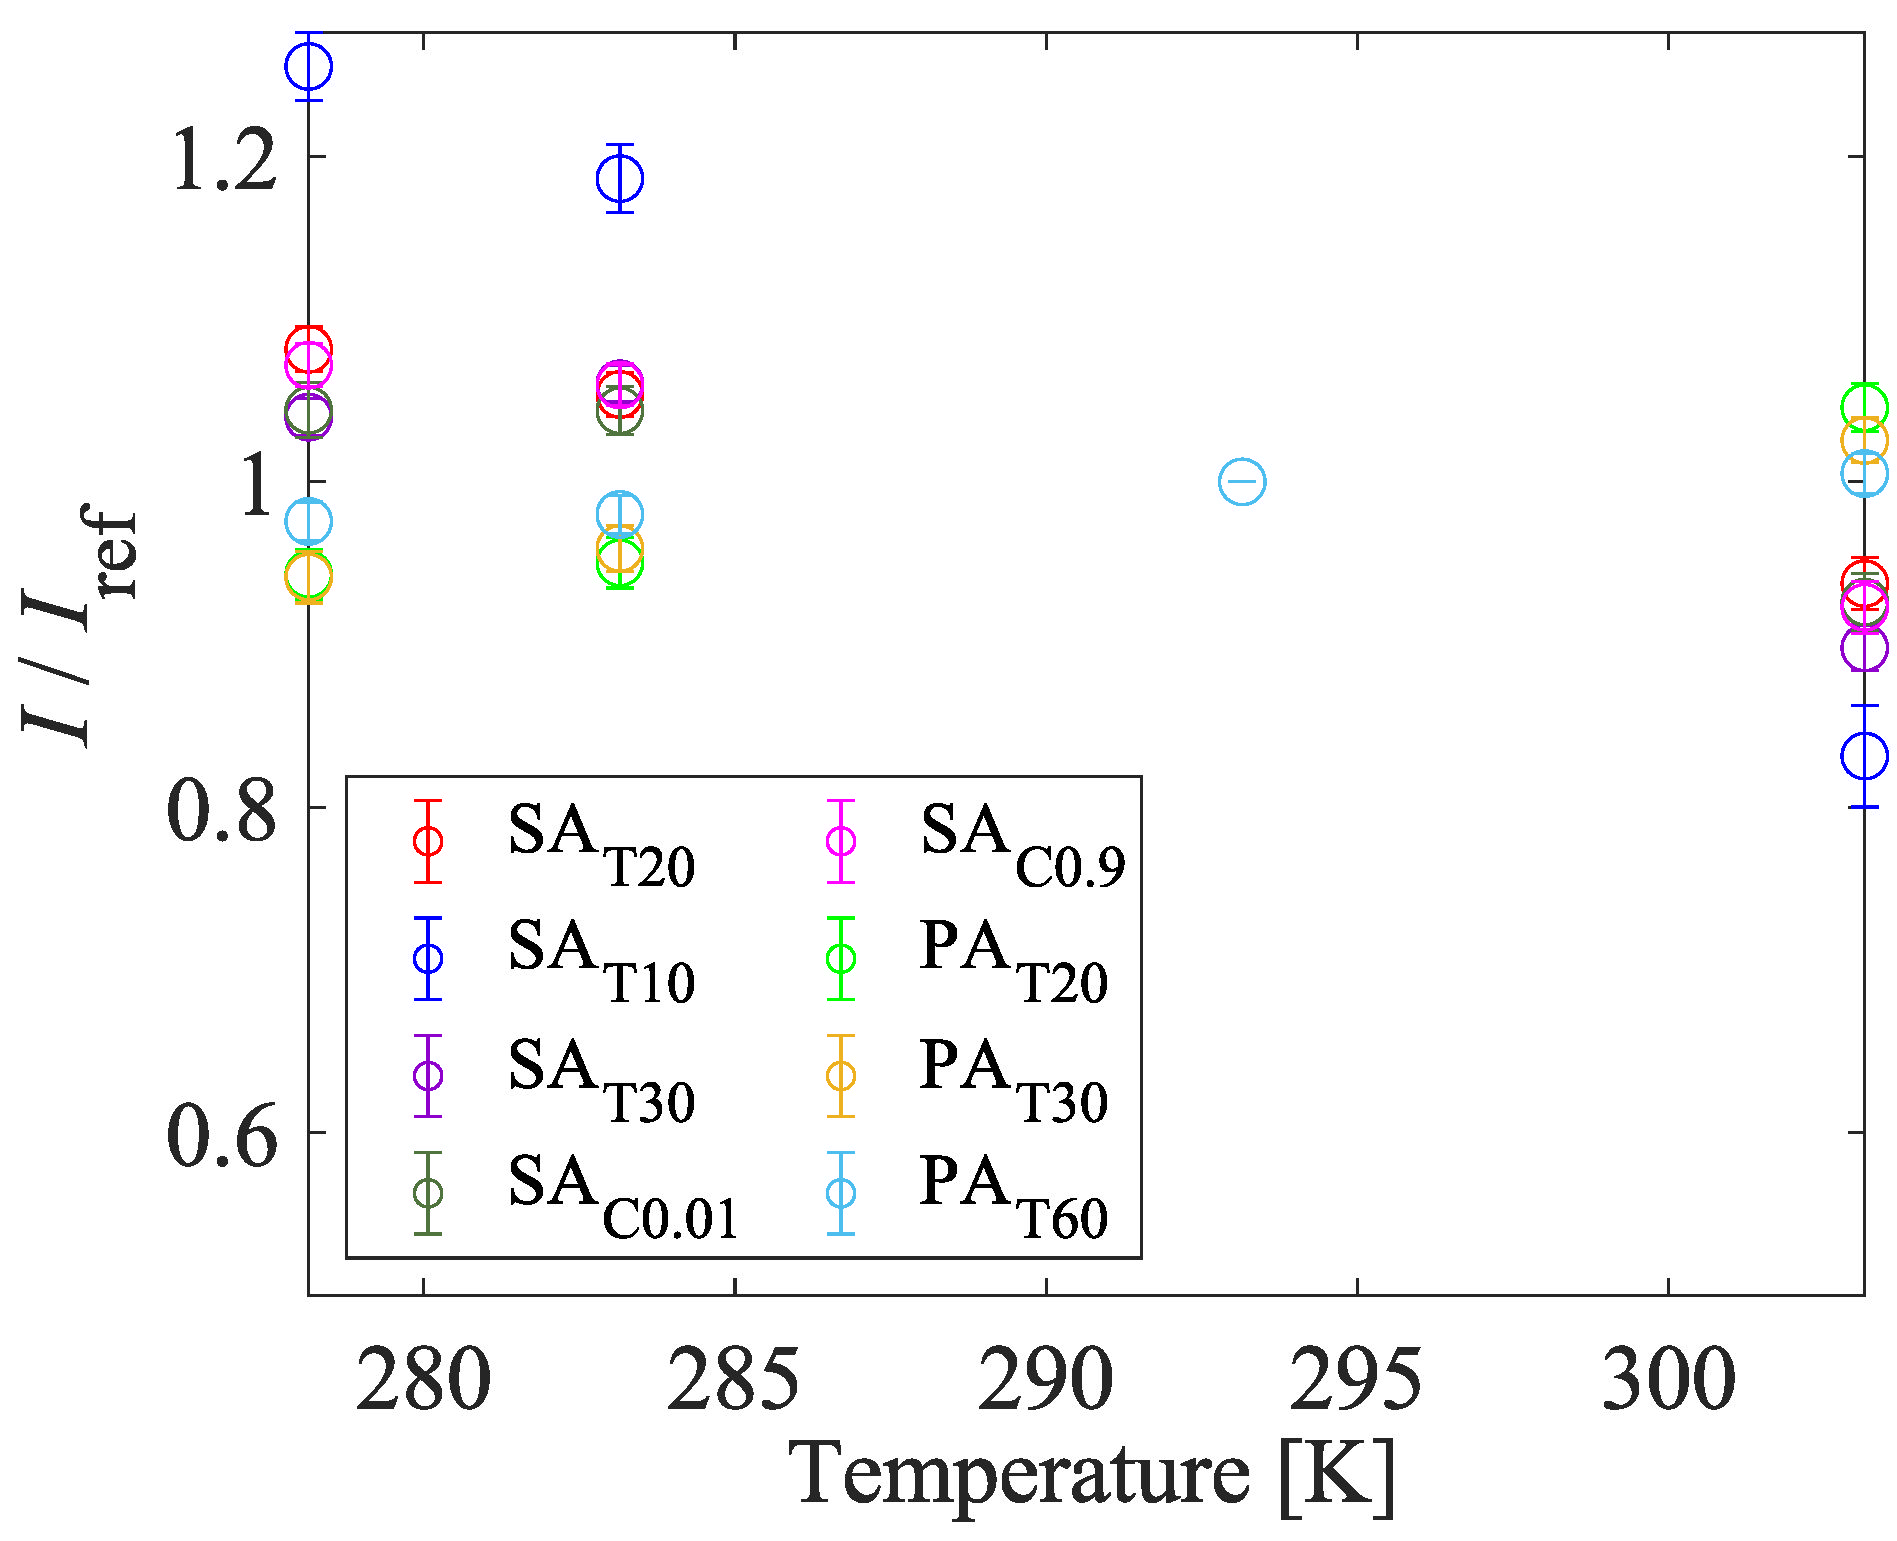
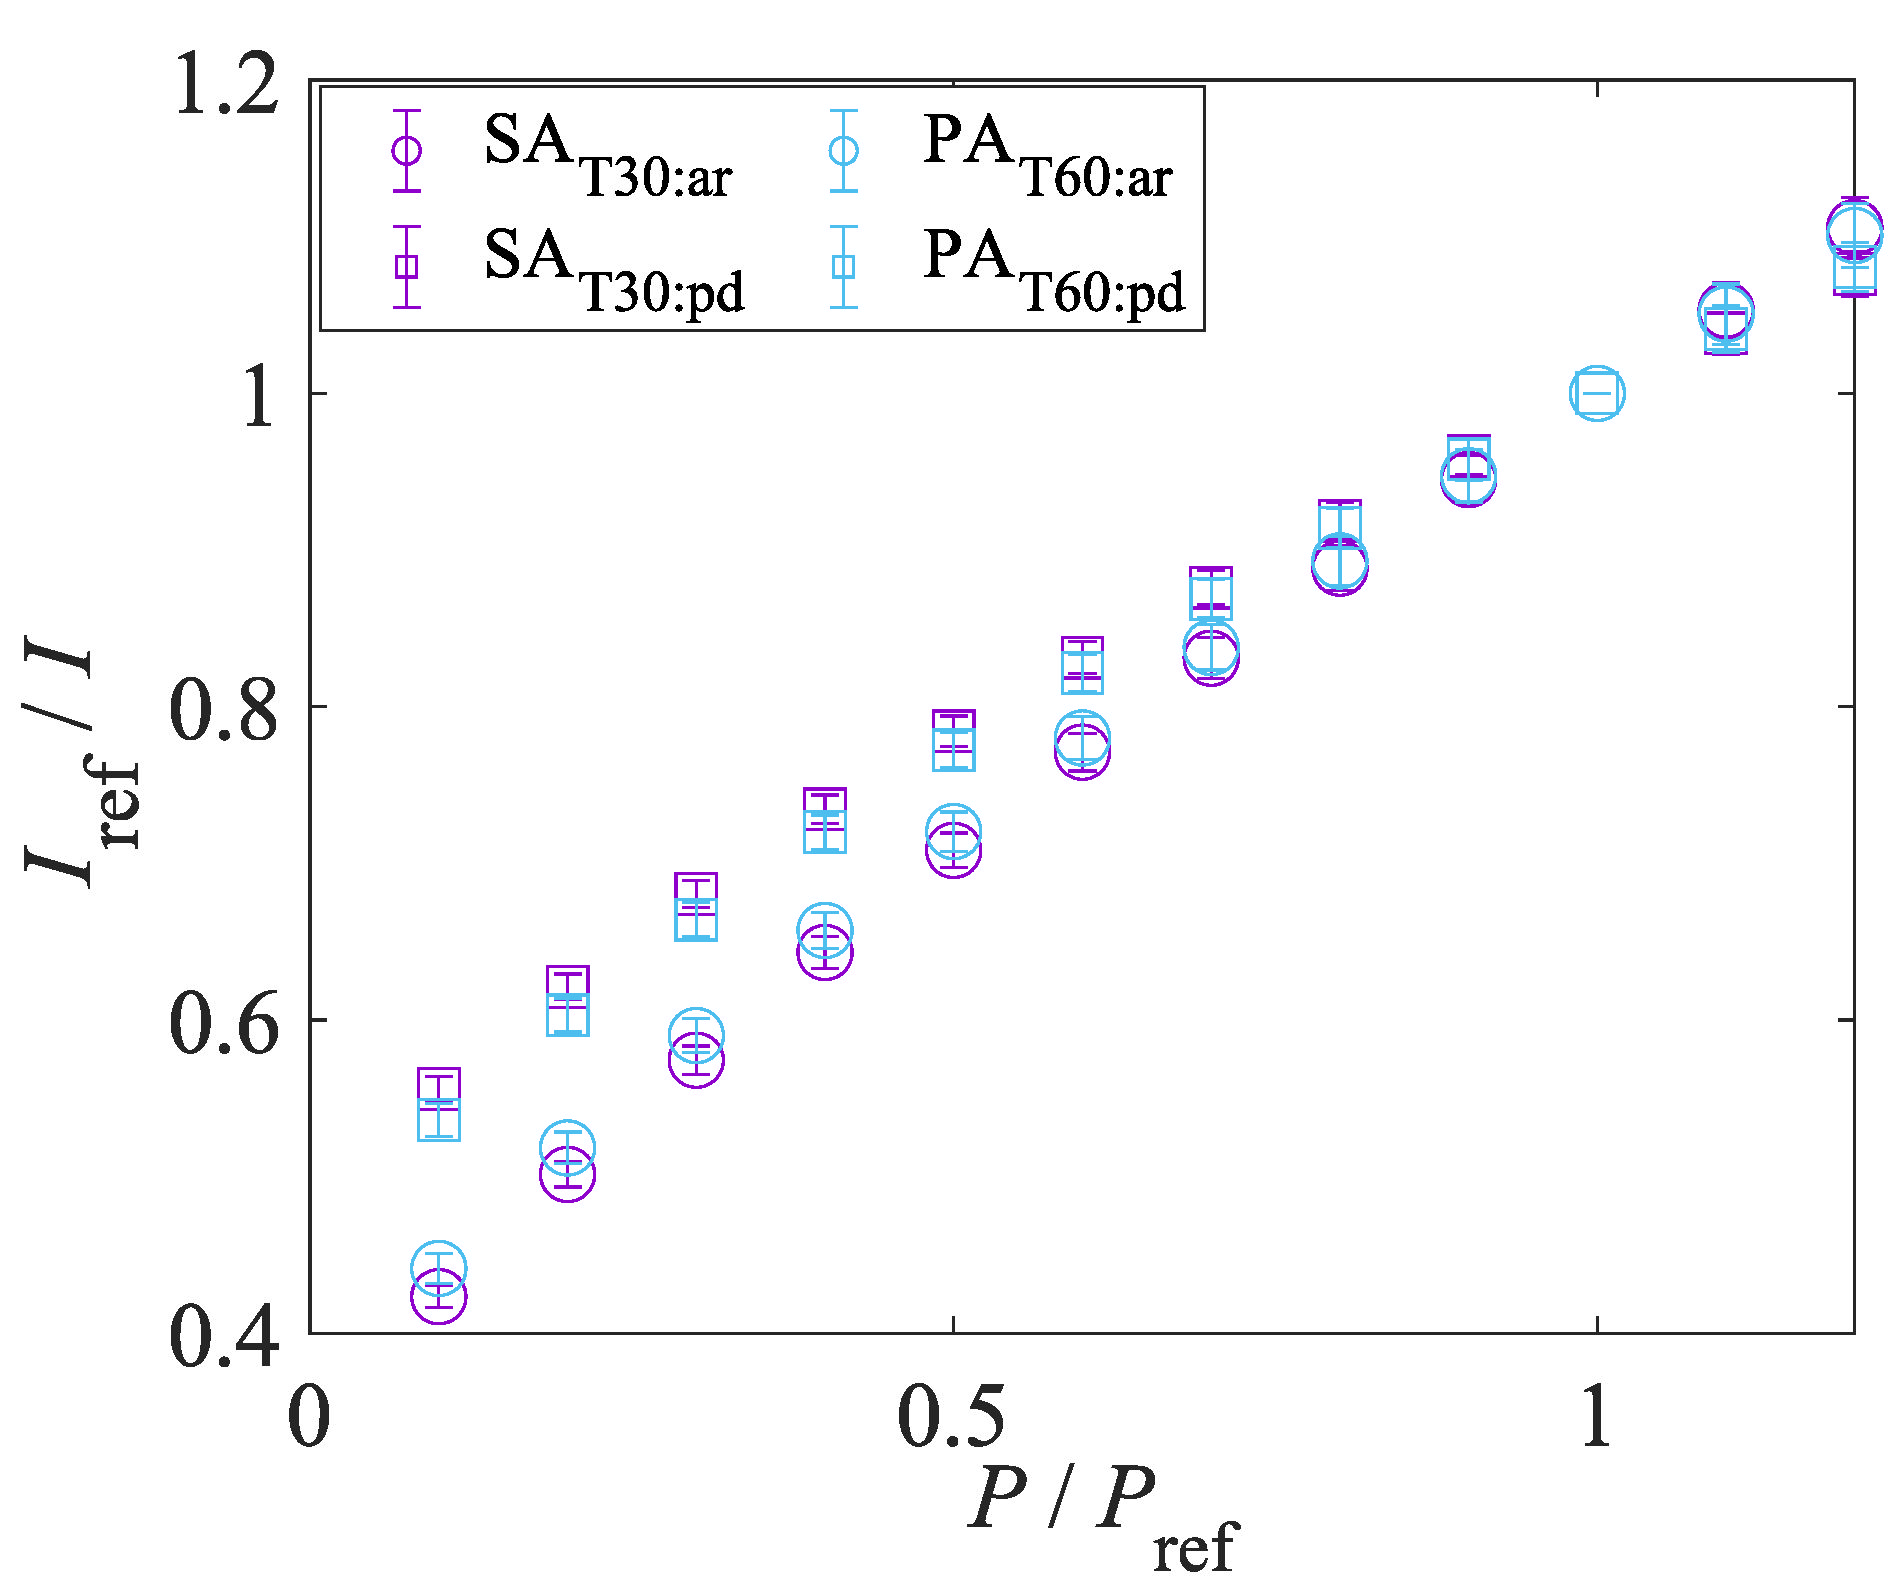
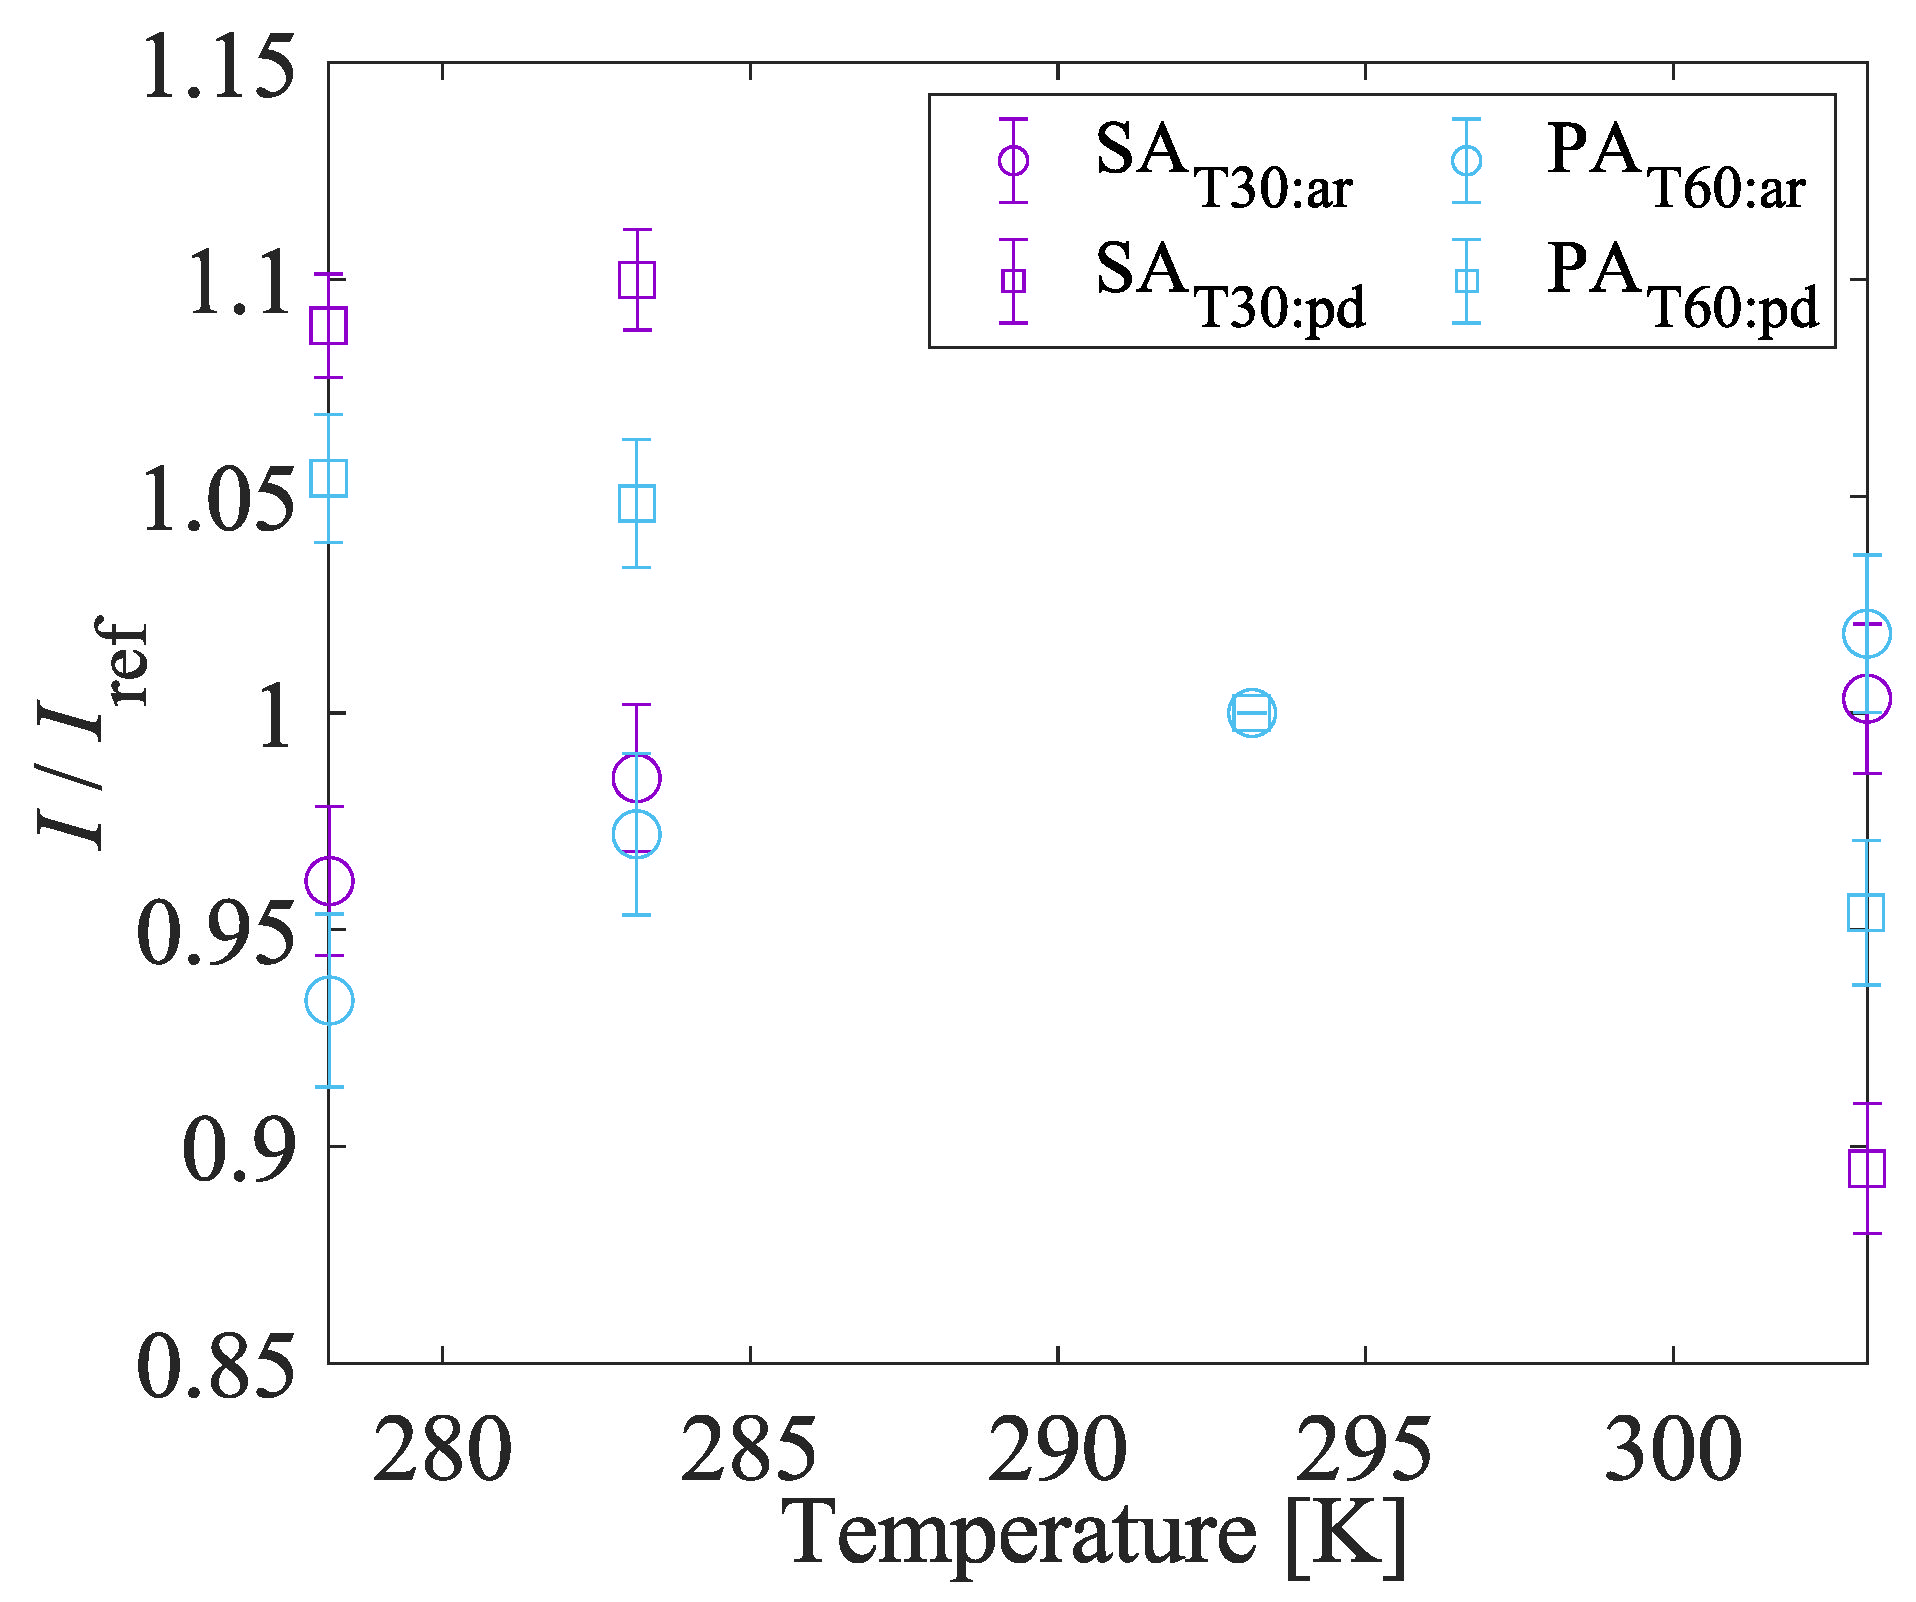
4.1.4. Pressure and Temperature Sensitivities
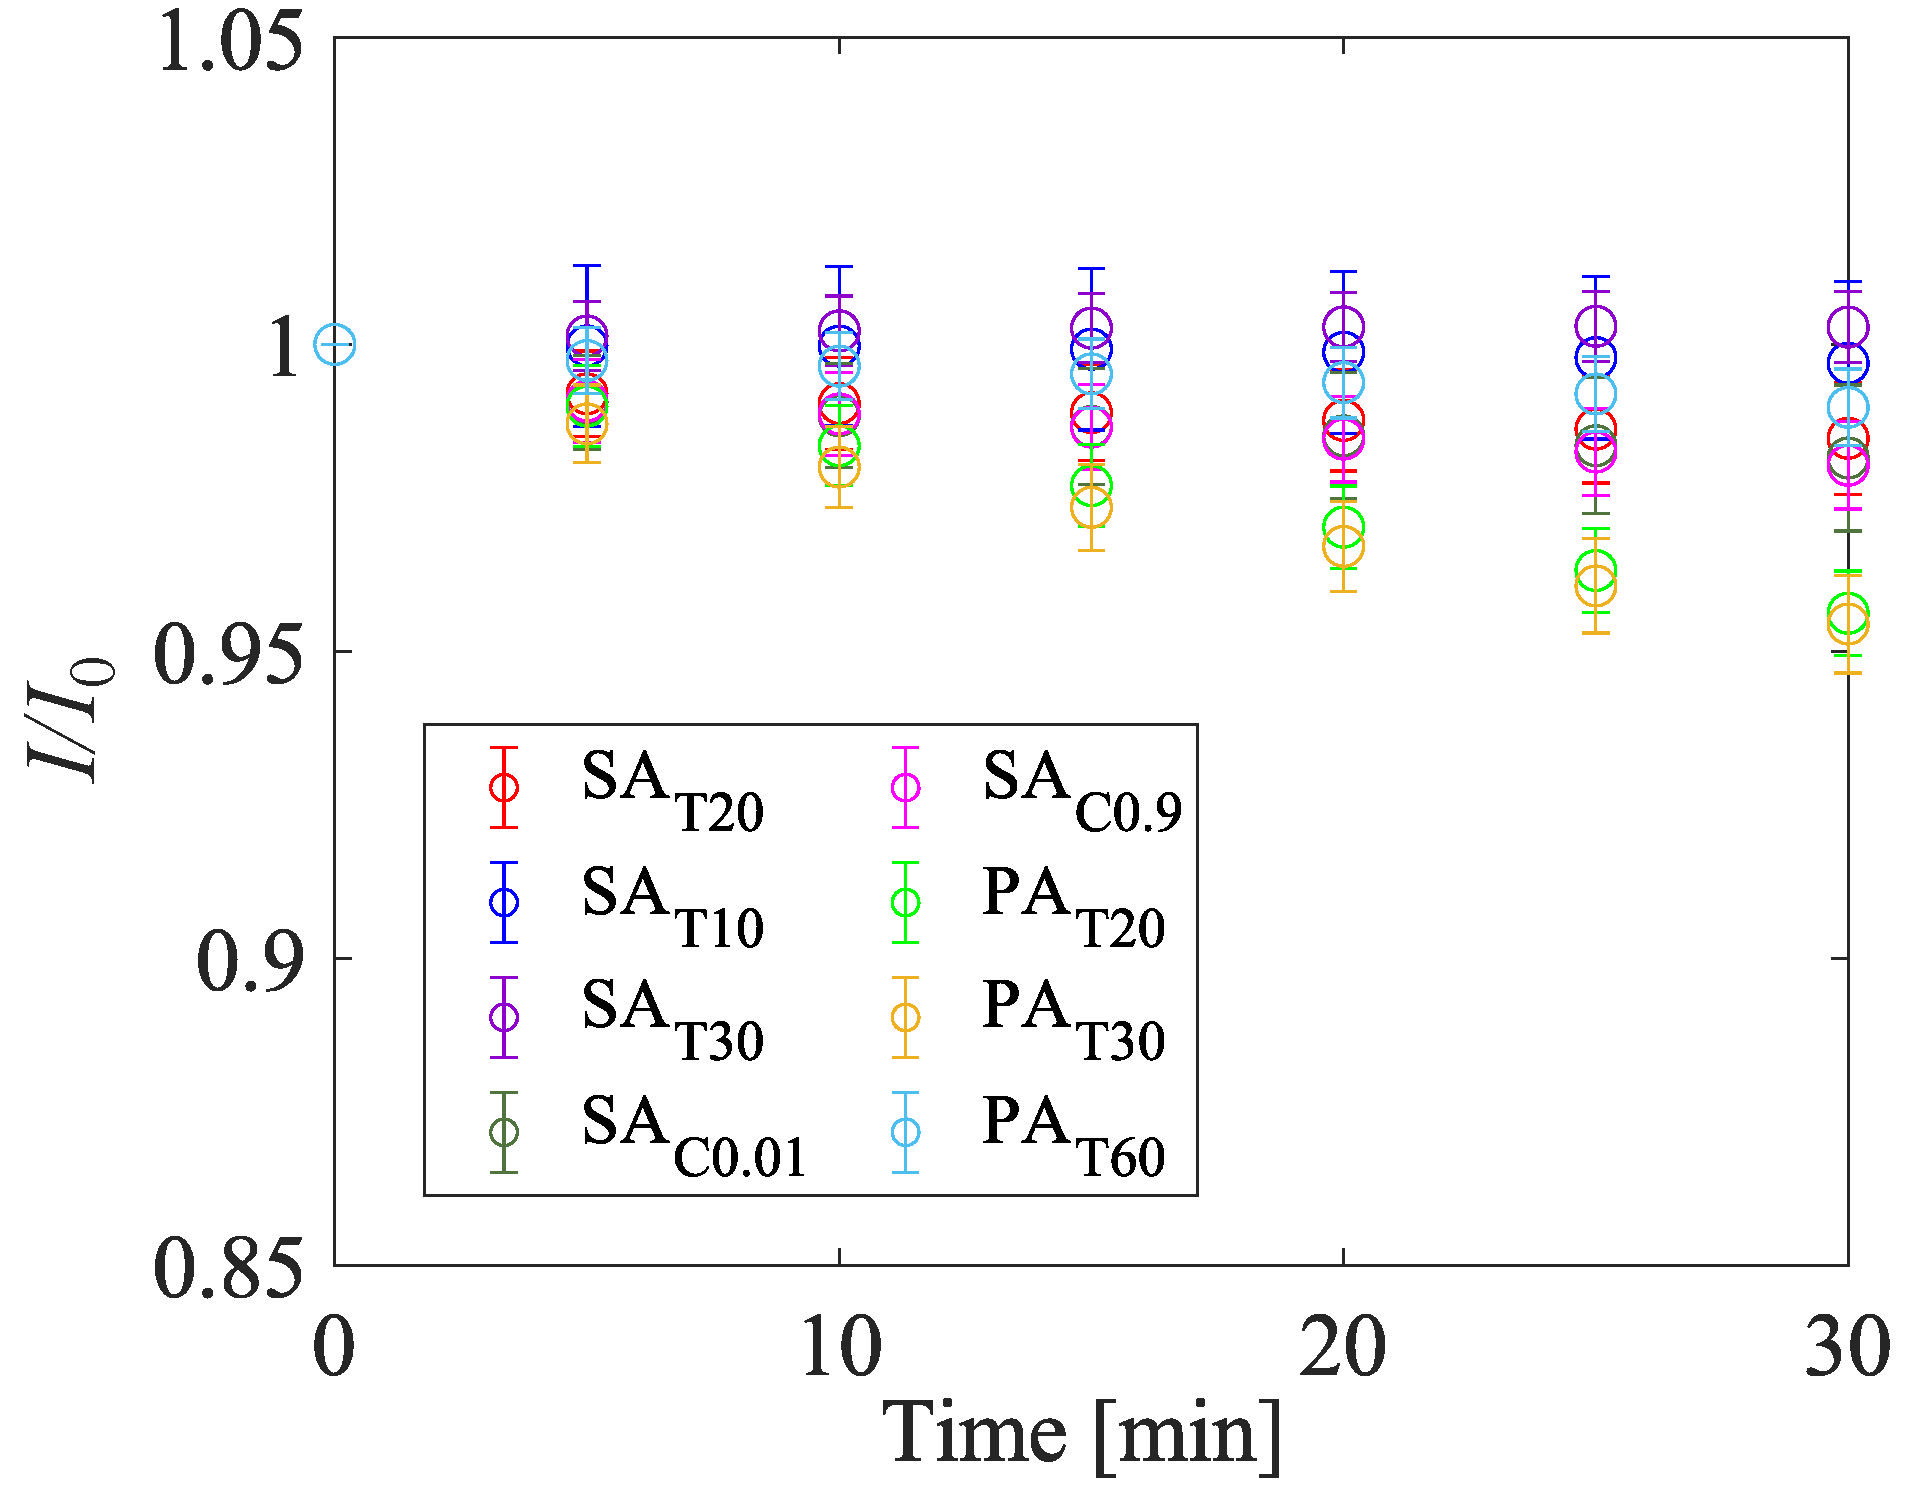
4.1.5. Photodegradation
4.1.6. Solvent Resistance
4.2. Dynamic Characteristics
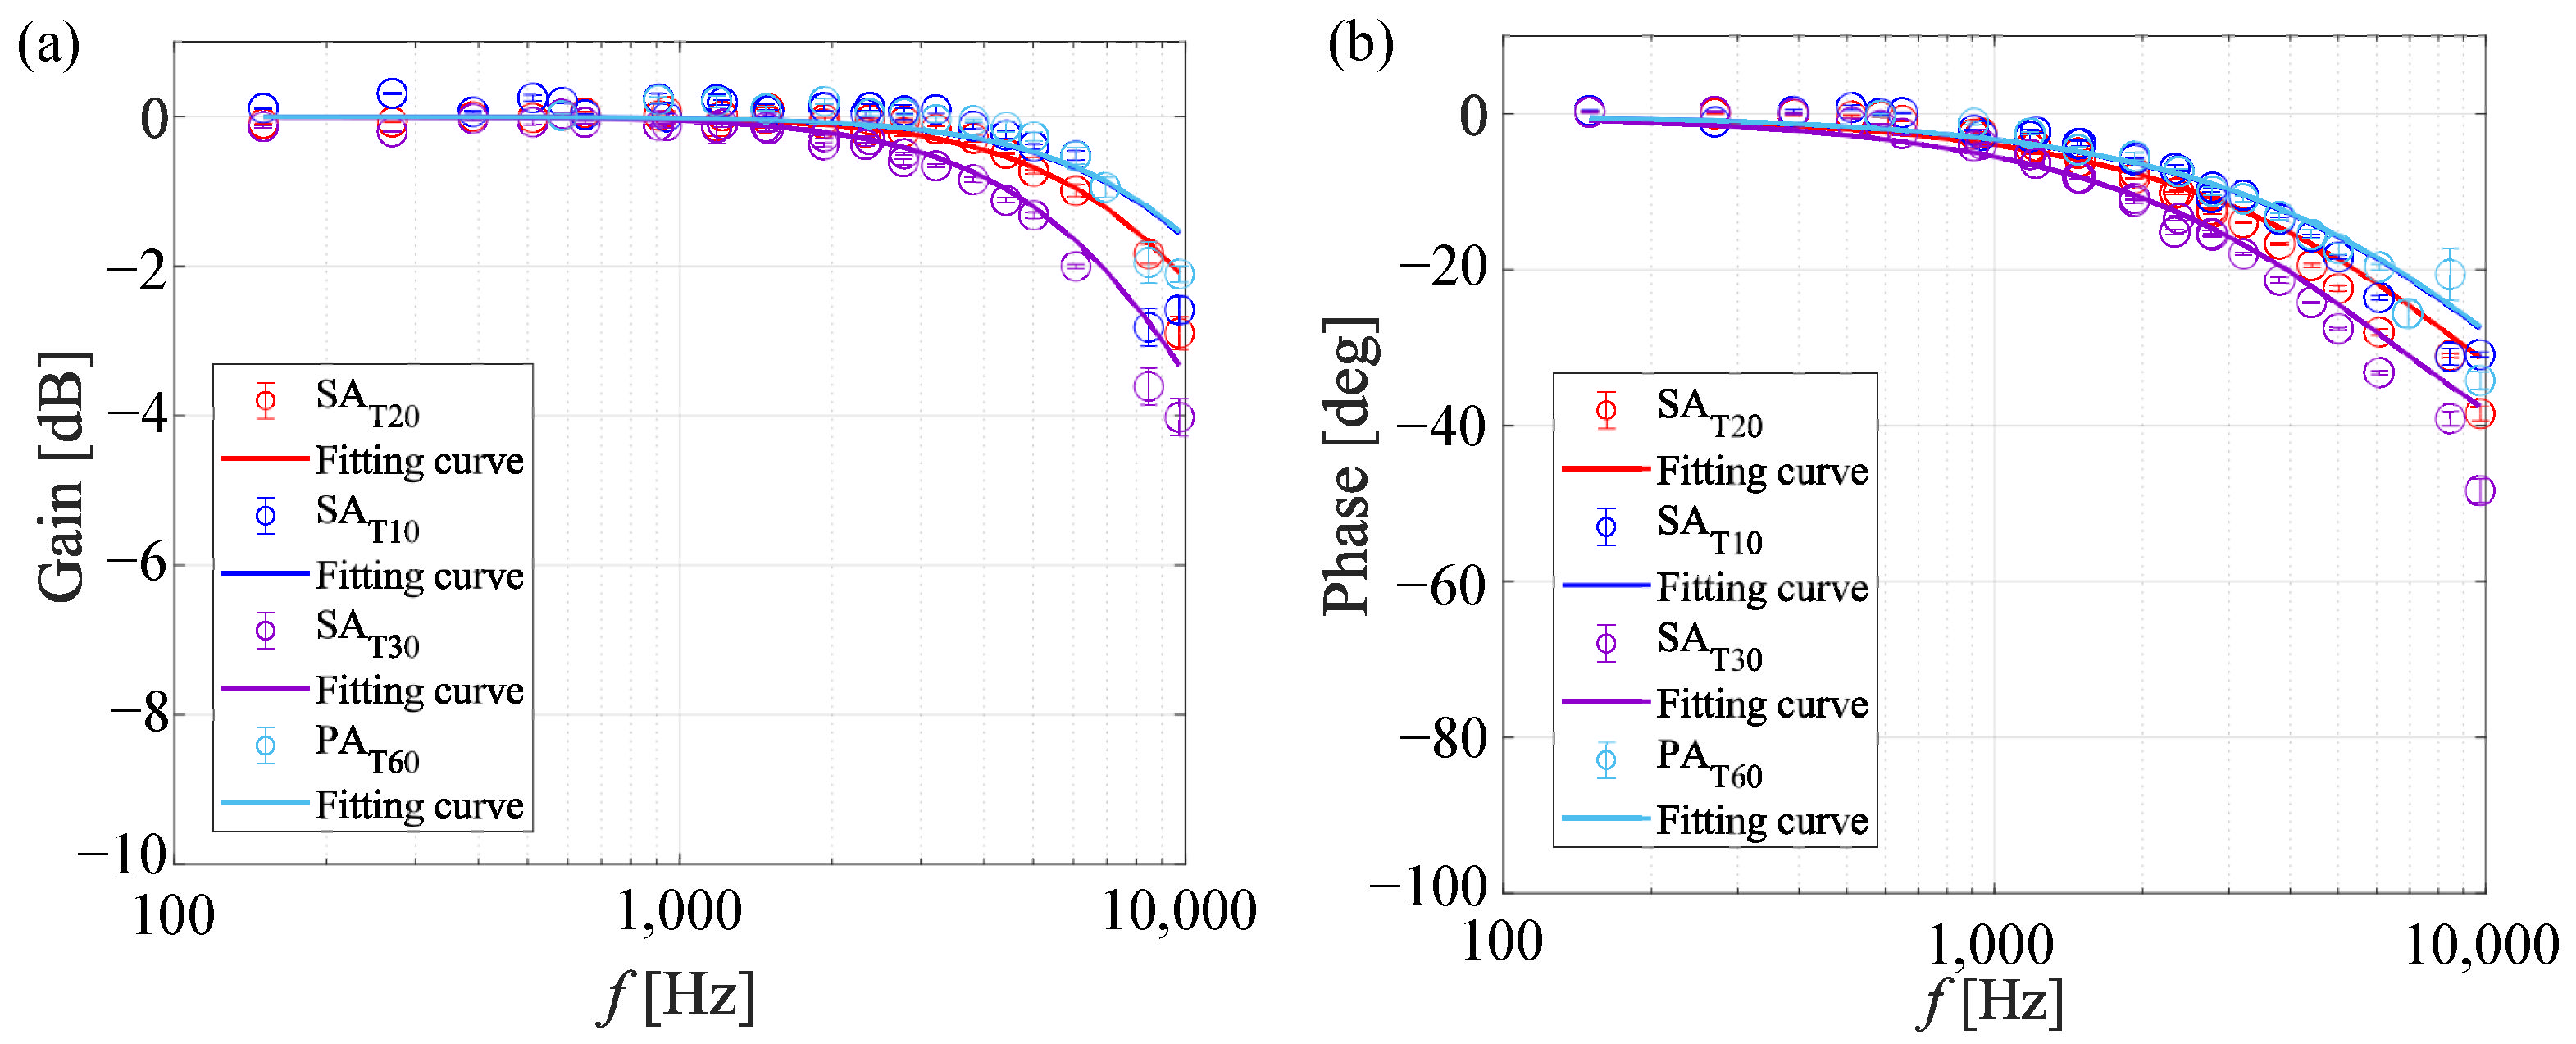
4.2.1. Resonance Tube
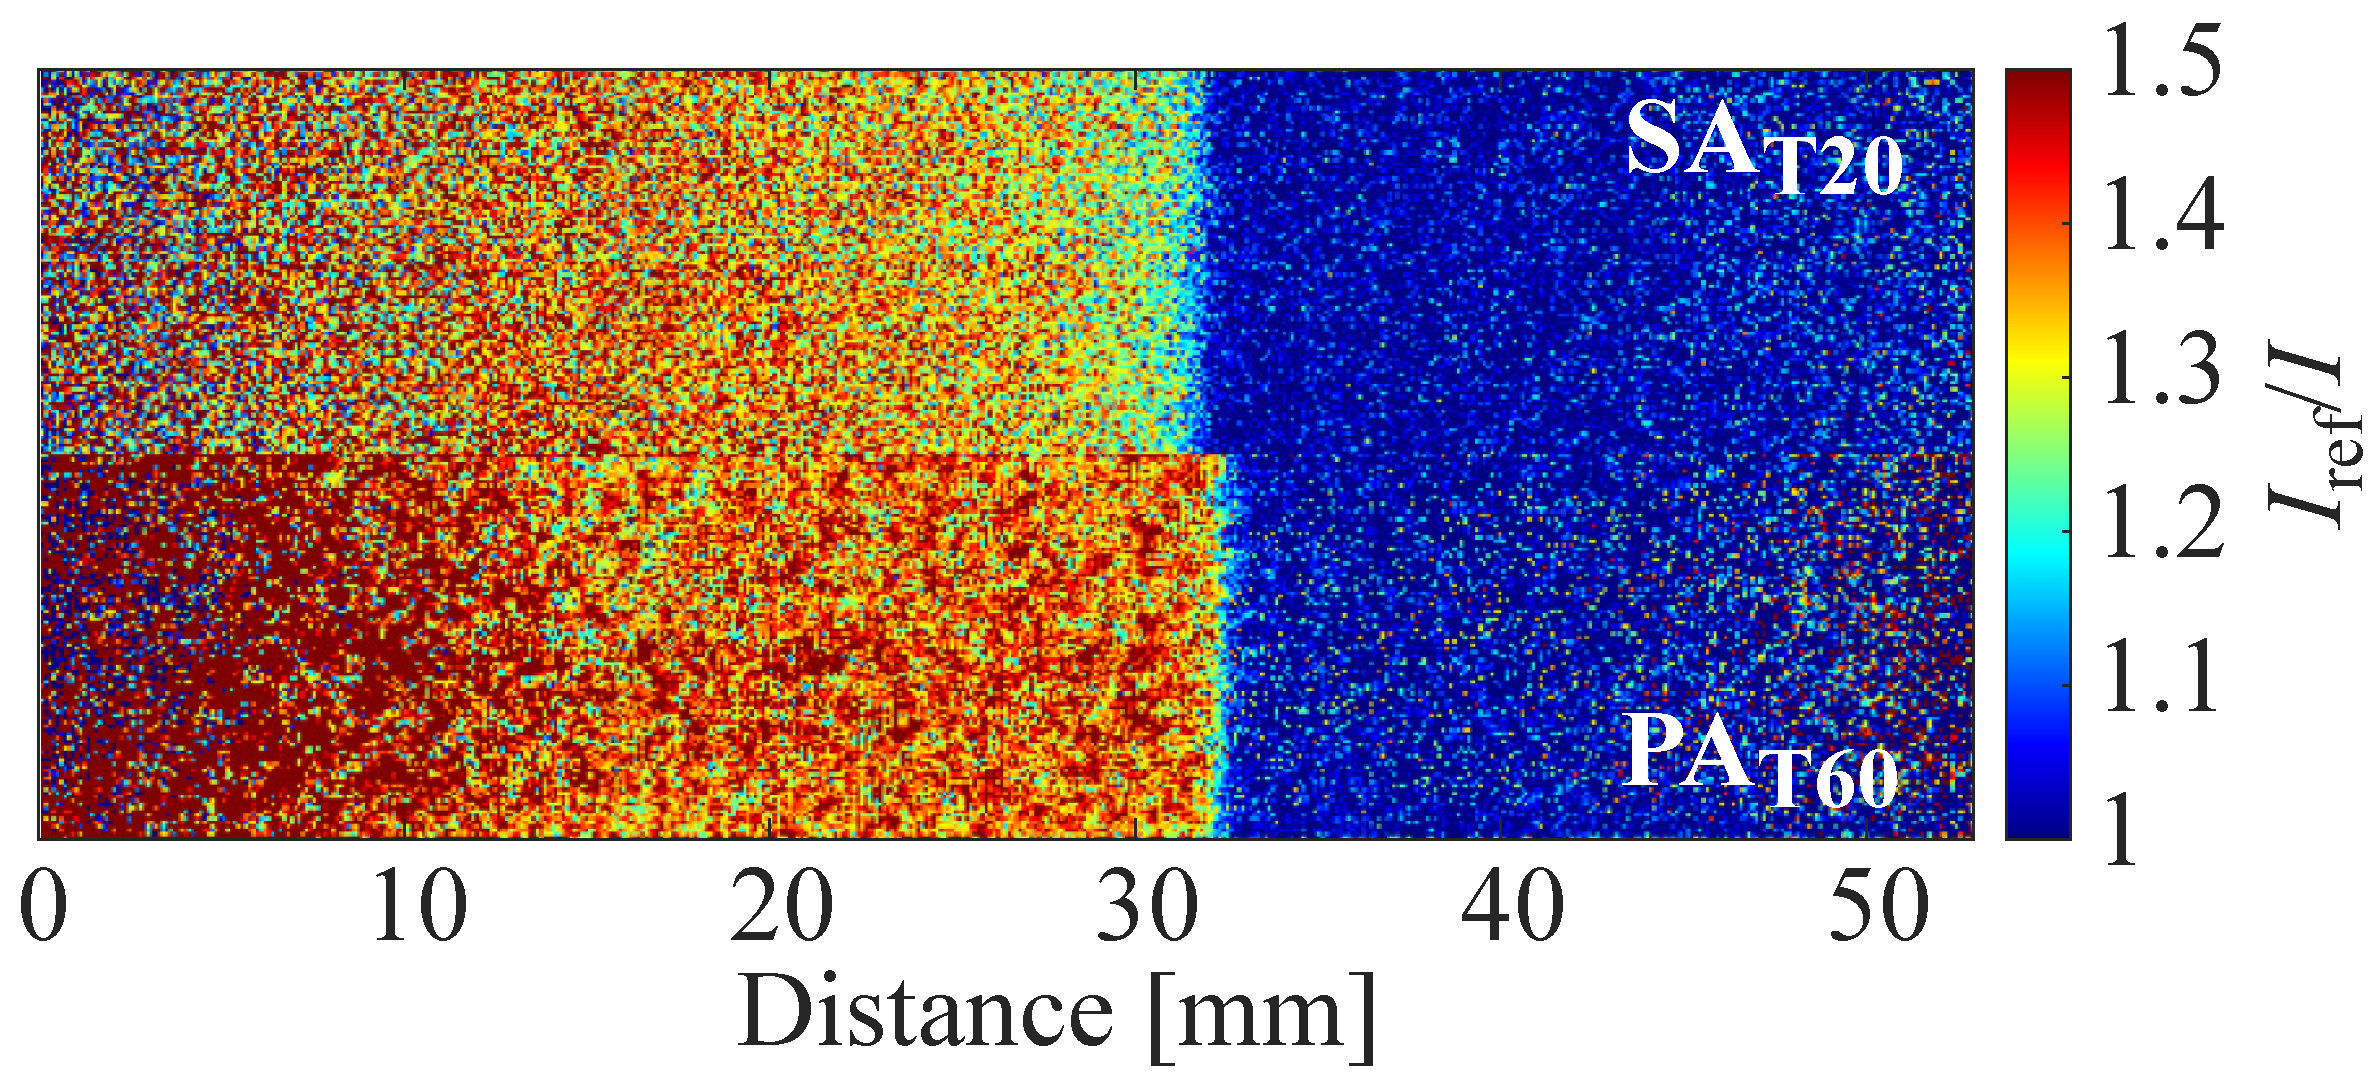
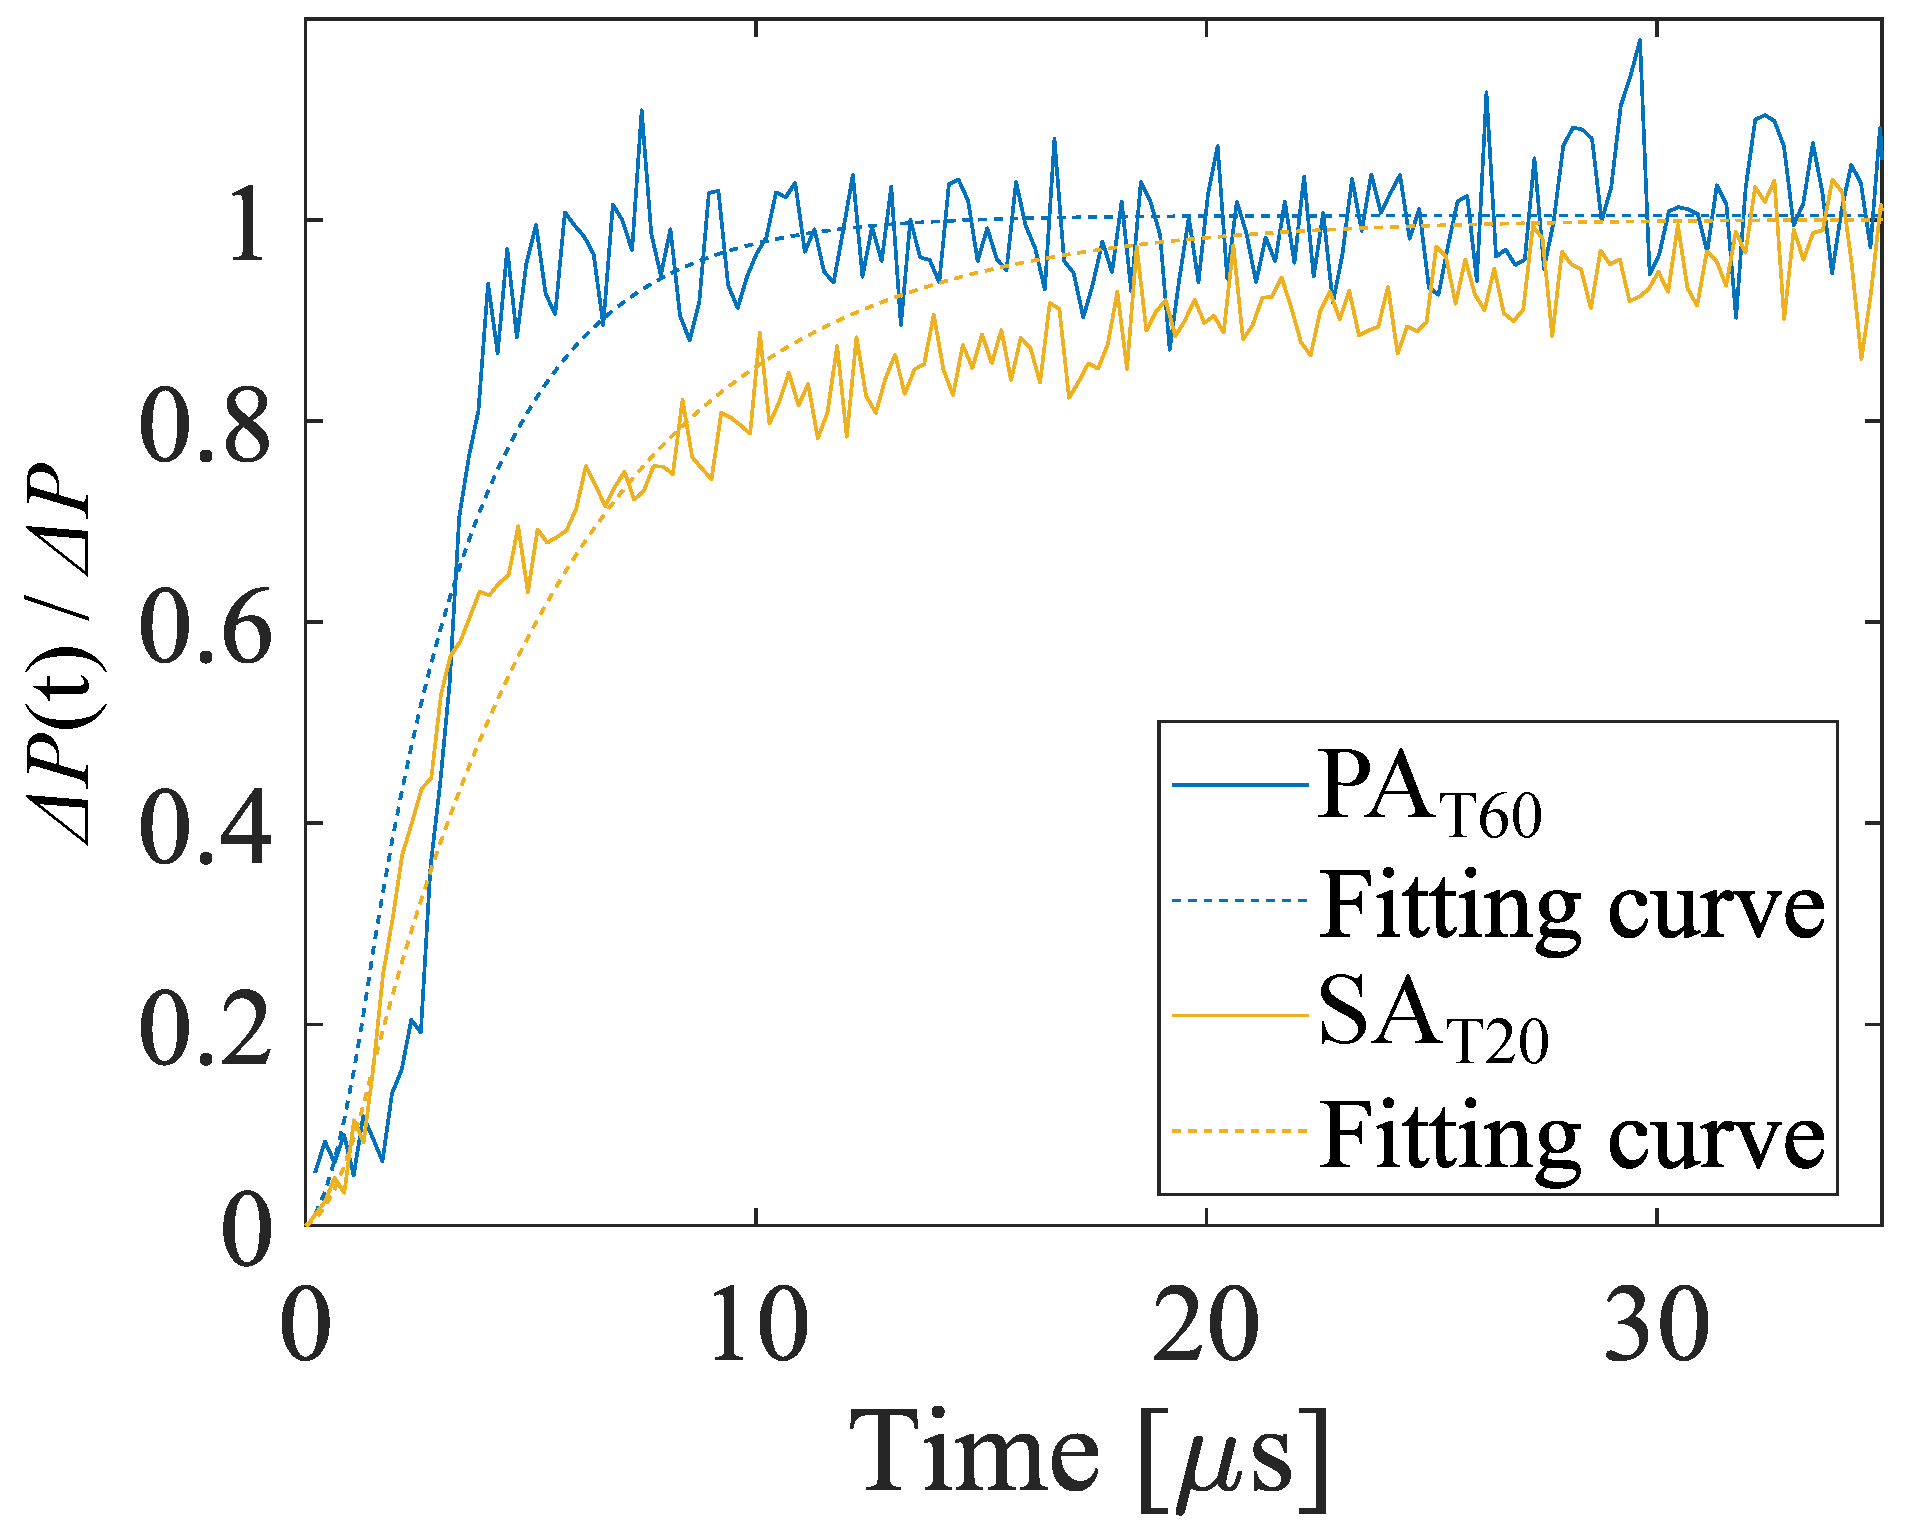
4.2.2. Shock Tube Experiment
5. Conclusions
Author Contributions
Funding
Institutional Review Board Statement
Informed Consent Statement
Data Availability Statement
Acknowledgments
Conflicts of Interest
References
- Liu, T.; Sullivan, J.P.; Asai, K.; Klein, C.; Egami, Y. Pressure and Temperature Sensitive Paints; Springer: Cham, Switzerland, 2021. [Google Scholar]
- Nakakita, K.; Takama, Y.; Imagawa, K.; Kato, H. Unsteady PSP measurement of transonic unsteady flow field around a rocket fairing model. In Proceedings of the 28th Aerodynamic Measurement Technology, Ground Testing, and Flight Testing Conference including the Aerospace T&E Days Forum, New Orleans, LA, USA, 25–28 June 2012; p. 2758. [Google Scholar]
- Merienne, M.C.; Le Sant, Y.; Lebrun, F.; Deleglise, B.; Sonnet, D. Transonic buffeting investigation using unsteady pressure-sensitive paint in a large wind tunnel. In Proceedings of the 51st AIAA Aerospace Sciences Meeting including the New Horizons Forum and Aerospace Exposition, Grapevine, TX, USA, 7–10 January 2013; p. 1136. [Google Scholar]
- Reese, D.; Peak, S.; Goodman, K.; Watkins, N. Implementation of an Unsteady PSP System in the NASA Transonic Dynamics Tunnel. In Proceedings of the AIAA AVIATION 2022 Forum, Chicago, IL, USA, 27 June–1 July 2022; p. 3784. [Google Scholar]
- Steimle, P.C.; Karhoff, D.C.; Schröder, W. Unsteady transonic flow over a transport-type swept wing. AIAA J. 2012, 50, 399–415. [Google Scholar] [CrossRef]
- Sugioka, Y.; Koike, S.; Nakakita, K.; Numata, D.; Nonomura, T.; Asai, K. Experimental analysis of transonic buffet on a 3D swept wing using fast-response pressure-sensitive paint. Exp. Fluids 2018, 59, 108. [Google Scholar] [CrossRef]
- Masini, L.; Timme, S.; Peace, A. Analysis of a civil aircraft wing transonic shock buffet experiment. J. Fluid Mech. 2020, 884. [Google Scholar] [CrossRef]
- Anyoji, M.; Numata, D.; Nagai, H.; Asai, K. Effects of Mach number and specific heat ratio on low-Reynolds-number airfoil flows. AIAA J. 2015, 53, 1640–1654. [Google Scholar] [CrossRef]
- Mangeol, E.; Ishiwaki, D.; Wallisky, N.; Asai, K.; Nonomura, T. Compressibility effects on flat-plates with serrated leading-edges at a low Reynolds number. Exp. Fluids 2017, 58, 1–15. [Google Scholar] [CrossRef]
- Herrero, A.G.; Noguchi, A.; Kusama, K.; Shigeta, T.; Nagata, T.; Nonomura, T.; Asai, K. Effects of compressibility and Reynolds number on the aerodynamics of a simplified corrugated airfoil. Exp. Fluids 2021, 62, 1–20. [Google Scholar]
- Watkins, A.N.; Leighty, B.D.; Lipford, W.E.; Wong, O.D.; Oglesby, D.M.; Ingram, J.L. Development of a pressure sensitive paint system for measuring global surface pressures on rotorcraft blades. In Proceedings of the 2007 22nd International Congress on Instrumentation in Aerospace Simulation Facilities, Pacific Grove, CA, USA, 10–14 June 2007; IEEE: Piscataway, NJ, USA, 2007; pp. 1–9. [Google Scholar]
- Watkins, A.N.; Leighty, B.D.; Lipford, W.E.; Goodman, K.Z.; Crafton, J.; Gregory, J.W. Measuring surface pressures on rotor blades using pressure-sensitive paint. AIAA J. 2016, 54, 206–215. [Google Scholar] [CrossRef]
- Peng, D.; Jiao, L.; Yu, Y.; Liu, Y.; Oshio, T.; Kawakubo, T.; Yakushiji, A. Single-shot lifetime-based PSP and TSP measurements on turbocharger compressor blades. Exp. Fluids 2017, 58, 127. [Google Scholar] [CrossRef]
- Weiss, A.; Geisler, R.; Schwermer, T.; Yorita, D.; Henne, U.; Klein, C.; Raffel, M. Single-shot pressure-sensitive paint lifetime measurements on fast rotating blades using an optimized double-shutter technique. Exp. Fluids 2017, 58, 120. [Google Scholar] [CrossRef]
- Weiss, A.; Geisler, R.; Müller, M.M.; Klein, C.; Henne, U.; Braukmann, J.N.; Letzgus, J. Dynamic-stall measurements using time-resolved pressure-sensitive paint on double-swept rotor blades. Exp. Fluids 2022, 63, 1–18. [Google Scholar] [CrossRef]
- Nagata, T.; Sato, H.; Okochi, M.; Matsuyama, T.; Sugioka, Y.; Kasai, M.; Kusama, K.; Numata, D.; Nonomura, T.; Asai, K. Visualization of Pressure and Skin-Friction Fields on Rotating Blade under Low-Pressure Conditions. AIAA J. 2022, 1–14. [Google Scholar] [CrossRef]
- Kurihara, D.; Claucherty, S.; Gonzales, J.; Sakaue, H.; Kiritani, H.; Fujita, K.; Nagai, H. Surface Pressure Measurements over a Free Flight Object in a Ballistic Range Facility using Two-Color Pressure-Sensitive Paint. In Proceedings of the AIAA Scitech 2020 Forum, Orlando, FL, USA, 6–10 January 2020; p. 0123. [Google Scholar]
- Gregory, J.; Asai, K.; Kameda, M.; Liu, T.; Sullivan, J. A review of pressure-sensitive paint for high-speed and unsteady aerodynamics. Proc. Inst. Mech. Eng. Part G 2008, 222, 249–290. [Google Scholar] [CrossRef]
- Gregory, J.W.; Sakaue, H.; Liu, T.; Sullivan, J.P. Fast pressure-sensitive paint for flow and acoustic diagnostics. Annu. Rev. Fluid Mech. 2014, 46, 303–330. [Google Scholar] [CrossRef]
- Peng, D.; Liu, Y. Fast pressure-sensitive paint for understanding complex flows: From regular to harsh environments. Exp. Fluids 2020, 61, 1–22. [Google Scholar] [CrossRef]
- Peng, D.; Wang, S.; Liu, Y. Fast PSP measurements of wall-pressure fluctuation in low-speed flows: Improvements using proper orthogonal decomposition. Exp. Fluids 2016, 57, 45. [Google Scholar] [CrossRef]
- Running, C.L.; Juliano, T.J. Global measurements of hypersonic shock-wave/boundary-layer interactions with pressure-sensitive paint. Exp. Fluids 2021, 62, 1–18. [Google Scholar] [CrossRef]
- Kameda, M.; Tezuka, N.; Hangai, T.; Asai, K.; Nakakita, K.; Amao, Y. Adsorptive pressure-sensitive coatings on porous anodized aluminium. Meas. Sci. Technol. 2004, 15, 489. [Google Scholar] [CrossRef]
- Kasai, M.; Sasaki, D.; Nagata, T.; Nonomura, T.; Asai, K. Frequency response of pressure-sensitive paints under low-pressure conditions. Sensors 2021, 21, 3187. [Google Scholar] [CrossRef]
- Ponomarev, S.; Gouterman, M. Fast responding pressure sensitive paints based on high concentration of hard particles in polymer. In Proceedings of the 6th Annual Pressure-Sensitive Paint Workshop, Boeing, Seattle, WA, USA, 6–8 October 1998; The Boeing Co.: Seattle, WA, USA, 1998; pp. 31–41. [Google Scholar]
- Scroggin, A.; Slamovich, E.; Crafton, J.; Lachendro, N.; Sullivan, J. Porous polymer/ceramic composites for luminescence-based temperature and pressure measurement. MRS Online Proc. Libr. Arch. 1999, 560. [Google Scholar] [CrossRef]
- Gregory, J.W.; Sakaue, H.; Sullivan, J.P.; Raghu, S. Characterization of miniature fluidic oscillator flowfields using porous pressure sensitive paint. In Proceedings of the ASME Fluids Engineering Division Summer Meeting, New Orleans, LA, USA, 29 May 2001. [Google Scholar]
- Sugioka, Y.; Arakida, K.; Kasai, M.; Nonomura, T.; Asai, K.; Egami, Y.; Nakakita, K. Evaluation of the characteristics and coating film structure of polymer/ceramic pressure-sensitive paint. Sensors 2018, 18, 4041. [Google Scholar] [CrossRef]
- Peng, D.; Gu, F.; Li, Y.; Liu, Y. A novel sprayable fast-responding pressure-sensitive paint based on mesoporous silicone dioxide particles. Sens. Actuators A Phys. 2018, 279, 390–398. [Google Scholar] [CrossRef]
- Egami, Y.; Hasegawa, Y.; Matsuda, Y.; Ikami, T.; Nagai, H. Ruthenium-based fast-responding pressure-sensitive paint for measuring small pressure fluctuation in low-speed flow field. Meas. Sci. Technol. 2020, 32, 024003. [Google Scholar] [CrossRef]
- Peng, D.; Jiao, L.; Sun, Z.; Gu, Y.; Liu, Y. Simultaneous PSP and TSP measurements of transient flow in a long-duration hypersonic tunnel. Exp. Fluids 2016, 57, 1–16. [Google Scholar] [CrossRef]
- Asai, K.; Kanda, H.; Cunningham, C.T.; Erausquin, R.; Sullivan, J.P. Surface pressure measurement in a cryogenic wind tunnel by using luminescent coating. In Proceedings of the ICIASF’97 Record—Instrumentation in Aerospace Simulation Facilities, Pacific Grove, CA, USA, 29 September–2 October 1997; IEEE: Piscataway, NJ, USA, 1997; pp. 105–114. [Google Scholar]
- Sakaue, H.; Sullivan, J.P.; Asai, K.; Iijima, Y.; Kunimasu, T. Anodized aluminum pressure sensitive paint in a cryogenic wind tunnel. In Proceedings of the 45th International Instrumentation Symposium, Albuquerque, NM, USA, 2–6 May 1999; pp. 337–346. [Google Scholar]
- Sakaue, H.; Ishii, K. Optimization of anodized-aluminum pressure-sensitive paint by controlling luminophore concentration. Sensors 2010, 10, 6836–6847. [Google Scholar] [CrossRef] [PubMed]
- Nagata, T.; Noguchi, A.; Kusama, K.; Nonomura, T.; Komuro, A.; Ando, A.; Asai, K. Experimental investigation on compressible flow over a circular cylinder at Reynolds number of between 1000 and 5000. J. Fluid Mech. 2020, 893, A13. [Google Scholar] [CrossRef]
- Sakaue, H.; Miyamoto, K.; Miyazaki, T. A motion-capturing pressure-sensitive paint method. J. Appl. Phys. 2013, 113, 084901. [Google Scholar] [CrossRef]
- Egami, Y.; Asai, K. Effects of antioxidants on photodegradation of porous pressure-sensitive paint. In Proceedings of the 22nd AIAA Aerodynamic Measurement Technology and Ground Testing Conference, St. Louis, MO, USA, 24–26 June 2002; p. 2905. [Google Scholar]
- Numata, D.; Fujii, S.; Nagai, H.; Asai, K. Ultrafast-response anodized-aluminum pressure-sensitive paints for unsteady flow measurement. AIAA J. 2017, 55, 1118–1125. [Google Scholar] [CrossRef]
- Yomo, K.; Ikami, T.; Fujita, K.; Nagai, H. Investigation of Formulations on Pyrene-Based Anodized-Aluminum Pressure-Sensitive Paints for Supersonic Phenomena. Sensors 2022, 22, 4430. [Google Scholar] [CrossRef]
- Basu, B.J.; Anandan, C.; Rajam, K. Study of the mechanism of degradation of pyrene-based pressure sensitive paints. Sens. Actuators B Chem. 2003, 94, 257–266. [Google Scholar] [CrossRef]
- Amao, Y.; Okura, I. An oxygen sensing system based on the phosphorescence quenching of metalloporphyrin thin film on alumina plates. Analyst 2000, 125, 1601–1604. [Google Scholar] [CrossRef]
- Takeuchi, Y.; Amao, Y. Materials for luminescent pressure-sensitive paint. In Frontiers in Chemical Sensors; Springer: Cham, Switzerland, 2005; pp. 303–322. [Google Scholar]
- Handa, T.; Masuda, M.; Matsuo, K.; Matsumoto, M. Temperature Dependency and Time-Response Characteristics of Pressure Sensitive Paint. Trans. Jpn. Soc. Mech. Eng. B 2002, 68, 1384–1390. (In Japanese) [Google Scholar] [CrossRef][Green Version]
- Sakaue, H.; Sullivan, J.P. Time response of anodized aluminum pressure-sensitive paint. AIAA J. 2001, 39, 1944–1949. [Google Scholar] [CrossRef]
- Winslow, N.A.; Carroll, B.F.; Kurdila, A.J. Model development and analysis of the dynamics of pressure-sensitive paints. AIAA J. 2001, 39, 660–666. [Google Scholar] [CrossRef]
- Kameda, M.; Tabei, T.; Nakakita, K.; Sakaue, H.; Asai, K. Image measurements of unsteady pressure fluctuation by a pressure-sensitive coating on porous anodized aluminium. Meas. Sci. Technol. 2005, 16, 2517. [Google Scholar] [CrossRef]
- Sakaue, H. Luminophore application method of anodized aluminum pressure sensitive paint as a fast responding global pressure sensor. Rev. Sci. Instrum. 2005, 76, 084101. [Google Scholar] [CrossRef]
- Sugimoto, T.; Sugioka, Y.; Numata, D.; Nagai, H.; Asai, K. Characterization of frequency response of pressure-sensitive paints. AIAA J. 2017, 55, 1460–1464. [Google Scholar] [CrossRef]
- Nonomura, T.; Asai, K. Simple Estimation of Frequency Response of Two-layer Pressure-sensitive-paint Model. Trans. Jpn. Soc. Aeronaut. Space Sci. 2019, 62, 112–115. [Google Scholar] [CrossRef]
- Meguro, T.; Takayama, K.; Onodera, O. Three-dimensional shock wave reflection over a corner of two intersecting wedges. Shock Waves 1997, 7, 107–121. [Google Scholar] [CrossRef]
- Sakaue, H.; Tabei, T.; Kameda, M. Hydrophobic monolayer coating on anodized aluminum pressure-sensitive paint. Sens. Actuators B Chem. 2006, 119, 504–511. [Google Scholar] [CrossRef]
- Brewer, K.J.; Murphy, W.R., Jr.; Spurlin, S.R.; Petersen, J.D. The next generation of (polyazine) ruthenium (II) complexes. Inorg. Chem. 1986, 25, 882–884. [Google Scholar] [CrossRef]
- Bell, J.H.; Schairer, E.T.; Hand, L.A.; Mehta, R.D. Surface pressure measurements using luminescent coatings. Annu. Rev. Fluid Mech. 2001, 33, 155–206. [Google Scholar] [CrossRef]
- Sakaue, H.; Morita, K.; Iijima, Y.; Sakamura, Y. Response time scales of anodized-aluminum pressure-sensitive paints. Sens. Actuators A Phys. 2013, 199, 74–79. [Google Scholar] [CrossRef]
- Kurihara, D.; Sakaue, H. Dynamic Response Model Development for Pressure-Sensitive Paint (PSP). In Proceedings of the AIAA Scitech 2021 Forum, Virtual, 11–21 January 2021; p. 0125. [Google Scholar]


| Sample Name | |||||||||
|---|---|---|---|---|---|---|---|---|---|
| Electrolyte | Sulfuric acid | Phosphoric acid | |||||||
| Pores diameter (nm) | 20–100 | 165 | |||||||
| Anodization time (min) | 20 | 10 | 20 | 30 | 20 | 20 | 20 | 30 | 60 |
| Layer thickness (µm) | 4.9 | 1.7 | 4.9 | 8.5 | 4.9 | 4.9 | 4 | 4.9 | 9.8 |
| Luminophore | Ru(dpp)3 | ||||||||
| Luminophore concentration (mM *) | 0.1 | 0.01 | 0.9 | 0.1 | |||||
| Sample | ||||||||
|---|---|---|---|---|---|---|---|---|
| 0.437 | 0.499 | 0.544 | 0.505 | 0.485 | 0.331 | 0.377 | 0.505 | |
| 1.461 | 0.526 | 0.815 | 0.726 | 0.774 | 0.104 | 0.072 | 0.091 | |
| Sample | ||||||||
|---|---|---|---|---|---|---|---|---|
| 0.010 | 0.051 | −0.009 | 0.062 | 0.066 | 0.146 | 0.152 | 0.034 | |
| 1,000,000 | 0.93 | 1.07 | 1.31 | 1.26 | 1.28 | 1.59 | 1.77 | 1.29 |
| 2,000,000 | 0.57 | 0.63 | 0.87 | 0.78 | 0.77 | 1.04 | 1.12 | 0.81 |
| Sample No. | ||||
|---|---|---|---|---|
| 0.482 | 0.644 | 0.520 | 0.624 | |
| 9.32 × | 2.35 × | 0.839 | 0.125 | |
| Signal intensity | 1 | 0.81 | 1 | 0.80 |
| Sample | ||||
|---|---|---|---|---|
| Estimated cut-off frequency (kHz) | 15.0 | 12.5 | 9.0 | 15.2 |
| Diffusion coefficient (m/s) | ||||
| Theoretical diffusion coefficient (m/s) |
| Sample | Mach Number of Normal Shock Wave | The Time Constant (µs) | The 90% Rise Time (µs) |
|---|---|---|---|
| 1.41 | 4.87 | 11.2 | |
| 1.63 | 2.60 | 5.99 |
Publisher’s Note: MDPI stays neutral with regard to jurisdictional claims in published maps and institutional affiliations. |
© 2022 by the authors. Licensee MDPI, Basel, Switzerland. This article is an open access article distributed under the terms and conditions of the Creative Commons Attribution (CC BY) license (https://creativecommons.org/licenses/by/4.0/).
Share and Cite
Oka, Y.; Nagata, T.; Kasai, M.; Ozawa, Y.; Asai, K.; Nonomura, T. Practical Fast-Response Anodized-Aluminum Pressure-Sensitive Paint Using Chemical Adsorption Luminophore as Optical Unsteady Pressure Sensor. Sensors 2022, 22, 6401. https://doi.org/10.3390/s22176401
Oka Y, Nagata T, Kasai M, Ozawa Y, Asai K, Nonomura T. Practical Fast-Response Anodized-Aluminum Pressure-Sensitive Paint Using Chemical Adsorption Luminophore as Optical Unsteady Pressure Sensor. Sensors. 2022; 22(17):6401. https://doi.org/10.3390/s22176401
Chicago/Turabian StyleOka, Yoshinori, Takayuki Nagata, Miku Kasai, Yuta Ozawa, Keisuke Asai, and Taku Nonomura. 2022. "Practical Fast-Response Anodized-Aluminum Pressure-Sensitive Paint Using Chemical Adsorption Luminophore as Optical Unsteady Pressure Sensor" Sensors 22, no. 17: 6401. https://doi.org/10.3390/s22176401
APA StyleOka, Y., Nagata, T., Kasai, M., Ozawa, Y., Asai, K., & Nonomura, T. (2022). Practical Fast-Response Anodized-Aluminum Pressure-Sensitive Paint Using Chemical Adsorption Luminophore as Optical Unsteady Pressure Sensor. Sensors, 22(17), 6401. https://doi.org/10.3390/s22176401