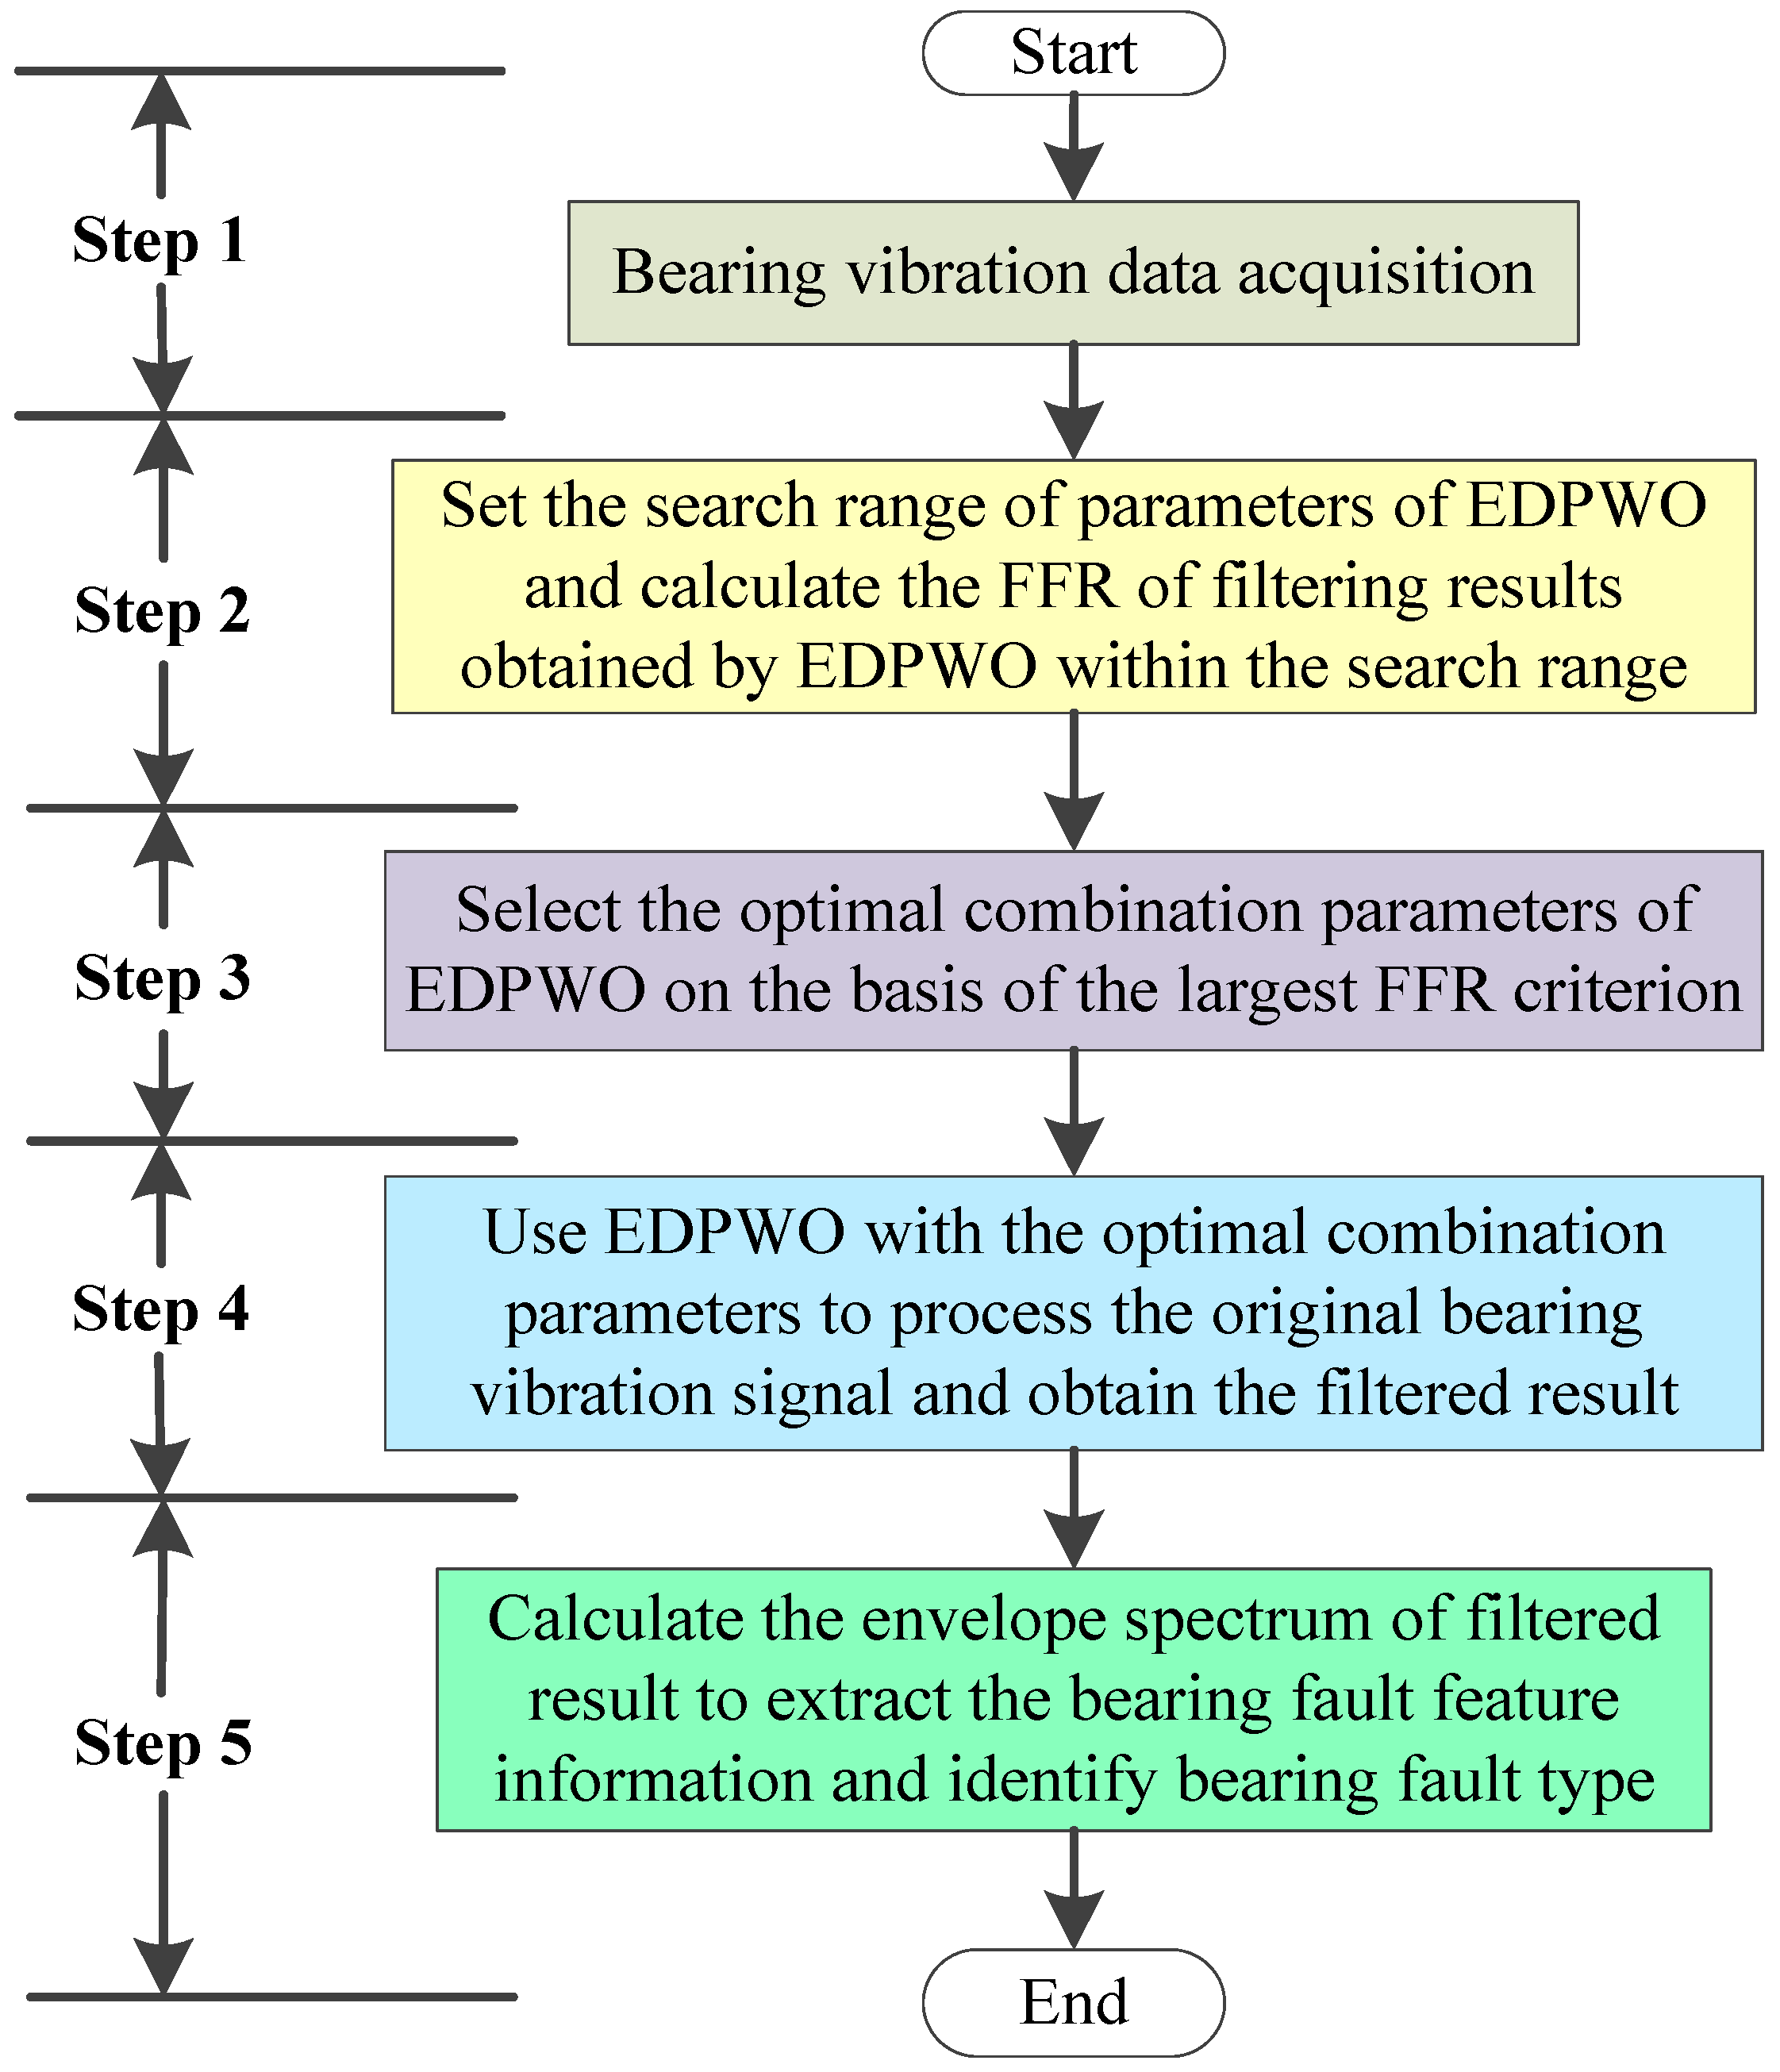
Figure 1.
The flow chart of the proposed method for bearing fault feature extraction.
Figure 1.
The flow chart of the proposed method for bearing fault feature extraction.
Figure 2.
Bearing fault simulation signal: (a) Time domain waveform; (b) amplitude spectrum; (c) envelope spectrum.
Figure 2.
Bearing fault simulation signal: (a) Time domain waveform; (b) amplitude spectrum; (c) envelope spectrum.
Figure 3.
Analysis results obtained by the proposed method for simulation signal: (a) Time domain waveform; (b) amplitude spectrum; (c) envelope spectrum.
Figure 3.
Analysis results obtained by the proposed method for simulation signal: (a) Time domain waveform; (b) amplitude spectrum; (c) envelope spectrum.
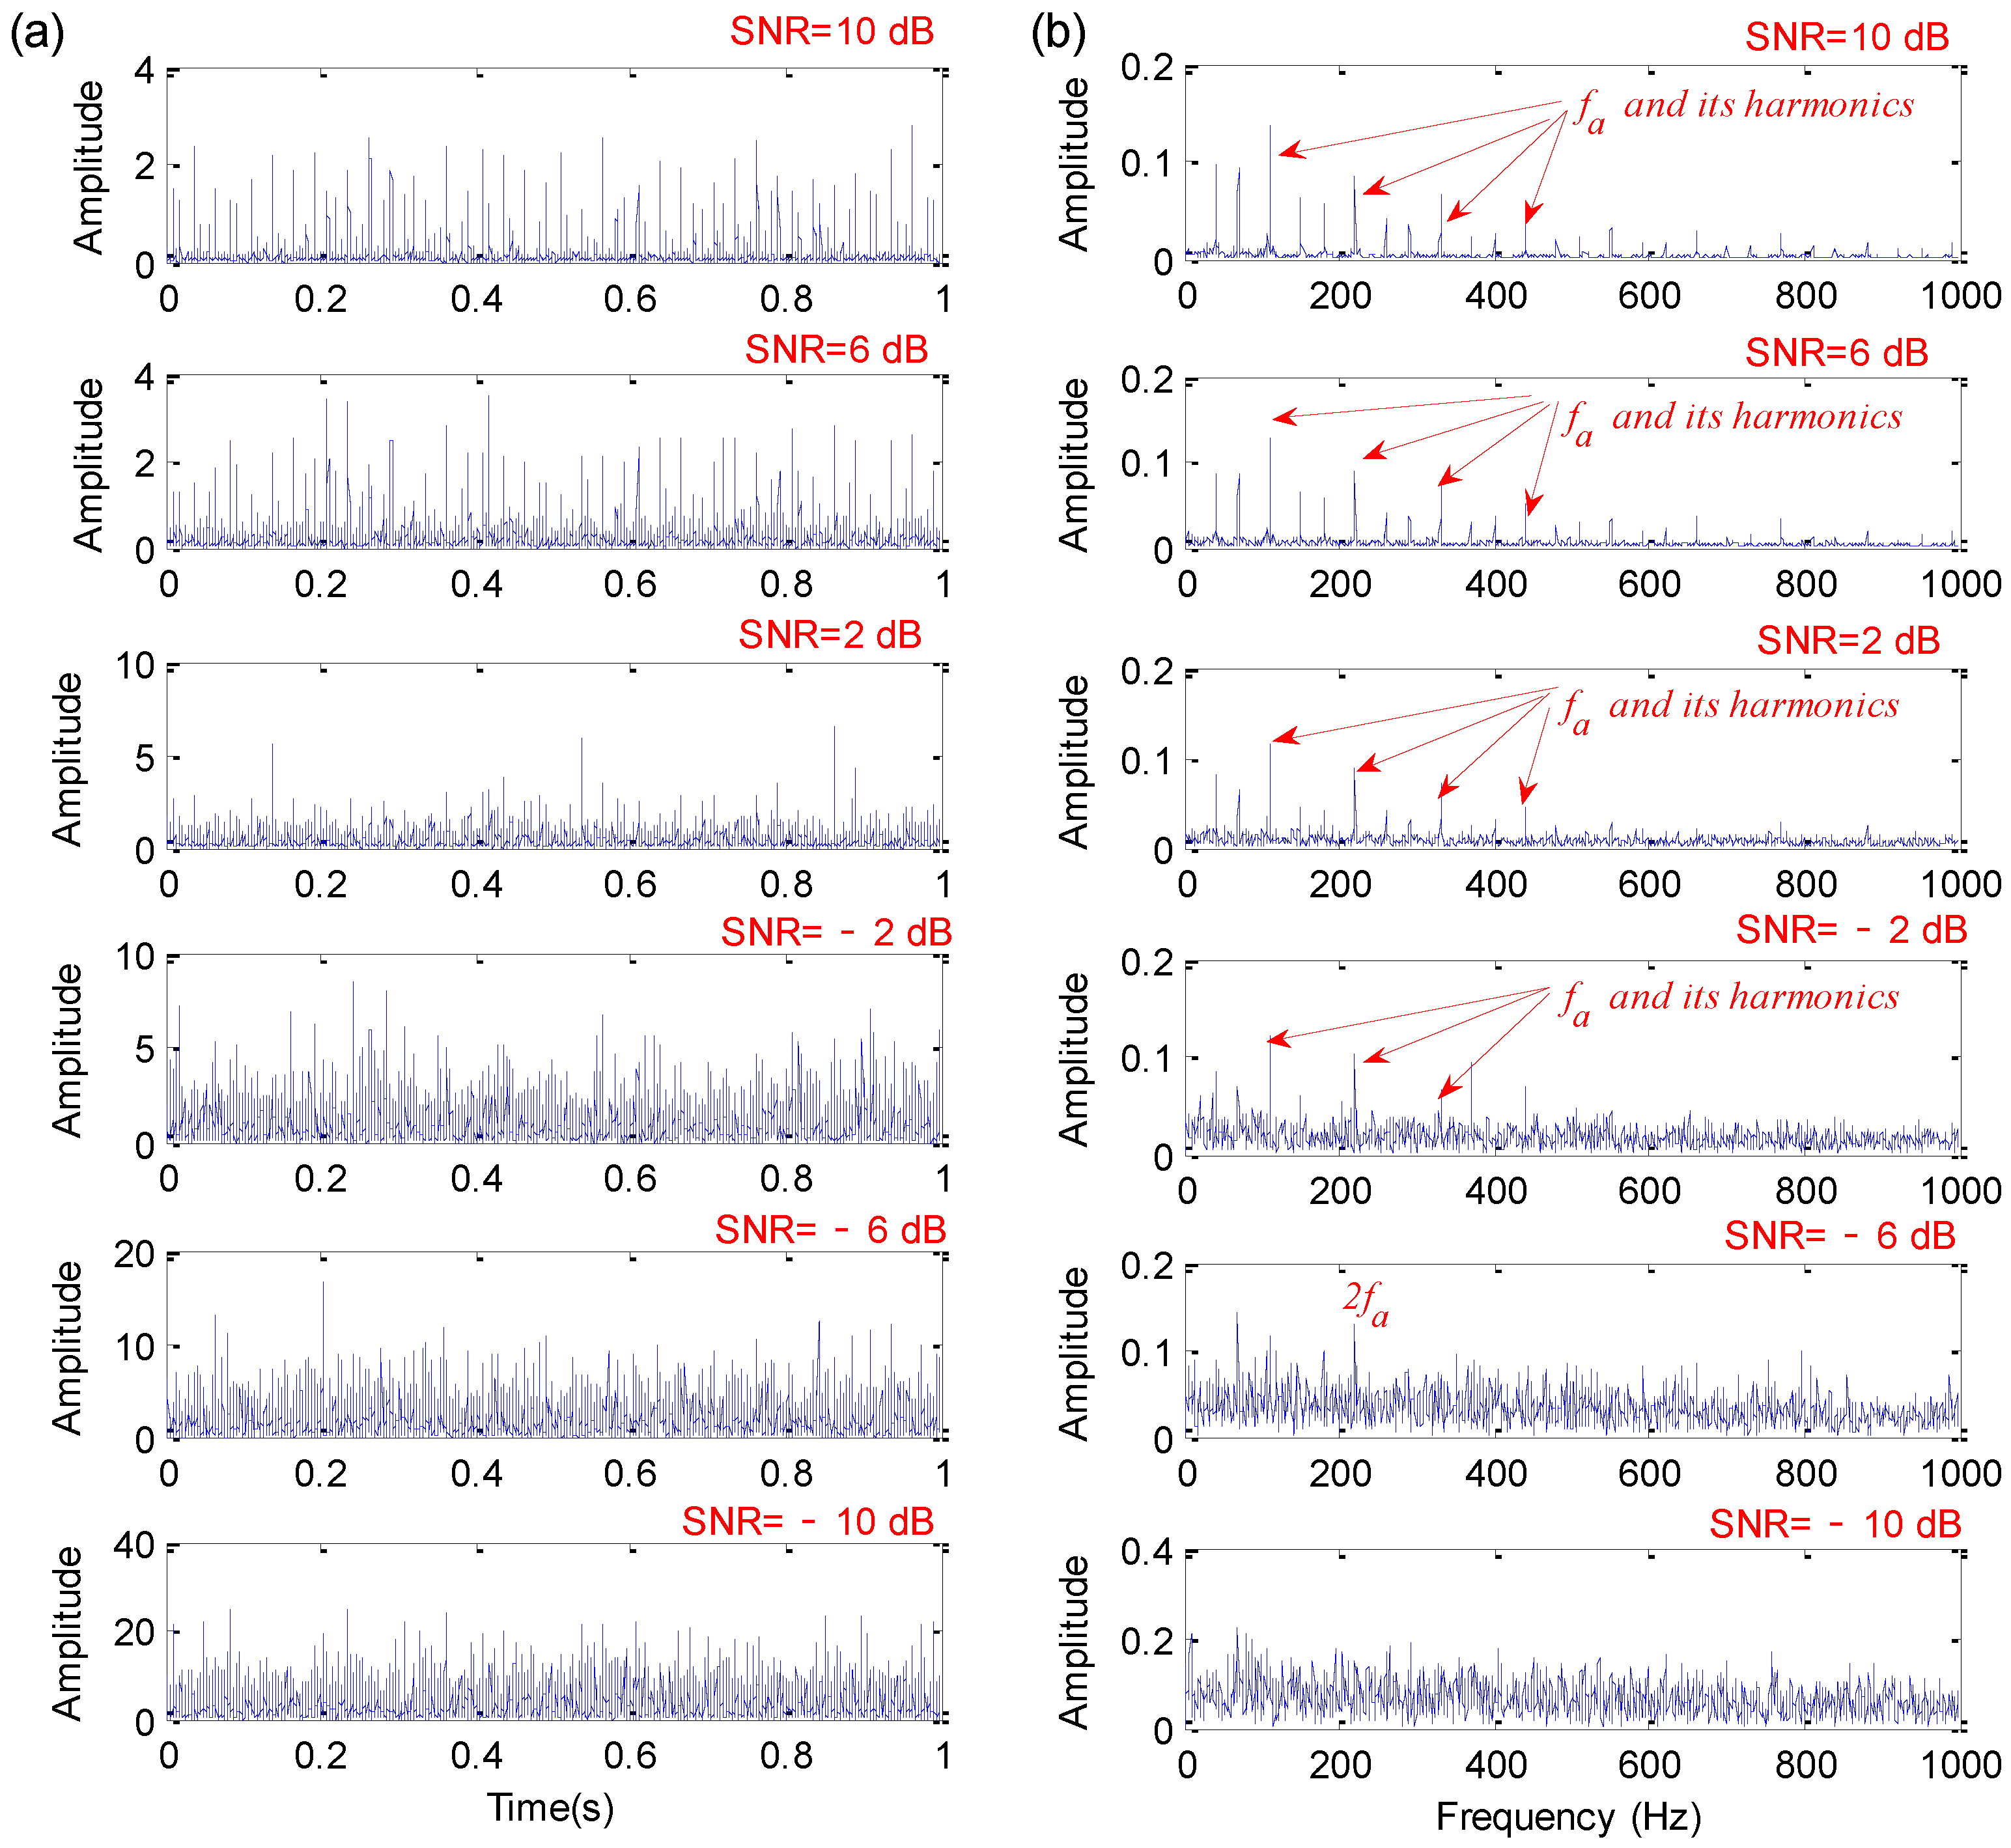
Figure 4.
Qualitative analysis results obtained by the proposed method with six levels of noise: (a) Time domain waveform; (b) envelope spectrum.
Figure 4.
Qualitative analysis results obtained by the proposed method with six levels of noise: (a) Time domain waveform; (b) envelope spectrum.
Figure 5.
Quantitative analysis results obtained by the proposed method with increasing levels of noise: (a) FFR curve; (b) kurtosis curve.
Figure 5.
Quantitative analysis results obtained by the proposed method with increasing levels of noise: (a) FFR curve; (b) kurtosis curve.
Figure 6.
Analysis results obtained by AVG method for simulation signal: (a) Time domain waveform; (b) amplitude spectrum; (c) envelope spectrum.
Figure 6.
Analysis results obtained by AVG method for simulation signal: (a) Time domain waveform; (b) amplitude spectrum; (c) envelope spectrum.
Figure 7.
Analysis results obtained by STH method for simulation signal: (a) Time domain waveform; (b) amplitude spectrum; (c) envelope spectrum.
Figure 7.
Analysis results obtained by STH method for simulation signal: (a) Time domain waveform; (b) amplitude spectrum; (c) envelope spectrum.
Figure 8.
Analysis results obtained by EMDF method for simulation signal: (a) Time domain waveform; (b) amplitude spectrum; (c) envelope spectrum.
Figure 8.
Analysis results obtained by EMDF method for simulation signal: (a) Time domain waveform; (b) amplitude spectrum; (c) envelope spectrum.
Figure 9.
Analysis results obtained by the Butterworth filter for simulation signal: (a) Time domain waveform; (b) amplitude spectrum; (c) envelope spectrum.
Figure 9.
Analysis results obtained by the Butterworth filter for simulation signal: (a) Time domain waveform; (b) amplitude spectrum; (c) envelope spectrum.
Figure 10.
Filtering properties of two methods: (a) Proposed EDPWO; (b) the Butterworth filter.
Figure 10.
Filtering properties of two methods: (a) Proposed EDPWO; (b) the Butterworth filter.
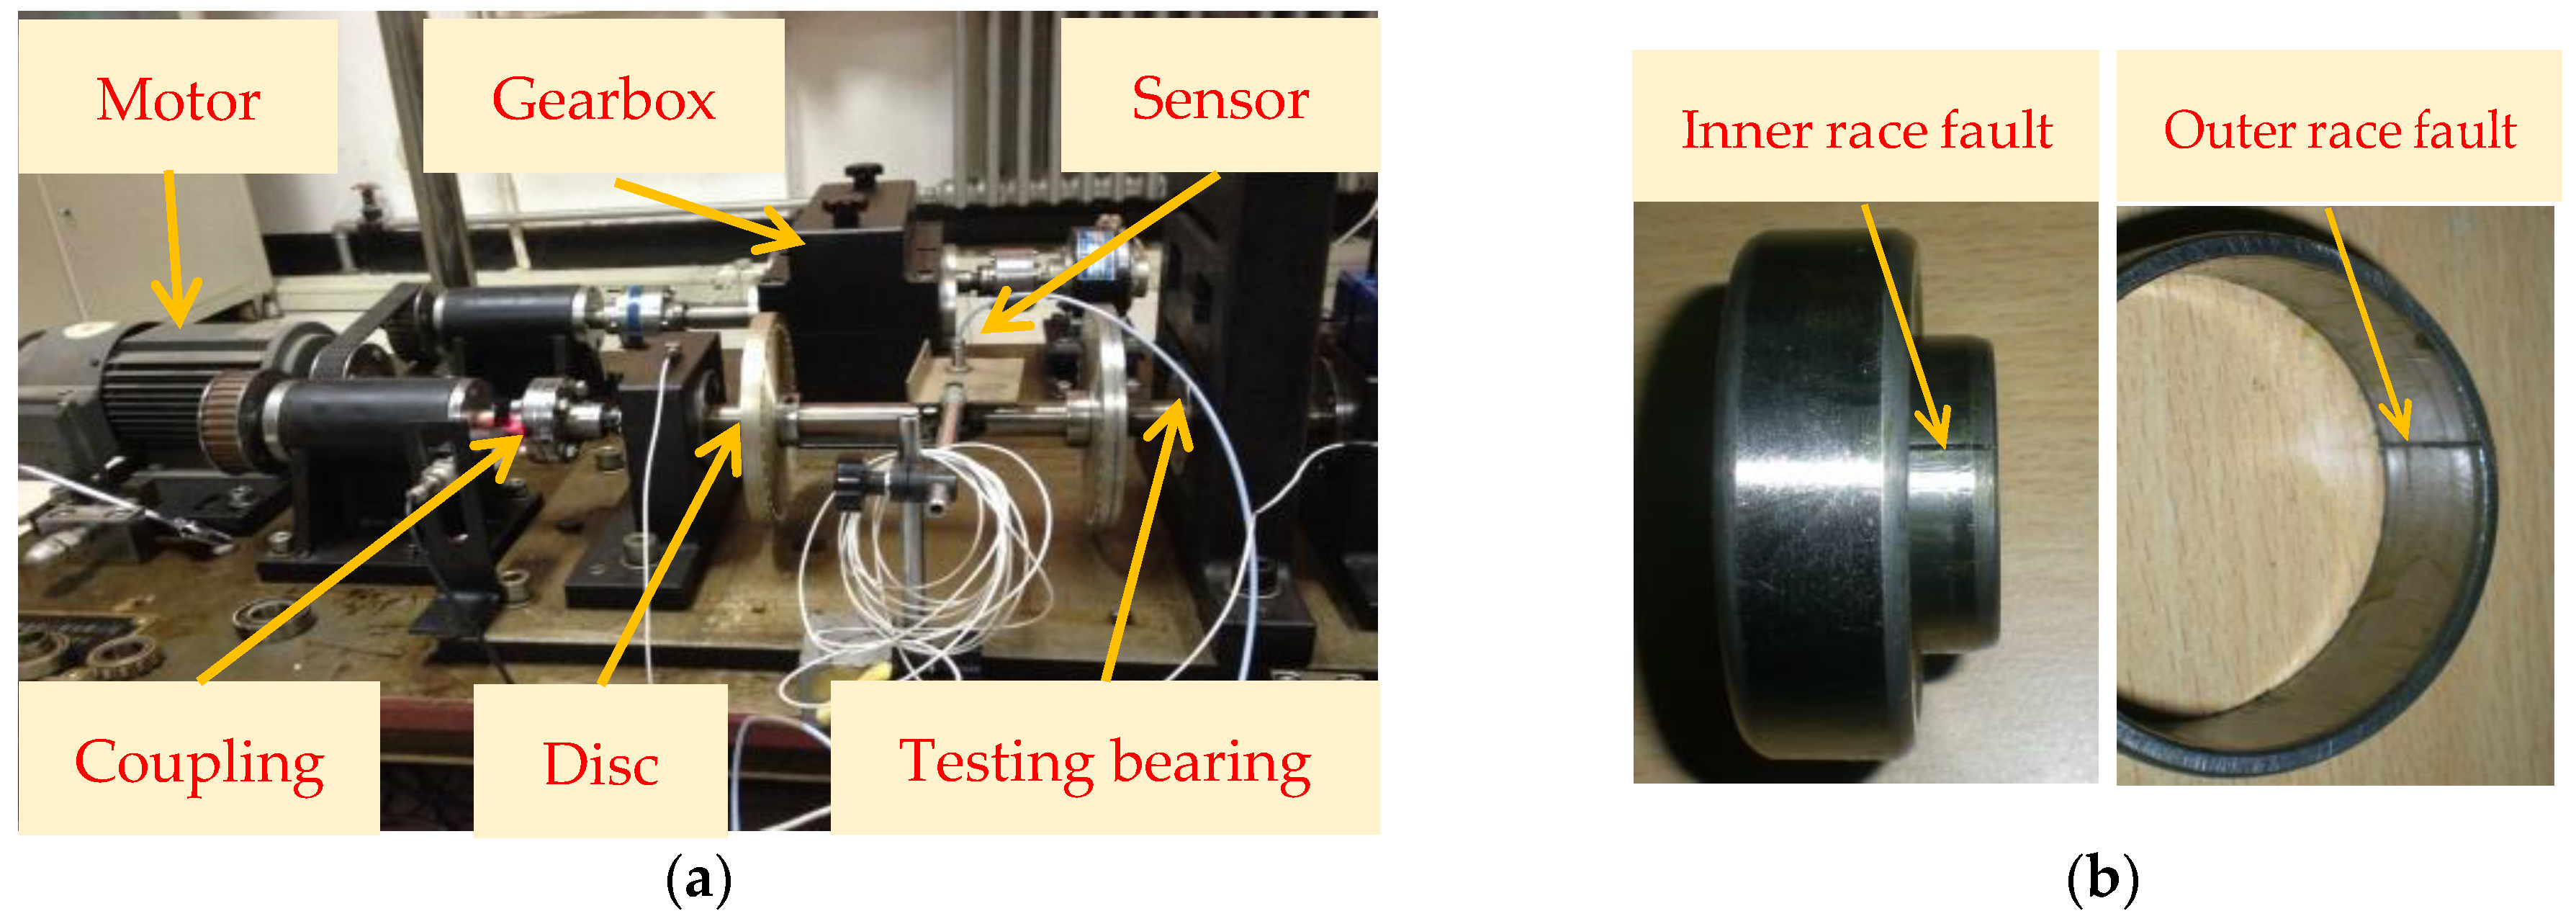
Figure 11.
(a) Experimental platform; (b) the faulty bearing.
Figure 11.
(a) Experimental platform; (b) the faulty bearing.
Figure 12.
Bearing outer race fault signal: (a) Time domain waveform; (b) amplitude spectrum; (c) envelope spectrum.
Figure 12.
Bearing outer race fault signal: (a) Time domain waveform; (b) amplitude spectrum; (c) envelope spectrum.
Figure 13.
Analysis results obtained by the proposed method for bearing outer race fault signal: (a) Time domain waveform; (b) amplitude spectrum; (c) envelope spectrum.
Figure 13.
Analysis results obtained by the proposed method for bearing outer race fault signal: (a) Time domain waveform; (b) amplitude spectrum; (c) envelope spectrum.
Figure 14.
Bearing inner race fault signal: (a) Time domain waveform; (b) amplitude spectrum; (c) envelope spectrum.
Figure 14.
Bearing inner race fault signal: (a) Time domain waveform; (b) amplitude spectrum; (c) envelope spectrum.
Figure 15.
Analysis results obtained by the proposed method for bearing inner race fault signal: (a) Time domain waveform; (b) amplitude spectrum; (c) envelope spectrum.
Figure 15.
Analysis results obtained by the proposed method for bearing inner race fault signal: (a) Time domain waveform; (b) amplitude spectrum; (c) envelope spectrum.
Figure 16.
Analysis results obtained by different methods: (a) the results of AVG for outer race fault signal; (b) the results of AVG for inner race fault signal; (c) the results of STH for outer race fault signal; (d) the results of STH for inner race fault signal; (e) the results of EMDF for outer race fault signal; (f) the results of EMDF for inner race fault signal.
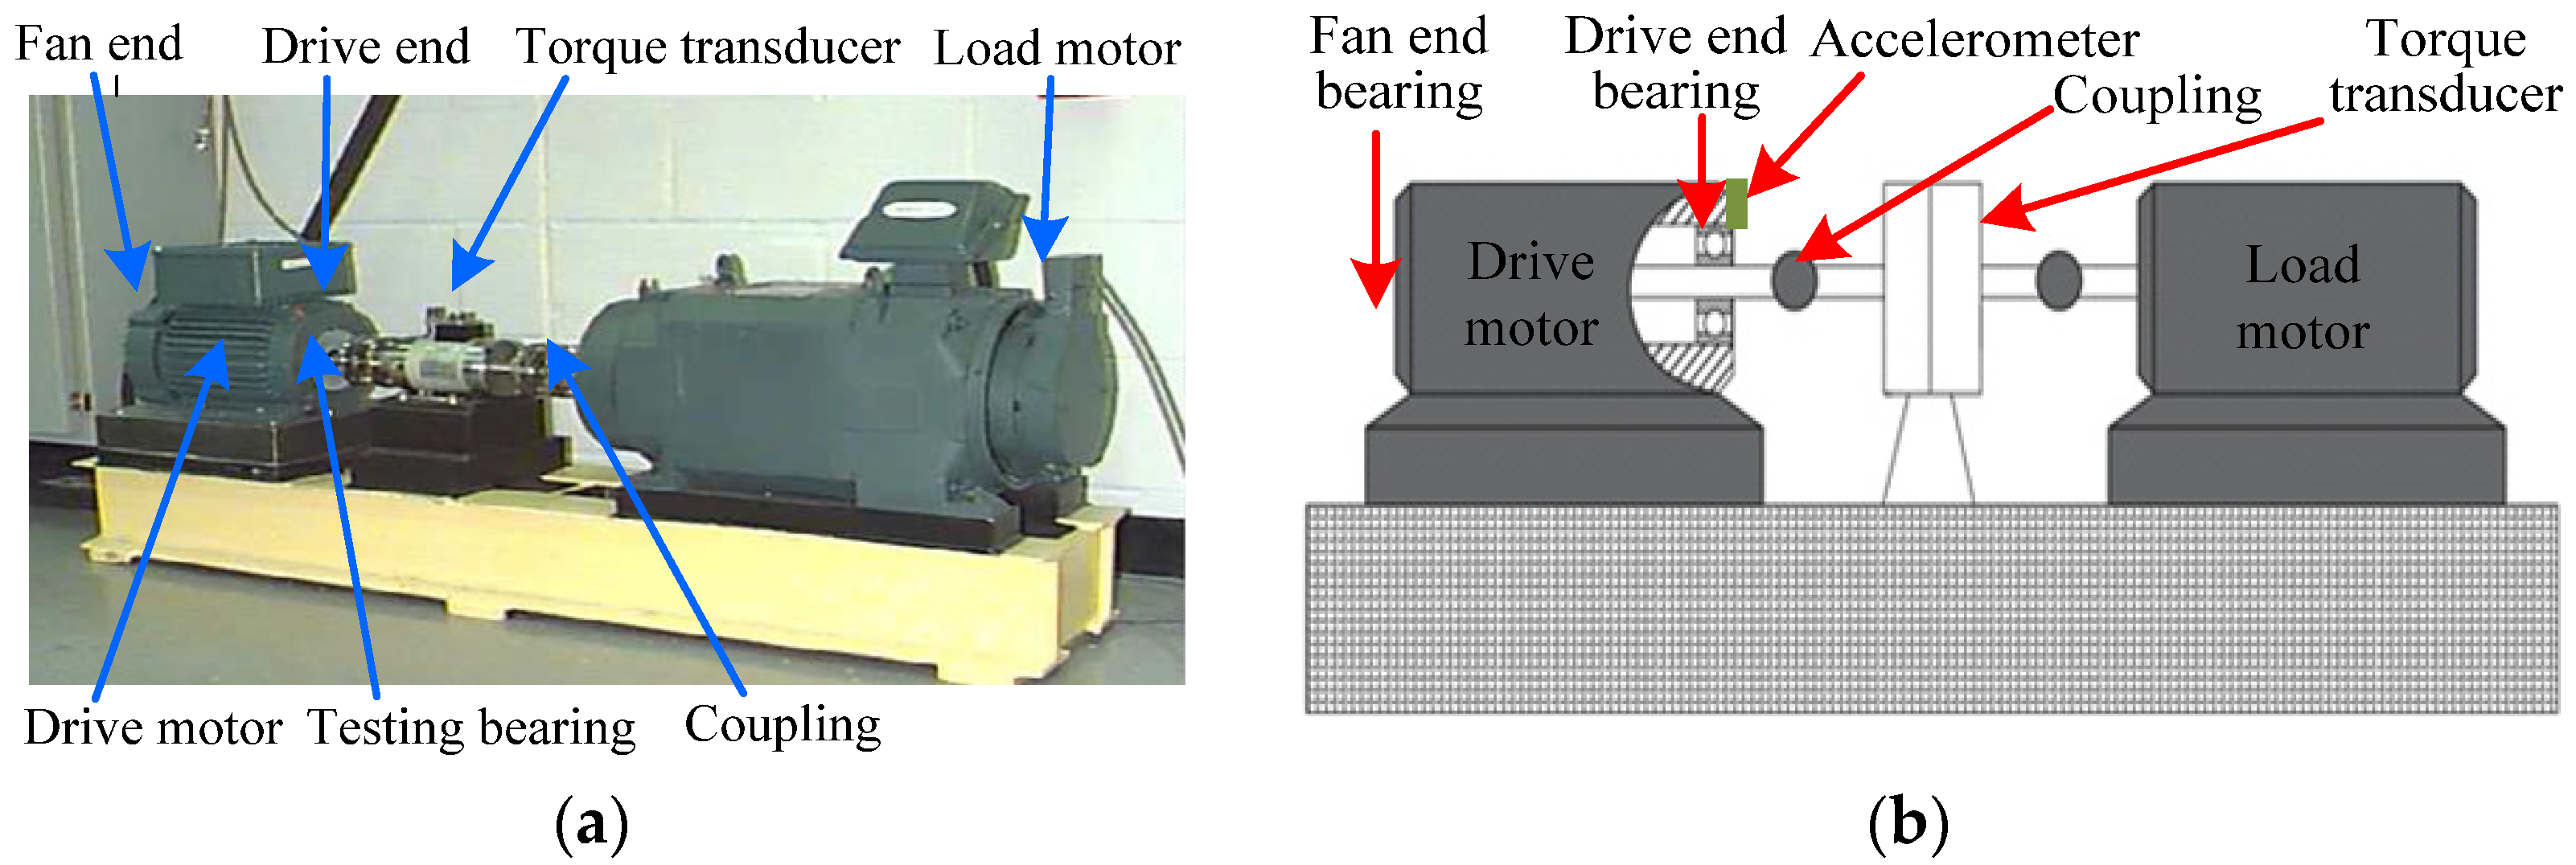
Figure 17.
(a) The experimental system; (b) its structure schematic drawing.
Figure 17.
(a) The experimental system; (b) its structure schematic drawing.
Figure 18.
Analysis results obtained by different methods for dataset 130 in case 2: (a) Time domain waveform; (b) its corresponding envelope spectrum.
Figure 18.
Analysis results obtained by different methods for dataset 130 in case 2: (a) Time domain waveform; (b) its corresponding envelope spectrum.
Figure 19.
Analysis results obtained by different methods for dataset 170 in case 2: (a) Time domain waveform; (b) its corresponding envelope spectrum.
Figure 19.
Analysis results obtained by different methods for dataset 170 in case 2: (a) Time domain waveform; (b) its corresponding envelope spectrum.
Figure 20.
Analysis results obtained by different methods for dataset 3001 in case 2: (a) Time domain waveform; (b) its corresponding envelope spectrum.
Figure 20.
Analysis results obtained by different methods for dataset 3001 in case 2: (a) Time domain waveform; (b) its corresponding envelope spectrum.
Figure 21.
Analysis results obtained by different methods for dataset 3003 in case 2: (a) Time domain waveform; (b) its corresponding envelope spectrum.
Figure 21.
Analysis results obtained by different methods for dataset 3003 in case 2: (a) Time domain waveform; (b) its corresponding envelope spectrum.
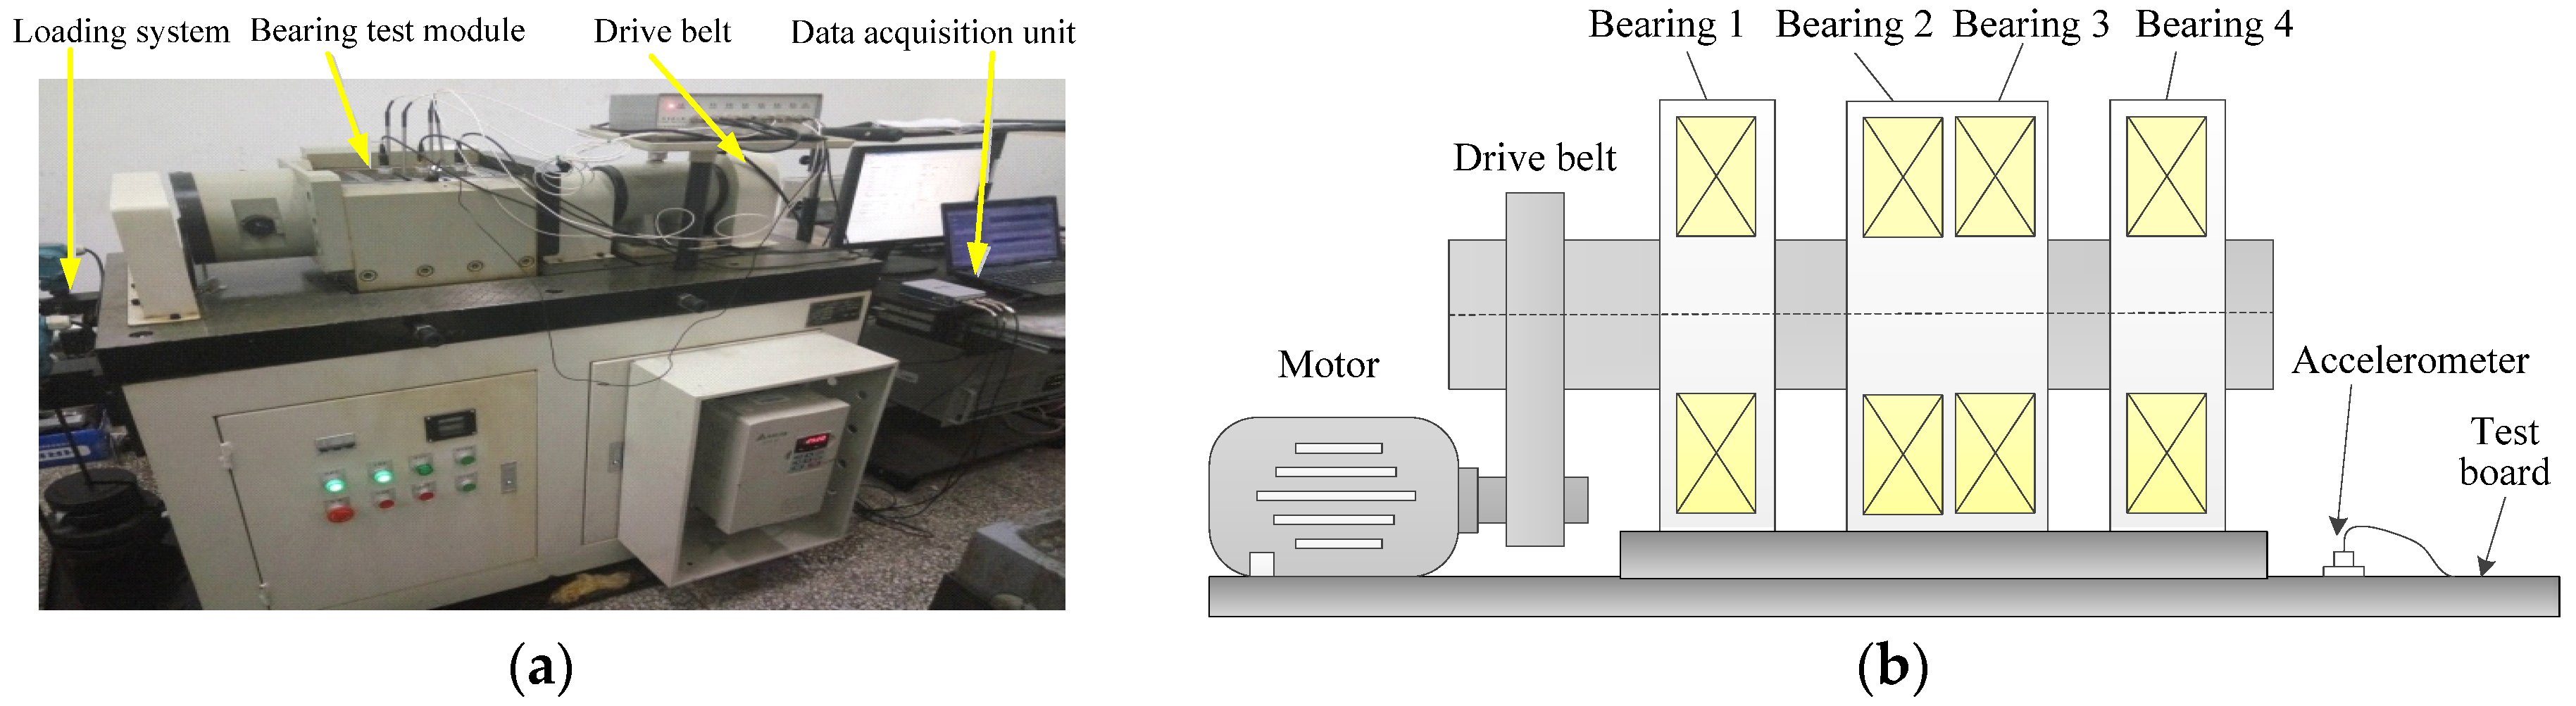
Figure 22.
(a) The experimental platform; (b) its structure schematic drawing.
Figure 22.
(a) The experimental platform; (b) its structure schematic drawing.
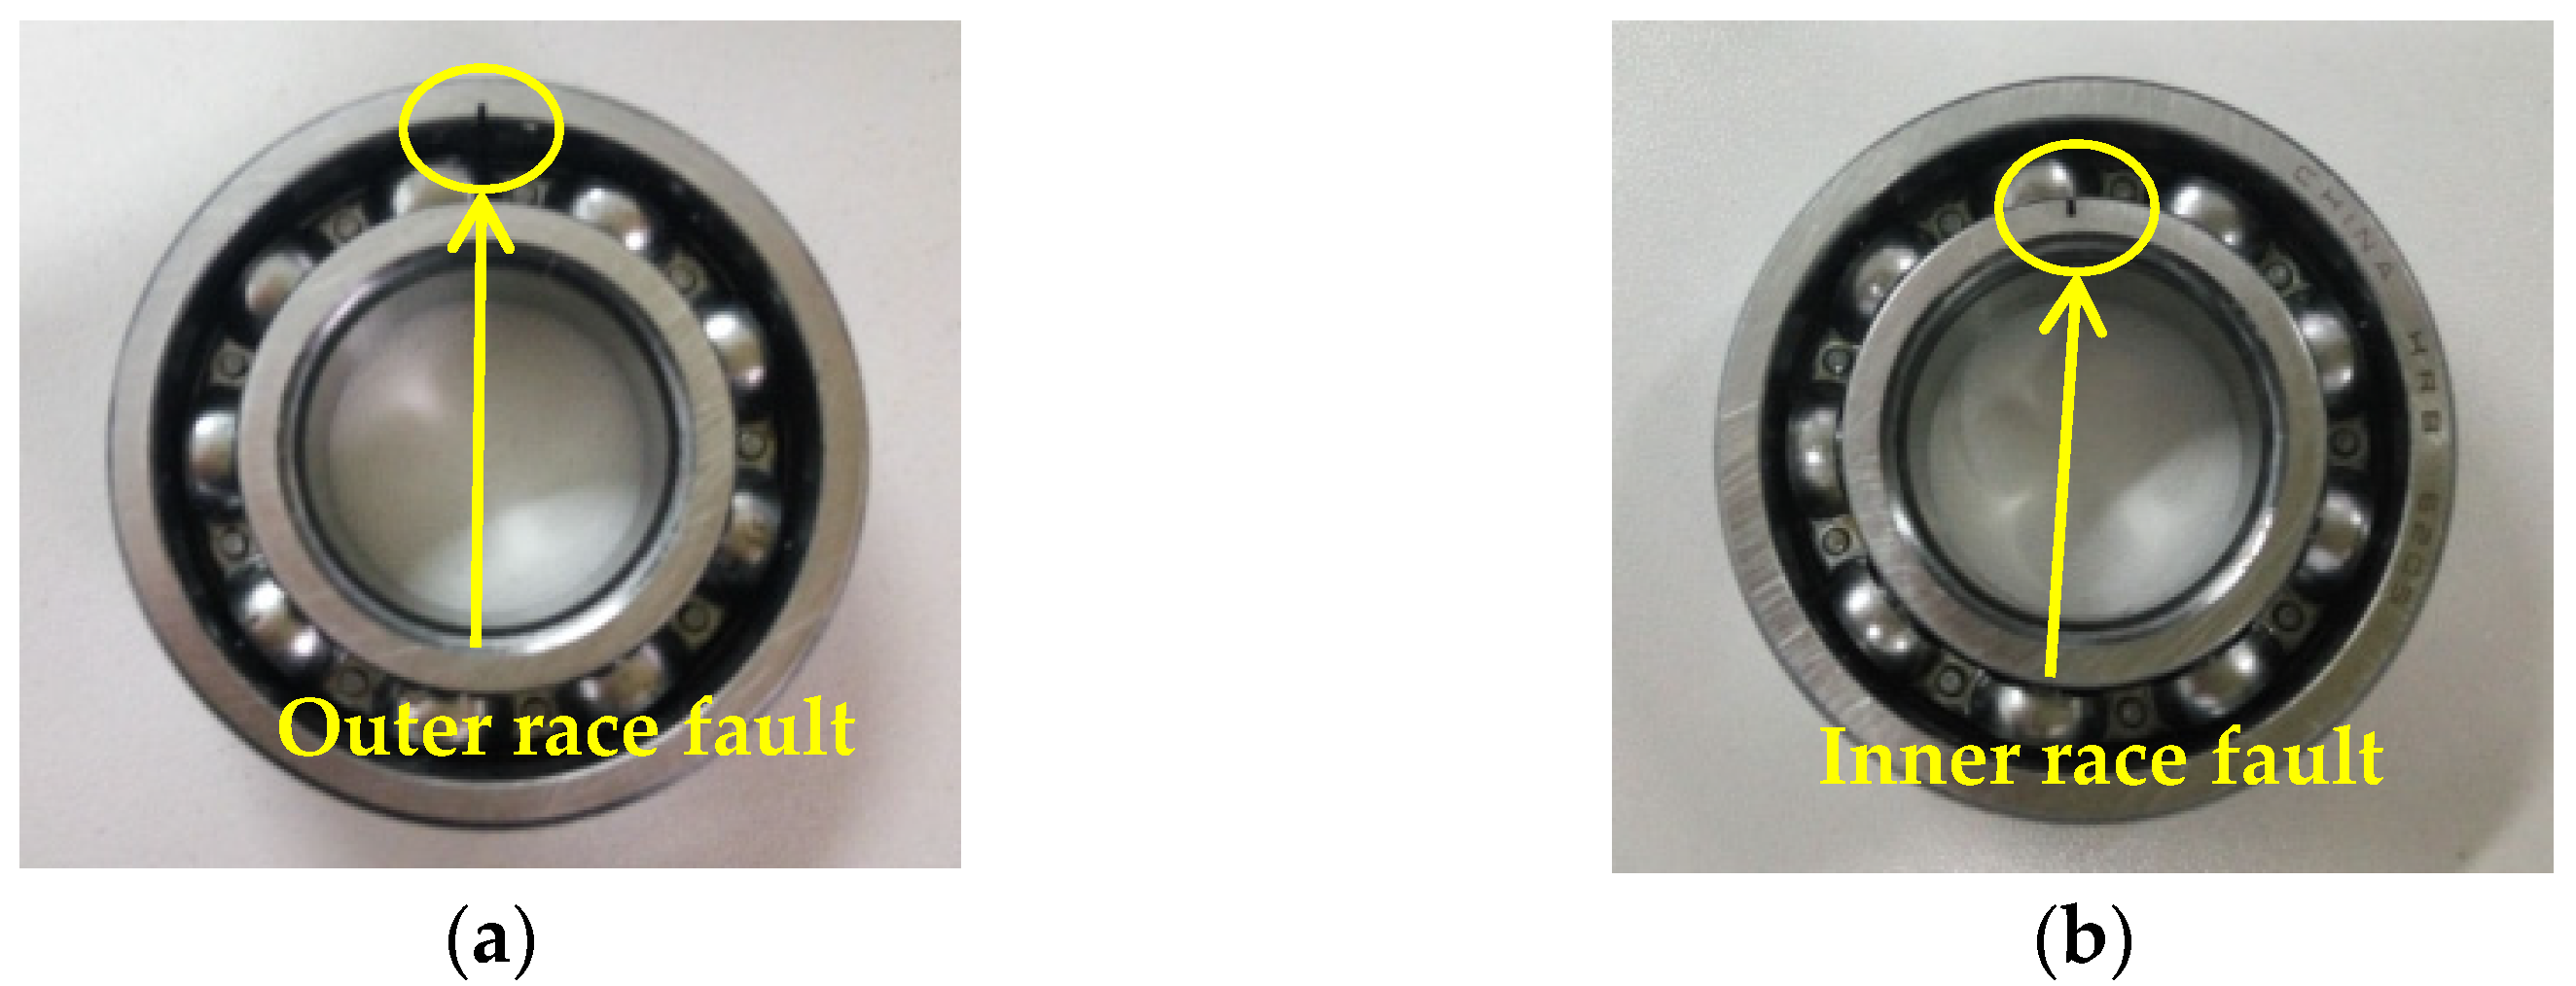
Figure 23.
(a) Outer race fault bearing; (b) inner race fault bearing.
Figure 23.
(a) Outer race fault bearing; (b) inner race fault bearing.
Figure 24.
Analysis results obtained by different methods for outer race fault signal in case 3: (a) Time domain waveform; (b) its corresponding envelope spectrum.
Figure 24.
Analysis results obtained by different methods for outer race fault signal in case 3: (a) Time domain waveform; (b) its corresponding envelope spectrum.
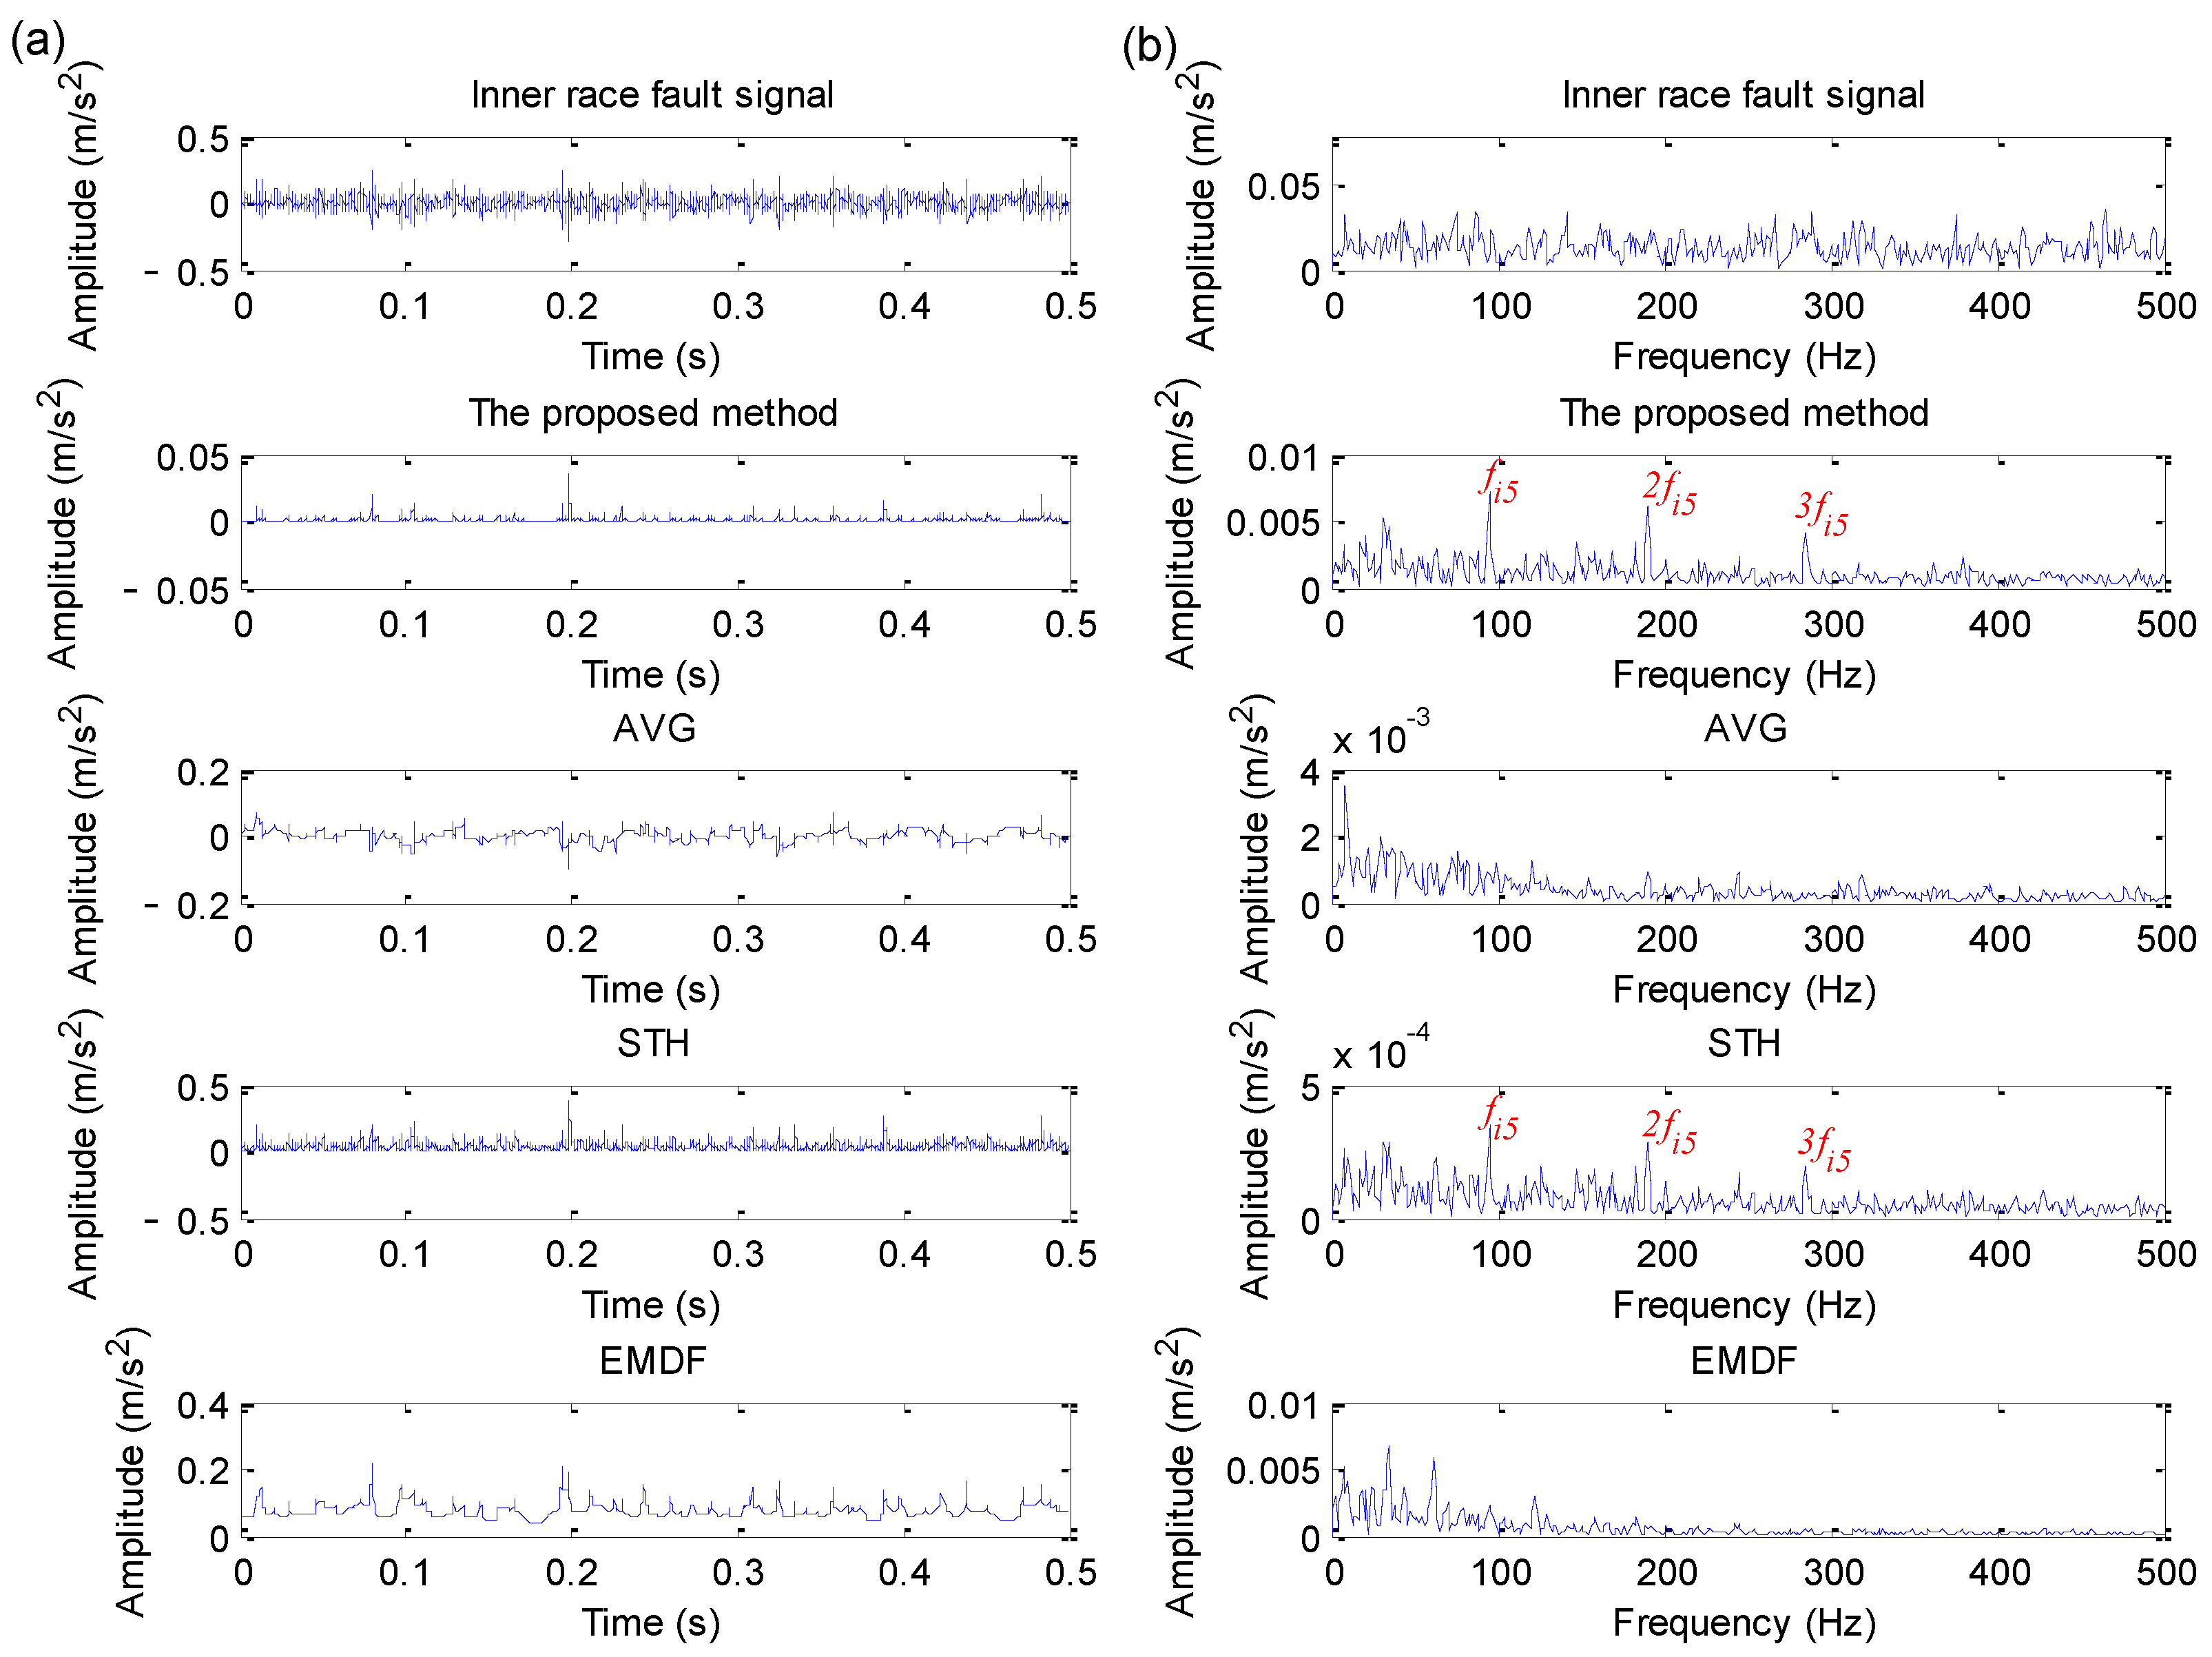
Figure 25.
Analysis results obtained by different methods for inner race fault signal in case 3: (a) Time domain waveform; (b) its corresponding envelope spectrum.
Figure 25.
Analysis results obtained by different methods for inner race fault signal in case 3: (a) Time domain waveform; (b) its corresponding envelope spectrum.
Table 1.
Specification parameter of experimental bearing.
Table 1.
Specification parameter of experimental bearing.
| Bearing Type | Ball Diameter | Pitch Diameter | Number of Ball | Contact Angle |
|---|
| N205 | 7.5 mm | 38.5 mm | 12 | 0° |
Table 2.
Bearing fault characteristic frequency.
Table 2.
Bearing fault characteristic frequency.
| Rotating Frequency fr | Inner Race Fault Frequency fi | Outer Race Fault Frequency fo | Ball Fault Frequency fb | Cage Fault Frequency fc |
|---|
| 24 Hz | 172.05 Hz | 115.94 Hz | 59.26 Hz | 9.67 Hz |
Table 3.
Size parameters of testing bearing in case 2.
Table 3.
Size parameters of testing bearing in case 2.
| Bearing Type | Ball Diameter | Pitch Diameter | Number of Ball | Contact Angle |
|---|
| SKF6205-2RS | 7.94 mm | 39.04 mm | 9 | 0° |
Table 4.
Bearing fault characteristic frequency in case 2.
Table 4.
Bearing fault characteristic frequency in case 2.
| Motor Load (Hp) | Motor Speed (rpm) | Rotating Frequency | Inner Race Fault | Outer Race Fault | Ball Fault |
|---|
| 0 | 1797 | = 29.95 Hz | = 162.19 Hz | = 107.36 Hz | = 141.09 Hz |
| 1 | 1772 | = 29.53 Hz | = 159.93 Hz | = 105.87 Hz | = 139.21 Hz |
| 2 | 1750 | = 29.17 Hz | = 157.94 Hz | = 104.56 Hz | = 137.48 Hz |
| 3 | 1730 | = 28.83 Hz | = 156.14 Hz | = 103.36 Hz | = 135.92 Hz |
Table 5.
Statistical evaluation results on all available signals from 12 k drive end of CWRU.
Table 5.
Statistical evaluation results on all available signals from 12 k drive end of CWRU.
| Fault Diameter (inches) | Motor Load (Hp) | Motor Speed (rpm) | Inner Race Fault Data | Various Methods Work or Not |
| EDPWO | AVG | STH | EMDF |
| 0.007 | 0 | 1797 | 105 | √ | √ | √ | √ |
| 1 | 1772 | 106 | √ | √ | √ | √ |
| 2 | 1750 | 107 | √ | √ | √ | √ |
| 3 | 1730 | 108 | √ | √ | √ | √ |
| 0.014 | 0 | 1797 | 169 | √ | √ | √ | √ |
| 1 | 1772 | 170 | √ | ✕ | √ | √ |
| 2 | 1750 | 171 | √ | √ | √ | √ |
| 3 | 1730 | 172 | √ | √ | √ | √ |
| 0.021 | 0 | 1797 | 209 | √ | √ | √ | √ |
| 1 | 1772 | 210 | √ | √ | √ | √ |
| 2 | 1750 | 211 | √ | √ | √ | √ |
| 3 | 1730 | 212 | √ | √ | √ | √ |
| 0.028 | 0 | 1797 | 3001 | ✕ | ✕ | ✕ | ✕ |
| 1 | 1772 | 3002 | ✕ | ✕ | ✕ | ✕ |
| 2 | 1750 | 3003 | ✕ | ✕ | ✕ | ✕ |
| 3 | 1730 | 3004 | ✕ | ✕ | ✕ | ✕ |
| Continued 1 |
| Fault Diameter (inches) | Motor Load (Hp) | Motor Speed (rpm) | Ball Fault Data | Various Methods Work or Not |
| EDPWO | AVG | STH | EMDF |
| 0.007 | 0 | 1797 | 118 | ✕ | ✕ | ✕ | ✕ |
| 1 | 1772 | 119 | ✕ | ✕ | ✕ | ✕ |
| 2 | 1750 | 120 | ✕ | ✕ | ✕ | ✕ |
| 3 | 1730 | 121 | ✕ | ✕ | ✕ | ✕ |
| 0.014 | 0 | 1797 | 185 | ✕ | ✕ | ✕ | ✕ |
| 1 | 1772 | 186 | ✕ | ✕ | ✕ | ✕ |
| 2 | 1750 | 187 | ✕ | ✕ | ✕ | ✕ |
| 3 | 1730 | 188 | ✕ | ✕ | ✕ | ✕ |
| 0.021 | 0 | 1797 | 222 | ✕ | ✕ | ✕ | ✕ |
| 1 | 1772 | 223 | √ | ✕ | √ | ✕ |
| 2 | 1750 | 224 | ✕ | ✕ | ✕ | ✕ |
| 3 | 1730 | 225 | ✕ | ✕ | ✕ | ✕ |
| 0.028 | 0 | 1797 | 3005 | √ | √ | √ | √ |
| 1 | 1772 | 3006 | √ | √ | √ | √ |
| 2 | 1750 | 3007 | √ | √ | √ | √ |
| 3 | 1730 | 3008 | √ | √ | √ | √ |
| Continued 2 |
| Fault Diameter (inches) | Motor Load (Hp) | Motor Speed (rpm) | Outer Race Fault Data at 6 O’clock | Various Methods Work or Not |
| EDPWO | AVG | STH | EMDF |
| 0.007 | 0 | 1797 | 130 | √ | √ | √ | √ |
| 1 | 1772 | 131 | √ | √ | √ | √ |
| 2 | 1750 | 132 | √ | √ | √ | √ |
| 3 | 1730 | 133 | √ | √ | √ | √ |
| 0.014 | 0 | 1797 | 197 | ✕ | ✕ | ✕ | ✕ |
| 1 | 1772 | 198 | √ | ✕ | √ | ✕ |
| 2 | 1750 | 199 | ✕ | ✕ | ✕ | ✕ |
| 3 | 1730 | 200 | ✕ | ✕ | ✕ | ✕ |
| 0.021 | 0 | 1797 | 234 | √ | √ | √ | √ |
| 1 | 1772 | 235 | √ | √ | √ | √ |
| 2 | 1750 | 236 | √ | √ | √ | √ |
| 3 | 1730 | 237 | √ | √ | √ | √ |
| 0.028 | 0 | 1797 | * | * | * | * | * |
| 1 | 1772 | * | * | * | * | * |
| 2 | 1750 | * | * | * | * | * |
| 3 | 1730 | * | * | * | * | * |
| Continued 3 |
| Fault Diameter (inches) | Motor Load (Hp) | Motor Speed (rpm) | Outer Race Fault Data at 3 O’clock | Various Methods Work or Not |
| EDPWO | AVG | STH | EMDF |
| 0.007 | 0 | 1797 | 144 | √ | √ | √ | √ |
| 1 | 1772 | 145 | √ | √ | √ | √ |
| 2 | 1750 | 146 | √ | √ | √ | √ |
| 3 | 1730 | 147 | √ | √ | √ | √ |
| 0.014 | 0 | 1797 | * | * | * | * | * |
| 1 | 1772 | * | * | * | * | * |
| 2 | 1750 | * | * | * | * | * |
| 3 | 1730 | * | * | * | * | * |
| 0.021 | 0 | 1797 | 246 | √ | √ | √ | √ |
| 1 | 1772 | 247 | √ | √ | √ | √ |
| 2 | 1750 | 248 | √ | √ | √ | √ |
| 3 | 1730 | 249 | √ | √ | √ | √ |
| 0.028 | 0 | 1797 | * | * | * | * | * |
| 1 | 1772 | * | * | * | * | * |
| 2 | 1750 | * | * | * | * | * |
| 3 | 1730 | * | * | * | * | * |
| Continued 4 |
| Fault Diameter (inches) | Motor Load (Hp) | Motor Speed (rpm) | Outer Race Fault Data at 12 O’clock | Various Methods Work or Not |
| EDPWO | AVG | STH | EMDF |
| 0.007 | 0 | 1797 | 156 | √ | √ | √ | √ |
| 1 | 1772 | 158 | √ | √ | √ | √ |
| 2 | 1750 | 159 | √ | √ | √ | √ |
| 3 | 1730 | 160 | √ | √ | √ | √ |
| 0.014 | 0 | 1797 | * | * | * | * | * |
| 1 | 1772 | * | * | * | * | * |
| 2 | 1750 | * | * | * | * | * |
| 3 | 1730 | * | * | * | * | * |
| 0.021 | 0 | 1797 | 258 | √ | √ | √ | √ |
| 1 | 1772 | 259 | √ | √ | √ | √ |
| 2 | 1750 | 260 | √ | √ | √ | √ |
| 3 | 1730 | 261 | √ | √ | √ | √ |
| 0.028 | 0 | 1797 | * | * | * | * | * |
| 1 | 1772 | * | * | * | * | * |
| 2 | 1750 | * | * | * | * | * |
| 3 | 1730 | * | * | * | * | * |
Table 6.
Size parameters of testing bearing in case 3.
Table 6.
Size parameters of testing bearing in case 3.
| Bearing Type | Ball Diameter | Pitch Diameter | Number of Ball | Contact Angle |
|---|
| HRB6205 | 7.94 mm | 39.04 mm | 9 | 0° |
Table 7.
Quantitative comparison of FFR of different methods.
Table 7.
Quantitative comparison of FFR of different methods.
| Different Methods | Simulation Signal | Case 1: Outer Race Fault Signal | Case 1: Inner Race Fault Signal |
|---|
| Raw signal | 0.036 | 2.906 | 2.399 |
| EDPWO | 0.149 | 291.788 | 117.588 |
| AVG | 0.044 | 11.142 | 5.521 |
| STH | 0.102 | 20.294 | 11.690 |
| EMDF | 0.062 | 14.676 | 5.834 |
Table 8.
Quantitative comparison of kurtosis and CPU time of different methods.
Table 8.
Quantitative comparison of kurtosis and CPU time of different methods.
| Different Methods | Simulation Signal | Case 1: Outer Race Fault Signal | Case 1: Inner Race Fault Signal |
|---|
| Kurtosis | CPU Time (s) | Kurtosis | CPU Time (s) | Kurtosis | CPU Time (s) |
|---|
| Raw signal | 2.844 | 0.019 | 1.600 | 0.018 | 1.498 | 0.019 |
| EDPWO | 9.497 | 52.601 | 52.907 | 180.088 | 176.813 | 182.229 |
| AVG | 2.357 | 14.664 | 1.565 | 56.343 | 1.481 | 55.899 |
| STH | 4.908 | 12.721 | 19.716 | 45.333 | 13.669 | 46.500 |
| EMDF | 3.143 | 59.977 | 2.477 | 215.084 | 4.862 | 220.197 |
Table 9.
The FFR value obtained by various methods under different CWRU fault data.
Table 9.
The FFR value obtained by various methods under different CWRU fault data.
| Different Methods | Case 2: 12 kHz Drive End Bearing Outer Race Fault Data at 6 O’clock | Case 2: 12 kHz Drive End Bearing Inner Race Fault Data |
|---|
| Dataset 130 | Dataset 198 | Dataset 236 | Dataset 237 | Dataset 105 | Dataset 170 | Dataset 211 | Dataset 3004 |
|---|
| Raw signal | 0.466 | 0.002 | 0.216 | 0.253 | 0.052 | 0.023 | 0.263 | 0.029 |
| EDPWO | 0.635 | 0.006 | 0.344 | 0.405 | 0.135 | 0.054 | 0.353 | 0.049 |
| AVG | 0.049 | 0.002 | 0.051 | 0.072 | 0.034 | 0.007 | 0.042 | 0.012 |
| STH | 0.316 | 0.006 | 0.328 | 0.397 | 0.063 | 0.033 | 0.269 | 0.031 |
| EMDF | 0.443 | 0.004 | 0.278 | 0.322 | 0.061 | 0.039 | 0.304 | 0.031 |
Table 10.
The kurtosis value obtained by various methods under different CWRU fault data.
Table 10.
The kurtosis value obtained by various methods under different CWRU fault data.
| Different Methods | Case 2: 12 kHz Drive End Bearing Outer Race Fault Data at 6 O’clock | Case 2: 12 kHz Drive End Bearing Inner Race Fault Data |
|---|
| Dataset 130 | Dataset 198 | Dataset 236 | Dataset 237 | Dataset 105 | Dataset 170 | Dataset 211 | Dataset 3004 |
|---|
| Raw signal | 7.703 | 2.943 | 19.656 | 21.855 | 5.459 | 28.778 | 6.961 | 3.364 |
| EDPWO | 15.967 | 7.739 | 57.222 | 88.180 | 34.414 | 199.842 | 31.638 | 27.836 |
| AVG | 9.753 | 3.364 | 19.537 | 20.599 | 6.462 | 25.934 | 5.764 | 4.478 |
| STH | 15.617 | 4.816 | 47.430 | 41.569 | 11.447 | 72.077 | 13.899 | 9.052 |
| EMDF | 4.851 | 3.076 | 13.250 | 14.836 | 5.232 | 34.072 | 4.749 | 3.617 |
Table 11.
The CPU time obtained by various methods under different CWRU fault data(s).
Table 11.
The CPU time obtained by various methods under different CWRU fault data(s).
| Different Methods | Case 2: 12 kHz Drive End Bearing Outer Race Fault Data at 6 O’clock | Case 2: 12 kHz Drive End Bearing Inner Race Fault Data |
|---|
| Dataset 130 | Dataset 198 | Dataset 236 | Dataset 237 | Dataset 105 | Dataset 170 | Dataset 211 | Dataset 3004 |
|---|
| Raw signal | 0.018 | 0.019 | 0.019 | 0.018 | 0.018 | 0.018 | 0.019 | 0.019 |
| EDPWO | 90.285 | 93.653 | 94.349 | 92.141 | 92.314 | 88.780 | 92.245 | 92.868 |
| AVG | 30.056 | 30.272 | 30.646 | 30.094 | 30.371 | 29.964 | 30.258 | 30704 |
| STH | 23.568 | 23.221 | 23.283 | 23.358 | 23.584 | 23.262 | 23.305 | 23.130 |
| EMDF | 112.093 | 111.243 | 113.147 | 112.354 | 114.024 | 111.223 | 111.477 | 111.379 |
Table 12.
Quantitative comparison of statistical indicators of different methods in case 3.
Table 12.
Quantitative comparison of statistical indicators of different methods in case 3.
| Different Methods | Case 3: Outer Race Fault Signal | Case 3: Inner Race Fault Signal |
|---|
| FFR | Kurtosis | CPU Time (s) | FFR | Kurtosis | CPU Time (s) |
|---|
| Raw signal | 0.005 | 3.029 | 0.012 | 0.005 | 4.714 | 0.018 |
| EDPWO | 0.066 | 10.256 | 146.097 | 0.037 | 101.890 | 153.317 |
| AVG | 0.001 | 2.991 | 52.121 | 0.002 | 3.606 | 49.005 |
| STH | 0.003 | 4.964 | 41.115 | 0.018 | 14.085 | 39.615 |
| EMDF | 0.006 | 3.387 | 190.205 | 0.007 | 5.426 | 177.441 |


