
Fall-from-Height Detection Using Deep Learning Based on IMU Sensor Data for Accident Prevention at Construction Sites


Abstract
:1. Introduction
2. Materials and Methods
2.1. Experiment
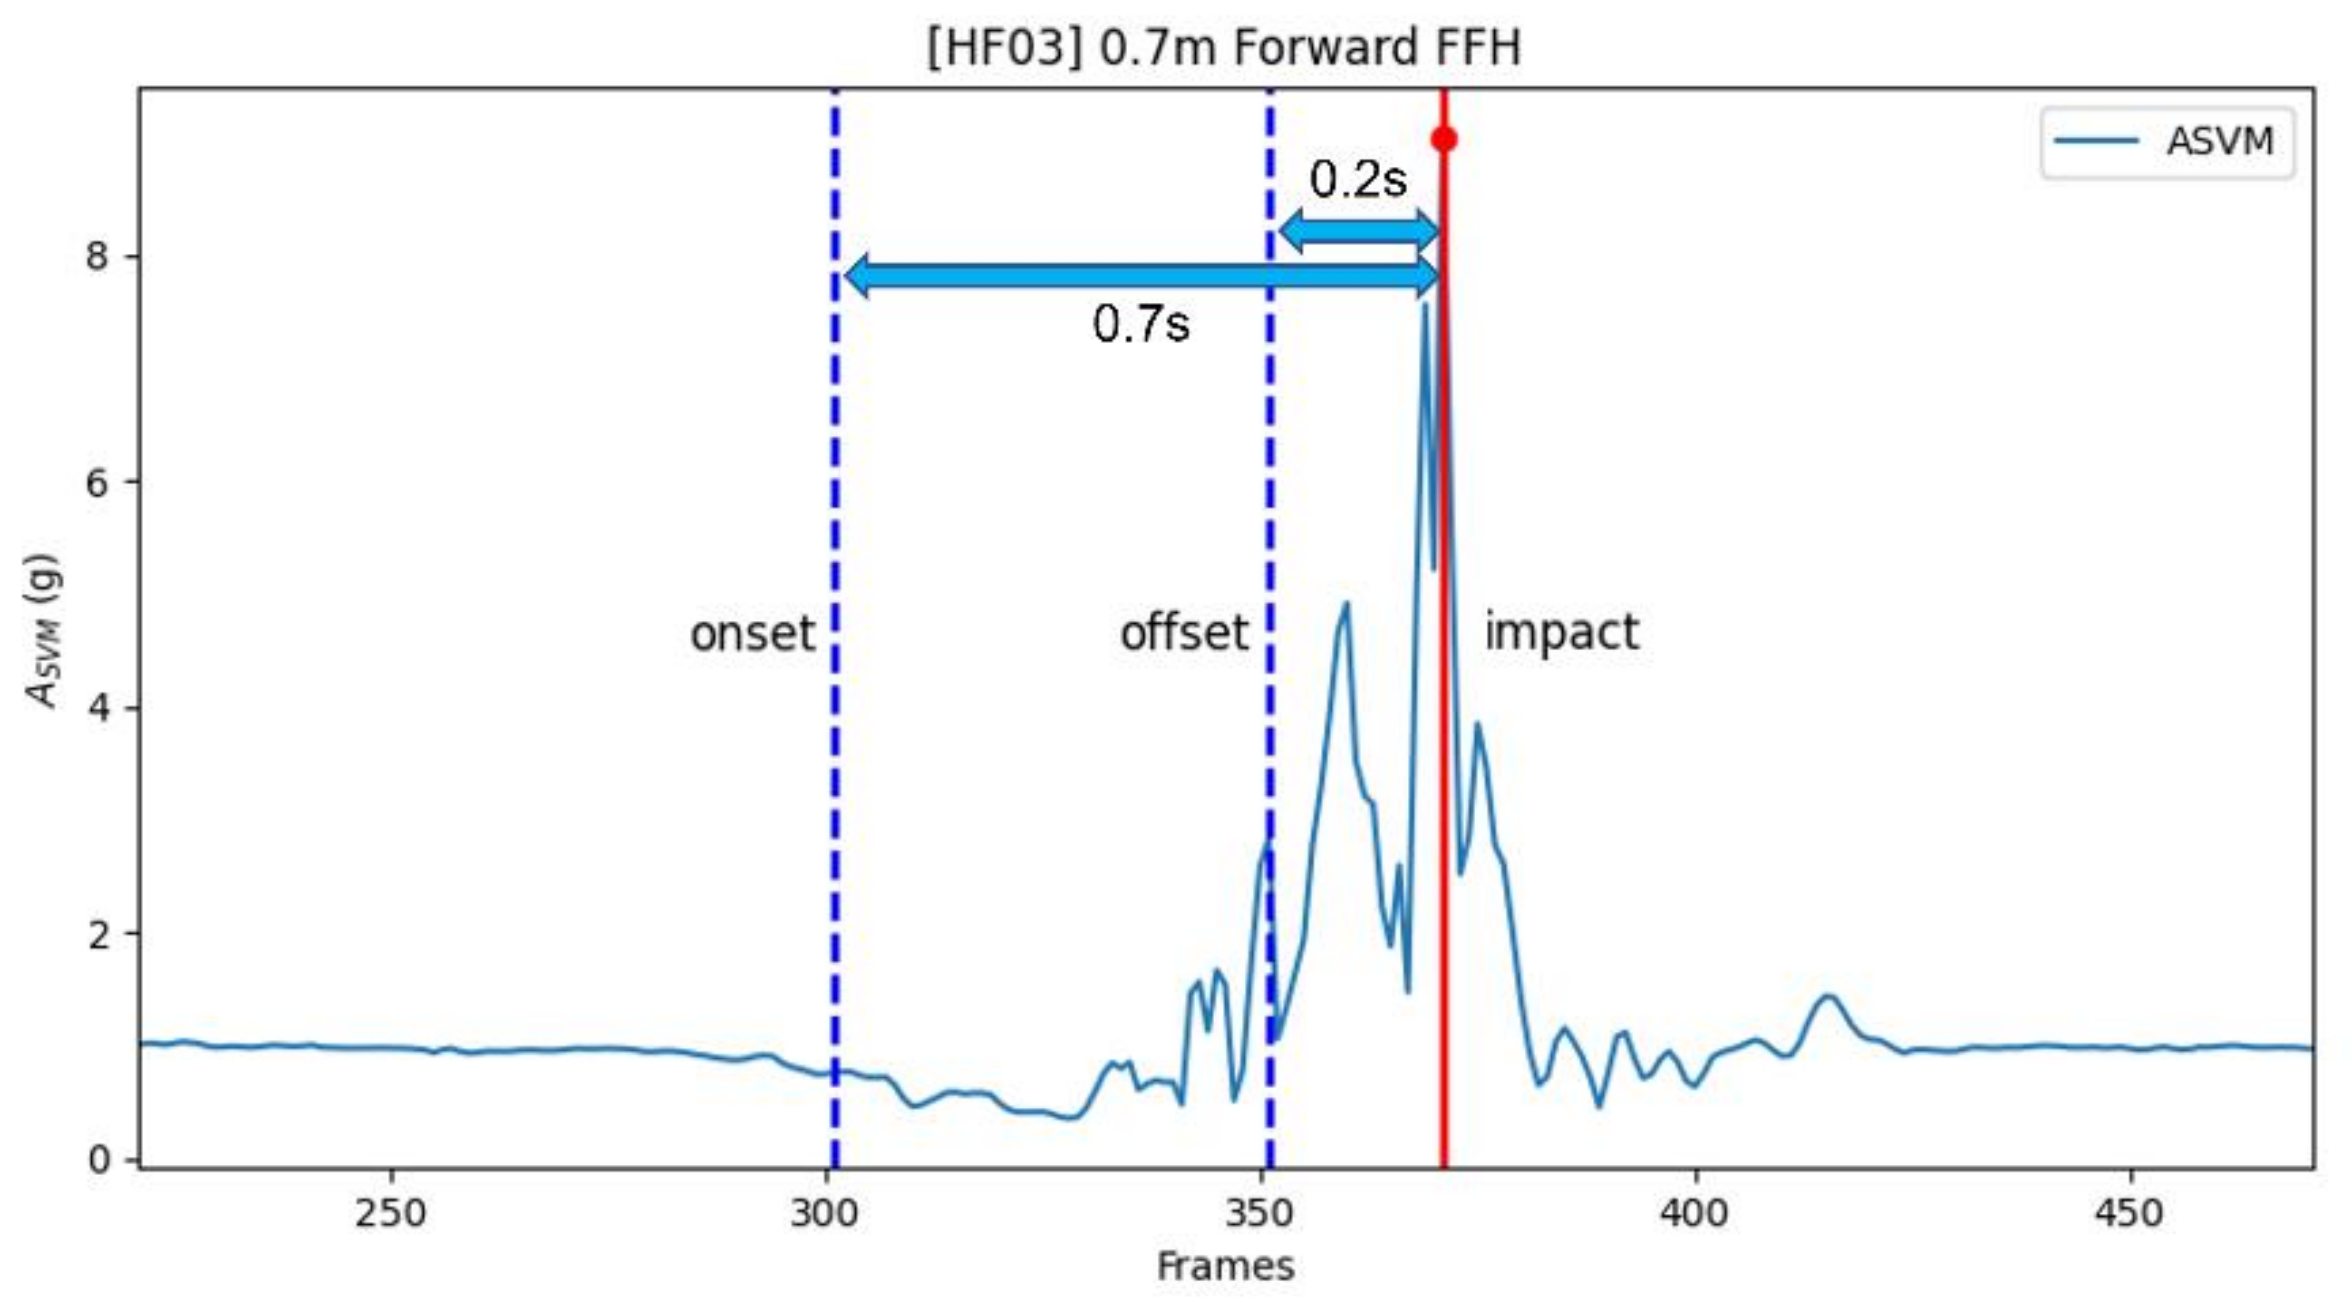
2.2. Pre-Processing
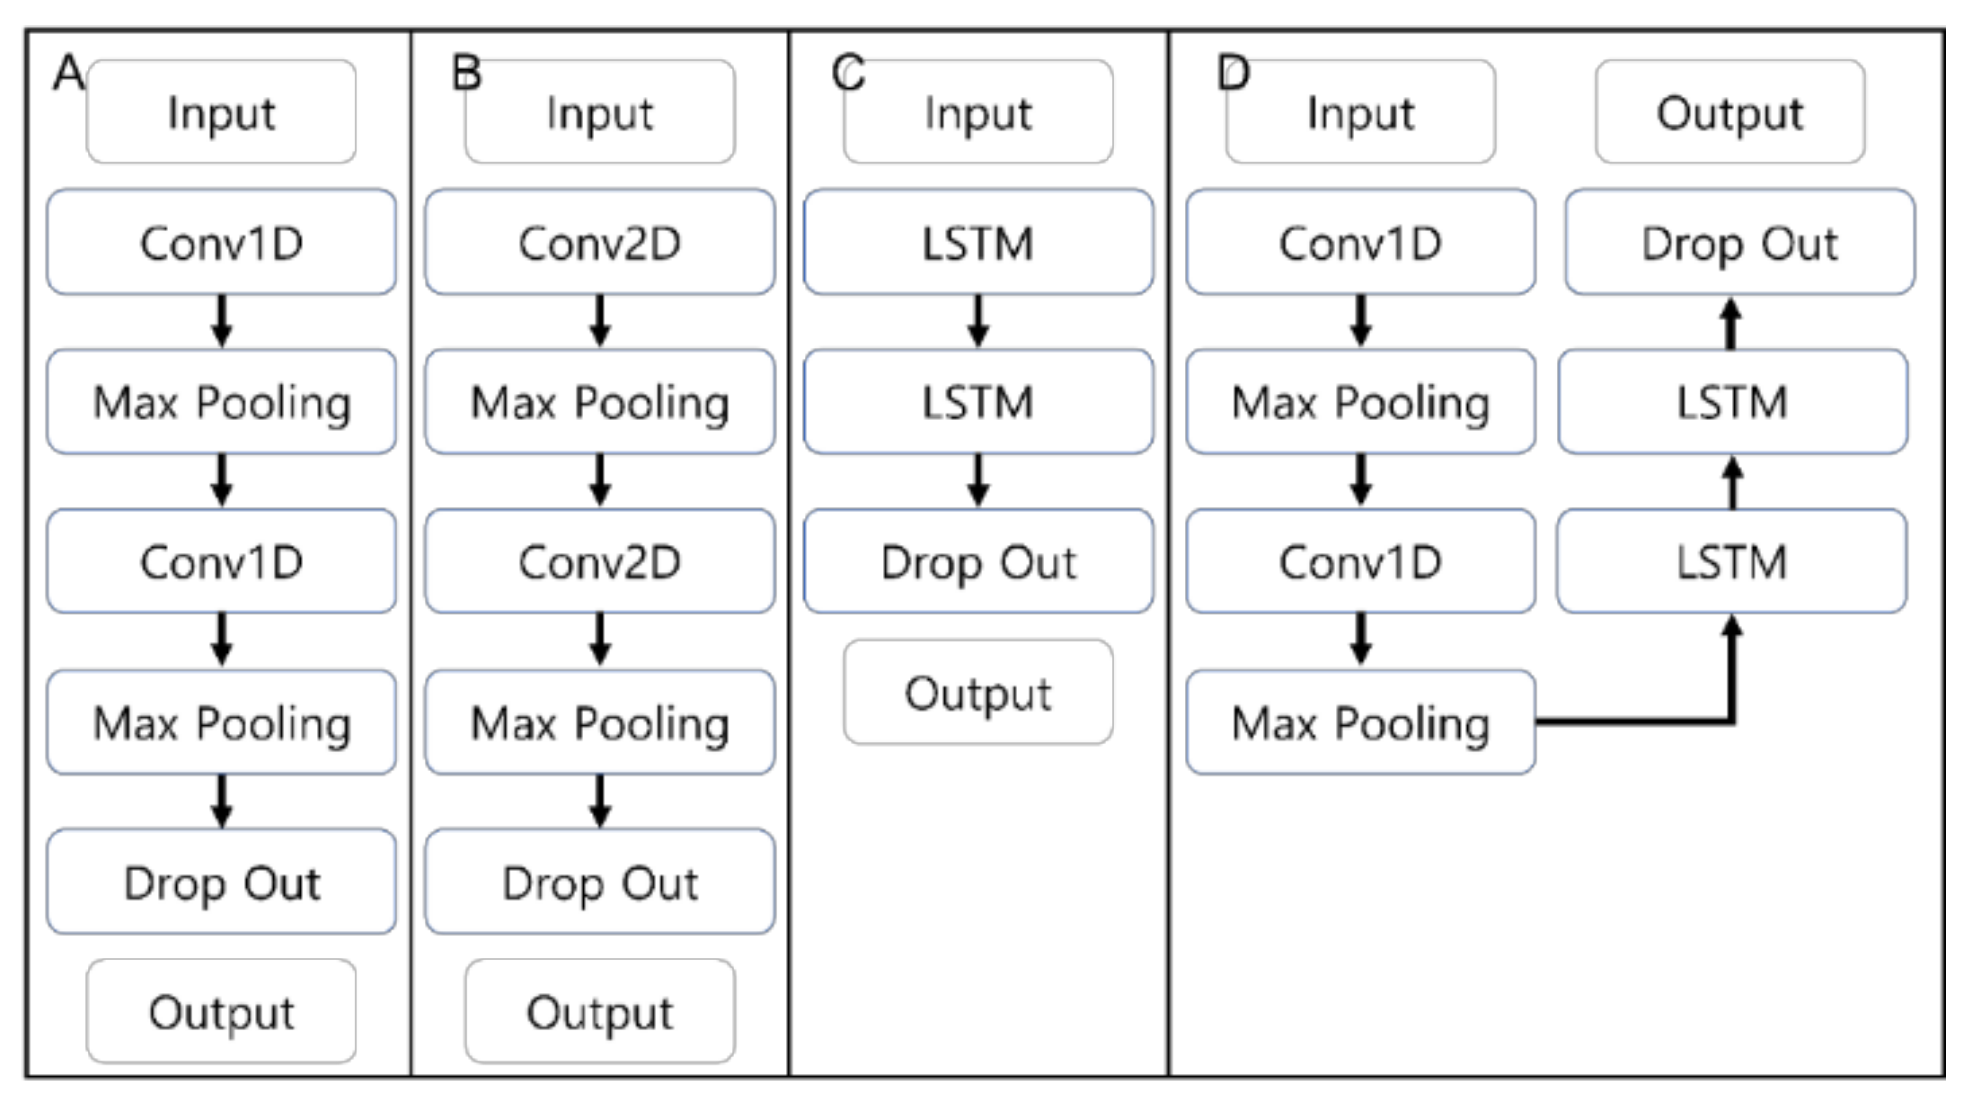
2.3. Deep Learning Models
2.4. Evaluation Methods
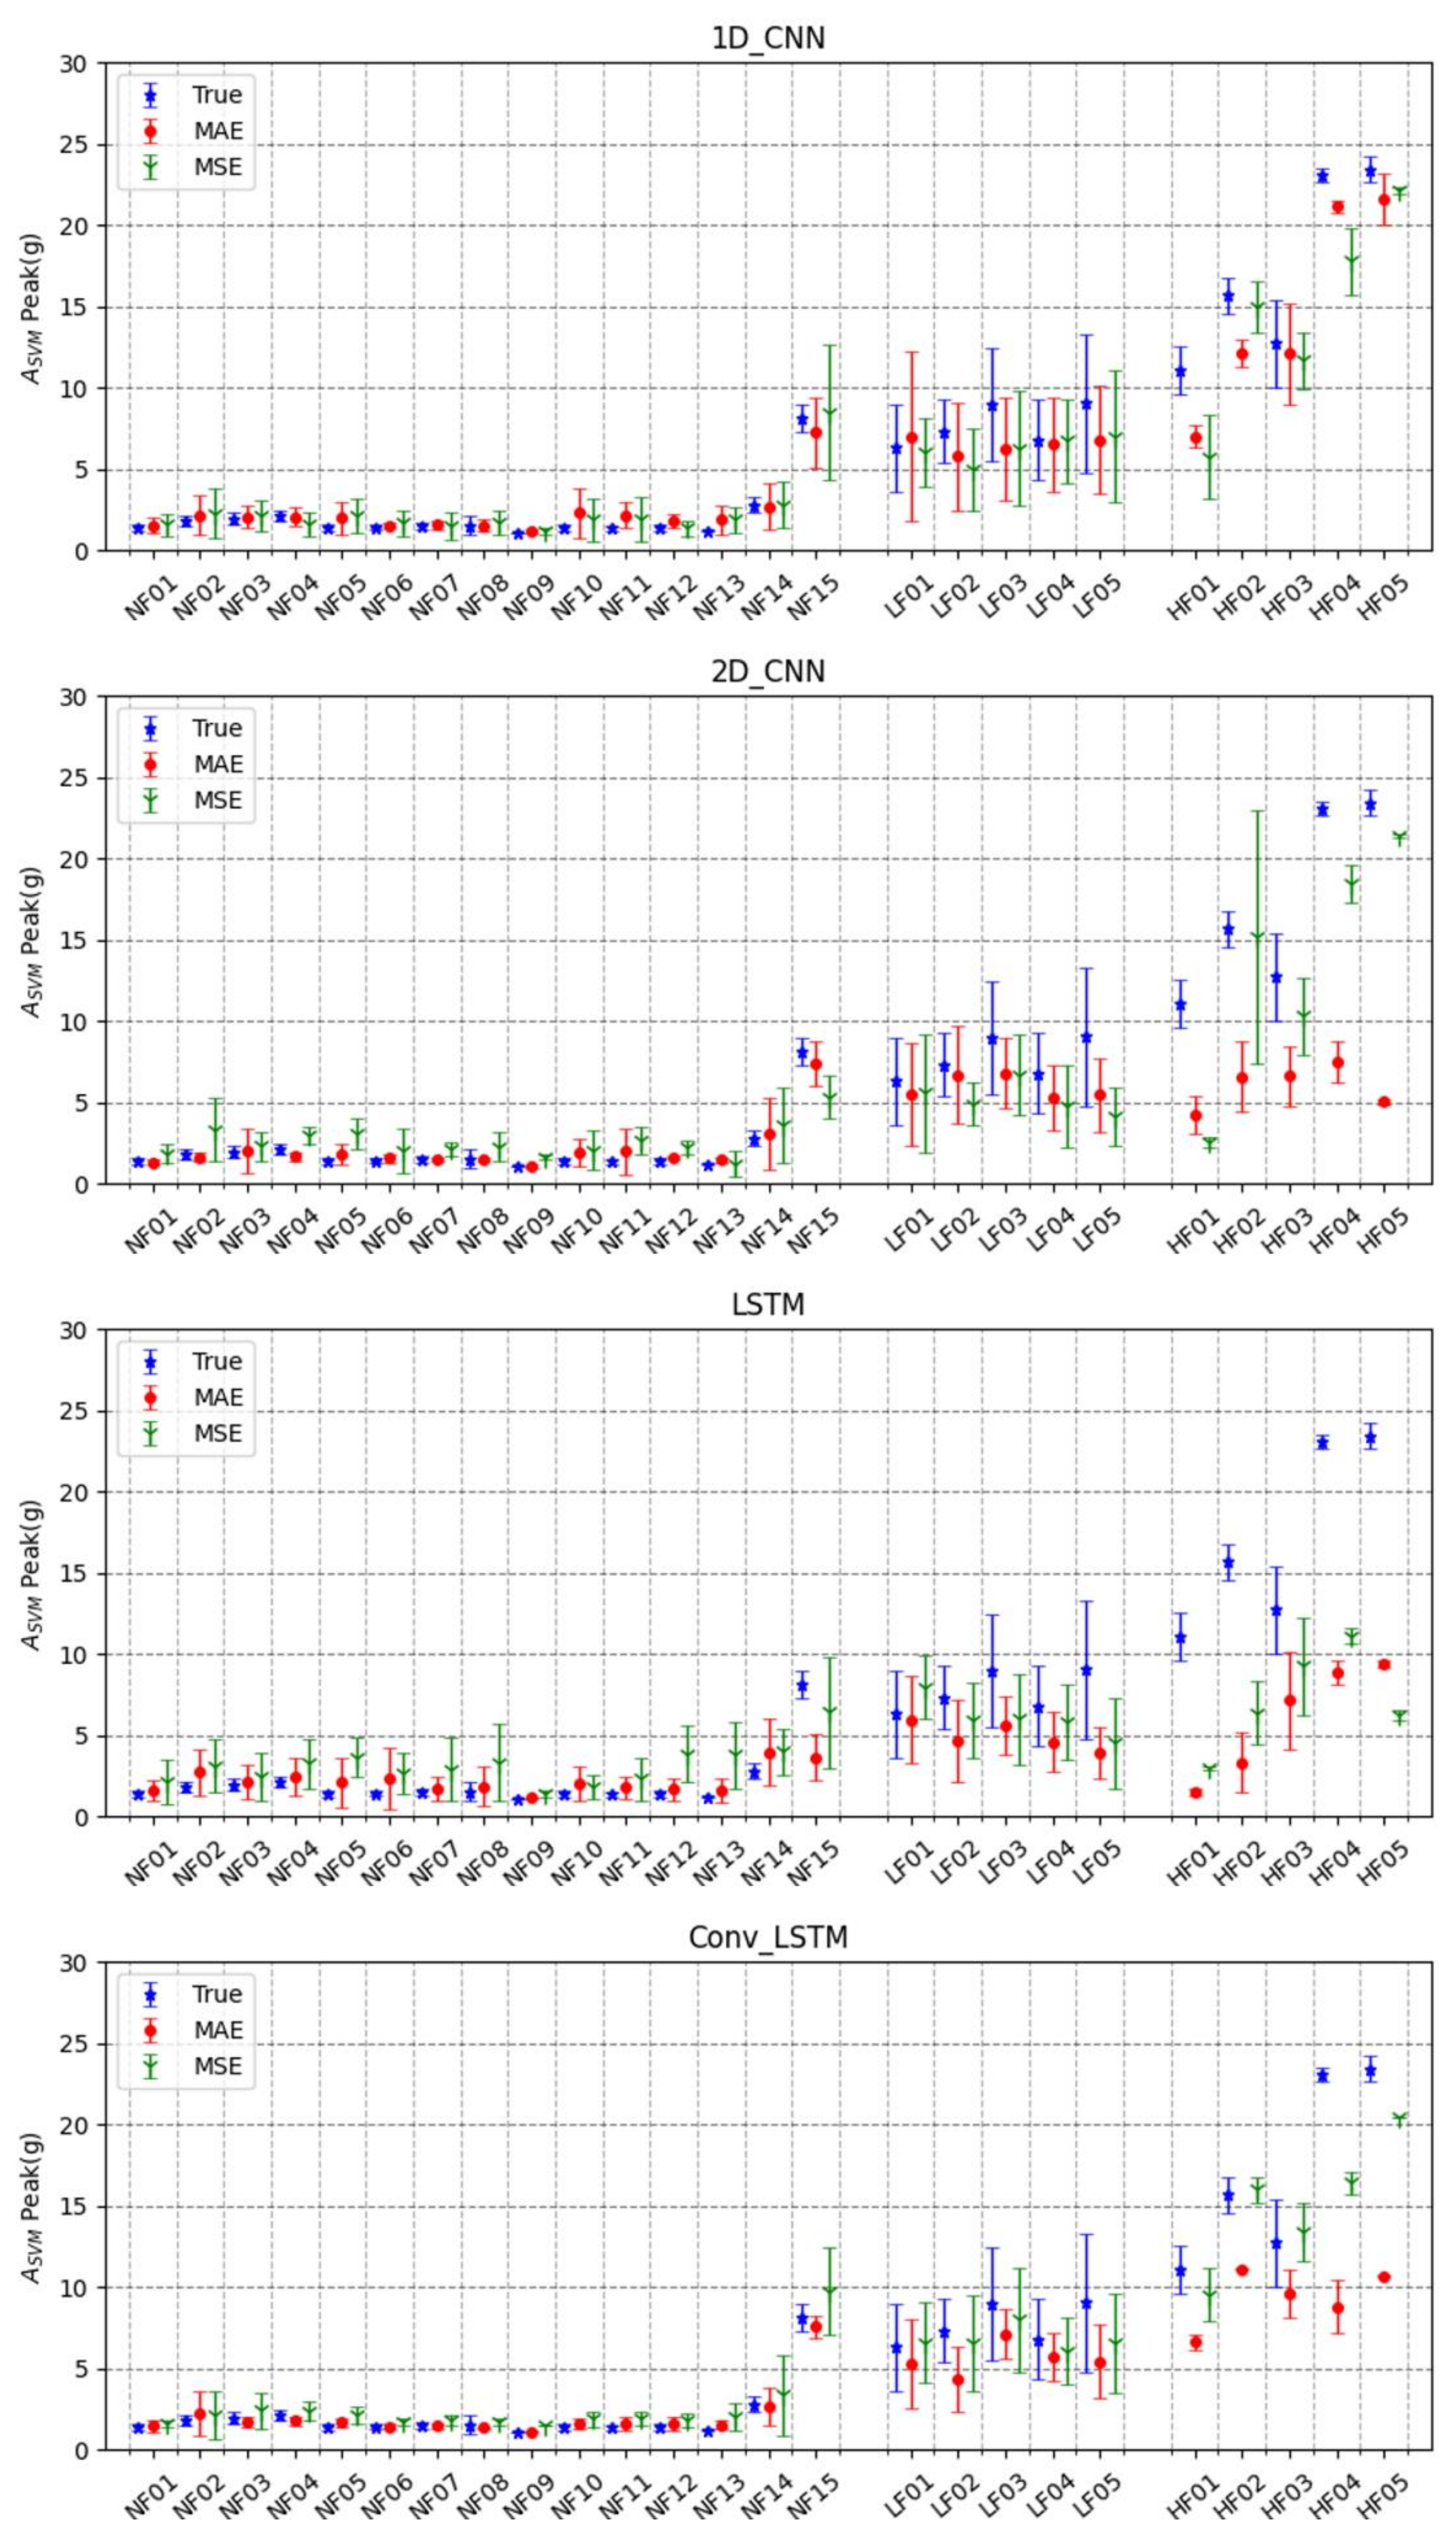
3. Results
4. Discussion
5. Conclusions
Author Contributions
Funding
Institutional Review Board Statement
Informed Consent Statement
Conflicts of Interest
References
- Choi, S.; Guo, L.; Kim, J.; Xiong, S. Comparison of fatal occupational injuries in construction industry in the United States, South Korea, and China. Int. J. Ind. Ergon. 2019, 71, 64–74. [Google Scholar] [CrossRef]
- Yang, K.; Ahn, C.R.; Vuran, M.C.; Aria, S.S. Semi-supervised near-miss fall detection for ironworkers with a wearable inertial measurement unit. Automat. Constr. 2016, 68, 194–202. [Google Scholar] [CrossRef]
- Liu, D.; Sommerich, C.M.; Sanders, E.B.-N.; Lavender, S.A. Application of a participatory methodology for investigating Personal Fall Arrest System (PFAS) usage in the construction industry. In Proceedings of the Human Factors and Ergonomics Society Annual Meeting, San Antonio, TX, USA, 19–23 October 2009; Volume 53. pp. 925–929. [CrossRef]
- Pomares, J.C.; Carrión, E.Á.; González, A.; Saez, P.I. Optimization on Personal Fall Arrest Systems. Experimental Dynamic Studies on Lanyard Prototypes. Int. J. Environ. Res. Public Health 2020, 17, 1107. [Google Scholar] [CrossRef] [PubMed]
- Goh, Y.M. Empirical investigation of the average deployment force of personal fall-arrest energy absorbers. J. Constr. Eng. Manag. 2015, 141, 04014059. [Google Scholar] [CrossRef]
- Lee, C.; Porter, K.M. Suspension trauma. Emerg. Med. J. 2007, 24, 237–238. [Google Scholar] [CrossRef]
- Dong, X.S.; Largay, J.A.; Choi, S.; Wang, X.; Cain, C.T.; Romano, N. Fatal falls and PFAS use in the construction industry: Findings from the NIOSH FACE reports. Accid. Anal. Prev. 2017, 102, 136–143. [Google Scholar] [CrossRef]
- Han, S.; Lee, S.; Peña-Mora, F. Vision-based detection of unsafe actions of a construction worker: Case study of ladder climbing. J. Comput. Civ. Eng. 2013, 27, 635–644. [Google Scholar] [CrossRef]
- Fang, W.; Zhong, B.; Zhao, N.; Love, P.E.D.; Luo, H.; Xue, J.; Xu, S. A deep lea rning-based approach for mitigating falls from height with computer vision: Convolutional neural network. Adv. Eng. Inform. 2019, 39, 170–177. [Google Scholar] [CrossRef]
- Kong, T.; Fang, W.; Love, E.D.; Luo, H.; Xu, S.; Li, H. Computer vision and long short-term memory: Learning to predict unsafe behaviour in construction. Adv. Eng. Inform. 2021, 50, 101400. [Google Scholar] [CrossRef]
- Jung, H.; Koo, B.; Kim, J.; Kim, T.; Nam, Y.; Kim, Y. Enhanced algorithm for the detection of preimpact fall for wearable airbags. Sensors 2020, 20, 1277. [Google Scholar] [CrossRef]
- Ahn, S.; Choi, D.; Kim, J.; Kim, S.; Jeong, Y.; Jo, M.; Kim, Y. Optimization of a pre-impact fall detection algorithm and development of hip protection airbag system. Sens. Mater. 2018, 30, 1743–1752. [Google Scholar] [CrossRef]
- Koo, B.; Kim, J.; Nam, Y.; Kim, Y. The Performance of Post-Fall Detection Using the Cross-Dataset: Feature Vectors, Classifiers and Processing Conditions. Sensors 2021, 21, 4638. [Google Scholar] [CrossRef] [PubMed]
- Dogan, O.; Akcamete, A. Detecting falls-from-height with wearable sensors and reducing consequences of occupational fall accidents leveraging IoT. In Advances in Informatics and Computing in Civil and Construction Engineering; Springer: Cham, Switzerland, 2019; pp. 207–214. [Google Scholar] [CrossRef]
- Kim, Y.; Jung, H.; Koo, B.; Kim, J.; Kim, T.; Nam, Y. Detection of pre-impact falls from heights using an inertial measurement unit sensor. Sensors 2020, 20, 5388. [Google Scholar] [CrossRef] [PubMed]
- Alizo, G.; Sciarretta, J.D.; Gibson, S.; Muertos, K.; Romano, A.; Davis, J.; Pepe, A. Fall from heights: Does height really matter? Eur. J. Trauma Emerg. Surg. 2018, 44, 411–416. [Google Scholar] [CrossRef] [PubMed]
- Arena, S.; Davis, J.; Grant, J.; Madigan, M. Tripping elicits earlier and larger deviations in linear head acceleration compared to slipping. PLoS ONE 2016, 11, e0165670. [Google Scholar] [CrossRef]
- Hajiaghamemar, M.; Seidi, M.; Ferguson, J.R.; Caccese, V. Measurement of Head Impact Due to Standing Fall in Adults Using Anthropomorphic Test Dummies. Ann. Biomed. Eng. 2015, 43, 2143–2152. [Google Scholar] [CrossRef]
- Kim, T.; Choi, A.; Heo, H.; Kim, H.; Mun, J. Acceleration Magnitude at Impact Following Loss of Balance Can Be Estimated Using Deep Learning Model. Sensors 2020, 20, 6126. [Google Scholar] [CrossRef]
- Koo, B.; Kim, J.; Nam, Y.; Sung, D.; Shim, J.; Yang, S.; Kim, Y. Multi-class Classification of Industrial Fall from Height based on Machine Learning Algorithm. Trans. Korean Soc. Mech. Eng. A 2022, 46, 259–265. [Google Scholar] [CrossRef]
- Occupational Safety and Health Adminstraion, U.S. Department of Labor, Directorate of Technical Support and Emergency Management, OSHA Technical Manual (OTM)—Section V: Chapter 4. Available online: https://www.osha.gov/otm/section-5-construction-operations/chapter-4#fall_arrest (accessed on 2 August 2022).
- Albers, J.T.; Estill, C.F. Simple Solutions: Ergonomics for Construction Workers; National Institute for Occupational Safety and Health: Washington, DC, USA, 2007. [Google Scholar]
- Huang, S.; Tang, J.; Dai, J.; Wang, Y. Signal Status Recognition Based on 1DCNN and Its Feature Extraction Mechanism Analysis. Sensors 2019, 19, 2018. [Google Scholar] [CrossRef]
- Trigueros, D.S.; Meng, L.; Hartnett, M. Enhancing convolutional neural networks for face recognition with occlusion maps and batch triplet loss. Image Vis. Comput. 2018, 79, 99–108. [Google Scholar] [CrossRef]
- Hochreiter, S.; Schmidhuber, J. Long short-term memory. Neural Comput. 1997, 9, 1735–1780. [Google Scholar] [CrossRef] [PubMed]
- Yu, X.; Qiu, H.; Xiong, S. A novel hybrid deep neural network to predict pre-impact fall for older people based on wearable inertial sensors. Front. Bioeng. Biotechnol. 2020, 8, 63. [Google Scholar] [CrossRef] [PubMed]
- Lu, W.; Li, J.; Li, Y.; Sun, A.; Wang, J. A CNN-LSTM-based model to forecast stock prices. Complexity 2020, 2020, 6622927. [Google Scholar] [CrossRef]
- Gu, J.; Wang, Z.; Kuen, J.; Ma, L.; Shahroudy, A.; Shuai, B.; Liu, T.; Wang, X.; Wang, G.; Cai, J.; et al. Recent advances in convolutional neural networks. Pattern Recognit. 2018, 77, 354–377. [Google Scholar] [CrossRef]


| Non-Fall (NF) | NF01 | Sitting quickly and getting up | NF09 | Moving up and down in an elevator |
| NF02 | Sitting and getting up comfortably | NF10 | Walking on a beam | |
| NF03 | Going up and down the stairs | NF11 | Walking on a beam with luggage | |
| NF04 | Going up and down a ladder | NF12 | Shoveling | |
| NF05 | Working with a pickaxe | NF13 | Stretching | |
| NF06 | Lifting (front) | NF14 | Climbing up and down a scaffold | |
| NF07 | Lifting (back) | NF15 | 0.7 m jump | |
| NF08 | Lifting (side) | |||
| Low-Hazard Fall (LF) | LF01 | Forward trip | LF04 | Backward slip |
| LF02 | Lateral trip | LF05 | Fainting | |
| LF03 | Forward slip | |||
| High-Hazard FFH (HF) | HF01 | 2 m Vertical FFH | HF04 | 2 m Forward FFH |
| HF02 | 3 m Vertical FFH | HF05 | 3 m Forward FFH | |
| HF03 | 0.7 m Forward FFH |
| No. | Feature | No. | Feature |
|---|---|---|---|
| 1 | x-axis acceleration | 5 | : x-axis angular velocity |
| 2 | y-axis acceleration | 6 | : y-axis angular velocity |
| 3 | z-axis acceleration | 7 | z-axis angular velocity |
| 4 | : Sum vector magnitude of acceleration | 8 | : Sum vector magnitude of angular velocity |
| Model Name | MAE (Epoch) | MSE (Epoch) |
|---|---|---|
| 1D-CNN | 1.46 g (183) | 6.02 g2 (151) |
| 2D-CNN | 1.61 g (130) | 9.51 g2 (187) |
| LSTM | 2.07 g (18) | 12.20 g2 (13) |
| Conv-LSTM | 1.36 g (25) | 5.69 g2 (49) |
| Model | ||||||||
|---|---|---|---|---|---|---|---|---|
| 1D-CNN | 2D-CNN | LSTM | Conv-LSTM | |||||
| Error Function | MAE | MSE | MAE | MSE | MAE | MSE | MAE | MSE |
| Accuracy (%) | 92.0 | 93.9 | 90.7 | 96.5 | 94.4 | 92.0 | 97.6 | 92.3 |
| Sensitivity (%) | 83.3 | 87.5 | 4.2 | 79.2 | 45.8 | 50.0 | 62.5 | 95.8 |
| Specificity (%) | 92.6 | 94.3 | 96.6 | 97.7 | 97.7 | 94.9 | 100 | 92.0 |
Publisher’s Note: MDPI stays neutral with regard to jurisdictional claims in published maps and institutional affiliations. |
© 2022 by the authors. Licensee MDPI, Basel, Switzerland. This article is an open access article distributed under the terms and conditions of the Creative Commons Attribution (CC BY) license (https://creativecommons.org/licenses/by/4.0/).
Share and Cite
Lee, S.; Koo, B.; Yang, S.; Kim, J.; Nam, Y.; Kim, Y. Fall-from-Height Detection Using Deep Learning Based on IMU Sensor Data for Accident Prevention at Construction Sites. Sensors 2022, 22, 6107. https://doi.org/10.3390/s22166107
Lee S, Koo B, Yang S, Kim J, Nam Y, Kim Y. Fall-from-Height Detection Using Deep Learning Based on IMU Sensor Data for Accident Prevention at Construction Sites. Sensors. 2022; 22(16):6107. https://doi.org/10.3390/s22166107
Chicago/Turabian StyleLee, Seunghee, Bummo Koo, Sumin Yang, Jongman Kim, Yejin Nam, and Youngho Kim. 2022. "Fall-from-Height Detection Using Deep Learning Based on IMU Sensor Data for Accident Prevention at Construction Sites" Sensors 22, no. 16: 6107. https://doi.org/10.3390/s22166107
APA StyleLee, S., Koo, B., Yang, S., Kim, J., Nam, Y., & Kim, Y. (2022). Fall-from-Height Detection Using Deep Learning Based on IMU Sensor Data for Accident Prevention at Construction Sites. Sensors, 22(16), 6107. https://doi.org/10.3390/s22166107